
We acknowledge and pay our respects to the Kaurna people, the traditional custodians whose ancestral lands we gather on. We acknowledge the deep feelings of attachment and relationship of the Kaurna people to country, and we respect and value their past, present and ongoing connections to the land and cultural beliefs.


Community Engagement and Submissions Process
The City of Playford recognises the role of community engagement and public consultation to support decision making and ensuring residents and other stakeholders can participate in the decision-making process. The Draft Annual Business Plan (Draft Plan) and Budget 2024/25 provides an opportunity for Council to articulate its plans and priorities for the next 12 months.
The community is invited to provide feedback on the Draft Plan during a community engagement period. The community engagement period is undertaken in accordance with Sections 122 and 123 of the Local Government Act 1999 (the Act), which states that Council must adopt a process or processes to ensure that members of the public are given a reasonable opportunity to be involved in the development and review of its strategic management plans. Specifically, the Act requires Council to make its Annual Business Plan and Budget available for public consultation for a period no less than 21 days.
In accordance with the above, and the City of Playford Community Engagement Policy (which states that any legislatively required consultation run for 28 days), the Draft 2024/25 Annual Business Plan and Budget, Long Term Financial Plan and Strategic Asset Management Plan will be released for a public consultation period from Wednesday 1 May to Tuesday 28 May 2024.
During this time, the following activities will be undertaken:
• Advertisements in local newspapers advising the community that the Draft Plans are available for consultation
• Draft Plans and Feedback Forms available at Customer Care locations
• Draft Plans and online Feedback Forms available on Council’s website
• Public Hearing at the 28 May 2024 Ordinary Council Meeting
Further information can be found via our online Engagement Hub at playford.engagementhub.com.au
5
Executive Summary
Each year Council communicates the services and projects it will deliver to the community in its Annual Business Plan and Budget, Long Term Financial Plan and Strategic Asset Management Plan
This plan marks the final year of delivery on our Strategic Plan 2020-2024, Community and City Foundations. The Annual Business Plan and Budget for 2024/25 has been developed in line with the community themes outlined in our Strategic Plan. We will continue to deliver the things that make a difference to our resident’s everyday lives and the services and programs they know and value.
That includes services that contribute to a happy and healthy community and help keep our city looking nice and operating safely. We are also committed to focusing on maximising opportunities for external funding and finishing what we have started, whilst always meeting our legislative requirements and legal obligations
We are one of South Australia’s fastest growing council areas, and we can now expect on average 10 additional people a day to call Playford home until 2046. That’s ten more people each day who are out on our roads, using our parks and accessing our services.
We have a responsibility to balance the needs of existing residents while laying the foundations for future generations, by providing the parks, sporting facilities, stormwater infrastructure, footpaths, and services our growing community will need.
This year’s Annual Business Plan outlines that Council will continue to invest over $111M in supporting the delivery of existing services. The City of Playford delivers 25 services to our community and further details can be found from page 22 onwards.
Council will also invest almost $29M in renewing or replacing existing assets such as kerbs, footpaths, roads, playspaces and sporting facilities.
We will invest in new projects and services to support the needs of our growing and diverse community. New projects for 2024/25 include:
• Construction of Stage 2B of the Broadacres Drive Outfall Drain
• Construction of changerooms and car park at Dwight Reserve
• Construction of Munno Para Sportsground Stage 1
• Delivery of over 600m of New Footpaths
• Installation of playground communication boards at newly constructed, refurbished or currently under construction playspaces
• Stormwater Minor Projects
• Open Space Minor Projects
• Sport and Recreation Minor Projects
• Traffic Management Minor Projects.
See Appendix 1, Proposed Capital Works 2024/25, for further details of these projects
As part of the joint delivery of Council’s growth area infrastructure obligations (Infrastructure Deeds), detailed design will occur for Frisby Road and Fradd Road, Angle Vale. The Department of
6
Infrastructure and Transport (DIT) are responsible for the progression of detailed design for a portion of the Penfield Road upgrade.
The continuation of the green bin rollout, introduced in 2023/24, will provide a free opt-in Food Organics Green Organics (FOGO) bin to residents who currently do not have one. This supports community and Council efforts to increase our environmental sustainability by reducing the amount of material going to landfill.
An additional service increase to the Community Organisation Support Framework will ensure access and equity to community groups throughout Playford, including community development and event grants, programs and events sponsorship, access to building spaces and financial support.
As a local government, we are facing significant cost and inflationary pressures again this year. Many of these cost pressures are outside of our control, such as inflation, electricity and insurance premium increases as well as legislated superannuation obligations. We are also experiencing increases in contracted prices and license fees above inflation for services provided in some sectors, reflecting current market conditions. This means that the cost of providing the same services in 2024/25 will be higher than last year. We have worked diligently to reduce the impact of these cost and inflationary pressures by only factoring in inflationary pressures where absolutely necessary. This helps minimise the impact for our ratepayers.
The regular revaluation of our existing assets has also resulted in increased depreciation costs. The revaluation aims to provide a more accurate representation of an asset’s value by taking into account changes in market conditions, supply and demand, technological advancements, or any other factors that may impact its worth
This Annual Business Plan provides details of how we will fund the inflationary costs for our existing services and the costs associated with new projects and services. These additional costs to our budget have been partially offset with $412k of Continuous Improvement savings from Council’s existing budget.
Financial sustainability, in line with Council’s Finance Strategy, has been a focus in the development of this plan, ensuring Council has the means to fund the services and projects it provides to the community now and into the future.
The Annual Business Plan proposes a 6.5% increase in rate revenue for 2024/25. This increase funds new projects and services that the community has asked for, while covering rising costs due to inflation and meeting budget goals that support long-term financial sustainability We will continue to deliver every day on the immediate needs of our community, mindful that the decisions we make today will shape our city and community over the next five, ten and twenty-years
7
The City of Playford is a diverse city enriched by resilient communities living in new and established suburbs as well as semi-rural townships. Residential development is occurring at a rapid pace, with Playford the centre of growth in South Australia.


Our Strategic Plan sits at the centre of our Strategic Planning Framework. It outlines Council’s four-year goals for the city and provides direction for decision-making and how we prioritise the allocation of resources.

The three phases of our Strategic Planning Framework:


Our high-level plans guide our investment. The Playford Community Vision 2043* was developed in 2013 based on extensive community engagement and reflects the longer-term aspirations of the community, organised under the goals of Prosperity, Liveability and Happiness.
Our City-wide Strategies focus on a particular area such as open space or cycling and walking and help prioritise projects across the city. Our Masterplans outline our vision across a particular precinct or project area such as the Lyell McEwin Health Precinct, Playford Health and Wellbeing Precinct and the Virginia Township.

We continue to invest in our growing community by undertaking new projects and delivering new services. The Long Term Financial Plan* ensures Council can deliver services, maintain assets and achieve its strategic objectives in a financially sustainable manner. The Annual Business Plan and Budget* is the 12-month plan to deliver the Strategic Plan and secure funding.

We are constantly reviewing our investment. The Strategic Asset Management Plan* ensures effective and comprehensive management of our asset portfolios. We complete a range of different analyses and planning activities such as the Public Health Plan and Disability Access and Inclusion Plan that continue to guide our investment in our existing services.
*These plans meet our obligations under Section 122 of the Local Government Act 1999, which states that a council must develop and adopt plans for the management of its area, to be called collectively the strategic management plans.
13

The Annual Business Plan and Budget focuses on the services and projects to be delivered in the next 12 months, while ensuring the decisions we make this year do not undermine our long-term financial sustainability.
Capital and Operating Budgets
Each year Council develops a capital and an operating budget.
• The capital budget is Council’s expenditure on projects that will create or renew long-term assets.
• The operating budget incorporates all costs associated with delivering our existing services, including maintaining our community assets. The budget is adjusted for inflation and cost pressures for existing services, and for the introduction of new projects and services.
• Our four-year planning horizon ensures the decisions we make within a specific budget year do not undermine our long-term strategic direction and financial sustainability
Capital

Note that many of our projects are multi-year projects, and it is currently estimated that $31M of the above capital costs will be delivered in subsequent financial years
Operating budget summary 2024/25
15
2024/25 Capital Budget $M Asset Management Plans – Capital Renewal 28.9 Multi-year projects commenced in prior years 33.1 New capital projects 2024/25 33.1 Council expenditure – Sub Total 95.1 Donated Assets 39.5 Increase in Council capital assets – Total 134.6
budget summary
Operating Budget $M Operating Income 150.45 Operating Expenditure 143.43 Operating Surplus/(Deficit) 7.02
How we develop the budget


BASE BUDGET
Council’s existing services make up most of our base budget. Service Standards articulate the service Council delivers and the benefits the community can expect to receive.
COST PRESSURES
Our costs may be impacted by increases above inflation due to external pressures such as the increasing cost of electricity and insurance, as well as depreciation
INFLATIONARY ADJUSTMENTS
Inflation relates to increases in the cost of doing business To ensure the budget is sufficient to cover inflationary pressures we reference the consumer price index (CPI) and Council’s Enterprise Agreement on wages.
16
NEW PROJECTS AND SERVICES
Council’s Strategic Plan 2020–24 outlines the decision-making filters and community themes we use to decide on any new projects or services to be introduced to the community each year


This year’s Annual Business Plan invests in new projects and services to support the needs of our growing and diverse community. We will continue to balance the needs of existing residents while laying the foundations for future generations, by providing the parks, sporting facilities, stormwater infrastructure, footpaths, and services our growing community will need.
LONG TERM FINANCIAL PLAN (LTFP)
The LTFP provides information on Council’s long-term financial sustainability. It is the key tool used by Council to assess the long-term financial implications of decisions.
UPDATE ASSUMPTIONS
Each year Council reviews the assumptions used to form the budget. These include interest rates, asset disposals, developer contributions and growth.
PROPOSED BUDGET 2024/25
After considering the above, Council can see how much budget it needs to fund services and any new projects/services for the coming year.
INFORMS RATE RISE
Rates are a financially sustainable funding pathway to pay for Council services Council uses the proposed budget to inform any required rate rise, and this ensures that we only rate the community for what is needed.
17
2024/25 BUDGET
As a result of the budget process, Council intends to fund the following changes to the 2024/25 budget:
Council’s commitment to financial sustainability
The City of Playford’s Finance Strategy outlines our commitment to financial sustainability. Developed in 2017/18, the strategy aims to achieve long-term financial sustainability while enabling Council to deliver planned services, responsibly manage debt and promote the growth of the city, both now and into the future.
When considering our financial sustainability, we reference our operating and structural position The difference between these terms is explained below:
The operating position shows Council’s income compared to the operating costs required to deliver services to the community Where income exceeds expenses, Council would be in an operating surplus and where income is less than expenses, Council would be in an operating deficit.
The structural position is a reflection of our operating position, without the inclusion of once-off grants and developer contributions. Grants and developer contributions are committed to be spent in future years. They do not form part of our ongoing sustainable base budget for delivering day-to-day services in any given financial year.
Maintaining operating and structural surplus positions over the long-term ensures Council can meet current and long-term commitments and be financially sustainable.
To ensure Council remains financially sustainable, we monitor our budgets and our performance against an operating surplus ratio and a structural surplus ratio Council has endorsed a target range of 1% to 10% for the operating surplus and 1% to 4% for the structural surplus
18
$’000 Rate Rise Equivalent % Base Budget 735 0.73 Cost Pressures 1,822 1.82 Inflationary Pressures 2,547 2.54 New Services/Assets 2,177 2.18 New Services/Assets – Growth 806 0.81 Growth Existing Services 1,918 1.92 Total Additional Costs 10,005 10.00 Commitment to Financial Sustainability 198 0.20 Total to be funded 10,203 10.20
Budget Funding Pathways
This Annual Business Plan details how we will fund the inflationary costs for our existing services, new projects and services and meet our commitment to financial sustainability The budget increase will be funded as follows:

Continuous Improvement Savings
Council’s focus on continuous improvement has resulted in savings of over $17.9M since 2011, including $0.4M as part of 2024/24 budget process
The savings have either been:
• allocated to services to reduce the rate burden of providing new services and assets to the community or
• used to ensure that Council is operating within its means and not using debt to fund its operations
Growth Revenue
Council receives new rate revenue from new dwellings and commercial properties This is used to fund the additional services required in a growing community.
Rate Rise
Council’s primary revenue stream comes from raising and collecting rate revenue Council will need to increase rates to fund the remainder of the budget unable to be funded by Continuous Improvement savings and Growth revenue as outlined above. As a result, there will be a 6.5% increase in rate revenue for 2024/25. The increase funds new projects and services that the community has asked for while covering rising costs due to inflation and meeting budget goals that support long-term financial sustainability.
19

The City of Playford provides a wide range of services, programs and infrastructure to meet the needs of our community and to fulfil our legislative requirements under the Local Government Act (1999).
What makes up our 2024/25 budget


Delivering Existing Services in 2024/25
Community Facilities, Programs and Events
Club
Development and Access to Sporting Facilities
We support over 80 sporting clubs with facilities for training and competition, including regional sites such as the Playford Tennis Centre, Aquadome, Playford Bowling Club and Elizabeth Oval. We work with clubs and associations to support effective administration, operations and compliance to optimise utilisation of facilities for the community’s benefit.
Community Development and Health Initiatives
Community development supports knowledge and skills development for individuals and families. Services are delivered at several sites including the Playford Wellbeing Hub, the Healthy Food Co, Marni Waiendi and the Elizabeth Rise Community Centre.
These initiatives support the community in various ways, such as promotion of health and wellbeing practices, providing volunteer opportunities, advocacy and the provision of a range of social and educational activities.
22


Community Inclusion
Council provides education, information and support to assist older and vulnerable people to remain independent and connected within the community. Inclusion programs are run at sites including the Grenville Hub and Playford Wellbeing Hub, as well as outreach programs in One Tree Hill and Virginia. We also support people living with disability through NDIS and Council funded social and capacity building supports. Broader initiatives and projects are also supported by Council’s Disability Access and Inclusion Plan.
Community Venues
We have a range of venues the community can access for events and experiences.
The Shedley Theatre is the northern suburbs’ premier theatre venue, hosting a calendar of highprofile, professional artists, as well as supporting local amateur groups and school events.
The Function Room at the Playford Civic Centre provides a high-quality venue space for use by business and community groups.
The Uley Road Hall, Spruance Hall and Virginia Institute also provide high-quality space for the community to utilise.
The Northern Sound System (NSS) is the state’s leading youth music facility, engaging young people through music and creative industries An extensive range of programs build the capacity of young people, while also offering a live music venue, rehearsal spaces and recording studio.
23
Customer Contact
Our Customer Contact team provides prompt, helpful and accurate information and transactional services to our community. We are the first point of contact for many of our residents, rate payers, businesses and visitors at one of Council’s sites. Your website, email and phone queries are handled by our knowledgeable Customer Service team members who are happy to action requests for service and connect you with the right people across Council.
Event Management
Council delivers a range of community and civic events across the city and, where appropriate, looks to partner to extend the range of events on offer. These events celebrate the community and promote a sense of connection.
24
Library Services
Library Services provide access to information, technology and educational programs, cultural engagement, local history, social interaction, entertainment and leisure for our community. Branches at the Civic Centre and Stretton Centre are supported by the Mobile and Home Library Services.
Volunteer Development
Volunteers extend and enhance the services and programs delivered by Council through sharing their time, energy and skills to benefit the community. Volunteers receive many opportunities to develop new skills and knowledge, connect with others and enjoy a sense of accomplishment.

25
City Maintenance
Parks and Reserves
Council maintains some 785 reserves throughout the city. This includes parks which provide amenities such as welcoming outdoor spaces, accessible play spaces, park furniture and green open space to encourage sporting activities and recreation. Wetlands, buffer reserves and natural areas also provide natural open space for our community to enjoy.
Rapid Response
Council provides a rapid response team to attend to urgent situations and help reduce risk to our community. The primary objective is to make the situation safe, with additional work then referred to other Council services.
Rural Streetscapes
Regular road maintenance is undertaken in our rural areas, with a programmed and proactive approach based on risk. This service enables a safe and connected community for our rural residents.
Sportsfield Maintenance
The maintenance of Council’s many sports fields is important to ensure our community can actively engage and participate in a range of sporting activities on offer across our city.
Stormwater Network
The stormwater network provides for the collection and transportation of stormwater throughout the city. Maintenance of the network reduces the risk of flooding and associated property damage. It also improves the water quality to wetlands and protects against water damage to road infrastructure.

26

Tree Services
Our tree services team plant and maintain trees on community land, which contributes to the look and feel of the city, as well as positively impacting on the health and wellbeing of Playford residents and visitors.
Urban Streetscapes
This service provides safe pedestrian access, a safe and orderly urban road network, and improved appearance of street frontages, contributing to overall city presentation.
Graffiti Operations
The graffiti team provides a quick and timely response to the removal of graffiti from Council assets, leading to a clean and attractive city with a reduction in overall visible graffiti.
27
Waste and Recycling
Kerbside Waste
The kerbside waste management service includes household waste, recycling, green organics and hard waste. Diversion rates away from landfill, through recycling, reduction in contamination rates, and uptake of the green organics service are a focus of this service.
Illegal Dumping
This service manages the collection and disposal of illegally dumped rubbish throughout the city as well as penalises illegal dumping offences.
Public Health, Regulatory and Environment

Environmental Health
This service seeks to protect the community from environmental public health risks by managing statutory responsibilities and promotion of public health, food safety and wastewater standards.
28
Environmental Sustainability
In collaboration with our community, we enhance our local environment with resident engagement initiatives such as plant distribution programs, projects to improve our urban and rural biodiversity and targeted biodiversity management on rural roadsides.
Immunisation
Our immunisation service seeks to minimise the incidence of vaccine-preventable diseases. Services undertaken include early childhood immunisation, secondary school programs, New Arrival Refugee Immunisation (NARI) program and public and business programs.
Regulatory Services
We provide comprehensive regulatory services including animal management, parking compliance, fire prevention, and compliance with by-laws to promote community resilience and improve the safety, appearance and accessibility of our city.
Development Services
This service facilitates safe and desired city development by coordinating and managing growth, assessing development applications, providing advice and ensuring that development is constructed in accordance with the relevant legislation.
Local Business Support
Business Support and Industry Development
This service fosters business growth and supports and facilitates the creation of local jobs. Our modern co-working facility at the Stretton Centre provides cost-effective office space and one-toone business support. Support is also provided at an industry level through specific projects, advocacy and connection, as well as through the Virginia Horticulture Centre.

29
NB The cost of service delivery is calculated based on both direct and indirect costs of delivering the services.
Direct costs such as materials, contract fees and salaries that are directly attributable to delivering the service form the base of these service costs. Indirect costs such as corporate overheads and depreciation are spread proportionately across all service areas and are included in the net cost of each service. Costs are also net of any direct revenues in the form of grants, user charges and fees earned during the course of service provision.
30 Service Standard 2024/25 Net Operating Budget $’000 Business Support and Industry Development 1,318 Club Development and Access to Sporting Facilities 819 Community Development 2,611 Community Inclusion 1,722 Community Venues 1,228 Customer Contact 3,553 Development Services 5,624 Environmental Health 1,019 Environmental Sustainability 710 Event Management 1,429 Graffiti Operations 446 Health Initiatives and Healthy Food Co. 661 Illegal Dumping 1,350 Immunisation 211 Kerbside Waste 15,931 Library Services 2,844 Parks and Reserves 10,604 Rapid Response 1,322 Regulatory Services 566 Rural Streetscape 6,055 Sportsfield Maintenance 5,950 Stormwater Network 5,427 Tree Services 4,480 Urban Streetscape 34,865 Volunteer Strategy and Development 202
Strategic Projects
Each year we budget for the planning work that needs to be done to support future projects. This work includes things like developing concept plans, feasibility studies and other investigations for projects that will be delivered in future years. This is part of Council’s long-term approach to planning and is important to ensure projects are not viewed in isolation from year to year.
City Wide Integrated Transport Strategy (CWITS)
Crossing
development of the Strategy and update of Council’s transport priority list
study for the construction of a wildlife refuge for Blakes Crossing Lake
rezoning of land identified in the Plan for Greater Adelaide for employment purposes.
the planning for key precincts in the city, including Elizabeth CBD, Health Precinct and Greater Edinburgh Parks.


Project Name Description Operating Budget $’000
Further
50 Blakes
Wildlife Refuge Feasibility
20 Riverlea District Sportsground (North) Concept planning for social infrastructure 10 Code Amendment(s) Progress the
30 Strategic
Planning Support
40
Land Use
Name
Disability Access & Inclusion Plan (DAIP)
NDIS State of Sector Report
Heaslip Road Streetscape Upgrade
Stormwater Planning
Dauntsey Master Plan
Playford Sports Precinct - Softball
The DAIP is legislatively required to be reviewed every four years and the next review is due in 2024.
Provide an update on the NDIS sector in the north, unpack the recent NDIS review and assist in understanding Council’s role in the NDIS/disability support space in the changing landscape.
Concept planning to inform streetscape uplift opportunities in partnership with required Road Infrastructure Deed works.
Research for levee frameworks across the city, stormwater risk and an approach to the upgrade of Smith Creek as identified in the Stormwater Management Plan
Master planning and co-design process for high priority reserve in Sports Facility Strategy.
Concept planning for clubroom/changeroom upgrades at Ridley Reserve West. This is identified as a priority project in Council’s Sports Facility Strategy.
40
10
40
80
25
25
Northern Adelaide Plains Food Cluster
Partnership arrangement with the Northern Adelaide Pains Food Cluster. This work will underpin the delivery of a suite of activities that will support the growth of the local food industry.
50
32
Description Operating Budget $’000
Project
Existing Assets
Each year, Council spends a large proportion of its budget replacing our existing assets that have either reached the end of their useful life or are no longer able to provide a service to the community at the required standard A summary of the renewal program is included below, and further details on Asset Management Planning can be found in the Strategic Asset Management Plan
Transport
Transport assets such as roads, kerbing, car parks and traffic islands degrade over time due to age, increasing vehicle loads, soil movement, tree roots and drainage problems. Transport assets are regularly inspected and given a condition rating which informs our renewal plans.
Bridges
Bridge assets include road bridges, pedestrian bridges and major culverts. These are formally inspected every four years, supplemented by minor inspections annually to identify required works.
Stormwater
Most stormwater assets are underground, out of sight and have long lifespans. Each year a sample of Council’s underground stormwater pipe network is inspected using CCTV cameras to inform our renewal plans.


Streetscapes
Footpaths fail over time due to age and can also be damaged by soil movement, tree roots and construction traffic. Just like transport assets, footpath assets are regularly inspected and given a condition rating which informs our renewal plans.
Buildings
Building renewals are triggered by inspections, compliance requirements and data such as expected life and maintenance expenditure.
Water Delivery
Water delivery assets are planned for renewal prior to failure as they approach the end of their useful life, as identified by visual inspection and/or measured condition
Parks and Sportsfields
Council manages an extensive number of parks and sportsfields throughout the city. The assets within these spaces – such as irrigation systems, fencing, park furniture, playground equipment and sporting surfaces – are inspected regularly to meet safety standards as well as helping to inform our renewal plans.

34
Fleet, Minor Plant, and Technology & Office
Council’s fleet of vehicles, plant and equipment is critical to ensure our services can be delivered reliably, efficiently, and safely. By renewing these assets proactively, we minimise the chances of physical injury to staff and community members, infrastructure damage and excessive downtime for repairs.
Playford Alive
Playford Alive is one of the biggest urban renewal projects in Australia. As our contribution to this project, Council renews targeted public realm and streetscape assets in coordination with Renewal SA/SA Housing developments that have reached 80% development completion.
NB: The maps and tables in Appendix 1, Proposed Capital Works 2024/25 provide further detail on the specific assets scheduled for renewal across the city in 2024/25
35
Asset Category Budget $’000 Transport (including bridges) 12,097 Stormwater 294 Streetscapes 4,099 Water Delivery 766 Buildings 2,127 Parks and Sportsfields 3,618 Minor Plant 155 Fleet 2,810 Technology and Office 1,622 Playford Alive 1,295 Grand Total 28,883
Infrastructure Projects Continuing from Previous Years
Council has a process to carry over budget from year to year to fund works that are delivered across multiple financial years. The proposed carry-over budget for 2024/25 is $33.1M.
The information below provides a summary of the work that is forecast to continue into 2024/25.
AMP Angle Vale Bridge
Concept designs are currently being prepared for options to replace the Angle Vale footbridge. As a shared asset between City of Playford and Light Regional Council, both councils will need to agree on the preferred option moving forward.
Argana Park – Car Park and Change Facilities
Stages 1, 2a and 2b of the Masterplan will deliver increased parking around the AFL Oval and Clubrooms. Additional car parks are also proposed between the AFL Oval and Cricket Oval, and improved parking along Mavros Road. Additionally, traffic visiting the site will benefit from widened two-way internal roads and signage and an extended and lit path network connecting the main facilities and car parking.
Stage 3a of the Masterplan will result in a new shared change room facility to cater for increasing participation at the Elizabeth Netball Association and the Elizabeth Downs Soccer Club.
This project is part funded by Council’s Open Space Fund and leverages a $1.46M State Government grant.


Kalara Reserve Upgrade
The upgrade of Kalara Reserve is identified in the Sports Facility Strategy as a high priority. This project will deliver on Stage 1 of the Master Plan which includes a new consolidated clubroom and changeroom building and sealing the existing carpark. The building will be centrally located on the reserve to optimise the service and functionality of the site and enhance the spectator amenities.
This project is part funded by a $1M State Government grant and a $1.4M Federal Government grant
McGilp Recreation Park Upgrade
Redevelopment of the reserve will include an oval extension to accommodate a senior pitch, stormwater improvements, new changerooms, a new BMX track and upgrades to car parking.
This project is part funded by Council’s Open Space Fund and leverages a $1.5M State Government grant
Park Road Drainage System
The Park Road Drainage System is identified in the regional Stormwater Management Plan (SMP) for the Smith Creek catchment. Construction of the drainage system will protect housing in Virginia from flooding and substantially reduce flood damages for horticultural land in the area.
This project is part funded by a $2.6M State Government grant
Virgo Street Reserve and Barrow Street Reserve
Upgrades
Upgrades to Virgo Street Reserve in Elizabeth South and Barrow Street Reserve in Elizabeth Vale will see these vacant sites upgraded to local parks, providing improved access to quality open spaces for the community and contributing to the renewal of these older Elizabeth suburbs
This project is funded through an existing joint fund between Council and the SA Housing Authority.
Stebonheath Road/Dalkeith Road Roundabout - Blackspot
The upgrade at the intersection of Stebonheath Road / Dalkeith Road will include:
• A new roundabout, designed to Austroads and relevant Australian Standards
• Improved road safety by reducing approach speeds and establishing clear give-way priority.
• Installation of footpath, pram ramps, pedestrian refuges, and lighting.
• Utility relocations and lighting upgrades
• New pram ramps and pedestrian refuges on all roundabout approaches, including the future proofing for new footpath links.
This project is fully funded by the Black Spot Program and is a joint project with the Town of Gawler.
37


Mark Oliphant Kiss & Drop
Construction of the kiss and drop at Mark Oliphant College will provide improved safety and convenience for students and parents. It will also help to reduce congestion during school drop-off and pick-up times. Additional parking will support use of the future sports facility.
This project leverages a $2.5M State Government grant.
McEvoy Road Basin and Culvert
Detailed design for McEvoy Road basin and associated drainage infrastructure is required as part of the need to move flood and stormwater flows to the east where they will be released under the Port Wakefield Highway.
This project forms part of the Virginia Interim Stormwater Infrastructure Deed
38
Rising Costs
Like much of the community, local government is facing rising costs and inflationary pressures in 2024/25. This means it will cost us more to deliver the services we offer to the community.
Civic Events
Increase in costs related to the delivery of existing events such as Civic Events including Carols, Australia Day, Anzac Day, Citizenship Ceremony and General Events, reflecting inflation and additional costs being passed on from suppliers.
The impact for 2024/25 is $98k
Depreciation
In 2023/24, Council undertook its annual revaluation of its existing assets. Annual revaluations are a legislative requirement, with external independent review also required every five years (maximum) for each asset class
The key underlying principle aims to provide a more accurate representation of an asset’s value by taking into account changes in market conditions, supply and demand, technological advancements, or any other factors that may impact its worth
Continued cost pressures in the construction sector, combined with high inflation, which is linked to key infrastructure contracts has resulted in higher than expected market prices which has a flow on impact to asset valuations and depreciation
The impact for 2024/25 is $796k


Electricity
The electricity market saw sharp increases during 2022/23, with regulators predicting further pressure to continue into 2023/24.
The local government sector electricity contract expired on 31 December 2022 and the sector experienced an uplift in electricity costs from 1 January 2023. Given the uncertainty in the market around that time the local government sector elected to only lock in short-term contracts and reapproach the market from April 2023 for longer term pricing to apply from 1 July 2023. For the 2023/24 budget an estimate of the current electricity cost pressure was incorporated
With a new contract now in place the actual impact is known, and this has been factored into the 2024/25 budget. Council will continue to monitor a broad range of options to minimise its exposure to electricity pricing.
The impact for 2024/25 is $275k
Maintenance and Contractors
Increase in contracted prices and licence fees above inflation for services provided in some sectors Council continues to monitor and where possible negotiate better future pricing.
The impact for 2024/25 is $134k
Insurance Premiums
Increase to the City of Playford insurance premiums over inflation is caused by rising claims on a nation-wide basis and increased asset insurance values.
The impact for 2024/25 is $317k.
Superannuation Guarantee Charge
From 1 July 2024, the prescribed Superannuation Guarantee rate has been legislated to increase to 11.5% from 11%.
The impact for 2024/25 is $202k.
40
New Projects/Services for 2024/25
New projects/services have been identified using the decision-making filters and community themes outlined in Council’s Strategic Plan 2020-24 - Community & City Foundations The new projects for 2024/25 as identified below align with the Strategic Plan and support the needs of our growing and diverse community. See Appendix 1 for a list of locations and maps indicating where work will be undertaken.
New Projects
Footpath Widening – AMP Supplementary
This project will widen existing footpaths on collector roads that are due for renewal from the standard 1.5m to 1.8m where they have proximity to amenity, bus routes or open space.
Sections of the following footpaths have been identified for widening in 2024/25:
• Adams Road, Craigmore
• Uley Road, Craigmore
• Yorktown Road, Elizabeth East
• Goodman Road, Elizabeth South
• Warooka Crescent, Smithfield
Shared Use Path Widening – AMP Supplementary
This project will widen existing footpaths that are due for renewal from their current width to shared use path width. This supports the creation of physically connected communities though walking


and cycling routes identified in Council’s Cycling and Walking Strategy
Sections of the following paths have been identified for widening in 2024/25:
• Greenfields Drive/Hughes Street, Andrews Farm
• Adams Road, Craigmore
• Blair Park Drive, Craigmore
• Midway Road, Elizabeth Downs
• Main North Road, Hillbank
New Footpaths 24-25
This project will provide over 600m of new footpaths to address some of the safety and connectivity issues across the city. Footpaths will be constructed on Midway Road, Elizabeth Downs and Homestead Drive, Hillbank.
DDA Streetscape Infrastructure 24-25
Non-compliant pram ramp infrastructure (based on the Disability Discrimination Act, DDA) will be upgraded across areas of the city where there is a high percentage of the community that reported the need for assistance, specifically targeting areas that are not forecast to be renewed in the near future.
The proposed locations for 2024/25 include Main North Road at John Rice intersection as well as the top 30 ramps selected from the list of non-compliant and non-existent ramps in those areas where the community need assistance in their daily lives due to disability.
Stormwater Minor Projects 24-25
This project will deliver design and construction of stormwater solutions to resolve nuisance flooding and ponding issues. The locations identified for 2024/25 are:
• Cooper Place, Angle Vale
• Emperor Way, Munno Para
• Hope Street, Smithfield
Sport and Recreation Minor Projects 24-25
These minor projects address storage provisions, accessibility and safety concerns for clubs, organised groups and informal community users of infrastructure and assets for sport and recreation pursuits. Detailed design and construction of the following projects is identified for 2024/25:
• Dauntsey Reserve, Elizabeth North – shed
• Ridley Reserve West, Elizabeth South – shed, paving and dugout
• Uley Reserve, Elizabeth Downs – accessible ramp
42

Dwight Reserve – Changerooms and Car Park
Construction of changerooms at Dwight Reserve will replace the current changerooms that are no longer fit for purpose. A new car park will alleviate traffic and pedestrian movement issues experienced by the Eastern Park Football & Cricket Club patrons. The car park will also leverage off the Department of Infrastructure and Transport’s (DIT) upgrade of the Yorktown Road and Adams Road intersection, creating a new entry to the Dwight Reserve Sportsground.
This project is part funded by a $0.5M State Government grant.
Munno Para Sportsground Stage 1
Munno Para Sportsground is identified as a priority growth area project in Council’s Sports Facility Strategy The facility is proposed to be delivered in three stages and construction of Stage 1 will include the following:
• Main pitch
• Clubroom and changeroom
• Parking (inclusive of the kiss and drop)
• Multi-purpose soccer pitch
The multi-purpose soccer pitch forms part of an expanded scope of Stage 1 and has been included to take advantage of an opportunity to leverage external grant funding.
43
Riverlea District Sportsground (North)
Council is undertaking the planning work for a community centre and district level sports facility at Riverlea in line with Council’s Sport’s Facility Strategy and Social Plan for Services and Infrastructure
Traffic Management Minor Projects 24-25
This project aims to improve road, pedestrian, and traffic safety within the city through the delivery of traffic calming devices and a pedestrian refuge adjoining Playford International College.
Projects identified for 2024/25 are:
• Anderson Walk/Coventry Road Intersection, Smithfield Plains – installation of energy absorbing bollards at the intersection to reduce the risk of poor driver behaviour following the upgrade to this intersection in 2022.
• King Road/Penfield Road Intersection, Virginia – trial use of rumble strips
• Goodman Road, Elizabeth South – installation of a pedestrian refuge island that will provide safe access for Playford International College students crossing Goodman Road, in 2 stages.
• Mavros Road, Elizabeth East – detailed design for a road cushion with a strip of concrete median in between to encourage safer speeds and slow traffic down.
Health Precinct Super Stop
The project will deliver detailed design for the bus super stop on Haydown Road, Elizabeth Vale to prepare for future construction and the removal of the existing bus shelter on the NorthWest Healthcare site.
Missing Kerbs – AMP Supplementary
This project will deliver design and construction of new kerb and stormwater assets, in conjunction with road renewal works on Fradd East Road, Munno Para West and Willison Road, Hillbank
Open Space Minor Projects 24-25
Minor improvements to several of Council’s reserves will be undertaken to complement existing facilities. Projects identified for 2024/25 are:
• Breamore Street Reserve, Elizabeth North – 1 x BBQ, 2 x pram ramps and tree planting
• Burgate Street Reserve, Elizabeth Grove – 3 x solar lights
• Ridley Reserve, Elizabeth – 1 x doggie bowl to existing drink fountain
• West Parkway Reserve, Andrews Farm – 1 x BBQ
• Riesling Crescent/Coonawarra Avenue Reserve – 2 x solar lights
• Walkway between Orange Parade and Curtis Road – 1 x public light
• Fremont Park, Elizabeth Park – 1 x drinking fountain
• Blakes Oval, Blakeview – partial fencing along Main Terrace, near to basketball key
• Various locations – 10 x playground communication boards
These projects are funded by Council’s Open Space Fund.
44
Sandford Reserve Upgrade – AMP Supplementary
Detailed design and construction of the reserve will include the following items:
• Removal of existing playspace (funded via renewal)
• Tree planting with dripper system (funded via renewal)
• Mulching
• Bench seat
• Path
This project is funded by Council’s Open Space Fund.
Gloaming Reserve Upgrade – AMP Supplementary
Detailed design and construction of the reserve will include the following items:
• New playspace (funded via renewal)
• Irrigated turf (funded via renewal)
• Sheltered picnic seating
• Retention of trees and planting of new trees
• Sealed path
• Pram ramp
• Reserve sign (funded via renewal)
• Solar light
• Bin
This project is funded by Council’s Open Space Fund.
Don Hardy Reserve (O’Brien Street) Upgrade – AMP Supplementary
Detailed design and construction of the reserve will include the following items:
• New playspace (funded via renewal)
• Irrigated turf (funded via renewal)
• Retention of trees and new tree planting
• Sealed path
• Sheltered picnic seating
• Bin
• Reserve sign (funded via renewal)
• Pram ramp
• Solar light
This project is funded by Council’s Open Space Fund.
Playground Communication Boards
This project will install playground communication boards at any newly constructed, refurbished or currently under construction play spaces. The following locations have been identified for 2024/25:
• Don Hardy Reserve (O’Brien Street), Davoren Park
• Gould Street Reserve, Elizabeth Park
• Gloaming Reserve, Hillbank
45
• Pete Smith Reserve, Davoren Park
• Peerless Road Reserve, Munno Para West
• Dwight Reserve North, Elizabeth Downs
• Virgo Street Reserve, Elizabeth South
• Barrow Street Reserve, Elizabeth Vale
• Institute Park, Virginia
• Mofflin Reserve, Elizabeth Vale
Buildings Minor Projects 24-25
Throughout the year council receives sporadic, low value new capital improvement requests from various sporting and community groups. This budget is allocated to facilitate fulfillment of these requests within the current budget period, ensuring that service delivery remains unaffected.
Key System Upgrade
This project is the continuation of the roll-out of the master key system replacement across all Council assets. A digital key and padlock system will be implemented, which offers greater flexibility, and is designed to replace traditional master key systems.
Solar Projects
This project is part of ongoing efforts to undertake solar energy projects on Council owned and operated buildings, to reduce climate emissions and operational costs.
The following solar panel installations have been identified for 2024/25:
• Virginia Horticulture Centre, Virginia
• The Precinct, Smithfield Plains
• Uley Road Hall, Elizabeth Downs
• Windsor Car Park, Elizabeth
• Shedley Theatre, Elizabeth

46

Infrastructure Deeds
Infrastructure Deeds are legal agreements between landowners, Council and the State Government covering social, transport and stormwater infrastructure in the Playford Growth Areas. They spread the cost of infrastructure more evenly among interested parties
Deeds are executed when land developments achieve certain sales numbers, or when population levels reach a specific level. When these triggers are met, parties involved in the deeds need to fulfil their obligations to fund or construct infrastructure. In 2024/25, Council will contribute to the following projects through its Infrastructure Deed agreements:
AV23 Frisby Road Upgrade – Road and Stormwater
This project will deliver detailed design for the upgrade of Frisby Road within the Angle Vale Township. The design will upgrade the existing two-lane carriageway to an urban standard including kerbing and pavement upgrade. Pits and pipe stormwater systems to service the kerbing upgrade will also be included
This project forms part of the Angle Vale Growth Area Infrastructure Deed.
AV34 Fradd Road Upgrade (Heaslip Road to Frisby Road) – Road and Stormwater
This project will deliver detailed design for the upgrade of Fradd Road within the Angle Vale Township. The design will upgrade the kerbing and footpaths to an urban standard, excluding the reseal of existing pavement. Pits and pipe stormwater systems to service the kerbing upgrade will also be included
This project forms part of the Angle Vale Growth Area Infrastructure Deed.
47
V4 Penfield Road Upgrade – (Old Port Wakefield Road to railway crossing)
This project is to be jointly funded by Council and the Virginia Growth Area Road Infrastructure Deed and will be managed by DIT. This stage will deliver detailed design for the upgrade of Penfield Road between Old Port Wakefield Road and the railway crossing. This will include the retention of two lanes across the railway crossing, a line marked central median and bicycle lanes, kerbing to either side and footpaths.
This project forms part of the Virginia Growth Area Infrastructure Deed.
Broadacres Drive Outfall Drain Stage 2B
This project will deliver Stage 2B of the regional outfall drain with construction of approximately 2.3km of 1800mm diameter concrete pipe along Broadacres Drive, Penfield Gardens. The Broadacres Drive outfall drain provides the regional stormwater drainage solution for the Angle Vale (South) Growth Area, including capturing stormwater from areas of the existing Angle Vale Township. With in-kind works planned and already completed by developers, completion of Stage 2B will see the completion of the entire Broadacres Drive outfall drain.
This project forms part of the Angle Vale Growth Area Infrastructure Deed.
New Services
Green Bin Rollout

The green bin rollout will continue from 2023/24 and provide a free opt-in Food Organics Green Organics (FOGO) bin to residents who currently do not have one. This supports community and Council efforts to increase our environmental sustainability by reducing the amount of material
48
going to landfill. This is year two of a three-year program The green bin, inclusive of kitchen caddy and roll of compostable bags, will support our community’s ability to undertake food recycling to compost.
Community Organisation Support Framework
An expanded community support program will be provided to ensure access and equity to community groups throughout Playford under the following categories:
• Community Development and Event Grants
• Programs and Events Sponsorship
• Building Spaces
• Financial Support
49

50
Total Capital Budget Capital Tied Funding Operating Grant Funding Reserves Council Debt Funding Contributions Ongoing Operating Investment $’000 $’000 $’000 $’000 $’000 $’000 $’000 AV23 Frisby Road Upgrade - Road 451 - - - 117 334 23 AV23 Frisby Road UpgradeStormwater 201 - - - 201 - 16 AV34 Fradd Road Upgrade (Heaslip Road to Frisby Road) - Road 163 - - - 42 121 8 AV34 Fradd Road Upgrade (Heaslip Road to Frisby Road) - Stormwater 138 - - - 138 - 11 Broadacres Drive Outfall Drain Stage 2B 11,083 - - 2,000 9,083 - 618 Buildings Minor Projects 24-25 40 - - - 40 - 6 Community Organisation Support Framework - - - - -66 DDA Streetscape Infrastructure 2425 325 - - - 325 - 34 Don Hardy Reserve (O’Brien Street) Upgrade - AMP Supplementary 147 - - 147 - - 12 Dwight Reserve - Changerooms and Car Park 2,738 500 - - 2,238 - 255 Footpath Widening - AMP Supplementary 295 - - - 295 - 19 Gloaming Reserve Upgrade - AMP Supplementary 131131 - - 11 Green Bin Rollout 174 - - - 174 - 164 Health Precinct Super Stop 101 - - - 101 - 9 Key System Upgrade 187 - - - 187 - 23 Missing Kerbs - AMP Supplementary 220 - - - 220 - 20 Munno Para Sportsground Stage 1 12,960 2,000 - - 10,960 - 1,395 New Footpaths 24-25 275 - - - 275 - 29 Open Space Minor Projects 24-25 232 - - 232 - - 19 Playground Communication Boards 14 - - 14 - - 1
2024/25 NEW CAPITAL PROJECTS FUNDING PATHWAYS

51 Riverlea District Sportsground (North) 300 - - - 300 - 40 Sandford Reserve Upgrade - AMP Supplementary 43 - - 43 - - 4 Shared Use Path Widening - AMP Supplementary 864 - - - 864 - 91 Solar Projects 237 - - - 237 - 27 Sport and Recreation Minor Projects 24-25 309 - - - 309 - 36 Stormwater Minor Projects 24-25 192 - - 192 - - 6 Traffic Management Minor Projects 24-25 331 - - - 331 - 30 Grand Total 32,151 2,500 - 2,759 26,437 455 2,973
Road
52 2024/25
FUNDING PATHWAY Total Operating Budget Other Funding Growth Other (Once off) $’000 $’000 $’000 $’000 AV23 Frisby Road Upgrade - Road 23 - 23AV23 Frisby Road Upgrade - Stormwater 16 - 16 -
Fradd Road Upgrade (Heaslip Road to Frisby
-
8 - 8 -
Fradd Road Upgrade (Heaslip Road to Frisby Road)Stormwater 11 - 11Broadacres Drive Outfall Drain Stage 2B 618 - 618Buildings Minor Projects 24-25 6 6 -Community Organisation Support Framework 66 66 -DDA Streetscape Infrastructure 24-25 34 34 -Don Hardy Reserve (O’Brien Street) Upgrade - AMP Supplementary 12 - 12Dwight Reserve - Changerooms and Car Park 255 255 -Footpath Widening - AMP Supplementary 19 19 -Gloaming Reserve Upgrade - AMP Supplementary 11 - 11Green Bin Rollout 164 128 36Health Precinct Super Stop 9 9 -Key System Upgrade 23 23 -Missing Kerbs - AMP Supplementary 20 20 -Munno Para Sportsground Stage 1 1,395 1,395 -New Footpaths 24-25 29 29 -Open Space Minor Projects 24-25 19 - 19Playground Communication Boards 1 - 1Riverlea District Sportsground (North) 40 - 40Sandford Reserve Upgrade - AMP Supplementary 4 - 4Shared Use Path Widening - AMP Supplementary 91 91 -Solar Projects 27 27 -Sport and Recreation Minor Projects 24-25 36 36 -Stormwater Minor Projects 24-25 6 - 6 -
OPERATING INVESTMENT
AV34
Road)
AV34

53 Traffic Management Minor Projects 24-25 30 30 -V4 Penfield Road Upgrade (Old Port Wakefield Road to railway crossing) 33 - - 33 Total Project/Service Funding 3,006 2,168 805 33 Cost Pressures Civic Events 98 98 -Depreciation 796 796 -Electricity 275 275 -Materials & Contractors contract rates 134 134 -Insurance Premiums 317 317 -Superannuation Guarantee 202 202 -Total Cost Pressures 1,822 1,822 -GRAND TOTAL 4,828 3,990 805 33


The Lifecycle of our Projects
The lifecycle of our projects includes everything from feasibility studies, planning and design, to community engagement, procurement, and construction. Many things need to happen, some behind the scenes, before a project is brought to life and the community starts to see things happen on the ground.
The stages of a project lifecycle are explained overleaf, including what we as Council will be working on and what the community can expect at each stage.
54
Definition

Planning

This stage:
Includes things like feasibility studies, concept planning, community engagement and seeking Council approval to proceed with delivery of the project. Community experience: The community may be asked to share thoughts about initial plans and designs through a community engagement process.
This stage:
Includes activities such as engaging a designer, undertaking site investigations, and producing detailed design drawings.
Community experience:
Council is busy working behind the scenes on finalising detailed designs based on the concept planning in the previous stage.
Construction Starts

This stage:
This is when construction work will start on site. Community experience: During the construction stage access may be limited and there may be extra noise and dust in the area.
Construction Complete

This stage:
This is the end of the construction phase, and the project is complete. Community experience: This could be a new amenity that can be enjoyed by the community now and in years to come, or infrastructure that makes our city more liveable.
The estimated milestones for the projects that will either continue from prior years or start in 2024/25 are shown in the tables on the following pages.
Note that the dates are based on current information, resourcing, weather predictions and contractor availability. All these factors are subject to change and therefore the milestones are subject to change.
55
Table 1 below shows the milestones for projects that have been fully scoped and are in planning or construction phase.
Project

Definition
Broadacres Drive Outfall Drain Stage 2B
McGilp Recreation Park Upgrade
Munno Para Sportsground Stage 1
Virgo Street Reserve & Barrow Street Reserve Upgrades
Stebonheath Road/Dalkeith Road Roundabout – Black Spot*
Kalara Reserve Upgrade**
Argana Park – Car Park & Change Facilities
Mark Oliphant Kiss & Drop
Park Road Drainage System


Complete
Complete Planning
Construction Starts
Construction
Complete
Complete Complete January 2025 June 2026
Complete Complete September 2024 June 2025
Complete December 2024
Complete August 2024
Complete December 2024
Complete See below
Complete April 2024
Complete August 2024
Complete June 2024
*This is a joint project with the Town of Gawler.
Construction start and completion dates for these projects will be advised following the planning completion.
** This is a design and construct project with no specified completion date for planning.
56
Table 2 below shows the milestones for projects that are currently in the definition phase and therefore are being scoped. Until this phase is complete the timeframes for planning and construction are unable to be established.
– Changerooms & Car Park
Frisby Road Upgrade – Road & Stormwater
AV34 Fradd Road Upgrade – Road & Stormwater
V4 Penfield Road Upgrade (Old Port Wakefield Road to railway crossing) TBC*
Reserve (O’Brien Street) Upgrade – AMP Supplementary
Angle Vale Bridge
* Road infrastructure deed project timing set by Department for Infrastructure and Transport (DIT)
57
Project Definition Complete Dwight Reserve
April 2024 Health
September 2024 AV23
August 2024
August 2024
Precinct Super Stop
Riverlea
December 2024 Sandford Reserve Upgrade
August 2024 Gloaming Reserve Upgrade
Supplementary August 2024 Don
August 2024 AMP
July 2024 McEvoy
September 2024
District Sportsground (North)
– AMP Supplementary
– AMP
Hardy
Road Basin & Culvert
Table 3 below shows the milestones for annual programs of work that include multiple individual projects with a variety of planning and construction start dates. The construction complete date is shown, with most being anticipated to be completed within the 24/25 financial year.
Project
58
Definition Complete Construction Complete Footpath Widening – AMP Supplementary July 2024 June 2025 Shared Use Path Widening – AMP Supplementary July 2024 June 2025 New Footpaths 24-25 July 2024 June 2025 DDA Streetscape Infrastructure 24-25 July 2024 June 2025 Stormwater Minor Projects 24-25 July 2024 June 2025 Sport & Recreation Minor Projects 24-25 July 2024 June 2025 Traffic Management Minor Projects 24-25 July 2024 June 2025 Missing Kerbs – AMP Supplementary July 2024 December 2024 Open Space Minor Projects 24-25 August 2024 June 2025 Playground Communication Boards July 2024 June 2025 Buildings Minor Projects 24-25 July 2024 June 2025 Key System Upgrade Complete June 2025 Solar Projects Complete June 2025
Council is committed to maintaining a financially sustainable budget whilst keeping rates as low as possible. Balancing the need to fund new infrastructure in our growth areas with fairness and equity in the distribution of rates.

DRAFT
The numbers in this section are draft and will be finalised upon completion of Rates Modelling. The final numbers will be reflected in the version of this Plan that is considered for adoption at the Ordinary Council Meeting
Rates
Why are rates important?
Rates are the primary source of revenue for Council. Rates are used to deliver Council services and to maintain community infrastructure.
This Draft Annual Business Plan provides details of how we will continue to fund and deliver our existing services, as well as new services, projects and cost pressures. Just like members of our community, Council is facing increasing costs and seeks to cover these costs while minimising the impact on ratepayers The additional costs to our budget have been partially offset with $0.4M of continuous improvement savings and through new ratepayer revenue However, to ensure Council maintains a financially sustainable budget, we also need to raise rates to keep pace with the budgetary impacts. As a result, the Annual Business Plan includes a 6.5% increase in rate revenue for 2024/25 This increase funds new projects and services that the community has asked for, while covering rising costs due to inflation and meeting budget goals that support long-term financial sustainability.


Of $150.5M total revenue, Council requires $109.9M in general rates to fund existing services.

$109.9M
How we distribute our rates
Once our budget has been finalised, Council needs to determine how rates will be distributed amongst our community.
Our Rating Policy explains how rates are distributed across the community and why. Our Rate Rebate Policy explains how and why Council approves rebates. Rating policies are all underpinned by the principles of fairness and equity
60
19% User Charges 4% Other 3%
Rates 74% Grants
Rate Revenue
About Our Rate Revenue
The table below summarises information on how general rate revenue has increased from 2023/24 to 2024/25
Rate Revenue 2023/24 2024/25 % Movement in Total Rate Revenue
General Rates (existing properties) 102,462,696 112,364,652
General Rates (new properties) 3,152,305 3,281,576
General Rates (gross) 105,615,001 115,646,228
Less: Mandatory Rebates -4,509,845 -4,680,203
General Rates (After Mandatory Rebates) 101,105,156 110,966,025 9.50%
Less: Discretionary Rebates -1,022,186 -1,091,365
General Rates (After Discretionary Rebates) 100,082,970 109,874,660 9.78%
Note the table above does not take into account other rates collected such as the Regional Landscape Levy (net of rebates) of $1.5M (collected on behalf of State Government) or other charges $0.67M
The 9.78% increase in total general rate revenue (after rebates) includes both the increase in rates from existing rate payers and new rates from new properties. See below table for breakdown: Rate Revenue Source
Rate revenue from existing rate payers 6.50%
revenue from new properties 3.28%
* This will continue to change as updated data is received from the Valuer General up to June 2024.
61
Average
% change in Rate Revenue
Rate
Additional Rateable Properties 2023/24
% Movement General Property 1,864 1,318 -29.29% Commercial Property 35 17 -51.43% Total 1,899 1,335
Total 9.78%
2024/25*
Fixed Charge
City of Playford’s rating structure allows for a maximum of 50% of Council’s total general rate revenue to come from a fixed charge. It is expected that $54.94M in fixed rates will be levied in 2024/25. Rebates will be applied to this amount bringing the collected general fixed rate revenue equal to 50% of General Rates after rebates.
In 2023/24, the fixed charge was $1,111.90. The fixed charge to apply in 2024/25 is $1,187.94
Differential Charge
As per Council’s Rating Policy, the remaining 50% of General Rates (after rebates) is collected from a differential charge. The amount payable per property is based on a rate in the dollar applied to the capital value of your property. City of Playford has two rate types declared, commercial and general. The table below provides indicative information on how rate revenue from each rate type is expected to increase from 2023/24 to 2024/25 and will be updated prior to final adoption by Council
Expected Differential Revenue and Properties 1
1 Table presented as gross revenue. Due to the impact of rate rebates gross rate revenue does not present as 50% of total gross revenue.
62
Differential Charge Differential Rate Revenue Rateable properties Average per rateable property 2023/24 2024/25 Change 2023/24 2024/25 2023/24 2024/25 Change Rate Type $'000s $'000s % # # $ $ $ General 32,258 35,450 9.71% 45,634 46,952 707 755 48 Commercial 21,957 24,091 9.90% 672 689 32,674 34,965 2,291 Total 54,215 59,541 9.82% 46,306 47,641

Our growing city
As one of South Australia’s fastest growing council areas, the population of the City of Playford is estimated to increase from 110,000 to over 183,000 by 2046
In 2023/24, City of Playford had 46,306 rateable properties. This is expected to increase to 47,641 in 2024/25, representing 2.89% growth in the number of rateable properties.
63

A range of performance measures and financial targets help track our progress as we deliver against the Annual Business Plan and Budget.


Measures and Targets
Section 123 of the Local Government Act 1999 states that the Annual Business Plan must include the measures (financial and non-financial) that the Council intends to assess the performance of Council against its objectives over the financial year. Council has a strong focus on engaging with our community and customers to understand their experience of us and gather feedback and insights to help measure our performance and improve service delivery. Council monitors its performance in several ways to ensure we are on track to meet the objectives of our Strategic Plan 2020-24.
65
Playford Community Survey
Each year, Council undertakes a survey to better understand the views of our community. A move towards aligning community feedback with Council’s strategic goals resulted in changes to the way the survey was delivered from 2021.
With the development of Council’s new Strategic Plan, there was opportunity to align our annual community survey to Strategic Plan Community Themes to capture sentiment, perception, and performance of Council’s delivery against strategic objectives. Questions in the new survey focused on what it is like to live in or experience Playford.
The July 2023 survey saw over 1430 members of the Playford community sharing their thoughts and experiences. The graphics below show the average rating out of five for each Community Theme. The average Community Sentiment is also shown below. This represents community trust and confidence in Council, as well as satisfaction with Council over the past 12 months.
We use the decision-making filters and Community Themes in the Strategic Plan to inform the development of the annual budget and to ensure we are working towards our longer-term objectives. The results of the Community Survey also guide our decision-making around priorities for the budget to ensure up-to-date feedback from the community is considered as part of our planning.

66
Financial Indicators
Financial sustainability is achieved when Council can deliver the services it provides to the community at an agreed and consistent standard across a long period, without the need for significant rate increases above inflation or significant service reductions, whilst maintaining intergenerational equity.
Financial sustainability enables Council to:
• Deliver and maintain inter-generational equity
• Maintain a solid and healthy financial position
• Maintain a degree of stability and predictability for future rate increases
• Manage its debt levels
Council has six financial indicators used to measure its financial sustainability:
• Operating surplus ratio
• Structural surplus ratio
• Cashflow from operations ratio
• Asset renewal funding ratio
• Net financial liabilities ratio
• Interest expense ratio

67
Primary Financial Indicators
Financial
Operating Surplus Ratio
Structural Surplus Ratio
This ratio gives an indication of Council’s ability to service its operations from expected income, while maintaining long-term financial sustainability.
This ratio gives an indication of Council’s ability to service its operations from expected income excluding one-off items that are not recurrent in nature, while maintaining long-term financial sustainability.
This ratio measures whether Council is generating enough cash from its operations to cover the replacement of assets over time.
This ratio shows whether or not Council is replacing assets at the rate as required in the Asset Management Plan.
This ratio shows the extent to which Council is managing its debt.
This ratio shows how much discretionary income is used to pay interest on borrowings
Operating Surplus Ratio
Performance against this ratio has decreased to 4.7% from 6.5% as at the 2023/24 revised budget. Although the ratio for 2024/25 remains within the target range, the operating surplus includes oneoff operating grants/contributions which will need to be spent on future infrastructure projects One-off grants have decreased in 2024/25 resulting in the ratio decrease.
Structural Surplus Ratio
The structural surplus excludes one-off operating grants/contributions which will need to be spent on future infrastructure projects Meeting the target range for this measure ensures Council remains financially sustainable Performance against this ratio remains within target range.
68
Target 2023/24 Revised Budget 2024/25 Budget Projected 5 Year Average
Indicator Explanation
Between 1% and 10% 6.5% 4.7% 4.2%
1.0% 1.0% 1.0%
Between 1% and 4%
Operations Ratio
Cashflow from
Between 90% and 110% 102.7% 117.3% 129.1% Asset Renewal Funding Ratio
Between 90% and 110% 149.3% 118.1% 103.6% Net Financial Liabilities Ratio
Between 50% and 160% 88.1% 105.2% 94.2% Interest Expense Ratio
Between 0% and 8% 5.1% 5.7% 4.3%
Cashflow from Operations Ratio
The 2024/25 result is above Council’s target range at 117.3%. While it may appear that Council has “extra money”, this is not the case. Cashflows from operations is in excess of the short-term funding requirements for the asset management plan replacement annuity asset. These funds are committed to replacing assets which will come to end of their life over the next 20 to 50 years. Smoothing the requirement to fund the renewal over time ensures intergenerational equity – the idea that each generation pays their fair share for use of an asset or resource.
Asset Renewal Ratio
The result for 2024/25 is slightly higher than the target range at 118.1% due to carry forward of capital expenditure from 2023/24. This is a combination of projects which were planned to be delivered over multiple years, some projects where external factors have limited our ability to deliver projects this financial year, and some renewal works deferred to align with other projects and reduced disruption to the community This ratio returns within the target range by year 2 of the Long Term Financial Plan and the 5-year average is within the target range.
Net Financial Liabilities Ratios
The ratio sits within the target range in 2024/25. The forecasted debt for 2024/25 remains relatively stable and this is primarily due to Council’s ongoing commitment to achieving a financially sustainable surplus and effective debt management.
Interest Expense Ratio
Notwithstanding the significant investment in the city, the ratio is within the target range due to Council’s commitment to achieving a financially sustainable surplus and effective debt and interest rate risk management.

69
On 30 April 2022, amendments to the Local Government Act 1999 came into operation and introduced an advisory scheme that aims to give ratepayers confidence that the rates they pay are set at the level necessary for their council to provide the services they value. The Essential Services Commission SA (ESCOSA) is the advisory body. The State’s 68 councils are subject to the scheme and were allocated across four tranches to be reviewed over a four-year cycle.


Council is committed to delivering long-term financial sustainability with a focus on producing a sustainable operational surplus position, effectively managing debt and sustainably growing assets and services.

DRAFT
This section will need updating post rates modelling to allow for final growth and capital values.
Budgeted Financial Statements & Explanations

Council continues to be committed to maintaining an operating surplus as a key strategy of the Council’s long-term financial sustainability.
Council’s budget provides an operating surplus of $7.02M. This budgeted operating surplus includes developer contributions and grants associated with future capital spend that does not form part of our ongoing sustainable structural position
Council continues to be committed to maintaining an operating surplus as a key strategy of the Council’s long-term financial sustainability.

73
Financial Summary Operating Budget $M Operating Income 150.45 Operating Expenditure 143.43 Operating Surplus/(Deficit) 7.02
Statement of Comprehensive Income
Rates Income – $112M
Increases in Council rates allow Council to meet the community service delivery expectations and achieve Long Term Financial Plan objectives. The 2024/25 Budget includes the following:
• a rate revenue increase of 6.5% for existing ratepayers
• additional rate income of $3.3M from new developments in the city
• the Landscape Levy collected on behalf of the Green Adelaide Board of $1.5M. Once collected this is paid to the Green Adelaide Board with no impact on the bottom line
• Penalties and Legal recoveries $0.67M
Statutory Charges – $3.1M
Statutory charges are fees for the provision of regulatory services. They are associated with the granting of a permit or licence or with the regulation of an activity, including the Planning, Development and Infrastructure Act (2016), fees, parking fines and dog registration fees.
Most fees are set by State Government legislation and administered by Council.
Council is notified of the fee amounts in late June of each year and these will be adopted by Council to apply from July 2024.
74
Resource Group Revised Budget 2023/24 $’000’s Budget 2024/25 $’000s Increase (Decrease) $’000 Rates 102,004 112,044 10,040 Statutory Charges 2,888 3,134 246 User Charges 6,047 6 243 196 Investment Income 52 72 20 Reimbursements 637 677 40 Other Income 177 173 (4) Grants, Subsidies and Contributions 30,156 28,114 (2,042) Net
Ventures & Associates - -Revenue Total 141,961 150,457 8,496
Gain – Joint
User Charges – $6.2M
User charges income is received from individuals, sporting groups and various other bodies that utilise user-pay services and hire or lease Council owned property.
Council also receives commercial activity income from the operation of the theatres, café, function centre and the Northern Sound System, with a minor amount coming from the hiring of Council facilities for functions or meetings.
User charges for 2024/25 have increased as a result of increased demand for user-paid services and to take into account inflationary cost pressures.
Reimbursement – $0.7M
Reimbursement income consists of all reimbursements paid to Council by insurance companies, ratepayers, developers, and other tiers of government.
Reimbursements have increased slightly compared with the 2023/24 budget
Other Income – $0.2M
Other income is comprised of donations, sponsorships, and other miscellaneous receipts, which varies from year to year.
Grants, Subsidies and Contributions – $28.1M
Grants, subsidies, and contributions are income received from Federal and State Governments in addition to contributions from developers. Revenue received specifically to fund the construction or purchase of new or upgraded assets is included in a separate section of the Financial Statement.
Grants, subsidies, and contribution income is budgeted to decrease, mainly due to decrease in Supplementary Local Roads, and Special Local Roads grant offset by increased developer contributions, for future capital investment, and a projected increase in Federal Assistance Grant support consistent with the growth of our city and past history.
75
Operating expense by category
Employee Costs – $50.4M
Employee costs include base salary and all relevant on-costs, such as superannuation and work cover, as well as agency labour costs. The budget covers recurrent labour, project labour and externally funded labour.
The budgeted increase in employee costs is the combined result of estimated salary increases (subject to Enterprise Bargaining negotiations) and 0.5% increase in Superannuation Guarantee Charge.
Materials, Contracts and Other Expenses – $51.6M
Materials covers many different expenses of Council including utility payments for water and electricity, library books and consumable materials.
Contracts covers costs such as contractors, waste collection, equipment hire, software license fees and consultants.
Other expenditure includes audit and legal fees, contributions, communication expenses, insurance and registration, levies paid to other organisations, Elected Member allowances, advertising, fringe benefits tax, training, and travel expenses
The budget increase reflects cost pressures in the market largely related to electricity, insurance, and general inflation
Finance Costs – $6.4M
Finance costs include interest payable on borrowings and finance leases, and other banking charges.
Council is budgeting for an increase in finance costs. Whilst interest rates have risen sharply over the past 12 months, Council has been able to effectively manage debt to secure attractive fixed rates where possible, with the additional costs arising from new capital spend during 2024/25
76
Resource Group Revised Budget 2022/23 $’000 Budget 2023/24 $’000 Increase (Decrease) $’000 Employee Costs 47,785 50,391 2,606 Contracts, Material and Other 48,371 51,574 3,203 Finance Costs 5,182 6,390 1,208 Depreciation 30,783 34,480 3,697 Share of Equity Loss on Associates and Joint Ventures 585 599 14 Expense Total 132,706 143,434 10,728
Depreciation – $34.5M
Depreciation is a non-cash expense that recognises the systematic allocation of the service potential, (cost or replacement value) of an asset over its useful life. Over the long-term, depreciation represents the minimum amount which, on average, Council needs to allocate each year towards asset replacement. This is a different concept from maintenance expenditure, which is the amount Council needs to spend each year to ensure that its assets last as long as planned.
Depreciation is increasing in 2024/25, largely due to the revaluation of assets and an increase in the asset base to service our growing community
Loss on Associates and Joint Ventures – $0.6M
Council’s share of the Gawler River Floodplain Management Authority (GRFMA) will result in a net loss of $0.2M in 2024/25, based on advice from the Authority.
Council’s share of the Northern Adelaide Waste Management Authority (NAWMA) will result in a net loss of $0.4M in 2024/25, based on advice from the Authority.
Financial Statements
Cashflow Statement
The cashflow statement shows the cash movement reflective of Council’s operating position and investment decisions for 2024/25.
Cashflow from operating activities increases by $11.1M reflecting additional rates revenue and increase in FA grant income offset by higher costs.
Cash used for investment activities increases by $35.7M due to increased capital spend on new and existing infrastructure.
The overall impact in cashflow results in increased borrowing requirements for 2024/25
Balance Sheet
Total Non-Current Assets are projected to rise to $1,894M in 2024/25, an increase of $129M. This increase arises from the capital expenditure program, contributed assets and revaluation of assets.
Total borrowings are projected to increase to $137M by 30 June 2025. This is a result of a higher debt funded capital program. The level of borrowings is within the target range. Please see the financial indicator section for more information.
77
Uniform Presentation of Finances
Operating Surplus / (deficit)
The operating surplus or deficit indicates the extent to which income is sufficient, or insufficient, to fund the cost of services. A surplus indicates Council is raising enough operating income to cover its operating expenses, whereas a deficit indicates it is not.
Net
Outlays
on Existing Assets
This is expenditure that returns the service potential of existing assets back towards their original level. Consistent negative outlays on existing assets indicate that, overall, existing assets may be deteriorating as expenditure on their renewal or replacement is less than the rate of depreciation.
Net Outlays on New and Upgraded Assets
Outlays on new and upgraded assets indicate the net cost to Council of acquiring or creating new assets. Outlays on new or upgraded assets will increase depreciation and maintenance expenses in future periods.
Net Lending / (borrowing) for Financial Year
Net lending, if a positive result, indicates that Council will reduce its level of borrowings over the period. Net borrowings, if a negative result, means Council is required to borrow additional funds increasing the level of net borrowings over the period.
78
79
of Comprehensive Income
2022/23 Actual 2023/24 Original Budget 2023/24 Revised Budget 2024/25 Original Budget $000's $000's$ 000's$000's INCOME 91,750 Rates 1 02,004 102,004 112,044 3,169 Statutory Charges 2 ,888 2,888 3,134 3,881 User Charges 6 ,047 6,047 6,243 56 Investment Income 5 2 52 72 1,094 Reimbursements 6 37 637 677 710 Other Income 1 77 177 173 8,675 Grants, Subsidies and Contributions - capital 7 ,202 8,820 6,255 24,012 Grants, Subsidies and Contributions - operating 1 9,985 21,336 21,859 - Net Gain - Equity Accounted Council Businesses - -133,347 TOTAL INCOME 1 38,992 141,961 150,457 EXPENSES 42,828 Employee costs 4 7,719 47,785 50,391 41,243 Materials, Contracts & Other Expenses 4 7,625 48,372 51,574 3,895 Finance costs 4 ,756 5,182 6,390 28,029 Depreciation, Amortisation and Impairment 3 0,502 30,783 34,480 303 Net Loss - Equity Accounted Council Businesses 5 85 585 599 116,298 TOTAL EXPENSES 1 31,187 132,707 143,434 17,049 Operating Surplus / (Deficit) 7 ,805 9,254 7,023 1,612 Asset Disposal & Fair Value Adjustments - -5,220 Amounts Received Specifically for New or Upgraded Assets 1 5,961 7,832 13,932 21,571 Physical Resources Received Free of Charge 2 5,000 25,000 39,460 45,452 NET SURPLUS / (DEFICIT) 4 8,766 42,086 60,415 Other Comprehensive Income 88,266 Changes in Revaluation Surplus - I,PP&E 4 6,024 46,024 31,664 125 Share of Other Comprehensive Income - Equity Accounted Council Businesses (403) Other Equity Adjustments - Equity Accounted Council Businesses - -524 Impairment (Expense) / Recoupments Offset to Asset Revaluation Reserve - -88,512 Total Other Comprehensive Income 4 6,024 46,024 31,664 133,964 TOTAL COMPREHENSIVE INCOME 9 4,790 88,110 92,079
City of Playford
Statement
For the year ended 30 June 2025
80
Year End Balance Sheet For
2022/23 Actual 2023/24 Original Budget 2023/24 Revised Budget 2024/25 Original Budget $000's $000's$ 000's$000's CURRENT ASSETS 15,403 Cash & Cash Equivalents 1 ,500 1,500 1,500 13,924 Trade & Other Receivables 7 ,292 6,671 8,187 254 Inventories 2 10 237 253 24 Other Financial Assets - -897 Other current assets 6 99 818 872 362 Non-current assets classified as Held for Sale 5 ,180 11,211 8,011 30,864 TOTAL CURRENT ASSETS 1 4,881 20,437 18,823 NON-CURRENT ASSETS 248 Financial Assets 2 23 222 195 10,178 Equity Accounted Investments in Council Businesses 1 0,106 9,593 8,995 1,620,697 Infrastructure, Property, Plant & Equipment 1 ,749,726 1,742,877 1,871,896 31,754 Other Non-Current Assets 1 2,726 12,726 12,726 1,662,877 TOTAL NON-CURRENT ASSETS 1 ,772,781 1,765,418 1,893,812 1,693,741 TOTAL ASSETS 1 ,787,662 1,785,855 1,912,635 CURRENT LIABILITIES 20,581 Trade & Other Payables 1 5,083 25,705 23,002 6,531 Borrowings 5 ,303 5,312 4,442 6,268 Provisions 6 ,575 6,429 6,637 33,380 TOTAL CURRENT LIABILITIES 2 6,961 37,446 34,081 NON-CURRENT LIABILITIES 94,722 Long Term Borrowings 1 04,162 94,581 132,602 1,290 Long Term Provisions 1 ,397 1,368 1,413 96,012 TOTAL NON-CURRENT LIABILITIES 1 05,559 95,949 134,015 129,392 TOTAL LIABILITIES 1 32,520 133,395 168,096 1,564,349 NET ASSETS 1 ,655,142 1,652,460 1,744,539 EQUITY 447,720 Accumulated Surplus 5 15,341 492,340 555,404 1,100,688 Asset Revaluation Reserves 1 ,131,700 1,146,713 1,178,377 15,941 Other Reserves 8 ,101 13,407 10,758 1,564,349 TOTAL EQUITY 1 ,655,142 1,652,460 1,744,539
City of Playford
the year ended 30 June 2025
For the year ended 30 June 2025
CASHFLOWS FROM OPERATING ACTIVITIES
81
City of Playford
Statement of Cash Flows
2022/23 Actual 2023/24 Original Budget 2023/24 Revised Budget 2024/25 Original Budget $000's $000's$ 000's$000's Inflows / (Outflows) Inflows / (Outflows) Inflows / (Outflows) Inflows / (Outflows)
Receipts 90,845 Rates Receipts 1 01,547 101,595 111,680 3,169 Statutory Charges 2 ,821 3,422 3,104 4,184 User Charges 6 ,043 6,389 6,219 23,816 Grants, Subsidies and Contributions 1 9,552 10,423 21,555 56 Investment Receipts 5 1 60 71 1,160 Reimbursements 6 26 857 672 1,098 Other Receipts 1 80 335 179 Payments (42,977) Payments to Employees (47,581) (47,545) (50,139) (48,366) Payments for Materials, Contracts & Other Expenses (45,976) (45,125) (50,646) (3,895) Finance Payments (4,756) (5,182) (6,390) 29,090 NET CASH PROVIDED BY (USED IN) OPERATING ACTIVITIES 3 2,507 25,229 36,305 CASH FLOWS FROM FINANCING ACTIVITIES Receipts 75,950 Proceeds from Borrowings 2 ,805 5,167 42,463 21 Proceeds from Bonds & Deposits Payments (81,164) Repayments of Borrowings (6,440) (6,440) (5,260) (153) Repayment of Finance Lease Liabilities (82) (98) (52) (5,346) NET CASH PROVIDED BY (USED IN) FINANCING ACTIVITIES (3,717) (1,371) 37,151 CASH FLOWS FROM INVESTMENT ACTIVITIES Receipts 1,610 Sale of Replaced Assets - -11,606 Sale of Surplus Assets 1 7,540 - 11,211 5,220 Amounts Received Specifically for New/Upgraded Assets 8 ,668 9,358 9,226 8,429 Grants untilised for capital purposes 7 ,202 7,854 6,468 24 Repayments of Loans by Community Groups 2 4 24 26 Payments -(12,098) Expenditure on Renewal/Replacement of Assets (24,145) (29,635) (34,125) (24,950) Expenditure on New/Upgraded Assets (38,079) (25,362) (66,261) (10,159) NET CASH PROVIDED BY (USED IN) INVESTMENT ACTIVITIES (28,790) (37,761) (73,455) 13,585 NET INCREASE (DECREASE) IN CASH HELD - (13,903)1,818 CASH AT BEGINNING OF REPORTING PERIOD 1 ,500 15,403 1,500 15,403 CASH AT END OF REPORTING PERIOD 1 ,500 1,500 1,500
Statement of Changes in Equity
For the year ended 30 June 2025
Adjustments (Correction of Prior Period Errors)
(403) Other Equity Adjustments - Equity Accounted Council Businesses
(9,918) Transfer to Accumulated Surplus on Sale of I,PP&E
ASSET REVALUATION RESERVE
524 Impairment (expense) / recoupments offset to asset revaluation reserve
Transfers to accumulated surplus
Transfers between Reserves
OTHER RESERVES
82
City of Playford
2022/23 Actual 2023/24 Original Budget 2023/24 Revised Budget 2024/25 Original Budget $000's $000's$000's$000's ACCUMULATED SURPLUS 415,270 Balance at end of previous reporting period 461,649 447,720 492,340 45,452 Net Surplus / (Deficit) for Year 48,766 42,086 60,415
-
- - -
- -(2,681)
between Reserves 4,926 2,534 2,649 447,720 Balance at end of reporting period 515,341 492,340 555,404
Transfers
1,001,855 Balance at end of previous reporting period 1,085,676 1,100,688 1,146,713 125 Other Comprehensive Income - -88,266 Gain(Loss) on revaluation of infrastructure, property, plant & equipment 46,024 46,025 31,664
- -9,918
- - -
- -1,100,688 Balance
1,131,700 1,146,713 1,178,377
at end of reporting period
13,260 Balance at end of previous reporting period 13,027 15,941 13,407 - Transfers to accumulated surplus (4,926) (2,534) (2,649) 2,681 Transfers from accumulated surplus - -15,941 Balance at end of reporting period 8,101 13,407 10,758 1,564,349 TOTAL EQUITY AT END OF REPORTING PERIOD 1,655,142 1,652,460 1,744,539 447,720
Surplus 515,341492,340555,404 1,116,629 Reserves 1,139,8011,160,1201,189,135 1,564,349 TOTAL EQUITY AT END OF REPORTING PERIOD 1,655,142 1,652,460 1,744,539
Accumulated
83
Presentation of Finances
City of Playford Uniform
2022/23 Actual 2023/24 Original Budget 2023/24 Revised Budget 2024/25 Original Budget $000's $000's$000's$000's INCOME91,750 Rates 102,004 102,004 112,044 3,169 Statutory Charges 2,888 2,888 3,134 3,881 User Charges 6,047 6,047 6,243 56 Investment Income 52 52 72 1,094 Reimbursements 637 637 677 710 Other Income 177 177 173 8,675 Grants, Subsidies and Contributions - capital 7,202 8,820 6,255 24,012 Grants, Subsidies and Contributions - operating 19,985 21,337 21,859 - Net Gain - Equity Accounted Council Businesses - -133,347 TOTAL INCOME 138,992 141,962 150,457 EXPENSES 42,828 Employee costs 47,719 47,785 50,391 41,243 Materials, Contracts & Other Expenses 47,625 48,372 51,574 3,895 Finance costs 4,756 5,182 6,390 28,029 Depreciation, Amortisation and Impairment 30,502 30,783 34,480 303 Net Loss - Equity Accounted Council Businesses 585 585 599 116,298 TOTAL EXPENSES 131,187 132,707 143,434 133,347 Operating Income 138,992 141,962 150,457 (116,298) Less: Operating expenditure (131,187) (132,707) (143,434) 17,049 Operating Surplus / (Deficit) 7,805 9,255 7,023 11,919 Adjusted Operating surplus/ (deficit) 2,675 4,124 7,023 Net outlays on existing assets (12,098) Capital expenditure on renewal and replacement of existing assets (24,145) (29,635) (34,125) 28,029 add back Depreciation, Amortisation and Impairment 30,502 30,782 34,481 1,610 add back Proceeds from Sale of Replaced Assets - -17,541 Net Outlays on Existing Assets 6,357 1,147 356 Net outlays on new and upgraded assets (24,950) Capital expenditure on new and upgraded assets (38,079) (25,362) (66,261) 5,220 add back Amounts Received Specifically for New and Upgraded Assets 8,668 9,359 9,227 11,606 add back Proceeds from sale of surplus assets 17,540 - 11,211 (8,124) Outlays on New and Upgraded Assets (11,871) (16,003) (45,823) 21,336 NET LENDING / (BORROWING) FOR FINANCIAL YEAR (2,839) (10,732) (38,444)
For the year ended 30 June 2025

Transport Renewals
Suburb Location
Roads
Andrews Farm Grace Avenue
Blakeview

Craigmore
Davoren Park
Edinburgh North
Elizabeth
Harwood Place
Aldgate Lane
Galleon Close
Lynton Court
Park Lake Boulevard*
Bundarra Court*
Illawarra Court*
Jacaranda Drive*
Jacaranda Drive/Adams Road roundabout
Jedna Close*
Kakuna Crescent*
Uley Road*
Venice Court*
Brookside Close
Burry Street
Mitchell Street
Searle Road
Hartfoot Crescent*
Kingstag Crescent*
Elizabeth Way#
Fyfield Street
Keevil Street
Mountbatten Square
Elizabeth Downs Loftis Road
McKenzie Road
Stone Road
Turnworth Street
Elizabeth East Badcoe Street
Derrick Road
Halsey Road
Jensen Street
Kibby Road
Elizabeth Grove Argent Street
Fairfield Road
Frith Street
Grateley Street
Hale Street
Hecker Street
Elizabeth North Montrose Court
Elizabeth Park
Litton Street
McLean Street
85
– Asphaltic Concrete/Pavement Design/Reinforced Concrete/Spray Seal Overlay/Reconstruction
Suburb Location
Elizabeth South
Blake Road
Elizabeth Vale Clapton Street
Pasteur Street
Hillbank Argyle Walk
Ashwood Boulevard
Holyoake Court
Kareda Court
Kurrie Street
Wells Court
Penfield Gardens
Smithfield Plains
Ransomes Road
Sterling Court
Virginia Broster Road
Martin Road
Womma West Road*
Waterloo Corner
*Potential multi-year projects
#Multi-year project
Calvengrove Road
Coleman Road*
Ryan Road*
Supple Road
Suburb Location
Kerbs
Blakeview Lynton Court
Davoren Park
Elizabeth Downs
Park Lake Boulevard
Searle Road
Stone Road
Turnbull Road
Elizabeth East Halsey Road
Elizabeth Grove
Jensen Street
Allington Street
Argent Street
Blencowe Street
Grateley Street
Mahood Street
Mofflin Road
Elizabeth Park Litton Street
Seatown Road
Elizabeth South Harvey Road
86
Elizabeth Vale Clapton Street
Wayford Street
Hillbank Kareda Court
Willison Road
Bridges
Andrews Farm Stebonheath Wetlands – Footbridge x 3 and Viewing Platform x 2
Virginia Virginia Grove - Footbridge
Traffic Safety
Elizabeth Frobisher Road
Streetscape Renewals
Footpaths
Suburb Location
Andrews Farm Greenfields Drive#
Hughes Street#
Blakeview Uley Road
Craigmore
Adams Road#
Baldina Crescent
Blair Park Drive#
Coolibah Avenue
Tea Tree Drive
Uley Road#
Elizabeth Goodman Road#
Elizabeth Downs Crisp Road
Haldane Street
McKenzie Road
Midway Road#
St Leonard Crescent
Elizabeth East Aylwin Street
Holcomb Street
Kinkaid Road
Yorktown Road#
Elizabeth Park Hayles Road
Seatown Road
Shillabeer Road
Elizabeth South Goodman Road
Hillbank Main North Road#
87
Footpaths
Munno Para Munno Para Linear Reserve
One Tree Hill Black Top Road
Smithfield Warooka Crescent#
Signs
Angle Vale Angle Vale Road Heaslip Road
Craigmore Horrie Knight Reserve
Elizabeth Elizabeth Civic Centre
Hillbank Jo Gapper
Virginia Gawler Road
Waterloo Corner Heaslip Road
Pram Ramps
Streetscape x 95
Transport x 156
#Sections of these roads have budget allocated for widening
Stormwater Renewals
Suburb Location Item
Andrews Farm Grace Avenue Greenfields Drive Pipe x 2 and SEP x 2 Box Culvert x 2 and Headwall x 4
Angle Vale Heaslip Road Headwall
Blakeview Lynton Court Pipe
Craigmore Carob Crescent Kakuna Crescent Venice Court Pipe and SEP x 2 Pipe Pipe
Edinburgh North Hartfoot Crescent Pipe and SEP
Elizabeth Park Seaborough Road Junction Box
One Tree Hill One Tree Hill Cemetery Design
88
Parks and Sportsfield Renewals
Suburb Location Item
Andrews Farm Purdilla Drainage Reserve Bench
Davoren Park Kalara Reserve# Sandford Reserve# Don Hardy Reserve (O’Brien Street)# Cricket nets & cricket pitch Reserve
Playground, irrigation & reserve sign
Elizabeth Downs Argana Park# Irrigation
Elizabeth East Playford tennis Centre Wooden bench/steps Tennis court design & court access
Elizabeth Park Olive Grove Dwight Reserve North Bench x 2 Playground Hillbank Gloaming Reserve* Playground, irrigation and reserve sign
Munno Para Playford Town Park Rubber softfall, drink fountain & inclusive play equipment
Smithfield Anzac Day Memorial Replacement of Anzac Day metal soldiers & picnic setting x 4
One Tree Hill McGilp Recreational Park Tennis court fencing
# Potential multi-year project in conjunction with master plan construction
*Renewal is being supplemented by upgrade projects
Buildings Renewals
Suburb Location Item
Craigmore Uley Road Reserve Clubroom foyer fit out
Davoren Park Playford Operations Centre Rear patio & benches Canteen air conditioner C-4 Building 1 air conditioner Server/BMS controller replacement
Edinburgh North Ramsay Park Home, away & referee changeroom
Elizabeth Fremont Park Civic Centre Compounds sheds & storage Lunchroom & staff toilet
Fan coil unit
Air-conditioning condenser
Elizabeth North Dauntsey Reserve Home, away & referee changeroom
89
Suburb Location
Item
Elizabeth South Central Districts Softball Club Evaporative air conditioner
Elizabeth Vale Mofflin Reserve Air conditioner condenser
Smithfield Plains Morialta Drive – CAFHS Building Ceiling, roof framing & wall
Virginia Virginia Football Club
Virginia Recreation Centre
Virginia Horticulture Centre Home, away & referee changeroom
Male cubicles in changeroom
Front reception & back office fit out
Electrical upgrade & blinds
Evaporative air conditioner x 6
Fan coil unit
Various Master key system & security Master key x 15 buildings
Water Delivery Renewals
Facility Item
Andrews Farm Pump Station Monitoring, testing and pressure transmitting equipment
Curtis & Stebonheath Pump Station Monitoring, testing and pressure transmitting equipment, wetland erosion reinstatement, security system
Mofflin Reserve Pump Station Scada panel, monitoring equipment, valves and testing equipment.
NEXY Pump Station Alarm
Olive Grove Pump Station Probe
Samuel Street Pump Station Monitoring, testing and pressure transmitting equipment, wetland erosion reinstatement, security system
Town Park Filter, instrumentation, pump and water play equipment.
Uley Road Pump Station Water quality testing unit.
Yorktown Road Pump Station Irrigation pump, proportioning valve on tank
Playford Alive Renewals
Footpaths, Roads, Kerbs & Verge Compacted Fines
Suburb Location
Davoren Park Lock Street
90
Footpaths, Roads, Kerbs & Verge Compacted Fines
Rowe Street Skewes Street*
Ward Street Redcliff Street#
Pram Ramps
Streetscape 5
Transport 9
*Roads & footpaths only
#Verge compacted fines only
Open Space Minor Projects
Suburb Location Item
Andrews Farm Riesling Crescent /Coonawarra Avenue Reserve
West Parkway Reserve Solar lights x 2 BBQ x 1
Blakeview Blakes Oval Fencing (near basketball key)
Elizabeth Ridley Reserve Doggie bowl x 1
Elizabeth Grove Burgate Street Reserve Solar lights x 3
Elizabeth North Breamore Street Reserve BBQ x 1 & pram ramps x 2
Elizabeth Park Fremont Park Drinking fountain x 1
Munno Para West Walkway between Orange Parade & Curtis Road Public light x 1
Sport & Recreation Minor Projects
Suburb Location Item
Elizabeth Downs Uley Reserve Accessible ramp
Elizabeth North Dauntsey Reserve Shed
Elizabeth South Ridley Reserve West Shed & dugout
91
Traffic Management Minor Projects
Suburb Location Item
Elizabeth East Mavros Road Cushion & median strip (design only)
Elizabeth South Goodman Road Pedestrian refuge island
Smithfield Plains Anderson Walk/Coventry Road intersection Energy absorbing bollards
Virginia King Road/Penfield Road intersection Rumble strips

92


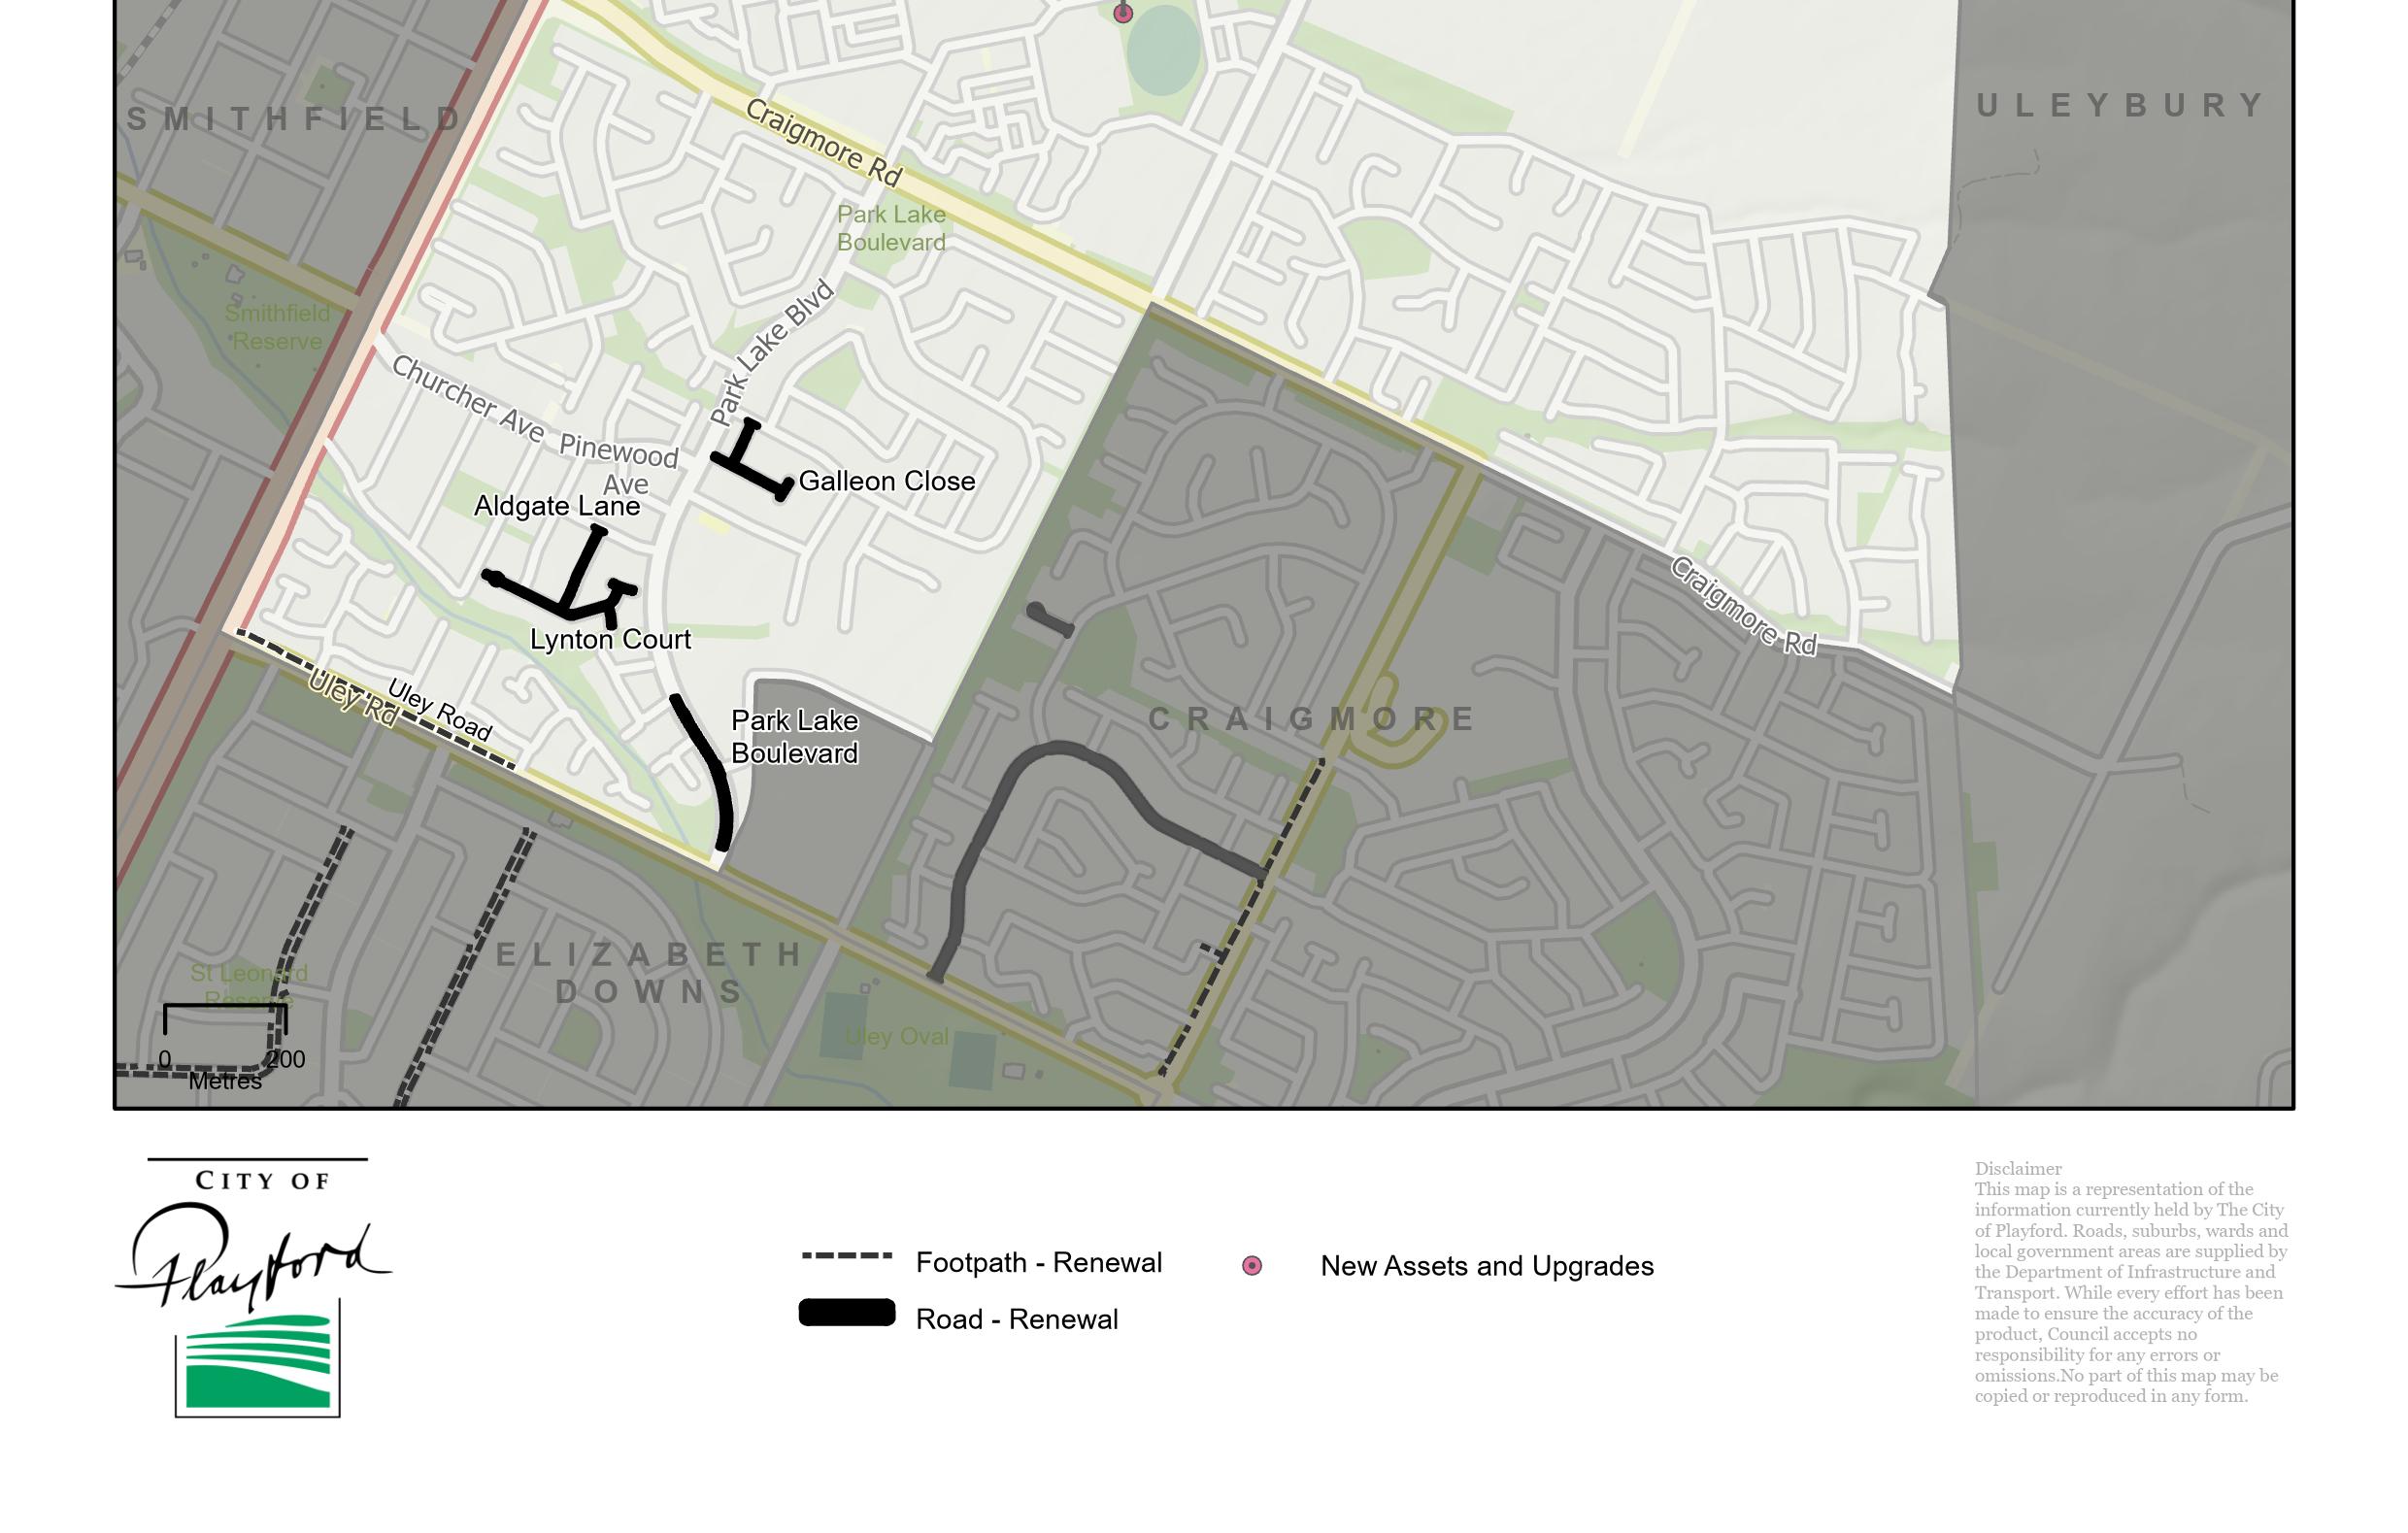


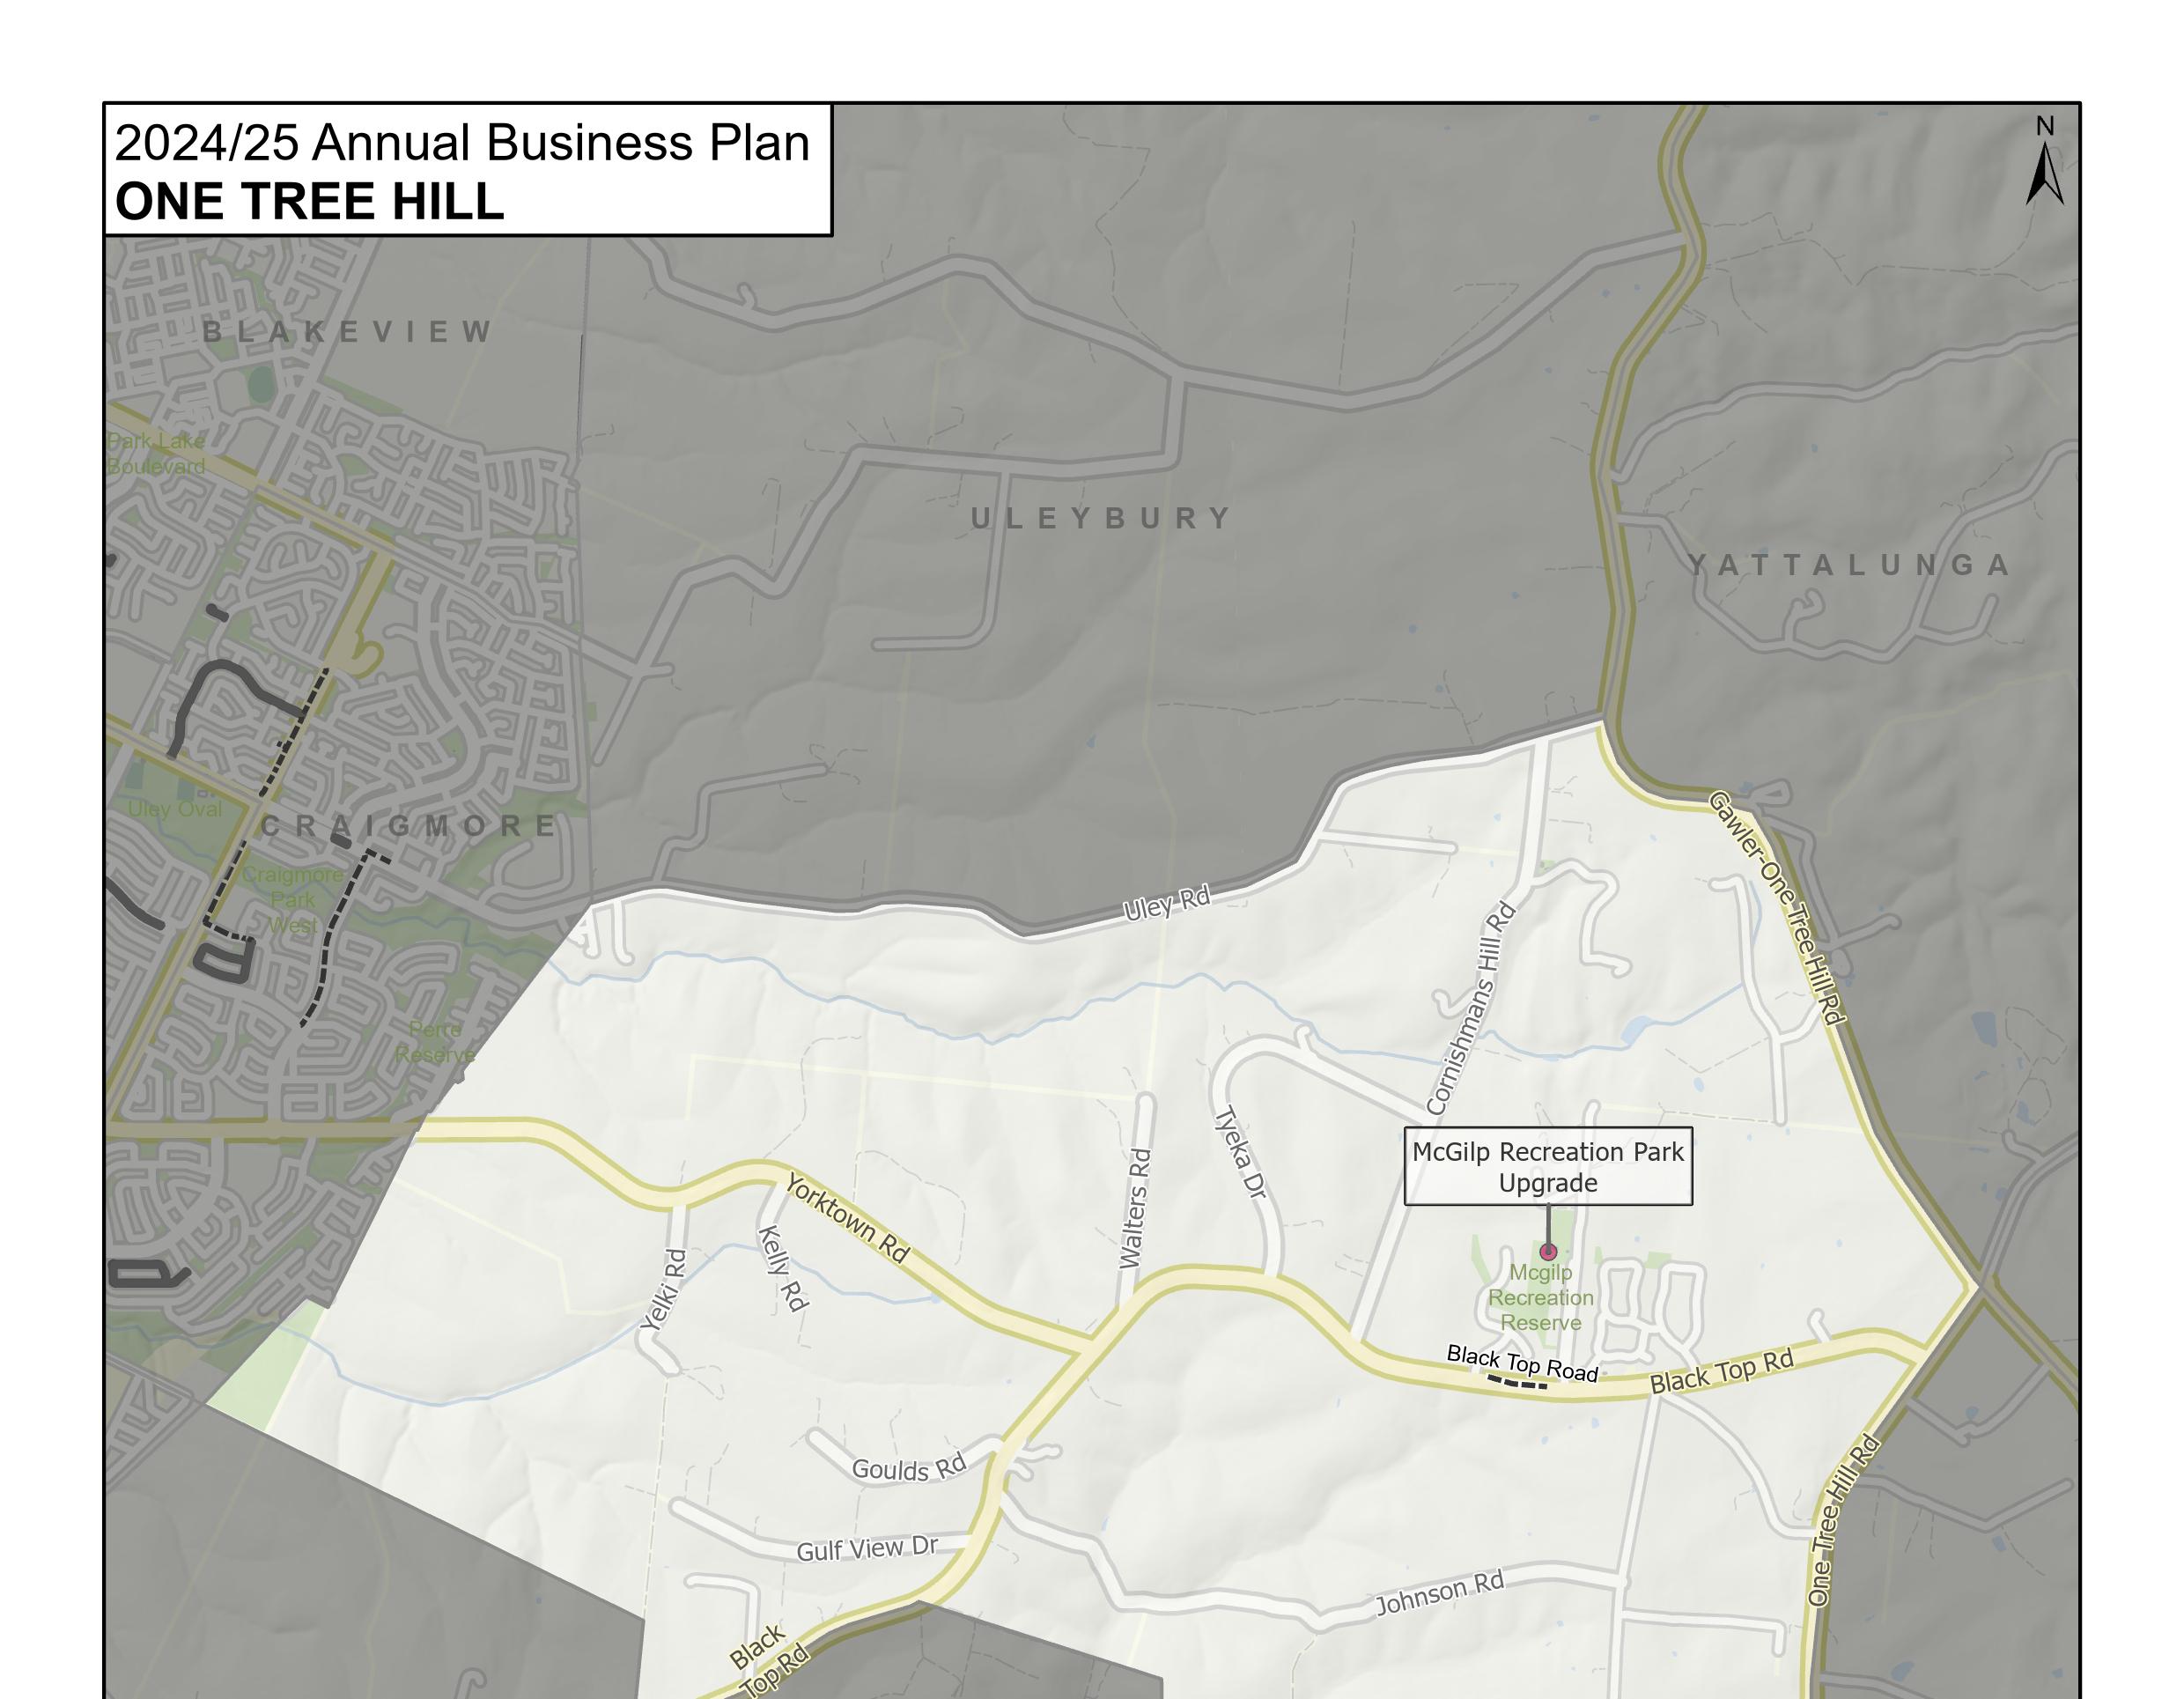


Local Government Advice

February 2024
OFFICIAL OFFICIAL
City of Playford
Enquiries concerning this advice should be addressed to:
Essential Services Commission
GPO Box 2605
Adelaide SA 5001
Telephone: (08) 8463 4444
Freecall: 1800 633 592 (SA and mobiles only)
E-mail: advice@escosa.sa.gov.au
Web: www.escosa.sa.gov.au
OFFICIAL Local Government Advice: City of Playford OFFICIAL

OFFICIAL Local Government Advice: City of Playford OFFICIAL The Essential Services Commission is an independent statutory authority with functions in a range of essential services including water, sewerage, electricity, gas, rail and maritime services, and also has a general advisory function on economic matters. For more information, please visit www.escosa.sa.gov.au
OFFICIAL Local Government Advice: City of Playford 1 OFFICIAL Table of contents Glossary of terms 2 1 The Commission’s key advice findings for the City of Playford 3 Current financial performance: 3 Projected financial performance (future): 3 Previous financial performance (past ten years): 3 2 About the advice 5 2.1 Summary of advice 5 2.2 Detailed advice findings 6 2.2.1 Advice on material plan amendments in 2023-24 6 2.2.2 Advice on financial sustainability 7 2.2.3 Advice on current and projected rate levels 11 2.3 The Commission’s next advice and focus areas 12
Glossary of terms
ABS Australian Bureau of Statistics
AMP Asset management plan (also called an IAMP)
Commission
Essential Services Commission, established under the Essential Services Commission Act 2002
CPI Consumer Price Index (Adelaide, All Groups)
Council City of Playford
CWMS Community Wastewater Management System
ESC Act Essential Services Commission Act 2002
F&A Local Government Advice: Framework and Approach – Final Report
FTE Full Time Equivalent
IAMP Infrastructure and asset management plan (also called an AMP)
LG Act Local Government Act 1999
LGA SA Financial Indicators Paper Local Government Association of South Australia, Financial Sustainability Information Paper 9 - Financial Indicators Revised May 2019
LGGC Local Government Grants Commission
LGPI Local Government Price Index
LTFP Long-term financial plan
Regulations Local Government (Financial Management) Regulations 2011
RBA Reserve Bank of Australia
SACES The South Australian Centre for Economic Studies
SEIFA Socio-Economic Indexes for Areas
SMP Strategic management plan
SG Superannuation Guarantee
The scheme or advice Local Government Advice Scheme


Legend: Low-risk Moderate-risk High-risk
Local Government Advice: City of Playford
OFFICIAL
2 OFFICIAL
1 The Commission’s key advice findings for the City of Playford
The Essential Services Commission (Commission) finds the City of Playford’s (Council’s) current and projected financial performance sustainable as it prepares for continued high levels of projected population growth. After a period of significant infrastructure and service expansion, leveraged by substantial borrowings and grant funding, the Council appears, based on historical surpluses, to demonstrate sound operating performance.
Current financial performance:
Unsustainable Potentially Unsustainable Mostly Sustainable Sustainable
Projected financial performance (future):
Unsustainable Potentially Unsustainable Mostly Sustainable Sustainable
Previous financial performance (past ten years):
Unsustainable Potentially Unsustainable Mostly Sustainable Sustainable
The Commission notes the Council’s strategy to reduce its borrowings via the sale of assets (repurpose of assets) and operating surplus growth. However, it is not clear what level of borrowing can be reduced via asset sales in the 10 years to 2032-33. If the Council is unable to fulfill its asset sale strategy, then it risks a greater burden of revenue shifting to its ratepayers
In addition, the Council’s ability to reduce its borrowings via operating surplus growth also highlights the importance of its forecast growth in rateable properties. If the Council overestimates the growth in rateable properties to 2032-33, the burden of debt repayment will fall on existing ratepayers.
Noting that the Council’s projections are somewhat reliant on its high growth assumptions, the Commission considers it important for the Council to ensure that its costs align to actual growth achieved – including having contingency plans to defer or avoid costs and new infrastructure if forecast growth does not transpire. In addition, the Council should focus on achieving scalability so that the marginal cost of serving a new ratepayer is financially sustainable.
OFFICIAL Local Government Advice: City of Playford 3 OFFICIAL
Budgeting considerations
1. Continue its good practice of reviewing inflation forecasts in its budget and forward projections from 2024-25, given the potential for higher short-term inflation outcomes, followed by a return to long-term averages.
2. Continue its good practice of reviewing the rateable property growth forecasts in budget projections each year, to ensure that they remain current and do not create a need for additional rate increases to generate the same level of projected revenue.
Continue to provide evidence of ongoing cost efficiencies
3. Continue its good practice of reporting any actual and projected cost savings in its annual budget (and long-term financial plan, as appropriate), to provide evidence of constraining cost growth and achieving efficiency across its operations and service delivery.
4. Include efficiency goals and projected cost savings in its long-term financial plan, to provide further evidence of projected cost growth constraint and efficiencies across its operations and service deliveries.
Continue to manage borrowing risk
5. Reduce its level of net financial liabilities, as forecast in its latest long-term financial plan, and continue to focus on asset sales or disposals as one of its strategies to help reduce debt.
6. Improve transparency on borrowing assumptions, including loan facilities and loan terms, in its long-term financial plan.
Containing rate levels
7. Continue to monitor average rate rises to help reduce cost of living pressure on the community.
OFFICIAL Local Government Advice: City of Playford 4 OFFICIAL
2 About the advice
The Essential Services Commission (Commission), South Australia’s independent economic regulator and advisory body, has been given a role by the Parliament to provide advice on material changes proposed by local Councils in relation to elements of their strategic management plans (SMPs) and on the proposed revenue sources, including rates, which underpin those plans. 1
One of the main purposes of the Local Government Advice Scheme (advice or the scheme) is to support Councils to make ‘financially sustainable’ decisions relating to their annual business plans and budgets in the context of their long-term financial plans (LTFPs) and infrastructure and asset management plans (IAMPs) 2 – both required as part of a Council’s SMP. 3 Financial sustainability is considered to encompass intergenerational equity, 4 as well as program (service level) and rates stability. 5 The other main purpose is for the Commission to consider ratepayer contributions in the context of revenue sources, as outlined in the LTFP. 6 In addition, the Commission has discretion to provide advice on any other aspect of a Council's LTFP or IAMP it considers appropriate, having regard to the circumstances of that Council 7
The first cycle of the scheme extends over four years from 2022-23 to 2025-26, and the Commission has selected 17 Councils for advice in the second scheme year (2023-24), including the Council
This report provides the Local Government Advice for the Council in 2023-24.
The Council is obliged under the Local Government Act 1999 (LG Act) to publish this advice and its response, if applicable, in its 2024-25 annual business plan (including any draft annual business plan) and subsequent plans until the next cycle of the scheme. 8 It does not need to publish the attachment to the advice (these will be available with the advice on the Commission’s website 9), nor is it compelled under the LG Act to follow the advice.
The Commission thanks the Council for providing relevant information and engaging with Commission staff to assist the Commission in preparing this advice.
2.1 Summary of advice
Historically, the Council’s community has had strong rateable property growth, accompanied by strong infrastructure growth and increasing contributions from ratepayers and government grants. In general, the Commission finds the Council’s current financial position sustainable, on balance, with small historical and projected operating surpluses. However, there are some risks to the income and expense forecasts and the Council’s strategy to reduce its borrowings
The Council is one of South Australia’s fastest growing areas. In 2022-23, the Council had 44,407 rateable properties. The Council expects this to increase to 46,306 in 2023-24, a 4.3 percent growth in rateable properties. 10
The Council’s cost base is expected to rise in the short-term, driven by further growth projections, with the Council forecasting an average of 1,075 new properties each year from 2023-24 to 2032-33. This growth will become embedded into the underlying cost base of the Council. In addition, the Council has
1 Amendments to the LG Act (s122(1c) to (1k) and (9)) specify the responsibilities for the Commission and local Councils for the Local Government Scheme Advice. The Commission must provide advice to each Council in accordance with the matters outlined in s122(1e), (1f) and (1g).
2 Commonly referred to as asset management plans.
3 The objectives of the advice with reference to a Council’s LTFP and IAMPs are presented under LG Act, s122(1g). LG Act s122(1) specifies the requirements of a Council’s SMP, including the LTFP and IAMPs.
4 ‘Intergenerational equity’ relates to fairly sharing services and the revenue generated to fund the services between current and future ratepayers.
5 Commission, Framework and Approach – Final Report, August 2022, pp. 2-3, available at www.escosa.sa.gov.au/advice/advice-to-local-government
6 LG Act s122(1f)(a) and (1g)(a)(ii).
7 LG Act s122(1f)(b) and (1g)(b).
8 LG Act s122(1h).
9 The Commission must publish its advice under LG Act s122(1i)(a).
10 City of Playford, 2023-24 annual business plan, June 2023, p. 60
OFFICIAL Local Government Advice: City of Playford 5 OFFICIAL
factored this growth into its additional rate revenue estimates. Therefore, the future sustainability of the Council is strongly linked to its expectations regarding the further development of the community.
The Council has predominantly used borrowings from the Local Government Finance Authority of South Australia (LGFA) to fund its renewal of existing assets and acquisition of new and upgraded assets. In doing so, the Council’s net financial liabilities ratio 11 has been outside (or above) the suggested target range (the 10-year average to 2021-22 was 121.3 percent). The Council has forecast a reduction in its net financial liabilities ratio from a peak of 88.4 percent in 2023-24 to an average of 49.9 percent in the five years to 2032-33. The reduction in the ratio from 2022-23 to 2031-32 is proposed to come from the progressive repayment of total borrowings ($33.1 million over the next ten years to 2032-33), via the sale of assets and from operating surplus growth.
The Council’s forward projections from 2023-24 (in its LTFP) forecast a slightly improved financial sustainability outlook as a result of the forecast rate of operating revenue growth set to slightly outpace the forecast rate of expense growth with:
average growth in rates and expenses per property below the Reserve Bank of Australia (RBA)based forecast inflation rate (and generally aligned with the Council’s forecast inflation), and
a reduction in its net financial liabilities ratio from a progressive repayment of total borrowings (of $33.1 million over the next ten years to 2032-33), via the sale of assets 12 and forecast available net annual cashflow
The Commission notes the Council’s current good practice of reporting cost savings (the Council has identified $0.6 million of savings during the 2023-24 budget process) However, these savings equate to only 0.4 percent of the Council’s total forecast expenses in 2023-24. 13
The Commission encourages the Council to include efficiency goals and challenging projected cost savings in its long-term financial plan that could provide some mitigation if the forecast increase in rateable properties does not arise There are also other opportunities for the Council to be more transparent about its price, service level and efficiency-related assumptions in its forward cost projections. In general, a transparent focus on cost constraint should help the Council to identify opportunities to reduce any affordability risk emerging for residential ratepayers, who account for the major share of the rates revenue.
2.2 Detailed advice findings
The next sections summarise the Commission’s more detailed observations and advice findings regarding the Council’s material changes to its 2023-24 plans (compared with the previous year’s plans), its financial sustainability (in the context of its long-term operating performance, net financial liabilities, and asset renewals expenditure) and its current and projected rate levels.
In providing this advice, the Commission has followed the approach explained in the Framework and Approach – Final Report (F&A). The attachment explores these matters further. 14
2.2.1 Advice on material plan amendments in 2023-24
Key Point:

Projected improvement in operating performance driven by higher rates and grant revenue and reduced level of net financial liabilities
11 The net financial liabilities ratio is defined as: Net financial liabilities ÷ Total operating income. This ratio measures the extent to which a Council’s total operating income covers, or otherwise, its net financial liabilities. The suggested LGA target range is between zero and 100 percent of total operating income, but possibly higher in some circumstances (LGA SA Financial Indicators Paper, pp. 7-8).
12 City of Playford, 2023-24 2032 long-term financial plan, June 2023, pp. 18
13 City of Playford’s total expenses for 2023-24 are forecast to be $131,187,342 City of Playford Council, 2024 –2033 long-term financial plan, June 2023, p. 35
14 The attachment will be available on the Commission’s website with the Advice
OFFICIAL Local Government Advice: City of Playford 6 OFFICIAL
The Council’s 2023-24 LTFP includes an improvement in projected operating performance and increases in projected capital expenditure estimates, compared with the 2022-23 forecasts (for the nineyear overlapping period in both LTFPs: 2023-24 to 2031-32), as follows:
An additional improvement of $145.5 million (11 percent) in total operating income. Most of this increase is due to higher rates revenue, which increased by $104.5 million (10.3 percent) on the 2022-23 estimates (for the period 2023-24 to 2031-32). Grants, subsidies and contributions have also increased by $40.6 million (21 percent)
An additional $137.2 million or 11.2 percent in total operating expenses. This includes an additional $57 million (12.7 percent) for ‘materials, contracts and other’ expenses, and an additional $34.1 million (7 percent) in ‘employee costs’. Depreciation also increased by $39.9 million (14 percent)
The table below highlights the Council’s 10-year CPI assumptions between the 2022-23 and 2023-24 LTFPs, the Commission has reviewed the nine overlapping years’ CPI statistics: 2023-24 to 2031-32
The Council’s current inflation forecasts present a risk to its cost and income projections in the current inflationary environment The RBA currently forecasts the CPI (Australia-wide) to increase by 3.6 percent in the year to the June 2024 quarter and by 3.1 percent in the year to June 2025. Thereafter, it is reasonable to anticipate a return to long-run averages (and growth of 2.5 percent per annum from 202526, based on the midpoint of the RBA’s 2 to 3 percent target range). 15
The Commission notes that the Council’s stated assumptions for indexation in its 2023-24 LTFP are based on its annual review of these forecasts. The Commission considers that annual reviews of assumptions to reflect best practice and supports the Council in continuing to do so through its annual process. For this reason, it would be appropriate for the Council to:
1. Continue its good practice of reviewing its inflation forecasts in its budget and forward projections from 2024-25, given the potential for higher short-term inflation outcomes, followed by a return to long-term averages.
2.2.2 Advice on financial sustainability
Operating performance
Key Points:
Operating surpluses have been consistently achieved between 2016-17 to 2022-23.
The operating surplus ratio is forecast to meet the suggested LGA target range in each year to 2032-33, averaging 3.3 percent

Operating expenses from 2012-13 to 2022-23 have experienced moderate growth above CPI
15 RBA, Forecast Table - August 2023, available at https://www.rba.gov.au/publications/smp/2023/aug/forecasts.html
OFFICIAL Local Government Advice: City of Playford 7 OFFICIAL
Consumer Price Index 23-24 24-25 25-26 26-27 27-28 28-29 29-30 30-31 31-32 Deloitte Forecast Economics 2022-23 LTFP 2.30% 2.30% 2.40% 2.30% 2.40% 2.50% 2.30% 2.40% 2.30% Deloitte Forecast Economics 2023 -24 LTFP 7.90% 2.58% 2.47% 2.51% 2.52% 2.43% 2.29% 2.29% 2.38%
Average operating expenses per rateable property are projected to increase by 1.7 percent each year to 2032-33.
Continuous improvements have resulted in cost savings of $16.9 million since 2011
The Council has consistently recorded operating surpluses 16 since 2016-17 and the operating surplus ratio 17 is forecast to meet the suggested LGA target range in each year to 2032-33. In the 10 years to 2021-22, the average operating surplus ratio performance was 3.5 percent That is within the lower portion of the suggested LGA target range for the ratio. In the same period, the Council’s operating income growth averaged 5.3 percent per annum, higher than the rate of operating expense growth (averaging 3.3 percent per annum). 18
The Council received a combination of additional rates, statutory charges, user charges and ‘grants, subsidies and contributions’ income over this period to generate its relatively strong operating income growth.
On the cost side, its ‘materials, contracts and other’ expense increased at a conservative level (averaging 2.6 percent per annum) from 2012-13 to 2021-22, given the average annual CPI growth of 2.0 percent. 19 On the other hand, its ‘employee’ and depreciation expenses both increased by an average of 3.3 and 5.2 percent per annum.
The estimated increase in the rate of growth in operating expenses (to an average of 4.0 percent per annum to 2032-33, which is above the RBA-based forecast inflation 20), combined with operating income growth of 3.7 percent per annum (also above the RBA-based forecast inflation), is expected to slightly reduce the Council’s operating performance. The Council has projected smaller operating surpluses to 2032-33, averaging 3.3 percent.
Average operating expenses per rateable property are projected to increase at 1.7 percent (nominally) in the 10 years to 2031-32 (the increase in the 10 years to 2021-22 was also 1.7 percent). At the same time, average operating income per property is forecast to increase by 1.3 percent (nominally), below forecast inflation These projections highlight the importance of the forecast growth in rateable properties in minimising the impact of rising costs on households. The Council’s assumed average growth is 2.3 percent per annum (to 2031-32) in rateable properties, which is higher than historical growth of 1.7 percent per annum (10 years to 2021-22).
If the forecast growth in rateable properties does not occur, and the Council cannot reverse the increases in costs, this could place pressure on rate levels., while simultaneously reducing the speed at which borrowings are drawn down. This could result in the need for further asset sales. Notwithstanding this, the Commission notes the Council’s good practice of reviewing its rateable property forecast annually and encourages the Council to:
2. Continue its good practice of reviewing the rateable property growth forecasts in its budget projections each year to ensure that they remain current and do not create a need for additional rate increases to generate the same level of projected revenue.
16 This means the Council’s operating income (including rates and other revenue sources but excluding capital grants, subsidies, and contributions) have exceeded operating expenses (including depreciation).
17 The operating surplus ratio is defined as: Operating Surplus (Deficit) ÷ Total Operating Income. The general target is to achieve, on average over time, an operating surplus ratio of between zero and 10 percent (Local Government Association of South Australia, Financial Sustainability Information Paper 9 - Financial Indicators Revised, May 2019 (LGA SA Financial Indicators Paper), p. 6).
18 Based on the compound average annual growth rate formula (which is the adopted approach to calculating average annual growth rates throughout the Commission’s advice).
19 CPI (All groups). Average annual growth in the LGPI published by the South Australian Centre for Economic Studies was similar (at 2.0 percent), available at https://www.adelaide.edu.au/saces/economic-and-socialindicators/local-government-price-index
20 The forecast average annual growth in the CPI from 2022-23 to 2031-32 is estimated to be 2.6 percent based on the RBA forecasts for the CPI (Australia-wide) to June 2025 (and the Commission’s calculations of average annual percentage growth) and the midpoint of the RBA’s target range (2.5 percent) from 2025-26.
OFFICIAL Local Government Advice: City of Playford 8 OFFICIAL
The Commission has observed the current good practice of the Council to focus on continuous improvement resulting in savings: over $16.9 million since 2011 21 As an example, it has factored in savings of approximately $0.6 million to its expense estimates in 2023-24, compared to these items in 2022-23. 22 However, the Commission notes that the Council has not set any subsequent year efficiency goals in its LTFP.
To ensure that the Council is positioned to achieve the forecast real term reduction in its cost base and improve its operating performance (without the need for further rate increases above inflation), the Commission encourages it to:
3. Continue its good practice of reporting any actual and projected cost savings in its annual budget (and long-term financial plan, as appropriate), to provide evidence of constraining cost growth and achieving efficiency across its operations and service delivery.
4. Include efficiency goals and projected cost savings in its long-term financial plan, to provide further evidence of projected cost growth constraint and efficiencies across its operations and service deliveries
Net financial liabilities
Key Points:

The net financial liabilities ratio has been above the LGA target range between 2012-13 to 202122.
The net financial liabilities ratio in the ten years to 2032-33 is forecast to be an average of 49.9 percent as a result of progressive repayment of debt, asset sales and growth of operating income
Current high level of debt of $101 million with an average debt of $105.8 million dollars between 2012-13 to 2021-22
Over the past 10 years, the Council’s net financial liabilities ratio has been above the suggested LGA target range (averaging 121.3 percent from 2012-13 to 2021-22). 23 The Council has consistently used a high level of borrowings to finance (in part) its capital expenditure (the average level of borrowings from 2012-13 to 2021-22 was $105.8 million)
While the Council’s performance is above the LGA target range, the Commission notes the significant outlays on new infrastructure required for a high growth Council. The Commission also notes that, in the 2023-24 budget process, the Council’s public consultation report received only two mentions (out of a total of 48) that expressed concerns about how it is planning to reduce debt 24 The Commission also notes that the Council has achieved consistent operating surpluses (seven operating surpluses in the 10 years to 2021-22).
The Council has forecast a reduction in its net financial liabilities ratio from a peak of 88.4 percent in 2023-24 to an average of 49.9 percent in the five years to 2032-33. The reduction in the ratio from 202324 to 2032-33 comes from the progressive repayment of total borrowings (of $33.1 million over the next
21 City of Playford, 2024 – 2033 long-term financial plan, June 2023, pp. 17, available at City-of-Playford-LTFP-23-24_2023-07-05-033606_mqwd.pdf
22 City of Playford Council, 2024 – 2033 long-term financial plan, June 2023, p. 17
23 The net financial liabilities ratio is defined as: Net financial liabilities ÷ Total operating income. This ratio measures the extent to which a Council’s total operating income covers, or otherwise, its net financial liabilities. The suggested LGA target range is between zero and 100 percent of total operating income, but possibly higher in some circumstances (LGA SA Financial Indicators Paper, pp. 7-8).
24 City of Playford, Ordinary Council Meeting Agenda -27 June 2023, Item 14.5 Draft 2023/2024 annual business plan, What We Heard Report – Public Consultation, available at https://cdn.playford.sa.gov.au/agendas-minutes/attachments/06-27-June-2023-Attachments-for-Items-14.514.7.pdf
OFFICIAL Local Government Advice: City of Playford 9 OFFICIAL
ten years to 2032-33), via the sale of assets and operating income growth In doing so, the Commission supports the Council’s strategy to:
5. Reduce its level of net financial liabilities as forecast in its latest long-term financial plan and continue to focus on asset sales or disposals as one of its strategies to help reduce debt.
The Council only includes proposed asset sales when there is a high level of certainty associated with the disposal. 25 As a result, it is not clear what level of borrowing can be reduced via asset sales in the 10 years to 2032-33 relative to using operating surpluses to repay borrowings. If the Council is unable to fulfill its asset sale strategy, then it risks a greater burden of revenue shifting to its ratepayers in order to achieve operating surpluses that can be used to repay borrowings.
As previously mentioned, these projections (the progressive repayment of borrowings of $33.1 million to 2032-33) also indicate the importance of the forecast growth in rateable properties and ensuring that the Council undertakes a robust process when forecasting rateable property growth. If the Council overestimates the growth in rateable properties to 2032-33, it also risks a greater burden of revenue shifting to existing ratepayers in order to achieve operating surpluses that can be used to repay borrowings.
In addition, the Council has not fully disclosed the assumptions underpinning its borrowing forecasts in its LTFP (such as loan facilities and/or terms, if applicable). However, the Council has disclosed its interest rate assumptions for its borrowing facilities, along with sensitivity analysis. According to its 2023-24 LTFP, the Council has a $3.7 million impact to its operating expenditure over 10 years based on a 1 percent interest rate increase each year over its 10-year LTFP. The Commission considers that it would be appropriate for it to:
6. Improve transparency on borrowing assumptions, including loan facilities and loan terms, in the Council’s long-term financial plan.
Asset renewals expenditure
Key Points:
The asset renewal funding ratio averaged 86 percent from 2012-13 to 2021-22 and averaged $16.3 million per annum
The forecast asset renewal funding ratio until 2032-33 is 100 percent with an average of $25 million spend per annum
The forecast capital expenditure on new and upgraded assets will average $19.8 million to 2032-33.
Depreciation expenses are growing higher than forecast renewal expenditure, causing the Council to not meet the average rate of asset consumption based on current projected depreciation expenses
The Council's asset renewal funding ratio 26 averaged 86 percent for the 10 years to 2022-23, which is close to but below the lower end of the suggested LGA target range of 90 to 110 percent. The Council is forecast to consistently meet the suggested target for the ratio in the 9 years to 2032-33 (averaging 100 percent).
The Council’s spending on the renewal of assets averaged $16.3 million per annum between 2012-13 to 2021-22. From 2023-24, the Council is adjusting its asset renewals spending profile, with higher
25 City of Playford, 2023-24 2032 long-term financial plan, June 2023, pp. 18
26 The IAMP-based method is the current industry standard whereby asset renewal/replacement expenditure is divided by the recommended expenditure in the IAMP (or AMP). Ideally, this will show the extent to which a Council’s renewal or replacement expenditure matches the need for this expenditure, as recommended by the plan. The suggested LGA target range for the ratio is 90 to 110 percent (LGA SA Financial Indicators Paper, p.9).
OFFICIAL Local Government Advice: City of Playford 10 OFFICIAL
projected annual renewal expenditure averaging $25 million to 2032-33, in nominal terms. This compares to a projected capital spending on new and upgraded assets averaging $19.8 million to 203233, and a projected slight increase in the value of assets per property over this period.
When the asset renewal funding ratio is calculated by the depreciation-based method, 27 it is forecast to average 68 percent over the period 2023-24 to 2032-33. The ratio is impacted by the Council’s renewal expenditure which is quite low due to its relatively new asset base (average asset age is 21 years). 28
Renewal expenditure is expected to increase as the council’s average asset age increases. The Commission notes that the Council is of a young age (the council was formed in 1997 through the merger of the City of Elizabeth and City of Munno Parra), in a high growth area with a high number of new assets recently acquired or gifted. 29
2.2.3 Advice on current and projected rate levels
Key Points:
Rate revenue per property growth has averaged 3.4 percent or $52 per annum for each property in the period between 2012-13 and 2021-22, which is 1.4 percent above CPI for the same period.
The forecast rate increase for 2023-24 is 10.7 percent or $225 per property.
The Council is one of South Australia’s fastest growing council areas, with rateable properties forecast to increase by 4.3 percent in 2023-24 and averaging 3 percent until 2032-33
Based on current projected increases in rateable properties of 4.3 percent, between 2023-24 to 2032-33 the average rate across all categories is forecast to increase by 2.2 percent which is below the RBA-based forecast average of inflation of 2.6 percent per annum
The Council's rate revenue per property growth has averaged 3.4 percent or $52 per annum for each property in the period between 2012-13 and 2021-22. This has exceeded CPI growth of an average of 2.0 percent per annum over this period, resulting in rates increasing in real terms (but also encompassing 1.5 percent average annual growth in rateable property numbers). 30 Current rate levels partially reflect the Council’s recent history of spending growth, predominantly on capital expenditure (on renewals, and new and upgraded assets), higher employee-related costs, and its focus to improve its operating performance.
The Council has budgeted for an average rate increase (for general and commercial ratepayers) of 10.7 percent, or $225, per property for its existing ratepayers in 2023-24. 31 This was higher than anticipated in its 2022-23 LTFP projections (2.78 percent for existing rateable properties). The rates increase reflects higher short-term inflation (estimated by the Council to be 7.9 percent) along with the Council’s target to meet a 1 percent structural surplus 32 As noted earlier, the Council is one of South Australia’s fastest growing council areas: in 2022-23, it had 44,407 rateable properties, and it expects this to increase to 46,306 in 2023-24 - a 4.3 percent growth in rateable properties. 33
The Council's general rate revenue, consists of two components: one based on a fixed charge and the other on the value of the land (differential charge).
27 Where asset renewal/replacement expenditure is divided by depreciation expenses as was known as the asset sustainability ratio until 2018
28 City of Playford, 2023-24 strategic asset management Plan, June 2023, pp. 19
29 City of Playford, Error of fact check letter, January 2024, pp1.
30 CPI Adelaide (All groups). Average annual growth in the LGPI published by the South Australian Centre for Economic Studies was similar (at 2.0 percent). Available at https://www.adelaide.edu.au/saces/economic-andsocial-indicators/local-government-price-index
31 Based on the Council’s 2023-24 annual business plan and its Excel template (with the 2023-24 forecasts) provided to the Commission. The Commission has used $105.615 million (in 2023 24 budgeted rates revenue) compared to unaudited 2022-23 estimates. Individual rate level changes may be higher or lower depending on the rates category and property value.
32 City of Playford, 2023-24 long-term financial plan, June 2023, p. 16
33 City of Playford, 2023-24 annual business plan, June 2023, p. 60
OFFICIAL
11 OFFICIAL
Local Government Advice: City of Playford
After applying rebates, the Council will collect general fixed rate revenue equal to 50 percent of its general rates revenue. This is the maximum amount that it can collect from the fixed charge under the Council’s rating structure and LG Act. 34 35 In 2023-24, the Council's fixed charge will be $1,111.90 per rateable property, with the remaining 50 percent of general rates (after rebates) to be collected from a differential charge. 36
The differential charge payable per property is based on a rate in the dollar that is applied to the capital value of property. The rate in the dollar may vary based on land use and the Council currently has two rate types declared, commercial and general.
The Commission notes that the average differential charge per rateable property for the general type will increase to $707 in 2023-24 (from $664 in 2022-23). As such, the average rate per rateable property for the general type will be $1,818.90, of which $1,111.90 is the fixed charge applicable to all rateable properties.
The Commission also notes that there is no differentiation in the commercial rate to reflect the type of industry (for example light versus heavy) or type of commercial property (for example office versus retail
On balance, affordability risk within the community for these further rate increases appears to be high. The current economic environment is likely to be putting more pressure on the communities’ capacity to pay for further rate increases. The Council has a relatively low socio-economic index (SEIFA) economic resources ranking 37 and already has relatively high average rates (across most ratepayers). In the 202324 budget process, the Council’s public consultation report received 23 submissions (out of a total of 48) that expressed concerns about further rate increases. 38 For these reasons, the Commission suggests that the Council:
7. Continue to monitor average rate rises to help reduce cost of living pressure on the community.
2.3 The Commission’s next advice and focus areas
In the next cycle of the scheme, the Commission will review and report upon the Council’s:
progress in reducing its net financial liabilities,
ongoing performance against its LTFP estimates (including review of growth assumptions),
achievement of cost savings and efficiencies and its continued reporting of these in its plans, and
actions to address any misalignment between the capital expenditure and depreciation estimates in its LTFP and various AMPs.
34 City of Playford, 2023-24 annual business plan, June 2023, p. 59
35 Local Government Act 1999 (LG Act) s151(10)
36 City of Playford, Rating Policy, June 2023, p 1 available at https://cdn.playford.sa.gov.au/general-downloads/Rating-Policy-23-24.pdf
37 The City of Playford area is ranked 10 among 71 South Australian ‘local government areas’ (including Anangu Pitjantjatjara and Maralinga Tjarutja Aboriginal community areas and ‘unincorporated SA’) on the Australian Bureau of Statistics SEIFA Index of Economic Resources (2016), where a lower score (eg, 1) denotes relatively lower access to economic resources in general, compared with other areas, available at https://www.abs.gov.au/statistics/people/people-and-communities/socio-economic-indexes-areas-seifaaustralia/2021
38 City of Playford, Ordinary Council Meeting Agenda -27 June 2023, Item 14.5 Draft 2023/2024 annual business plan, What We Heard Report – Public Consultation, available at https://cdn.playford.sa.gov.au/agendas-minutes/attachments/06-27-June-2023-Attachments-for-Items-14.514.7.pdf
OFFICIAL Local Government Advice: City of Playford 12 OFFICIAL

The Essential Services Commission
Level 1, 151 Pirie Street Adelaide SA 5000
GPO Box 2605 Adelaide SA 5001
T 08 8463 4444
E escosa@escosa.sa.gov.au | W www.escosa.sa.gov.au
February 2024
OFFICIAL OFFICIAL
Local Government Advice - Attachment
City of Playford
Enquiries concerning this advice should be addressed to:
Essential Services Commission
GPO Box 2605
Adelaide SA 5001
Telephone: (08) 8463 4444
Freecall: 1800 633 592 (SA and mobiles only)
E-mail: advice@escosa.sa.gov.au
Web: www.escosa.sa.gov.au
OFFICIAL Local Government Advice: City of Playford – Attachment 2 OFFICIAL The Essential Services Commission is an independent statutory authority with functions in a range of essential services including water, sewerage, electricity, gas, rail and maritime services, and also has a general advisory function on economic matters. For more information, please visit www.escosa.sa.gov.au
OFFICIAL Local Government Advice: City of Playford – Attachment 1 OFFICIAL Table of contents A The Commission’s approach 2 B Material plan amendments in 2023-24 4 B.1 Changes to operating performance 4 B.2 Indexation adjustments 5 B.3 Increase to capital expenditure estimates 6 B.4 Increase in total liabilities 6 C Financial sustainability 7 C.1 Operating performance 7 C.2 Net financial liabilities 9 C.3 Asset renewals expenditure 10 D Current and projected rate levels 13 D.1 Historical rates growth 13 D.2 Proposed 2023-24 rate increases 14 D.3 Projected further rate increases 14 D.4 Affordability risk 14
A The Commission’s approach
In providing the Advice for the City of Playford (Council), the Essential Services Commission (Commission) has followed the approach in the Framework and Approach – Final Report (F&A). 1
The Commission has considered the Council’s strategic management plan (SMP) documents (as in the box below), with a particular focus on its performance and outlook against three financial indicators: the operating surplus ratio, the net financial liabilities ratio and the asset renewal funding ratio. 2 Analysis of these three indicators captures financial and service sustainability, in addition to cost control and affordability risk. 3
2023-24 Annual Business Plan (adopted June 2023)
2022-23 Annual Business Plan (adopted June 2022)
2023-2032 Long Term Financial Plan (adopted June 2022)
2024-2033 Long Term Financial Plan (adopted June 2023)
2023-2024 Strategic Asset Management Plan (adopted June 2023)
2021-22 Annual Report (adopted October 2022)
The Commission notes that most of the Council’s asset base is covered by its existing strategic asset management plan, and asset valuations for those assets are carried out internally on an annual basis with an external independent review carried out every 5 years.
Given that the Commission must, in providing advice, have regard to the objective of Councils maintaining and implementing their infrastructure and asset management plans (IAMPs) (usually termed AMPs) and long-term financial plans (LTFPs), 4 it has also considered the Council’s performance in that context. Findings regarding the content of the Council’s AMPs, and the alignment between its LTFP and AMPs, 5 are discussed in section C.3.
The Commission has also reviewed the Council’s template data, which contains its 2023-24 LTFP forecasts for 2023-24 to 2032-33, 2022-23 LTFP forecasts, historical financial data, the number of rateable properties and staff (Full Time Equivalent (FTE)) numbers from 2012-13 onwards. 6 7 All charts and tables in the Advice are primarily sourced from these datasets. In addition, the Commission has reviewed the Council’s audit committee reports and other public information.
The Commission has reported estimates in nominal terms, for consistency with the Council’s plans and actual rate levels, but it has compared estimated inflation impacts to these trends as a guide to identify ‘real’ rather than ‘inflationary’ effects. In the charts, the Consumer Price Index (CPI) line shows the cumulative growth in the CPI (Adelaide) series from 2012-13, and then projections of this series from
1 Commission, Framework and Approach – Final Report, August 2022, available at www.escosa.sa.gov.au/advice/advice-to-local-government
2 The indicators are specified in the Local Government (Financial Management) Regulations 2011. Since 2011, each Council has been required to refer to these three indicators in its plans, annual budget, mid-year budget review and annual financial statements. The Councils can adopt their own target range for each ratio, but the Commission has adopted the previously suggested Local Government Association (LGA) target ranges as a basis for its analysis, which were established and agreed during the development of the LGA Financial Sustainability Papers (2006-2011).
3 The F&A listed 29 analytical questions that the Commission has answered in assessing the Council’s performance against these indicators to determine affordability, cost control and other sustainability risks.
4 Local Government Act 1999 (LG Act) s122(1g)(a)(i).
5 As required under s122(1b) of the LG Act.
6 Sourced from the Local Government Grants Commission (including data reported by the Office of the Valuer-General) and the Council’s data.
7 The Council’s estimates for the 2022-23 financial year, relied on at the time of preparing this advice, were unaudited.
OFFICIAL Local Government Advice: City of Playford – Attachment 2 OFFICIAL
2023-24 based on the Reserve Bank of Australia (RBA) (Australia-wide) inflation forecasts (to the December quarter 2025), and the midpoint of the RBA target range (2.5 percent) thereafter.
Finally, in formulating this Advice, the Commission has had regard to all discussions and engagement with the Council, including the face-to-face onsite meeting at the Council chambers and the individual circumstances of the Council, consisting of:
its location as a metropolitan fringe Council,
its income level ($124.2 million), and
the size of its rates base (more than 43,000 ratepayers 8).
Summary of the City of Playford’s financial sustainability performance and the Commission’s risk assessment
Financial sustainability indicators:
Operating surplus ratio (target 0-10%)
Net financial liabilities ratio (target 0-100%)
Asset renewal funding ratio (target 90-110%)
Identified Risks:
Last 10 years from 2012-13 (Actual performance)
Operating Deficits
2022-23 estimate
Next 10 years from 2023-24 (Council forecasts)
Ratio within target range > Surpluses projected to 2032-33 >
Ratio not met historically > Ratio projected within target from 2022-23 >
Spending on renewal works below target range > Volatility in renewal works spending & some years below target range
Cost control risk Operating expenses per property average growth 1.9% pa to 2022-23 (CPI 2.6%)
Projected asset renewal in LTFP to align with AMP - required spending (ratio 100%)
> Projected operating expense per property average growth 1.7% to 203233 (CPI 2.6%)
Affordability risk High rates revenue per property average growth of 3.3% pa to 2022-23 (CPI 2.6%)
Projected rate revenue per property average growth below forecast CPI (CPI 2.6%) >
Ratio outside suggested LGA target range or higher risk
Ratio close to suggested LGA target range or medium risk
Ratio within suggested LGA target range or lower risk
8 Based on the estimated number of property assessments in 2021-22.
Local Government Advice: City of Playford – Attachment
OFFICIAL
3 OFFICIAL
B Material plan amendments in 2023-24
The Council has made various amendments to its 2023-24 budget and forward projections, partly for inflation and partly for other revenue and spending initiatives. The material amendments to some of its main financial forecasts are listed in the table below (in nominal terms). 9 To ensure a comparable analysis of estimates between the 2022-23 and 2023-24 LTFPs, the Commission has reviewed nine overlapping years’ statistics, 2023-24 to 2031-32, and identified material amendments accordingly. Selected Financial Item
Sum of 2023-24 to 2031-32 estimates in 2022-23 LTFP ($ million)
Sum of 2023-24 to 2031-32 estimates in 2023-24 LTFP ($ million)
Change in 2023-24 estimates ($ million)
Change in 2023-24 estimates (percent)
B.1 Changes to operating performance
In its 2023-24 LTFP, the Council increased its operating income projections to 2031-32 by 11.2 percent in total compared with its 2022-23 LTFP estimates (from 2023-24). Rates income projections increased by $104.5 million (or 10.3 percent). Most of that increase is attributable to rate increases of $63.9 million and a further $8.8 million, due to growth in the number of rateable properties 11 Grant income increased by 21.5 percent, or $40.6 million ,due to the Council receiving $12.1 million in Federal assistance grants and $10.6 million from the Roads to Recovery Program. 12
The Council’s operating expense estimates increased by $137.2 million, or 10.9 percent, in its 2023-24 LTFP estimates (compared with its 2022-23 LTFP estimates), which exceeds the impact of revised inflation forecasts but incorporates continuous improvement savings of $559,000 in 2023-24. 13 Those
9 This table shows only selected financial items to demonstrate the material amendments made by the Council in its 2023-24 estimates. It excludes various financial items and individual items do not sum to totals.
10 The capital expenditure estimates are based on the 2023-24 LTFP estimates provided by the Council to the Commission (in an Excel template).
11 The rates income estimates are based on the material amendments reasons estimates for the set of nine years forecast in both the 2022-23 and 2023-24 LTFP projections provided by the Council to the Commission (in an Excel template).
12 See footnote 11
13 City of Playford, 2024 – 2033 annual business plan, June 2023, pp. 7, available at https://cdn.playford.sa.gov.au/general-downloads/City-of-Playford-ABP-23-24_2023-07-05-033559_uyyu.pdf
OFFICIAL Local Government Advice: City of Playford – Attachment 4 OFFICIAL
Grants, subsidies and contributions operating income 188.7 229.4 40.7 21.6 Rates 1,011.0 1,115.5 104.5 10.3 Employee Expenses 490.6 524.7 34.1 7.0 Materials, contracts and other expenses 448.3 505.4 57.0 12.7 Depreciation, amortisation and impairment expenses 286.1 326.1 39.9 14.0 Total Expenses 1,256.9 1,394.1 137.2 10.9 Capital expenditure on renewal of assets 10 152.9 218.4 65.5 42.9 Total Liabilities 1,001.4 1,053.3 51.8 5.2
savings equate to 0.4 percent of the Council’s total forecast expenses in 2023-24. 14 Employee costs increased by $34.1 million or 7 percent, partly due to new budgeted roles to maintain services and infrastructure standards for the forecast growing number of residents and also due to higher superannuation charges to 2025 15 and higher inflation. Materials, contracts and other expenses increased by $57 million, or 12.7 percent, due to increases in capital works of $25.9 million, electricity of $5.9 million and $21.8 million to account for higher inflation.
The Council’s historical and projected operating performance is discussed further in section C.1
B.2 Indexation adjustments
The table below highlights the Council's 10 year CPI assumptions between the 2022-23 and 2023-24 LTFPs
Based on updated inflation assumptions in the Council’s 2023-24 LTFP, an increase in cost and revenue estimates (excluding employee costs), by up to 6 percent over the 2023-24 to 2031-32 forecast period, 16 compared with the same estimates in its 2022-23 LTFP, could reflect higher inflation forecasts. The Council has adjusted its operating income and expense forecasts by amounts higher than its adjusted inflation forecasts (increases of 11.2 percent and 10.9 percent on 2022-23 estimates 17). This suggests higher forecasts in real terms.
The Council’s current inflation forecasts present a risk to its cost and income projections in the current inflationary environment The RBA currently forecasts the CPI (Australia-wide) to increase by 3.9 percent in the year to the June 2024 quarter and by 3.3 percent in the year to June 2025. Thereafter, it is reasonable to anticipate a return to long-run averages (and growth of 2.5 percent per annum from 202526, based on the midpoint of the RBA’s 2 to 3 percent target range). 18
The Commission notes that the Council’s stated assumptions for indexation in its 2023-24 LTFP are transparent and based on its annual review of these forecasts. The Commission considers that such annual reviews of assumptions to reflect best practice and supports the Council to do so through its annual process. For this reason, it would be appropriate for the Council to:
1. Continue its good practice of reviewing its inflation forecasts in its budget and forward projections from 2024-25, given the potential for higher short-term inflation outcomes, followed by a return to long-term averages.
14 City of Playford’s total expenses for 2023-24 are forecast to be $131,187,342 City of Playford Council, 2024 –2033 Long Term Financial Plan, June 2023, p. 35
15 The Superannuation Guarantee Levy is the amount that an employer is required to pay into a superannuation account on behalf of an employee. From 1 July 2021, the Superannuation Guarantee was legislated to rise in half per cent increments from 9.5 percent each year, until it reaches 12 percent of wages in 2025.
16 The set of nine years forecast in both the 2022-23 and 2023-24 LTFP projections.
17 Based on the overlapping forecast period in both LTFPs (2022-23 to 2031-32 and 2023-24 to 2032-33).
18 RBA, Forecast Table - August 2023, available at https://www.rba.gov.au/publications/smp/2023/aug/forecasts.html
OFFICIAL Local Government Advice: City of Playford – Attachment 5 OFFICIAL
Consumer Price Index 23-24 24-25 25-26 26-27 27-28 28-29 29-30 30-31 31-32 Deloitte
LTFP 2.30% 2.30% 2.40% 2.30% 2.40% 2.50% 2.30% 2.40% 2.30% Deloitte
LTFP 7.90% 2.58% 2.47% 2.51% 2.52% 2.43% 2.29% 2.29% 2.38%
Forecast Economics 2022-23
Forecast Economics 2023 -24
B.3 Increase to capital expenditure estimates
The Council’s 2023-24 LTFP indicates an increase in capital expenditure for new and upgraded assets (by $180.2 million), compared to the previous year’s LTFP (for the period from 2023-24 to 2031-32). The Council has changed its methodology and adopted the good practice of including future work for capital expenditure on new and upgraded assets (previously this was excluded from the LTFP forecast. The Commission encourages the Council to continue this practice.
B.4 Increase in total liabilities
The Council’s 2023-24 LTFP indicates an increase in total liabilities of $51.8 million, or 5.2 percent, compared to the previous year’s LTFP (for the period from 2023-24 to 2031-32). The Council’s current liabilities decreased by $42.1 million, or 14.1 percent, mostly due to a decrease in trade and other payables and borrowings of $39.4 million and $4.9 million (for the period from 2023-24 to 2031-32).
The Council’s non-current liabilities have increased by $93.9 million, or 13.4 percent, compared to the previous year’s LTFP (for the period from 2023-24 to 2031-32). Long-term borrowings have increased by $163.6 million, or 26.4 percent, to fund increased capital works (for the period from 2023-24 to 203132). Other non-current liabilities of $70.2 million were for the Council’s cash advance debenture facility, which was reduced to zero
The Council’s borrowings and net financial liabilities are forecast to be higher in the 2023-24 LTFP than the previous year’s LTFP (for the period from 2023-24 to 2031-32). As a result, the Council's net financial liabilities ratio is forecast to achieve a higher average rate of 68.4 percent (for the period from 2023-24 to 2031-32). This compares to the 2022-23 LTFP which forecast the net financial liabilities ratio to achieve an average rate of 51 percent (for the period from 2023-24 to 2031-32).
The Council’s net financial liabilities outlook is discussed further in section C.2.
OFFICIAL Local Government Advice: City of Playford – Attachment 6 OFFICIAL
C Financial sustainability
C.1 Operating performance
The Council has consistently recorded operating surpluses 19 since 2016-17, and the operating surplus ratio 20 is forecast to meet the suggested LGA target range in each year to 2032-33 (see the left chart below).
Historically, the Council has ensured that its income growth exceeds its expense growth over time (see the right chart below), thereby providing for recurring surpluses. From 2012-13 to 2021-22, operating expenses increased by an average of 3.3 percent per annum, which compares with average operating income growth of 5.3 percent and annual inflation growth of 2.0 percent over this period. 21 Accordingly, the operating surplus ratio averaged 3.5 percent, which demonstrates prudent financial management without excessive surplus levels in the context of the growth in expenses experience
The Council’s operating expense growth (from 2012-13 to 2021-22) was primarily due to an average annual increase in ‘Depreciation, amortisation and impairment’ of 5.2 percent and a 3.3 percent increase in employee costs 22 The right chart over the page shows the nominal increases by expense type in specific time periods. The estimated rate of growth in those expenses projected over the next 10 years (an average of 4 percent per annum and 4.8 percent per annum respectively), combined with higher rates increases, will help the Council’s operating performance remains in surplus


Rates revenue has increased on average by 4.9 percent per annum from 2012-13 to 2021-22 (when rateable property growth averaged 1.5 percent and CPI growth averaged 2.0 percent). Over the same period, user charges’ (accounting for 3 percent of total operating income) increased by an average of 6.1 percent per annum. ‘Grants, subsidies and contributions’ (accounting for 23 percent of total operating income) increased by an average of 7.3 percent per annum; however, the Council is forecasting grants income to remain generally constant in the 10 years to 2032-33 (accounting for 14 percent by 2032-33).
As a result of the generally constant levels in grants income that is forecast to 2032-33, the Council is projecting total income growth of 3.7 percent to 2032-33, with average annual rates growth of 4.6
19 This means that the Council’s operating income (including rates and other revenue sources but excluding capital grants, subsidies, and contributions) have exceeded operating expenses (including depreciation).
20 The operating surplus ratio is defined as: Operating Surplus (Deficit) ÷ Total Operating Income. The general target is to achieve, on average over time, an operating surplus ratio of between zero and 10 percent (Local Government Association of South Australia, Financial Sustainability Information Paper 9 - Financial Indicators Revised, May 2019 (LGA SA Financial Indicators Paper), p. 6).
21 CPI (All groups). Average annual growth in the LGPI published by the South Australian Centre for Economic Studies was similar (at 2.0 percent), available at https://www.adelaide.edu.au/saces/economic-and-socialindicators/local-government-price-index
22 Based on the compound average annual growth rate formula (which is the adopted approach to calculating average annual growth rates throughout the Commission’s advice).
OFFICIAL Local Government Advice: City of Playford – Attachment 7 OFFICIAL
percent to 2032-33 Total income growth and average annual rates growth are forecast to increase above forecast long-term inflation 23
Higher forecast average expense growth of 4.0 percent per annum is also above the RBA-based forecast inflation growth 24 and higher than the Council’s past performance (with average annual growth of 3.3 percent in the 10 years to 2021-22).
The Council’s template data shows that employee numbers are assumed constant at current levels (453 FTEs), and its employee expenses are forecast to increase by an average of 4.8 percent per annum from 2023-24 to 2032-33. In addition, ‘Materials, contracts and other’ expenses and costs for depreciation are forecast to increase by an average of 4.2 percent and 4.0 percent per annum respectively, from 2022-23 to 2031-32.
The estimated rate of growth in the average total operating expense (for the 10 years to 2032-33) is slightly higher than the estimated rate of growth for total income for the same period. However, the Council is still forecasting that it will remain in surplus each year to 2032-33, with an annual average operating surplus ration of 3.3 percent - slightly below the Council’s past performance (with average operating surplus ratio of 3.5 percent in the 10 years to 2021-22).
Total expenses per property (a metric which accounts for growth) are expected to increase by an average of 1.7 percent per annum over this period, which would represent a significant cost reduction in real terms (based on current inflation projections) (see the right chart below). At the same time, average total income per property is forecast to increase by 1.3 percent (nominally), below the forecast inflation


These projections highlight the importance of the forecast growth in rateable properties in minimising the impact of rising costs on households. The reduced costs and revenue per property in real terms is reliant on the Council’s assumed average growth of 2.3 percent per annum (to 2031-32) in rateable properties, which is notably higher than historical growth of 1.5 percent per annum (10 years to 202122).
The Commission notes that, if the Council’s growth in rateable properties remained at 1.5 percent instead of its forecast 2.3 percent for the 10 years to 2032-33, then there would likely be a negative impact on the Council’s operating performance in those years
If the forecast growth in rateable properties does not occur and the Council cannot reverse the increases in costs in the short-term (for example, if contracts are locked in), this could place pressure on
23 The forecast average annual growth in the CPI from 2023-24 to 2032-33 is estimated to be 2.6 percent based on the RBA forecasts for the CPI (Australia-wide) to December 2025 (and the Commission’s calculations of average annual percentage growth) and the midpoint of the RBA’s target range (2.5 percent) from 2025-26
24 Footnote 23 applies
OFFICIAL Local Government Advice: City of Playford – Attachment 8 OFFICIAL
rate levels. Notwithstanding this the Commission notes the Council’s good practice of reviewing its rateable property forecast annually and encourages the Council to:
2. Continue its good practice of reviewing the rateable property growth forecasts in its budget projections each year to ensure that they remain current and do not create a need for additional rate increases to generate the same level of projected revenue.
The Commission has observed the current good practice of the Council to focus on continuous improvement resulting in savings of over $16.9 million since 2011. 25 As an example, it has factored in savings of approximately $0.6 million to its expense estimates in 2023-24, compared to these items in 2022-23. 26 However, the Commission notes that the Council has not set out any efficiency goals in the subsequent years in its LTFP.
To ensure the Council is positioned to achieve the real terms reduction in its cost base that it has forecast and improve its operating performance (without the need for further rate increases above inflation), the Commission encourages it to:
3. Continue its good practice of reporting any actual cost savings in its annual budget (and longterm financial plan, as appropriate), to provide evidence of constraining cost growth and achieving efficiency across its operations and service delivery.
4. Include efficiency goals and projected cost savings in its long-term financial plan, to provide further evidence of projected cost growth constraint and efficiencies across its operations and service deliveries
C.2 Net financial liabilities
The Council has predominantly used borrowings from the Local Government Finance Authority of South Australia (LGFA) to fund its capital expenditure. As a result, its net financial liabilities ratio 27 has trended between 99.8 and 143.2 percent between 2012-13 and 2022-23 respectively (see the left chart over the page). This is outside (or above) the suggested LGA target range for the indicator of between zero and 100 percent
While this could suggest that the Council is accumulating liabilities that its operating income cannot reasonably service (see the right chart over the page), the Commission notes that it has achieved operating surpluses in seven out of the last 10 years to 2021-22. In addition, as one of the fastest growing communities in South Australia, the Council is experiencing a period of significant development By utilising debt within the Council’s own target range of 160 percent, the Council is spreading the cost of acquiring the necessary assets, thereby more equitably reducing intergenerational risk. The Commission notes that there were minimal community concerns, with only two out of the 48 submissions received mentioning the need to reduce debt in the 2023-24 budget process 28
The Commission also notes the Council's strategy of reducing its net financial liabilities ratio from a peak of 88.4 percent in 2023-24 to an average of 49.9 percent in the five years to 2032-33. The reduction in the ratio from 2023-24 to 2032-33 comes from progressive repayment of total borrowings
25 City of Playford, 2024 – 2033 Long Term Financial Plan, June 2023, pp. 17, available at City-of-Playford-LTFP-23-24_2023-07-05-033606_mqwd.pdf
26 City of Playford Council, 2024 – 2033 Long Term Financial Plan, June 2023, p. 17.
27 The net financial liabilities ratio is defined as: Net financial liabilities ÷ Total operating income. This ratio measures the extent to which a Council’s total operating income covers, or otherwise, its net financial liabilities. The suggested LGA target range is between zero and 100 percent of total operating income, but possibly higher in some circumstances (LGA SA Financial Indicators Paper, pp. 7-8).
28 City of Playford, Ordinary Council Meeting Agenda -27 June 2023, Item 14.5 Draft 2023/2024 annual business plan, What We Heard Report – Public Consultation, available at https://cdn.playford.sa.gov.au/agendas-minutes/attachments/06-27-June-2023-Attachments-for-Items-14.514.7.pdf
OFFICIAL Local Government Advice: City of Playford – Attachment 9 OFFICIAL
(of $33.1 million over the next ten years to 2032-33) via the sale of assets 29 and operating income growth. For this reason, the Commission supports the Council's strategy to:
5. Reduce its level of net financial liabilities as forecast in its latest long-term financial plan and continue to focus on asset sales or disposals as one of its strategies to help reduce debt.
The Council only includes proposed asset sales when there is a high level of certainty associated with the disposal. 30 As a result it is not clear what level of borrowing can be reduced via asset sales in the 10 years to 2032-33 relative to using operating surpluses to repay borrowings. If the Council is unable to fulfill its asset sale strategy, then it risks a greater burden of revenue shifting to its ratepayers in order to achieve operating surpluses that can be used to repay borrowings.
As previously mentioned, those projections (the progressive repayment of borrowings of $33.1 million to 2032-33) also highlight the importance of the forecast growth in rateable properties and of ensuring that the Council undertakes a robust process when forecasting rateable property growth. If the Council overestimates the growth in rateable properties to 2032-33, it also risks a greater burden of revenue shifting to existing ratepayers in in order to achieve operating surpluses that can be used to repay borrowings.
The Council has not fully disclosed the assumptions underpinning its borrowing forecasts in its LTFP (such as loan facilities and/or terms, if applicable). However, the Council has disclosed its interest rate assumptions for its borrowing facilities, along with sensitivity analysis According to its 2023-24 LTFP, the Council has a $3.7 million impact over 10 years, based on a 1 percent interest rate increase each year over its 10-year LTFP The Commission considers that it would be appropriate for it to:
6. Improve transparency on borrowing assumptions, including loan facilities and loan terms, in its long-term financial plan.


C.3 Asset renewals expenditure
Between 2012-13 and 2021-22, the Council averaged 86 percent on its asset renewal funding ratio 31 (under the ‘IAMP-based’ approach), 32 signifying a slight underspend on the renewal and rehabilitation needs of its asset stock over this period (see left chart over the page). The Council’s spending on renewal and rehabilitation of assets averaged $16.3 million each year (over this period). From 2023-24
29 City of Playford, 2023-24 2032 Long Term Financial Plan, June 2023, pp. 18
30 City of Playford, 2023-24 2032 Long Term Financial Plan, June 2023, pp. 18
31 The IAMP-based method is the current industry standard whereby asset renewal/replacement expenditure is divided by the recommended expenditure in the IAMP (or AMP). Ideally, this will show the extent to which a Council’s renewal or replacement expenditure matches the need for this expenditure, as recommended by the plan. The suggested LGA target range for the ratio is 90 to 110 percent (LGA SA Financial Indicators Paper, p. 9).
32 The quoted averages for the ratio are based on ‘net asset renewal expenditure’ (after the sale of replaced assets) rather than ‘gross asset renewal expenditure’.
OFFICIAL Local Government Advice: City of Playford – Attachment 10 OFFICIAL
to 2032-33, the ratio is forecast to be within the appropriate range, at an average of 102 percent (see right chart below) Average annual spending on renewal or rehabilitation of assets is projected to increase to $25 million (in nominal terms)


As one of the fastest growing communities in South Australia, the Council is experiencing a period of significant development. During 2012-13 to 2021-22, the Council spent more on new and upgraded assets than the renewal and rehabilitation of its existing stock, averaging $19 million per annum on new or upgraded assets, compared with $16.3 million per annum on the renewal of its asset base (see right chart above). The Council’s accumulation of infrastructure reflects the demands of property growth (of 1.5 percent on average per annum over this period). As a result, the Council has grown its asset base over the past 10 years
The expenditure on new and upgraded assets includes a portion of grant funding for certain projects The growth in its asset base reflects a combination of capital expenditure and asset accumulation by the Council (including those assets provided by developers), as well as asset revaluations over this period. This has led to an average annual increase in the value of the asset stock per property of 4.1 percent, or $1,198, each year over the 10 years to 2021-22 (see left chart above). By implication, this indicates that the Council’s asset stock has increased in real terms (or the increase is higher than historical inflation).
The Council’s forward projections indicate that the value of the assets per property will increase at a much lower rate to 2032-33, by an average of 0.7 percent per annum: lower than the RBA-based forecast rate of inflation (2.6 percent per annum). These projections, as they stand, would contribute to the Council’s sustainability into the future and reflect a period of asset and service consolidation.


OFFICIAL Local Government Advice: City of Playford – Attachment 11 OFFICIAL
When the asset renewal funding ratio is instead calculated by the depreciation-based method, 33 it is forecast to average 68 percent over the forecast period (2023-24 to 2032-33) (see right chart below)
The ratio is impacted by the Council’s renewal expenditure which is quite low due to its relatively new asset base (average asset age is 21 years) (see left chart below) 34 Renewal expenditure is expected to increase as the council’s average asset age increases. The Commission notes that the Council is of a young age (the council was formed in 1997 through the merger of the City of Elizabeth and City of Munno Parra), in a high growth area with a high number of new assets recently acquired or gifted. 35


According to its Strategic Asset Management Plan (SAMP) the Council has individual asset management plans (AMP) for the following asset classes: transport, streetscape, stormwater, parks and sports fields, buildings, water delivery, fleet and minor plant and technology office. The AMPs provide a breakdown of the assets within each respective asset class and the proposed capital works are fed into the Council’s SAMP.
The Council’s SAMP is reviewed annually and contains current asset portfolio and condition data, up-todate improvement initiatives and any current risks and mitigations. 36 The SAMP also includes 10 years of asset renewal projections, in alignment with Council’s long term financial plan.
The Commission notes that the 10-year forward renewal plan is a rolling indicator of future renewal investment requirements, based on the expected remaining life of the Council’s assets and each asset class’s renewal strategy.
In addition, the 10-year forward new capital projects plan uses the expected new capital projects forecast and multi-year new capital projects already commenced in prior years for year one and a historic average thereafter to forecast its remaining new capital expenditure requirements. 37
The Commission’s review of the SAMP has found that, on balance, the Council's strategic planning processes aligns with good practice for a Council of its size and complexity.
33 Where asset renewal/replacement expenditure is divided by depreciation expenses.
34 City of Playford, 2023-24 Strategic Asset Management Plan, June 2023, pp. 19
35 City of Playford, Error of fact check letter, January 2024, pp1.
36 City of Playford, 2023-24 Strategic Asset Management Plan, June 2023, pp. 11
37 City of Playford, 2023-24 Strategic Asset Management Plan, June 2023, pp. 37
OFFICIAL
12 OFFICIAL
Local Government Advice: City of Playford – Attachment
D Current and projected rate levels
D.1 Historical rates growth
The Council's rate revenue per property growth has averaged 3.4 percent, or $52, per annum for each property over the past 10 years, 38 reaching an estimated $2,005 per property in 2021-22 (see the left chart below). This has exceeded CPI growth of an average of 2.0 percent per annum over this period, resulting in rates increasing in real terms (but also encompassing 1.5 percent average annual growth in rateable property numbers). 39 Current rate levels partially reflect the Council’s recent history of spending growth, predominantly on capital expenditure (on renewals, and new and upgraded assets), higher employee-related costs, as well as its focus on improving operating performance.
The Council remains reliant on its rate base for its operating sustainability. As the chart below indicates (to the right), rates revenue is forecast to account for 74 percent of budgeted operating income in 2022-23, compared with 72 percent of income in 2012-13.


The Council's general rate revenue consists of two components: one based on a fixed charge and the other on the value of the land (differential charge). After applying rebates, the Council will collect general fixed rate revenue equal to 50 percent of its general rates revenue This is the maximum amount that it can collect from the fixed charge as per the Council’s rating structure and LG Act. 40 41 In 2023-24, the Council's fixed charge will be $1,111.90 per rateable property, with the remaining 50 percent of general rates (after rebates) to be collected from a differential charge. 42
The differential charge payable per property is based on a rate in the dollar that is applied to the capital value of property. The rate in the dollar may vary based on land use and the Council currently has two rate types declared, commercial and general.
The Commission notes that the average differential charge per rateable property for the general type will increase to $707 in 2023-24 (from $664 in 2022-23). As such the average rate per rateable property for the general type will be $1,818.90 (of which $1,111.90 is the fixed charge applicable to all rateable properties).
38 From 2012-13 to 2021-22.
39 CPI Adelaide (All groups). Average annual growth in the LGPI published by the South Australian Centre for Economic Studies was similar (at 2.0 percent). Available at https://www.adelaide.edu.au/saces/economic-andsocial-indicators/local-government-price-index
40 City of Playford, 2023-24 annual business plan, June 2023, page 59
41 Local Government Act 1999 (LG Act) s151(10)
42 City of Playford, Rating Policy, June 2023, page 1 available at https://cdn.playford.sa.gov.au/general-downloads/Rating-Policy-23-24.pdf
OFFICIAL Local Government Advice: City of Playford – Attachment 13 OFFICIAL
D.2 Proposed 2023-24 rate increases
The Council has budgeted for an average rate increase (for general and commercial ratepayers) of 10.7 percent, or $225, per property for its existing ratepayers in 2023-24. 43 This is higher than anticipated in its 2022-23 LTFP projections (2.78 percent for existing rateable properties) The increase reflects higher short-term inflation (estimated by the Council to be 7.9 percent) along with the Council’s target to meet a 1 percent structural surplus 44 As noted earlier, the Council is one of South Australia’s fastest growing council areas: in 2022-23, it had 44,407 rateable properties and the Council expects this to increase to 46,306 in 2023-24, representing a 4.3 percent growth in rateable properties. 45
There is no differentiation in the commercial rate to reflect the type of industry (for example light versus heavy) or type of commercial property (for example office versus retail) or the size of the various commercial ratepayers.
On a proportional revenue basis, commercial ratepayers account for 21 percent and general ratepayers 79 percent of total general rate revenue in 2023-24.
Other than ‘general rates’ income, the Council also collects the Regional Landscape Levy, on behalf of Green Adelaide, and is expected to collect $1.2 million (net of rebates) in 2023-24. 46
D.3 Projected further rate increases
Between 2023-24 and 2032-33 the average rate across all categories is forecast to increase from $2,202 to $2,684, 47 a cumulative increase of $482 per property. This equates to a 2.2 percent average annual increase (between 2023-24 and 2032-33), below to the RBA-based forecast average inflation of 2.6 percent per annum. 48
D.4 Affordability risk
The two rate types declared by the Council will have increases on 2022-23 levels General ratepayers are to pay an increase of $111 per property (6.6 percent) and commercial ratepayers are to pay an increase of $1,356 per property (4.2 percent). On balance, the affordability risk for the community in respect of these further increases appears to be high. The current economic environment is putting more pressure on many communities’ capacity to pay for further rate increases, including those of the Council It has a relatively low socio-economic index (SEIFA) economic resources ranking 49 and already has relatively high average rates (across most ratepayers). In the 2023-24 budget process, the Council’s public consultation report received 23 submissions (out of a total of 48) that expressed concerns about further rate increases. 50 For these reasons, the Commission suggests that the Council:
43 Based on the Council’s 2023-24 annual business plan and its Excel template (with the 2023-24 forecasts) provided to the Commission. The Commission has used $105.615 million (in 2023-24 budgeted rates revenue) compared to unaudited 2022-23 estimates Individual rate level changes may be higher or lower depending on the rates category and property value.
44 City of Playford, 2023-24 long-term financial plan, June 2023, p. 16
45 City of Playford, 2023-24 annual business plan, June 2023, p. 60
46 City of Playford, 2023-24 annual business plan, June 2023, p. 58
47 This includes rates growth of 2.3 percent expected each year.
48 The forecast average annual growth in the CPI from 2023-24 to 2032-33 is estimated to be 2.6 percent based on Reserve Bank of Australia (RBA) forecasts for the CPI (Australia wide) to June 2025 (and the Commission’s calculations of average annual percentage growth) and the midpoint of the RBA's target range (2.5 percent) from 2025-26.
49 The City of Playford area is ranked 10 among 71 South Australian ‘local government areas’ (including Anangu Pitjantjatjara and Maralinga Tjarutja Aboriginal community areas and ‘unincorporated SA’) on the Australian Bureau of Statistics SEIFA Index of Economic Resources (2016), where a lower score (eg, 1) denotes relatively lower access to economic resources in general, compared with other areas, available at https://www.abs.gov.au/statistics/people/people-and-communities/socio-economic-indexes-areas-seifaaustralia/2021
50 City of Playford, Ordinary Council Meeting Agenda -27 June 2023, Item 14.5 Draft 2023/2024 annual business plan, What We Heard Report – Public Consultation, available at
OFFICIAL Local Government Advice: City of Playford – Attachment 14 OFFICIAL
7. Continue to monitor average rate rises to help reduce cost of living pressure on the community.
https://cdn.playford.sa.gov.au/agendas-minutes/attachments/06-27-June-2023-Attachments-for-Items-14.514.7.pdf
Local Government Advice: City of Playford – Attachment
OFFICIAL
15
OFFICIAL
The Essential Services Commission Level 1, 151 Pirie Street Adelaide SA 5000
GPO Box 2605 Adelaide SA 5001
T 08 8463 4444
E escosa@escosa.sa.gov.au | W www.escosa.sa.gov.au
