
The Shift to Renewables THE PENN WEALTH REPORT PENN WEALTH PUBLISHING | INVESTMENT INTELLIGENCE VOLUME 9/Issue 02 21 Mar 2021 Copyright 2021 All Rights Reserved. Penn Wealth Publishing. Think Utilities are the archaic holdings found in your Grandparents’ portfolio? Think again IN THIS ISSUE How to use the reddit brigade to gain advantage The New Utilities Investor ON PAGE 08 The Threat to the US Water Supply ON PAGE 14 Our Top Utilities Pick Right Now ON PAGE 16 An Energy ETF for the Future of Power

penn wealth publishing
2021. All
Reserved. 2 penn wealth Report volume 9 issue 02 21 mar 2021
Copyright
Rights
Cover: The synergies of traditional power sources merged with renewables.
Photo licensed by Penn Wealth Pub.
04
Editor’s Desk
The wonderful boringness of utilities. While they have been in the doghouse for years, things are about to change.
The Year in Charts
A look at some of the charts which shaped the news this past month.
14
American Electric Power
The utilities sector is about to morph into something new and exciting, and one particular utility appears especially well-poised to take advantage of the changes.
Blue Horizon New Energy ETF

Thematic investments always carry added risk, but we uncovered a new fund in an exciting corner of the energy market.
undeR the RadaR
Bright Ideas Being Ignored

The reddit brigade strikes again A quick-and-dirty method for leveraging the reddit army’s strategy to gain a tactical advantage.
The Growing Threat to America’s Water Supply
Biological warfare, in some form or another, is about as old as war itself, but the pandemic will be the catalyst for a massive ramp-up in America’s biosecurity effort.

The New Utilities Sector
The push for renewable energy will transform this sleepy sector into a vibrant player full of growth opportunities. We outline some of the potential winners investors should be aware of.

Regional banking, chemicals, industrials, and renewables: Four ideas that are being missed—or ignored—by investors and the press.
20
Weekly Business RepoRt
Our maritime shipper spikes on the growing concern over container shortage
Yet more problems for Boeing as engine failures mount
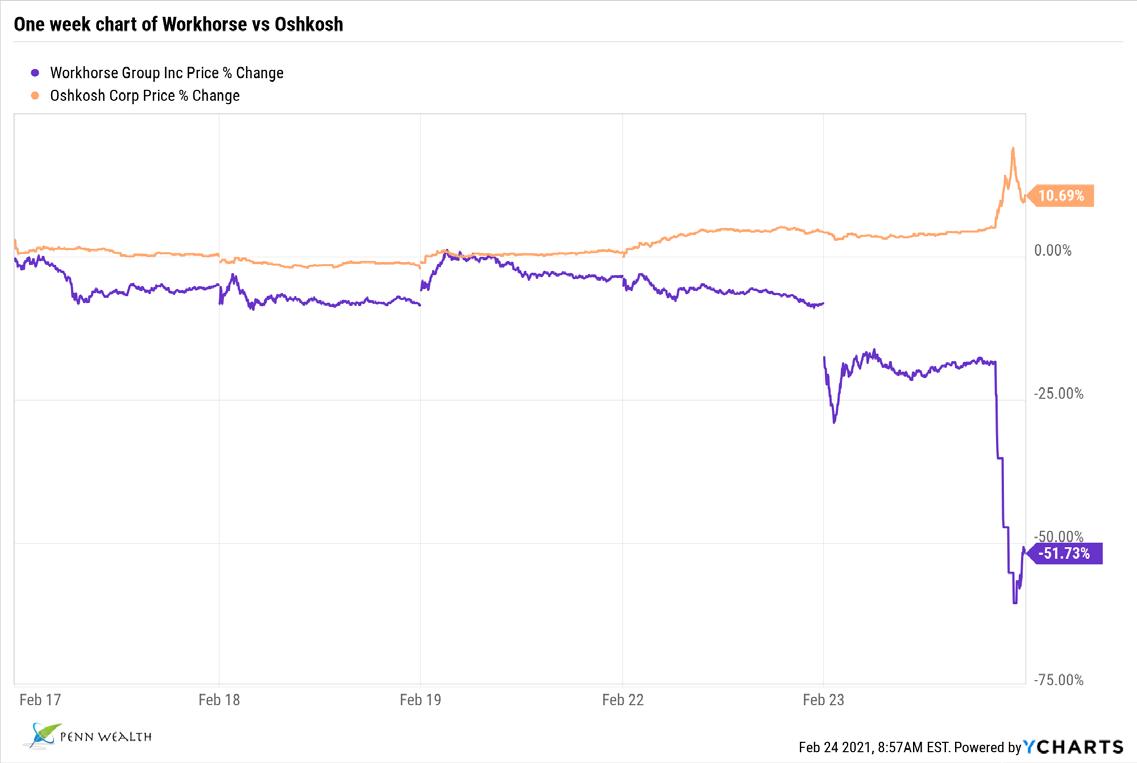
Investor darling Workhorse has its shares cut in half after losing USPS contract
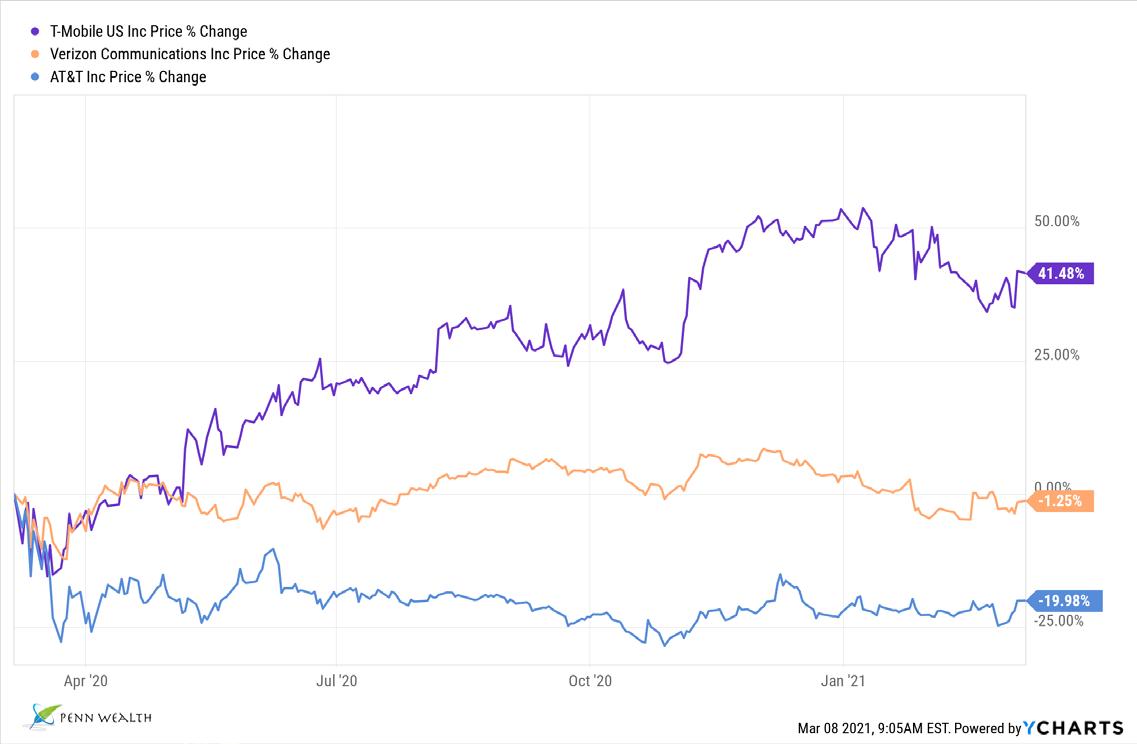
AT&T is finally spinning off its satellite and cable TV services, but that doesn’t necessarily make the company attractive
A massive Chinese hack hits Microsoft...and some 60,000 of its organizational and corporate customers
Upgrades, Downgrades, & Trades Actions we have taken at the Penn Trading Desk, plus a look at what other Wall Street analysts have to say, along with accompanying charts.
Strategic Income Portfolio
Dynamic Growth Strategy
Global Leaders Club Intrepid Trading Platform
New Frontier Fund
Most-Shorted Stocks List
Vaccine Spring: All along, there was only one Covid-19 vaccine we said we would not take
Top Quotes of the Week
Thomas Jefferson on Apprehension
Alfred Lord Tennyson on Following Your Passion
Benjamin Franklin on Risk Management
The Penn WealTh report
In PursuIt of Personal ExcEllEncE 21 mar 2021 penn wealth Report volume 9 issue 02 3
10 06
Copyright 2021. All Rights Reserved.
08
21 22 23
18
FRont MatteR
investMent intelligence
05 16 the penn
the
24 26 28 30 32 34 tactical
06
stRategies
tRading desk
aWaReness
10
08
17
From the Editor/
The Wonderful Boringness of Utilities
We hold the advantage of having seen this movie before—firsthand. Consider this fair warning.
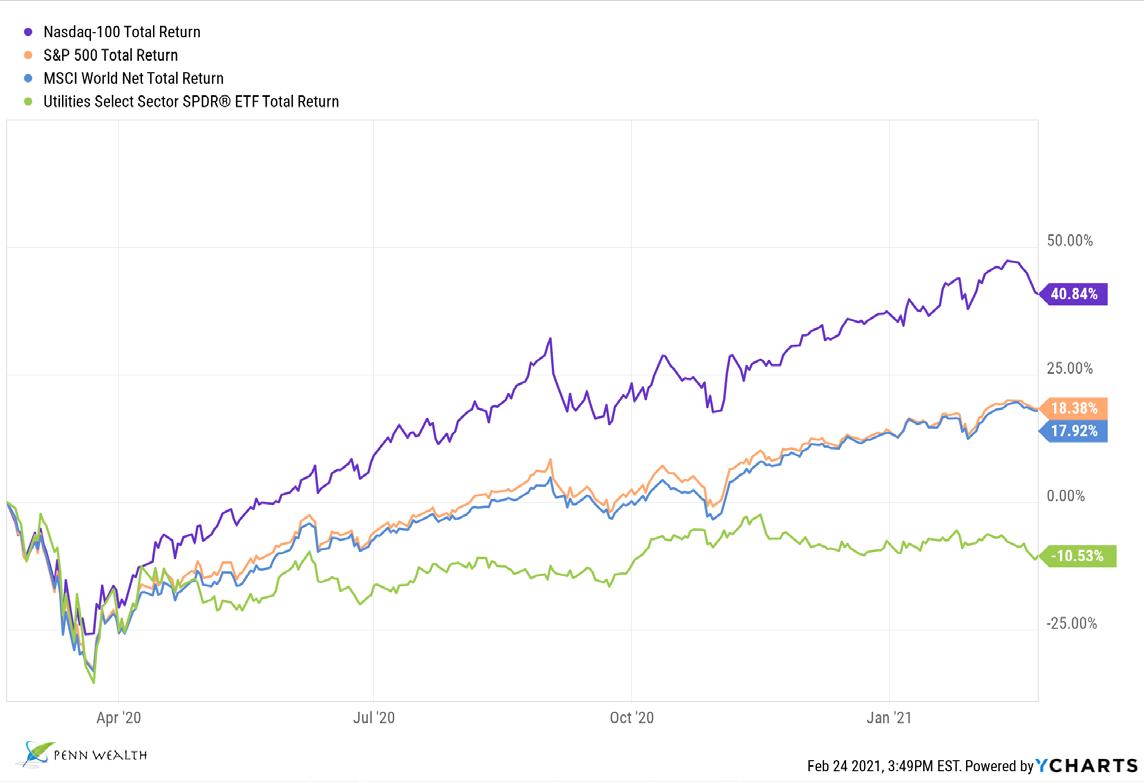
Take a look at the three colored lines on the graph below, each representing one specific investment over the past five years. Which would you have liked to purchase five years back? Silly question in that the returns are evident, so let’s pose it another way: which would you like to own over the next fiveyear period?
To better help you decide on an answer, the blue line represents an investment in the Utilities Select Sector SPDR®. More than doubling that return we have the orange line, representing the S&P 500 Trust. Nearly doubling that return we have QQQ, the Nasdaq proxy.
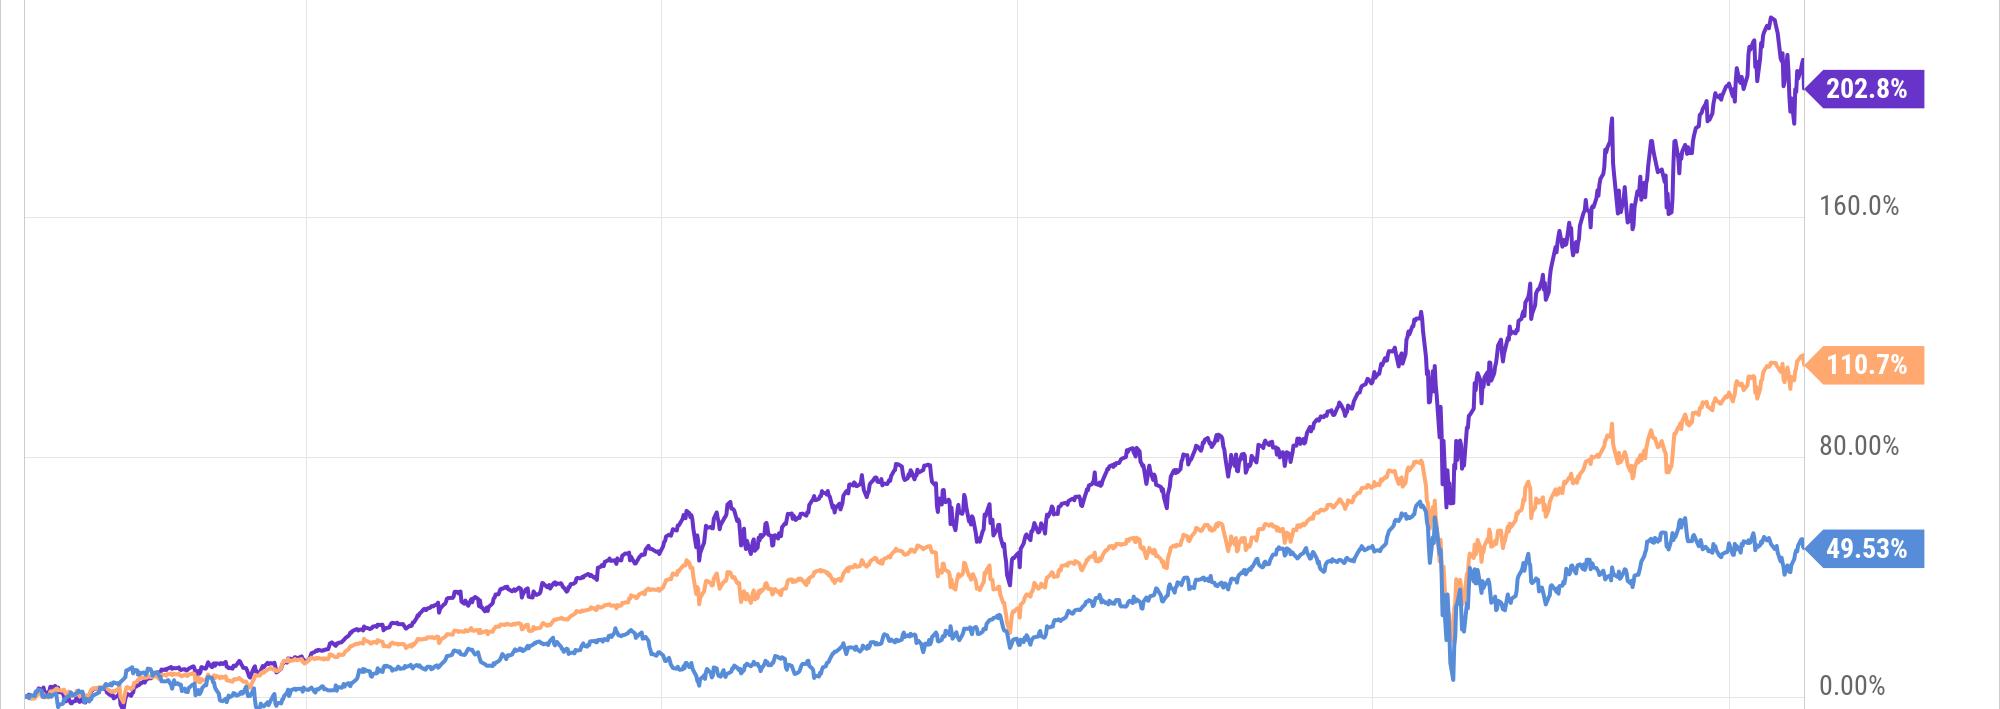
We tend to take past events and extrapolate them into the future. Everyone knows the Nasdaq always outperforms the blue chips; just like everyone knows growth always outperforms value. Of course, neither of those statements are factual.
Would you want to own the purple line if you knew it was about to fall 78% and wouldn’t get back to “zero” for fifteen
years? That’s exactly what happened to the Nasdaq beginning twenty-one years ago this month.
As for stodgy old utilities, they have been in nearly every investor’s doghouse for years. It was unintentionally clever that in this issue focusing on the unloved sector we also included a story on the GameStop frenzy. People get caught up in frenzies; they also tend to get slaughtered in them.
As for the growth over value narrative, it is an easy one to buy. After all, technology is changing everything about the way we live and work, and technology stocks are overwhelmingly growth stocks. By the way, we could have written that statement (and may have) back in January of 2000.
We have been here before, and we see a major cyclical shift in favor of value stocks. And no sector screams value like utilities. If for no other reason, investors should consider buying good names in this sector to balance out their portfolios, which are probably on tech overload. Read on...we’ll offer up some names.
Penn Wealth Publishing

Subscription Information https://www.pennwealthreport.com
Penn Wealth Publishing 9393 West 110th Street 51 Corporate Woods Suite 500 Overland Park, KS 66210
 editor-in-chief
4 penn wealth Report volume 9 issue 02 21 mar 2021 Penn Wealth Report Copyright 2021. All Rights Reserved.
—MSH
Michael S. Hazell
The MonTh in CharTs
On the pandemic front...
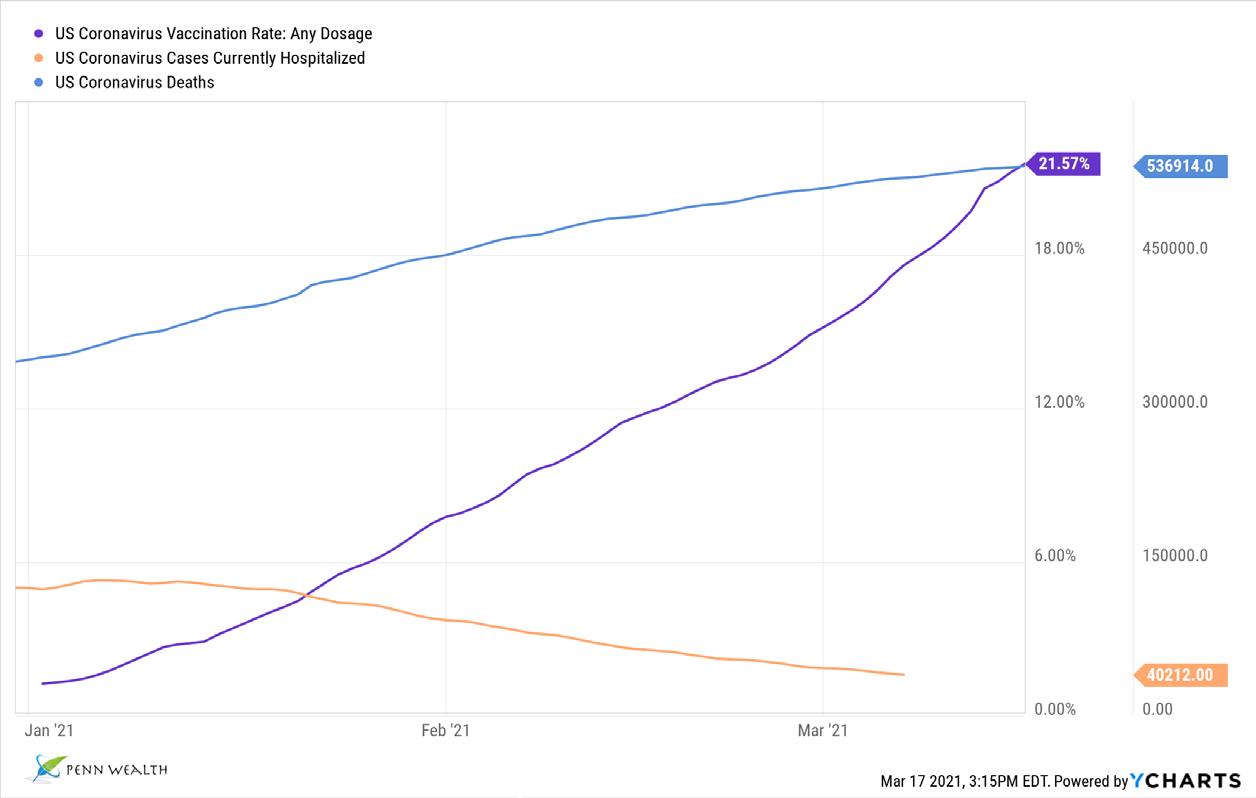
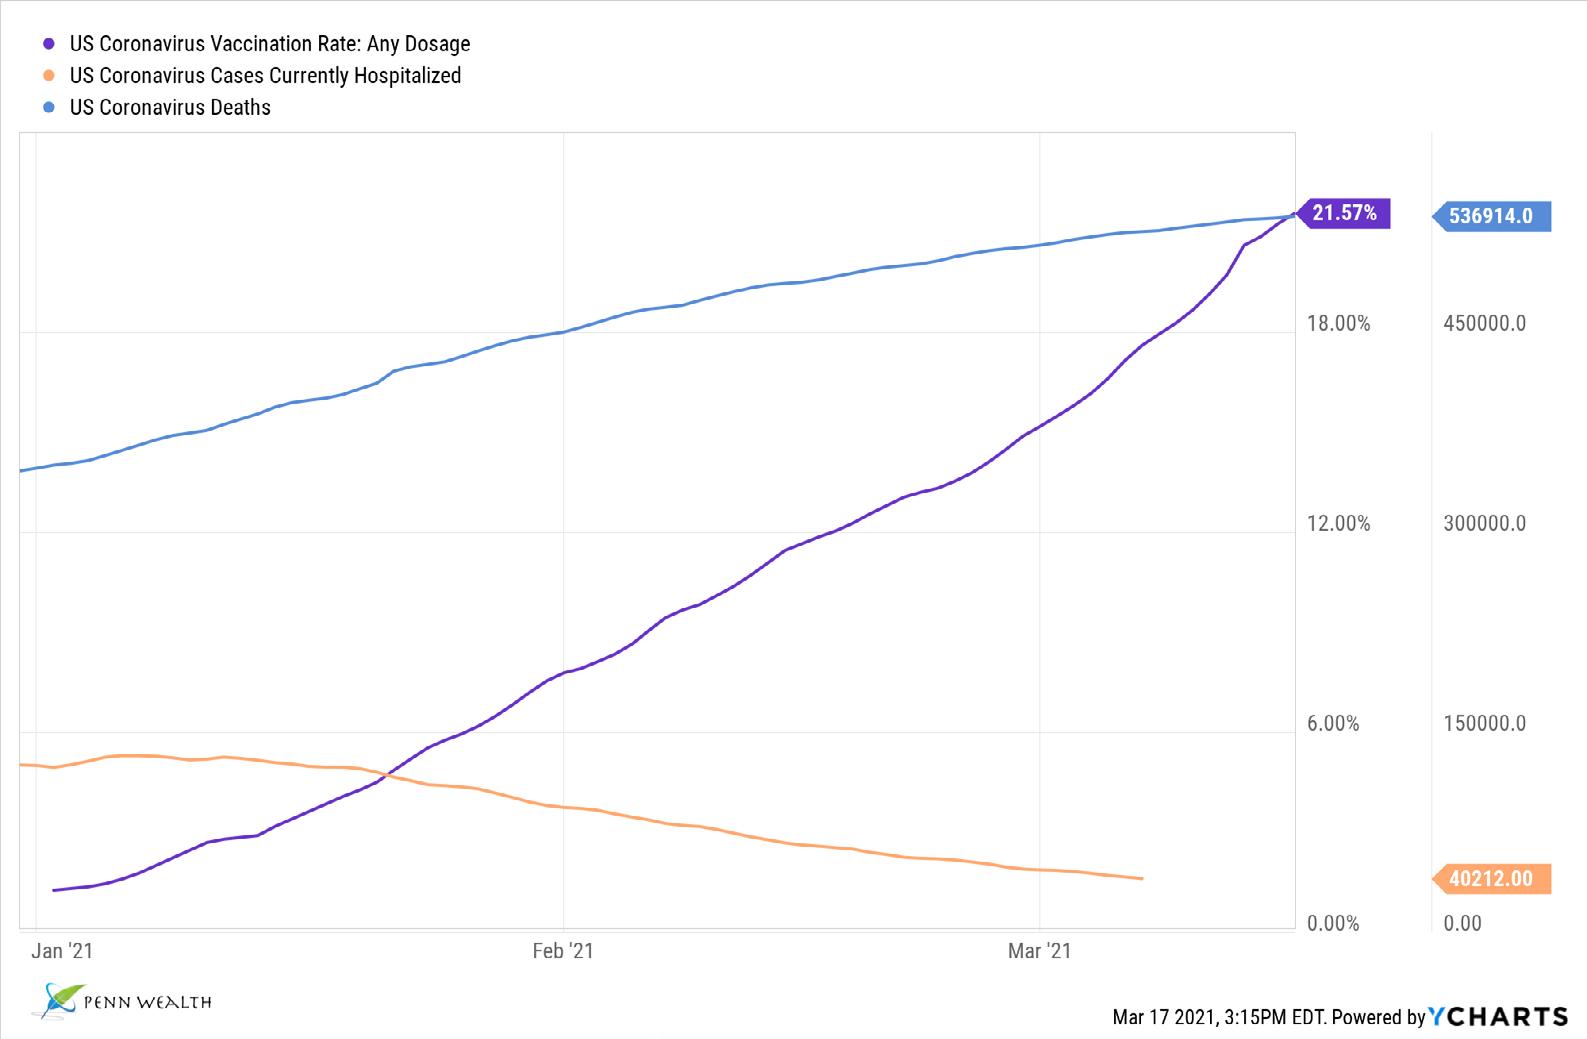
Great news on the pandemic front: nearly one-quarter of the US population has received at least one dose of a vaccine. As expected, this has caused a precipitous downturn in the hospitalization rate for the deadly virus. Sadly, 540,000 Americans never recovered from the disease.
Charts tell the story. Here are some of our favorites from the past month. For the top business and economic stories of the week, visit Penn...After Hours at www.penneconomics.com.
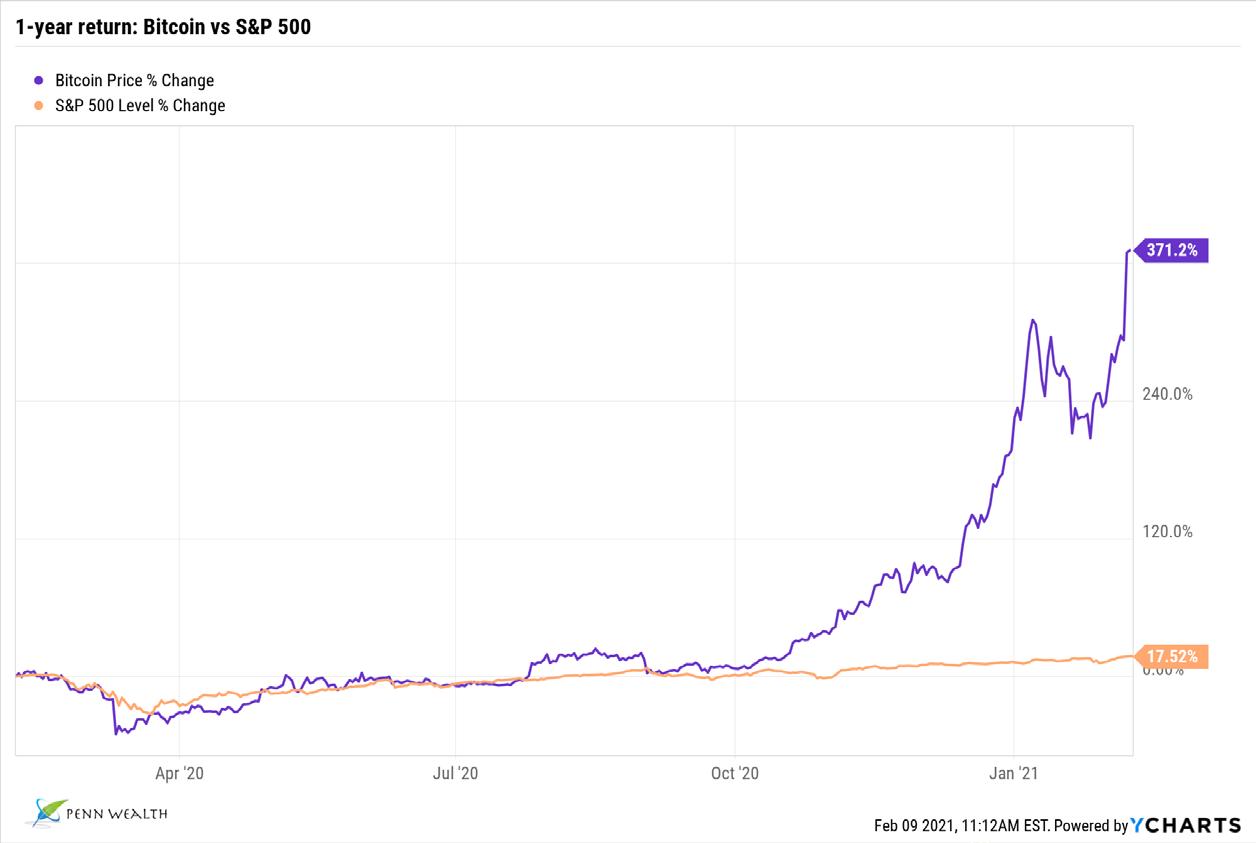
Nothing to see here, folks...
Some would look at the chart on the left and see a reason to buy bitcoin. Others look at the chart and see a massive bubble forming. Count us in the latter camp. Whether bitcoin becomes universally accepted as a method of payment or not (it is not a currency!), the digital stuff is not immune from an ugly downturn. Diamond hands, baby! (Not.)
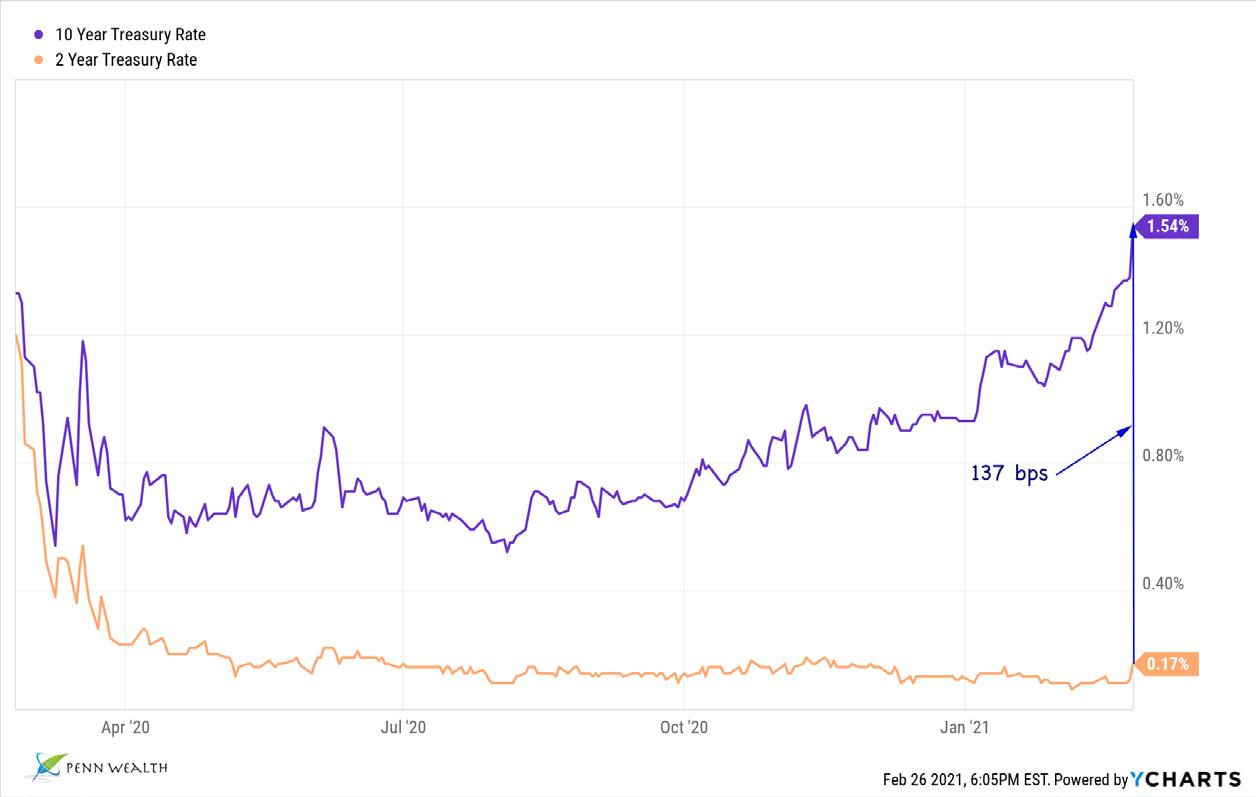
A new wall of worry...
For the first time in a year, the pandemic is not the biggest threat to the markets, at least according to investors. Their biggest concerns? Inflation and rising rates. It has been repeated on the business networks that a 2% ten-year Treasury yield would precipitate a 10% drop in the markets. As crazy as that may sound, interest rate fluctuations have led to some ugly days in the market recently.
Penn Wealth Report Copyright 2021. All Rights Reserved. 21 mar 2021 penn wealth Report volume 9 issue 02 5
The contents of this report reflect the personal views, opinions, and research of Penn Wealth Publishing. While measures are taken to help assure the accuracy of data, no guarantees can be made and the firm is not liable for any losses incurred by subscribers. This is not a solicitation to buy. Always consult your investment professional before investing any money.
Behavioral Finance

The GameStop Short-Seller Smackdown
There are so many great lessons to be gleaned from the GameStopGME $223 trading frenzy that we hardly know where to begin. Actually, let’s begin here: There was nothing new in the narrative other than the players, and the David vs Goliath notion is tenuous, at best. One more overarching point: The millions of young traders who got pulled into the frenzy are no different from the millions who got sucked into the dot-com bubble two decades ago, other than being a generation younger. The truth is that, for attentive students of the market, these lessons were out there just waiting to be consumed, all for the price of an e-book or two.
I was a young broker during the dot-com frenzy, and I remember the exact same level of enthusiasm surrounding the “new economy” names like eToys, Pets.com, and even telecom giant WorldCom—the last one being the “safest” of the bets on the rapidly-changing economic landscape. I recall one market expert (he was really just a slick marketer poising as an investment guru) telling business channel viewers—like me—that the rules had been rewritten, and that we wouldn’t see another major correction until the early 2030s based on his study of demographic trends. His “brilliant masterpiece” came out in 1998 and sold like hotcakes. Followers flocked to him.
There is nothing we love more than the democratization of the stock market. The idea of young people who formerly had zero interest in investing suddenly putting money to work—perhaps even in an IRA they won’t touch until it has grown large enough for them to live off the withdrawals—is a success story in and of itself.
That being said, there are some universal laws of investing which were embarrassingly ignored in the GameStop story, just as they were in the dot-com era. Why were they ignored? Because they involved putting forth the effort of performing some basic research, and who has time for that? Just pick your team...er, stock...and jump in! While the story is far from over (many of the traders have since moved on to pot stocks), let’s dissect what happened with the goal of becoming smarter investors.
How the reddit army got its marching orders Reddit—technically spelled with a lowercase “r”—is a social news aggregation and discussion site. Posts are organized into subreddits based on topic. The subreddit r/wallstreetbets, which we will subsequently refer to as WSB, is a group known for its aggressive trading strategies and salty language. Though we doubt many WSBers have heard of it, we
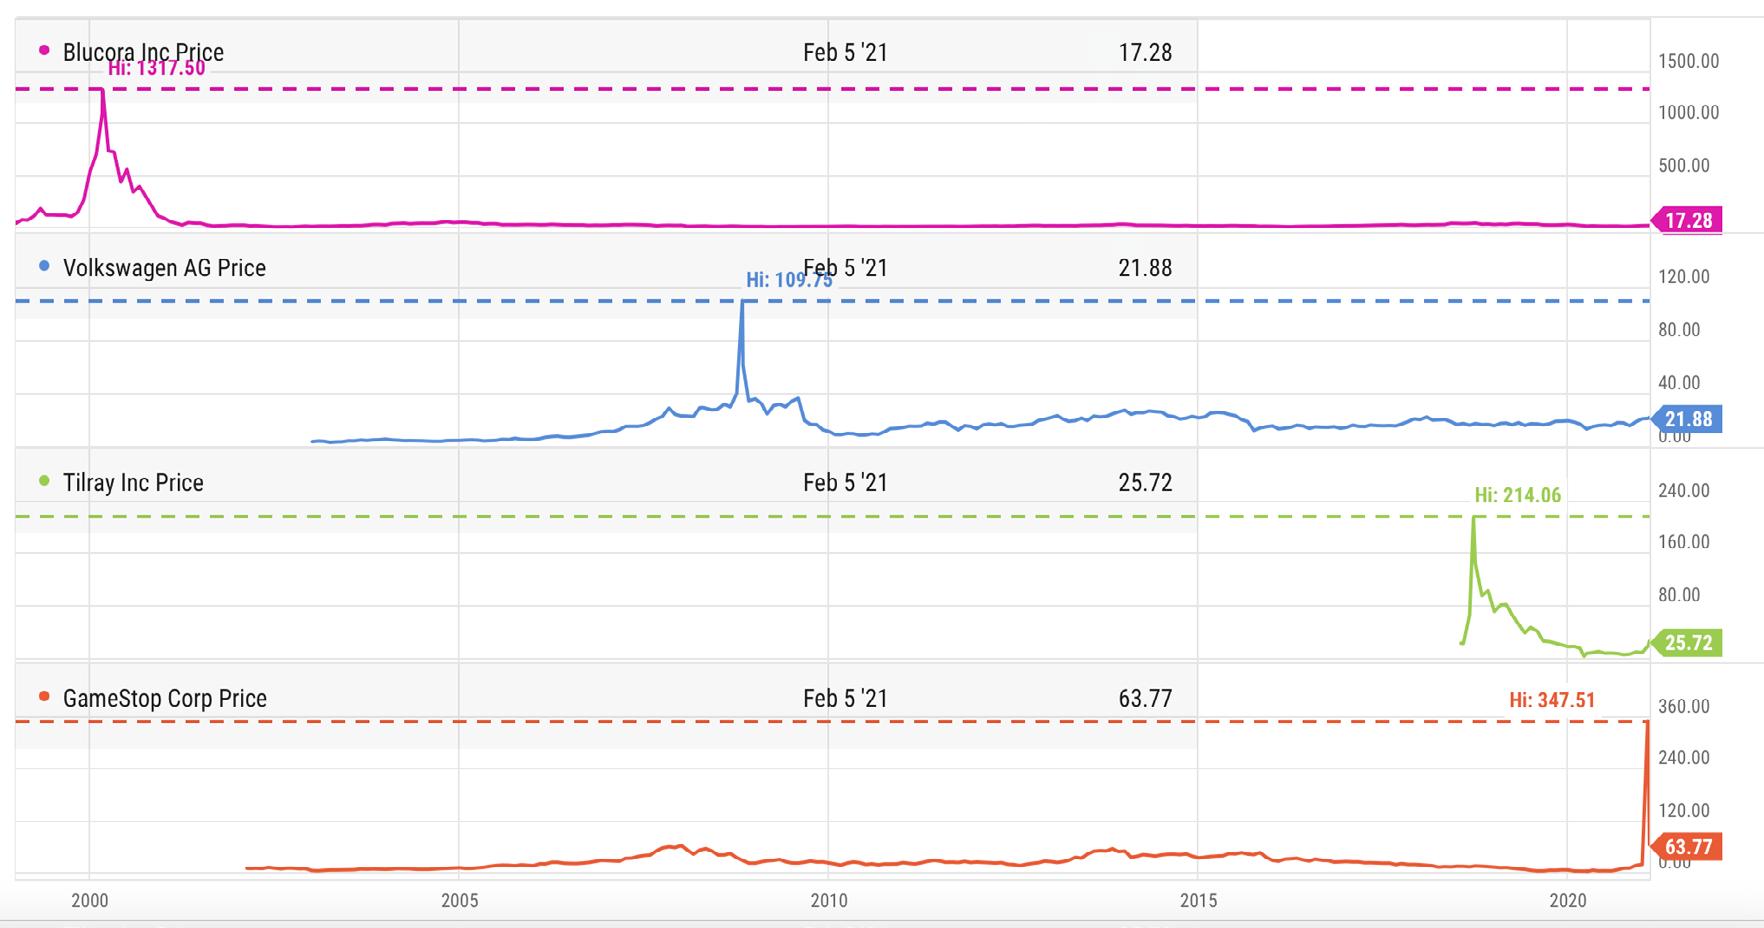
A few classic short squeezes. Graph courtesy of Penn Wealth/YCharts.
6 penn wealth Report volume 9 issue 02 21 mar 2021 Copyright 2021. All Rights Reserved.
tactical Awareness
A quick-and-dirty method for leveraging the reddit army to gain advantage.
can’t help but think of the movie Boiler Room.
In the middle of January, short seller Andrew Left and his Citron Research firm—a group we are not the least bit fond of—outlined the reasons that bricksand-mortar video game retailer GameStop would fail. Fair enough—while we aren’t fond of Left/Citron, GameStop appears to be a modern-day Radio Shack, and we can only imagine the overhead on the company’s 6,000+ locations around the world. As Citron was short GME, if their writings resonated with investors they would stand to make a lot of money as the shares tumbled.
Following Citron’s comments, a series of posts and YouTube videos by popular WSB user Deep(can’t print the middle word)Value, aka Keith Gill, aka Roaring Kitty, suggested that a lot of money was waiting to be made by taking a bullish stance on GME, squeezing the short sellers in the process. In other words, one could both make a ton of money and stick it to “the man” at the same time! Talk about a win/win proposition.
The world knows what happened next: Roaring Kitty’s videos and posts, which included the supposed astronomical gains he had made trading GME options, started a brush fire which quickly turned into an inferno. Shares of the company rose from a 52-week low of $2.57 to $483 on 28 Jan 2021. Left claims he and his family began receiving threats of physical harm, and he ultimately threw in the
towel not only on GME, but on his short research publications altogether.
The subreddit brigade quickly turned their sights on other heavily-shorted names such as Kansas-based (and Chinese owned) theater chain AMC, with shares of the near-bankrupt firm rising from $1.91 on 05 Jan to $20.36 three weeks later. Of course, the true value of these companies was completely disconnected from where the shares were trading, but that didn’t seem to matter. Fundamental research, according to this group of traders, was an archaic notion.
In a poetically-perfect move, the WSB crowd moved on to pot stocks, following a brief and failed attempt to corner the silver market. Our position in cannabis company Aphria, which we opened in the Penn Intrepid Trading Platform back in August at $4.63 per share (for some very valid reasons), rose by 500%, allowing us to stop out the position and lock in some rather remarkable short-term gains— though not the 37,461% gain Roaring Kitty claims to have made on one GME call in early February.
Using the reddit army to gain advantage It just so happens that we owned Aphria when the brigade stumbled across pot stocks, allowing us to cash in on the trading frenzy. But how can investors take advantage of predictive modeling to make money on the group’s future moves?
The graph on the previous page shows a few classic short squeezes from our
tactical Awareness
memory banks. The first example, Blucora (formerly InfoSpace), was actually just a victim of the bursting tech bubble, but we were able to take advantage of its nonsensical share price climb back in late 1999 and lock in short-term gains. The others were easily identifiable before their shortlived price spikes by a metric known as short float percentage
The term float simply refers to the number of shares available for investors to trade. The short float percentage is the ratio of shares borrowed by short sellers betting against the firm to the total number available. The higher the percentage of float short, the the greater the short interest in the stock.
Short interest data is available twice per month through a number of various sources. In the chart below, we pulled up the thirty most-shorted stocks for the most recent period, along with other important data.
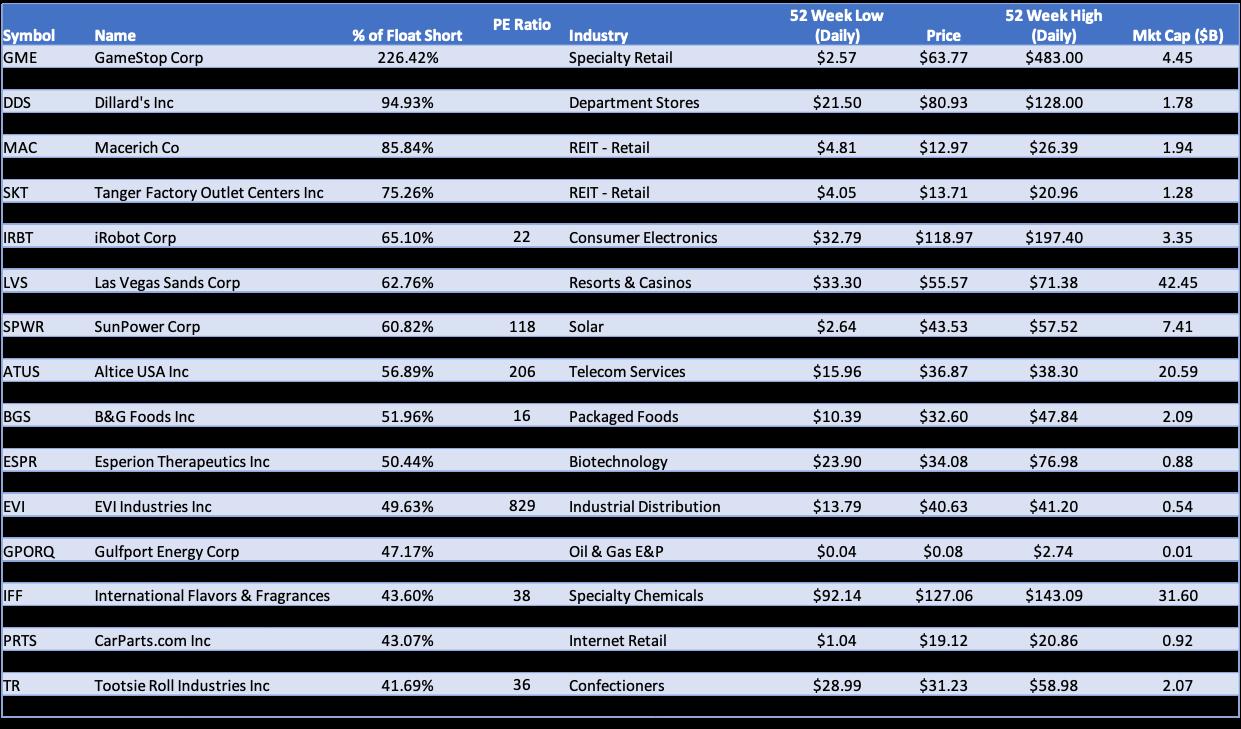
While some of these names we wouldn’t touch, others look very tempting. A great strategy for investors to keep in their quiver (no Robinhood pun intended) is to maintain such a list and be prepared to strike. Perform at least some basic fundamental research on a few selected favorites, and make an investment if warranted. Who knows, it may just be the next target of the reddit brigade!
For readers, we will begin maintaining a current “most-shorted” list in the back of each Penn Wealth Report, near our five strategies. Happy Investing.
Copyright 2021. All Rights Reserved.
02 7
21 mar 2021 penn wealth Report volume 9 issue
The 30 most-shorted stocks
Biosecurity Threats

The Growing Threat to America’s Water Supply

treatment
When the global pandemic was unleashed on the world from a province in central China, seizing up global economies and killing 2.5 million people—thus far, it struck us how unprepared governments were for this biological event. It also struck us just how easy it would be for a nefarious actor with state-sponsored resources to inflict damage through more tactical strikes. America’s utility infrastructure came to mind.
Precisely seven years ago, in February of 2014, we reported on a California power grid attack which began with the 1 a.m. slicing of underground AT&T fiber-optic cables, and ended with the 2 a.m. assault rifle barrage on a bank of PG&E transformers. Seventeen transformers were knocked out, and in the morning law enforcement collected over 100 rounds of ammo. Simply a case of local vandals? Perhaps. But recall that the Twin Towers were first attacked in February of 1993, eight years before the 9/11 strike.
Breach of the Oldsmar water plant by hackers. Two days before the Super Bowl in Tampa, the local suburb of Oldsmar had a breach at its water treatment facility. This time, it wasn’t a physical attack like the one which occurred at the PG&E facility, but a cyberattack. For good or bad, the individual systems which
facility
collectively comprise America’s critical infrastructure are becoming increasingly controlled by computer systems. This means that adjustments to these systems may be made with ease, generally by one technician on a computer; it also means that these systems can be easily hacked.
Around the start of his shift on Friday the 5th of February, an employee at the city’s water treatment facility noticed his mouse cursor moving around on his computer screen. As the plant uses remote-access software, he wasn’t too concerned; he assumed it was his supervisor monitoring the systems. A few hours later, however, the moving cursor was back—this time it was making actual adjustments to the level of chemicals entering the water supply.
Sodium hydroxide is used in municipal water supplies, at a ratio of 100 parts per million (ppm) or so, to control acidity and help remove heavy metals from the water. This chemical is also known by a few other names, such as lye or caustic soda. In high concentrations, this corrosive chemical damages human tissue. The technician at the Oldsmar plant watched as the mysterious stranger behind the cursor’s movements began altering the water supply’s sodium hydroxide levels to 11,100 ppm—over 100 times the correct amount.
The chemical injections were quickly moved back to normal levels, and plant officials were fast to point out that testing safeguards would have detected the issue long before the water reached any taps, but the threat is alarming.
An identified target of terrorists. Including the smaller districts, there are over 100,000 municipal water treatment facilities in the United States, each one vulnerable to attack. From a physical standpoint, a majority of the pipes which transport water to customers are between 50 and 75 years old and in need of repair. On the digital side, the threat of global hacks into local systems will only rise.
Copyright 2021. All Rights Reserved. 8 penn wealth Report volume 9 issue 02 21 mar 2021 tactical Awareness
The recent attack on a
near Super Bowl location was similar to Iranian attacks on Israeli facilities.
Water purification plant filtration process. Image licensed by Penn Wealth Pub.
The events of 9/11 served as a sobering wake-up call to Americans. The threats once seen as external, taking place in distant parts of the world, suddenly appeared uncomfortably close to home. “What if” scenarios began dancing around in our heads. With respect to one of the most basic of needs, our ability to access clean drinking water, we have every right to be concerned.
Eight years ago, Iranian hackers were able to infiltrate the control system of a damn near New York City. This past April, six Israeli water treatment facilities came under cyberattack, with increased levels of chlorine being added to residential water supplies. In July, a similar attack took place in Galilee. Israeli intelligence traced the hacks back to Iran.
Whether the Oldsmar incident emanated from a disgruntled employee or Iranian hackers on the other side of the globe, it is clear that our water supply is a designated target.
Safeguarding water distribution systems. There are a number of coordinated steps which must be taken to keep our water supply safe. While the much-anticipated infrastructure bill has yet to manifest in congress, we fully expect it to gain traction this year. A big part of any plan would certainly be the renovation and repair of America’s outdated utility systems. This would include computer system upgrades to help prevent unauthorized access, and deployment of advanced instrumentation to detect anomalies throughout the distribution network. We can also expect a major outlay of funds to replace thousands of miles of generations-old pipes.
On the personal responsibility level, think back to the surreal hoarding of everything from toilet paper to cleaning supplies to bacon and eggs during the early stages of the pandemic. Imagine how Americans would react if they were told that their drinking water may be contaminated. We could expect bottled water, water filtration systems (we prefer Zero Water Filters), and contaminant detection devices to suddenly become scarce.
If we have learned anything from the most recent public health threat it is this: preparation is paramount, and relying on government assistance in a crisis is a fool’s gambit. Armed with the knowledge that this threat is real, let us take the necessary precautions now. Maintain a number of effective water filters, jugs of spring water, and water test strips for ready use. As a catalyst for action, simply think back to the empty toilet paper shelves of last year.
Investing in Water
We mentioned that there are over 100,000 municipal water treatment facilities in the US, but the big industry players are trying to change that. And considering the cash-strapped condition of most small players— such as the Bruce T. Haddock Water Treatment Plant in Oldsmar, they are finding receptive ears.
The big dog in the space is $29 billion regulated water utility American Water WorksAWK $161 .
Founded in 1886, AWK is the largest investor-owned US water and wastewater utility, serving over 15 million customers in 46 states and assisting municipalities and military bases with their upkeep and maintenance needs.
Over the trailing twelve months, AWK generated $3.75 billion in revenue and $662 million in profits. The company has been purchasing smaller municipality-run districts at a rapid clip, generally with the approval of regulatory bodies due to their ability to streamline costs and improve service for residents.
While many utility companies are facing increasing scrutiny due to ESG and green energy concerns, the opposite is true for the water utilities. Government bodies don’t see them as an adversary, but as a group which will play a critical roll in creating a greener environment. This should equate to increased spending on new infrastructure projects such as new pipes and more efficient monitoring and control systems.
When we think of infrastructure work, the one sector that should come to mind is industrials. To bring America’s utility infrastructure into the 21st century, specialty industrial machinery companies and engineering/construction firms will be awarded billions of dollars in new contracts. Yet investors tend to ignore these industries.
Tetra Tech IncTTEK $135 is a midcap engineering firm specializing in full lifecycle support for water treatment projects. The $7 billion mid cap has been ranked #1 in the water field by Engineering News for seventeen straight years. The firm’s expertise includes threat and vulnerability assessments for water treatment facilities.
Rockwell AutomationROK $249 , or its previous iterations such as Rockwell Collins, has been one of our longtime favorites. This storied industrial, maker of the B-1 Lancer and the Space Shuttle, is now a pure-play automation company operating in three segments: intelligent devices, software and control, and lifecycle services. All three apply to water infrastructure. This $29 billion industry leader has a P/E ratio of 22.
When you think IBMIBM $120 , you may not think utility systems, but the company is a global leader with respect to the IT services of critical organizations—to include countering their cybersecurity threats. It has been in the investor doghouse lately, but it provides a 5.45% dividend yield and appears quite undervalued.
We saved our favorite options for last. The risk of investing in a sector, industry, or theme can be greatly mitigated by buying a basket of relevant holdings through an ETF. Here, we have three excellent choices: the Invesco S&P Global Water ETFCGW $48, the Invesco Global Water ETFPIO $35, and the First Trust Water ETFFIW $77
All three are strong choices if one truly believes in this thematic play, but our top pick is the first: CGW. A nice mix of cap sizes (a plurality of mid caps) and a healthy ratio of utilities to industrials gives this fund the edge in our evaluation. (See the Trading Desk for more.
21 mar 2021 penn wealth Report volume 9 issue 02 9 Copyright 2021. All Rights Reserved.
tactical Awareness
Utilities
The New Utilities Sector
Momentum investors and like-minded portfolio managers (PMs) love to look at the sectors, industries, and individual equities which have traveled fast and furiously higher; they are happy to ride the latter part of the meteor’s tail to notch some gains. They start at the top of the performance chart and work their way down.
Deep value and contrarian investors and likeminded PMs take a decidedly different approach. They look at these three areas—sectors, industries, stocks— starting at the bottom of the performance chart and working their way up. What areas, they ask, have been left in the dust, written off as passé, ignored by investors attracted to the fast action?
Adopting the research habits of the latter, it doesn’t take much digging to find the two most unloved sectors over the past 52 weeks: energy and utilities. While energy has been experiencing a steady recovery on the back of baked-in expectations for a massive economic comeback, utilities have not been so fortunate.
There are a number of reasons we favor the utilities sector this year. First and foremost, we have had our best success by being contrarians: finding the gems that others trampled over in search of quick riches. After all, who would want to own a boring utility company when we could own Virgin GalacticSPCE $44?

Secondly, the rapid run-up in equities, especially high-flying tech names, is making us nervous. We remember the year 2000 like it was yesterday, and a number of similar events are surfacing.
Thirdly, while inflation will probably force the Fed’s hand sooner than most expect, bond yields are still historically low. That fact doesn’t change the needs of income-oriented investors, and utilities offer some of the richest payouts in the market.
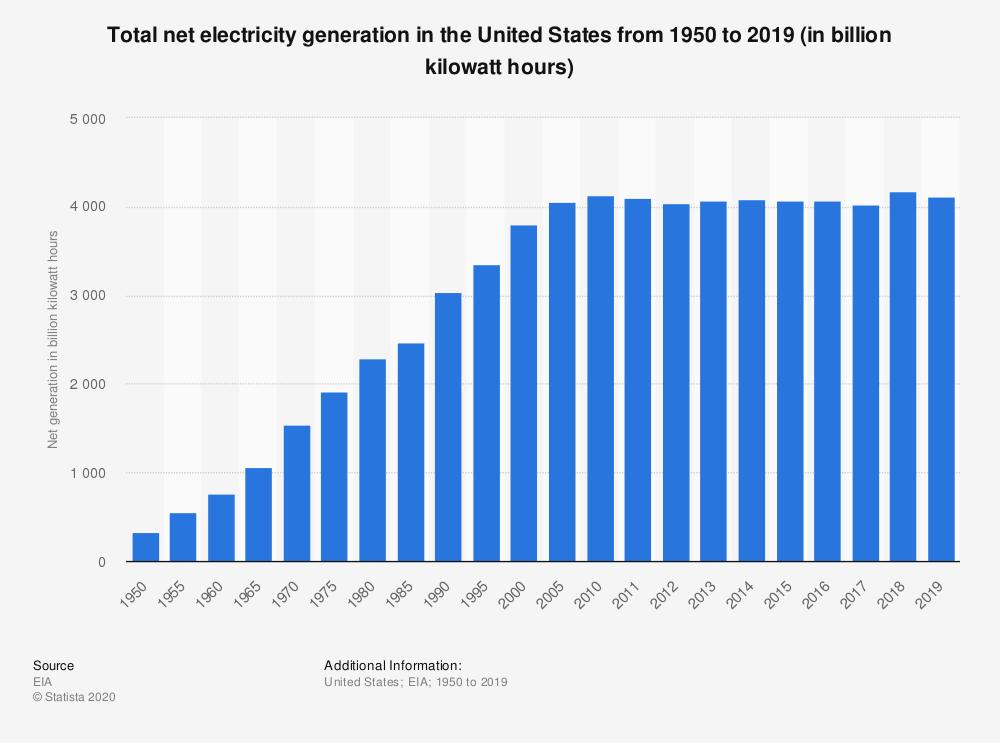
Finally, the sector is about to get a major makeover. According to the US Energy Information Administration, coal and nuclear combined still account for a surprising 43% of America’s power supply (natural gas comes in first, at 38%). While nuclear power is considered “clean,” both of these sources are essentially among the walking dead, destined for replacement. And their replacements, in aggregate, will reshape the utility landscape in a seismic manner.
Are investors missing a simple certitude about regulated utilities’ role in renewables?
One segment of the market which does generate excitement amongst the investment community is renewable energy. It is often mentioned in the same breath as electric vehicles and artificial intelligence with respect to the cutting-edge technology driving us—and our economy—into the future.
Right now, just 17% of our power demands, or 680 terawatt-hours (TWh), are generated by renewables—mostly solar, wind, and hydro—but this number could grow to 1,500 TWh per year by the end of the decade. Considering the current demand for electricity in the US is just slightly above 4,000 TWh per year, that would represent an annual growth rate of close to 10%, and a major leap forward for the nascent industry.
utilities sector has been the clear laggard over the past 52 weeks
Currently, most renewable energy companies are independent power producers which sell their generated resources to the regulated utilities, which subsequently sell that electricity to customers via their monthly utility bill.
10 penn wealth Report volume 9 issue 02 21 mar 2021 Penn Wealth Report Copyright 2021. All Rights Reserved. investment intelligence
The push for renewable energy will transform this sleepy sector into a vibrant player full of growth opportunities.
The
Right now, the regulated utilities own just a fraction of renewable energy resources, but that is about to change. Based on current trends, the major utility players will own over two-thirds of these formerly-independent interests by 2030. That is a disruptive trend that should attract wise investors to the game.
Why should the major utilities both acquire independent firms and undertake massive new infrastructure builds? The answer lies in an industry-centric term known as rate base. In a very basic sense, the only way a utility can grow its
step upward in capital expenditures since the advent of air conditioning.” We begin to see why growth investors who shunned this seemingly moribund sector may want to take another look. Especially with the off-the-charts valuations of their beloved tech stocks.
The great rotation back into value. Over the course of the past decade, growth stocks have outperformed their value counterparts to a substantial degree. This dichotomy has been so conspicuous and persistent that it has made
Understanding the New Energy Industries
While there are just five industries and two sub-industries in the Utilities sector, the coming infrastructure build and subsequent deployment will spread the wealth around to a number of other industries. Here is a brief look at the pertinent areas investors should scour for undervalued gems:
• Electric Utilities: Companies that produce or distribute electricity; includes both nuclear and non-nuclear facilities.
Gas Utilities: Companies whose main charter is to distribute and transmit natural and manufactured gas; excludes exploration and production (E&P) companies.
• Multi-Utilities: Utility companies with significantly diversified operations.
• Water Utilities: Companies that purchase and redistribute water to the end consumer; includes largescale water treatment systems.
• Independent Power Producers (IPP): Companies that generate electricity and subsequently sell that power to the regulated utilities.
earnings in a regulated environment is by increasing its rate base—essentially the value of property on which a public utility is allowed to earn a specific rate of return.
For example, a water utility will have its distribution pipes, water treatment plants, meters, hydrants, and even purchased and installed software included in its rate base (cloud computing software is still uncharted territory with respect to rate base). So, by building new plants and acquiring current independent players, a utility can generate more revenue.
many investors as complacent now as they were in the late 1990s. Once again, we are being told that the high p/e tech names are rewriting the rules in a paradigm-shifting manner. What baloney. Typically, right about the time at which a false narrative becomes accepted as gospel, a massive disruption takes place. In this case, we believe the disruption will manifest as a tech meltdown—at least a brief one—and a value resurgence. These shifts are generally secular in nature, meaning they tend to have staying power.
Renewables: Companies that engage in the generation and distribution of electricity, including, but not limited to: biomass, geothermal, solar, hydropower, wind power; excludes the companies which manufacture the capital equipment used in this market.
• Construction & Engineering: Civil engineering firms and large-scale contractors engaged in non-residential construction projects.
• Industrial Conglomerates: Diversified industrial conglomerates which operate in three or more sectors; think GE or Siemens AG.
• Industrial Machinery: Manufacturers of industrial machinery and parts, such as pumps, bearings, gears, and other metal fabrications.
The
Pondering what a massive new wind farm or giant solar power generation facility would do for a regulated utility’s rate base, one gets a sense of just how powerful this government-fueled movement will become over the next few decades. Douglas Simmons, a sector portfolio manager at Fidelity, puts it in more succinct terms: “I don’t think the utilities sector has experienced this large a
When we think value names, no sector is higher up on the list than utilities: the low p/e, higher-yielding, regulated powerhouses that bring the most basic of essential needs right into our homes. With generally healthy balance sheets and secure dividends, these companies often serve as a stable rock during market storms. As bonds take on more risk (they will generally drop in value as rates rise), solid utilities can provide the golden trifecta: yield, growth potential, and lower risk. It has been a long time, in our opinion, since this sector has looked so attractive.
Now that we have laid out our case for utilities, let’s consider some of the areas and specific names which are poised to excel as renewables gain steam.
• Heavy Electrical Equipment: Manufacturers of power-generating equipment such as power turbines and heavy electrical machinery intended for fixed-use and large electrical systems.
• Research & Consulting Services: Companies providing research and consulting services to businesses and governments on the design of large-scale projects such as power plants.
• Electrical Components & Equipment: Companies that produce electrical cables and wires, as well as electrical components and equipment.
• Semiconductors & Equipment: Makers of semiconductors and related equipment, such as solar modules and cells.
• Precious Metals & Mining: Companies which mine rare earth metals and minerals; excludes gold mines.
• Specialty Chemicals: Companies that produce high-value chemicals used in the manufacture of a wide range of products; includes advanced polymers, adhesives, additives, sealants, and coatings.
• Industrial Gases: Companies which supply industrial gases such as hydrogen and helium to a number of industries, to include energy producers.
Technology Hardware & Equipment: Manufacturers of everything from storage devices to electron tubes, transformers, and other inductors.
21 mar 2021 penn wealth Report volume 9 issue 02 11
Wealth
Copyright 2021. All Rights Reserved. investment intelligence
Penn
Report
“I don’t think the utilities sector has experienced this large a step upward in capital expenditures since the advent of air conditioning.”
US uses over 4,000 terawatt-hours per year of electricity (Courtesy: Statista)
I used to wonder what it would be like to be a professional broker in the decade of malaise, otherwise known as the 1970s. Between January of 1973 and mid-August of 1982, the S&P 500 had dropped 12.8% and the Dow Jones Industrial Average was off 23.6%. That is almost hard to fathom. Put another way, if an investor placed $10,000 in both of the major indexes, they still hadn’t broken even after a decade!
I was a professional broker during the decade-long flatline which began in mid-March of 2000. While it seems so long ago, I still constantly remind clients that anything can happen in the markets, no matter how outlandish (global pandemic) the event may seem. Actually, there was no major external force which caused the dot-com bubble to burst—the wounds were self-inflicted.
Every time I have a client ask why they have money sitting in cash (it is an asset class!), or wonder why they weren’t in the IPO of that company which promised to solve the world’s energy problem with massive algae farms, I think back to the 78% drop in the NASDAQ which began that early spring day in 2000.
While there haven’t been many complaints about portfolio allocations placed in the underperforming utilities sector over the past few years, there would have been virtually none (some people just like to complain) in the two dark periods mentioned above.
In the ten years between March of 2000 and March of 2010, as the major indexes were still trying to crawl back to zero, the Franklin Utilities FundFKUTX was up 135%. It was hard to give these shares away in 2000, as America was caught up in “New Economy” mania.
So, considering the nascent renewable energy renaissance and utilities’ broad role in the movement, coupled with how this “boring” sector performed during the last two decade-long downturns, let’s take a look at a few potential opportunities for investors right now.
Traditional utility plays. This is certainly the most obvious plan of attack: uncover undervalued utility companies which have shown a commitment to the renewables revolution, and add them to the portfolio. While owners of T-bills and notes are thrown peanuts twice a year, utility holders get a fat check once per quarter. Sometimes the most obvious answers are the best. Here are a few of our favorites in the field.
NextEra EnergyNEE $72 is the world’s largest generator of wind and solar renewable energy. The company’s regulated utility, Florida Power & Light, distributes power to five million Floridians. The company’s renewable segment sells power throughout the United States and Canada.
While NextEra held up better than most utilities in 2020, its share price has recently fallen back from $88 in January to a more reasonable $72 now. We would value the shares around $90.
How’s this for a commitment to renewables: Duke EnergyDUK $87 has announced that it would be partnering with five other companies to create a network of EV charging stations along major highways in the South, Midwest, Gulf, and central Plains regions. The $67 billion regulated utility has a $60 billion, fiveyear capital investment plan focused on clean energy. Imagine what such expenditures would do to the company’s rate base and, subsequently, earnings potential.
Duke has a crazy-low beta of 0.2445 and a fat dividend yield of 4.40%. As for the low risk level, as measured by beta, this makes sense for a company that serves eight million retail electric customers and nearly two million natural gas customers—boom times or bust, Americans will always need their heat, hot water, and air conditioning.
One of the other five companies teaming with Duke on their aggressive EV charging station plan is $38 billion Ohio-based utility American Electric PowerAEP $78. While it is true that 43% of AEP’s capacity comes from coal, the company has an aggressive plan to change that. By 2030, that figure should be reduced to 24%, while capacity from renewables (hydro, wind, and solar) should increase from 18% to 40%. AEP boasts the largest transmission and distribution network in the United States, stretching over 40,000 miles.
In 2020, AEP generated revenues of $14.6 billion with $2.2 billion flowing down as net income. The company pays a dividend of 3.7%, and we would place a fair value of $100 on the shares.
Solar power and the paramount challenge: storage. It really doesn’t matter how much wind there is in Kansas on any given day, or sunlight in Southern California, what really matters for the efficacy of the renewable power movement is the ability to retain, or store, that energy for use when it is needed. For all of the impressive wind farms and solar projects under development, the storage issue remains the herculean task for full-scale adoption to take place.
While it may seem strange to consider a car company in a discussion on the opportunities in the energy renaissance, electric vehicles will be a major early catalyst for renewable power. Not only is TeslaTSLA $619 the undisputed leader in EVs, it also has an interesting little side business.
Tesla Solar (the firm bought SolarCity back in 2016 to create a “one-stop shop for clean energy customers”) installs high-quality, Tuscan-style solar roof tiles on homes across the county. In addition to being three times more durable than standard roofing tiles (they come with a 25-year warranty), they are also extremely stylish—which certainly cannot be said of the more traditional solar panels.
As solar power is collected during the day, it moves down to a Tesla Powerwall energy storage system. The heart of this sleek device is an internal inverter, which
12 penn wealth Report volume 9 issue 02 21 mar 2021 Penn Wealth Report Copyright 2021. All Rights Reserved. investment intelligence
While utilities will play the starring role in the renewables movement, hidden gems in supporting roles will emerge.
converts DC energy to the AC energy used inside the home. Up to ten Powerwall units can be stacked to meet the needs of the household’s needs. As with everything Elon Musk does, expect these power packs to increase in efficiency at a rapid clip. Right now, Tesla Solar accounts for around 10% of the firm’s overall revenue—which amounted to $31.54 billion in 2020. By the 2030s, the solar and storage business could become a $77 billion per year unit—or over twice the company’s current revenue. Our relatively short-term target price on shares of Tesla is $1,000.
Another leader in the solar inverter business is Enphase EnergyENPH $153. This energy management technology company offers a wide array of solar generation and energy storage products, all managed on its Enphase IQ System intelligent platform. With its p/e ratio of 169, shares may seem a bit rich, but at least it has a p/e ratio—unlike so many other players in the space.
When the name GeneracGNRC $310 is mentioned, most people probably think of the backup power generators which sit on the side of a house and provide power during those rare outages. Based on the company’s primary focus, it would make perfect sense that they would move into the field of solar storage.
Generac recently bought two solar startups—Panasonic’s US inverter partner, Pika, and Enbala Power Networks—with the lofty goal of creating millions of single-family-home “virtual power plants.” This is a brilliant idea, and it can certainly become a reality based on emerging technologies. Imagine the freedom of being energy self-sufficient. Generac is not cheap (56 p/e), but it is a very well-run company with a bright future in solar.
As more of a pure play on solar, investors should consider small-cap power company Canadian SolarCSIQ $40. This $2 billion Ontario-based provider of all things solar designs, develops, manufactures, and sells ingots, wafers, cells, modules, and a host of other products relevant to the industry. A couple of quite interesting factors caught our eye: Shares of CSIQ have dramatically pulled back during the most recent tech correction (40%), and the company has a remarkably-low p/e ratio of 12. Taking the financials a step further, Canadian Solar has turned a nice profit going all the way back to 2013. CSIQ derives most of its revenue from Asia, making it a sound international play.
Precious metals feeding the renewables boom. We first wrote about—and invested in—Livent CorpLTHM $16 back in September of 2019. While everyone was focused on the EV makers, investors seemed to be forgetting about the raw materials needed for the lithium-ion batteries which, quite literally, fuel the movement. Livent is a $2.4 billion US-based producer of lithium. Lithium carbonate and lithium hydroxide are essential compounds in everything from energy storage and battery systems to critical aerospace components.
While Livent reached our target price of $16 late last year and stopped out, its shares have recently been falling back down to a solid buy point. We would place a $20 fair value on the shares.
Albemarle CorpALB $139 is the world’s largest lithium producer, with salt brine assets (brine extraction produces lithium carbonate) in the US, Chile, and—via joint ventures—Australia. The company is also the world’s second-largest producer of bromine, a chemical used in servers and automobile electronics.
As lithium demand grows, prices will follow; and considering the extensive mining/distillation process, there is a wide moat around the largest players. Albemarle has plans to increase lithium production from 90,000 metric tons to 155,000 metric tons by the end of next year. To sweeten the deal for would-be investors, the firm is also a major producer of oil refining catalysts—an undervalued segment poised for a robust rebound.
Industrials will build the infrastructure. Sure, we remember the $1 trillion infrastructure plan that never came to fruition, and the “shovel-ready” jobs that never were, but President Biden’s $2 trillion “Green New Deal” will gain at least some traction—certainly enough to move a number of renewable energy projects from drawing board to development. And a number of industrial companies, from small-caps to behemoths, will reap the reward. In the past, General ElectricGE $14 would have been at the top of our list, but we have lost almost all faith in that once-great company. Instead, let’s look at some industrial names already making moves in the segment.
TPI CompositesTPIC $42 is a small-cap (just $1.5B in size) specialty industrial machinery firm. The company has made over 65,000 blades for wind turbines over the past two decades, and is a leader in the field of wind energy. Despite its size, TPI has a global footprint, and a healthy transportation unit which makes structures for bus, rail, and theme park systems. Investors would be taking on more risk here, but TPIC shares could easily be trading back in the $60s range soon, implying a 50% upside.
Gibraltar IndustriesROCK $92 is a $3 billion industrials firm in the building products industry. The company’s Renewable Energy and Conservation unit designs and sells fully engineered solar module racking systems—the hardware interface between the solar panels and the roof—and greenhouse structures to companies.
We actually like Gibralter’s other two business units as well: the Residential Products segment makes a wide range of products for new residential construction and home improvement; the Infrastructure Products segment manufactures and sells metal products for use on highway and bridge construction, as well as power generation systems. How high up on a national infrastructure plan do you think our crumbling roads and bridges would rank?
And probably the best way to play this movement is... We offered up just a couple of good industrials names which will make their mark on the renewables movement, but there are an impressive number of good ideas in that industry alone. And that is just one of the areas outlined in our New Energies list. So, how does one pick the winners without taking undue risk? Thematic exchange traded funds, or ETFs, offer the solution. Here are a few worth taking a look at.
The iShares Global Clean Energy ETFICLN $24 tracks the S&P Global Clean Energy Index™. With a healthy $5.5 billion in assets, this fund has a nice mix of about 50% utilities, 25% technology, and 25% industrials. If we could sum up this article in one fund’s mix, ICLN would handle the task.
With $2.5B in AUM, the Invesco WilderHill Clean Energy ETFPBW $101 takes a markedly different approach: with virtually no utilities, it breaks down to about one-third each of consumer cyclicals (EV-maker FiskerFSR is its second largest holding), industrials, and technology. Actually, subtract a cool 11% for basic materials. It has dramatically outpaced ICLN over the past 52 weeks, but both are excellent thematic plays.
Drilling down deeper into the renewables picture, for solar bulls the Invesco Solar ETFTAN $90 is the way to go. More of a wind-powered enthusiast? There’s an ETF for that. The First Trust Global Wind ETFFAN $21 focuses on the technology, deployment, and maintenance of wind powered systems.
Here’s the bottom line: Renewable energy is not only here to stay, it will grow into a $3 trillion industry within the decade. Imagine betting on the fossil fuel industry in the early 1950s, or the nascent computer industry in the 1980s. Armored in forethought and vigilance, it is time to join in this movement.
21 mar 2021 penn wealth Report volume 9 issue 02 13 Penn Wealth Report
investment intelligence
Copyright 2021. All Rights Reserved.
Electric Utilities
American Electric Power
The content of this report reflects the personal views, opinions, and research of Penn Wealth Publishing. While measures are taken to help assure the accuracy of data, no guarantees can be made and the firm is not liable for any losses incurred by subscribers. This is not a solicitation to buy. Always consult your investment professional before investing any money.
The extreme cold weather in Texas last month and the subsequent widespread power outages in the region should have served as a wakeup call to anyone taking our national energy grid for granted. And let’s face it, we have become so accustomed to energy-on-demand that our lives are thrown into disarray when the power we need or desire is not available at the flick of a switch.
The cold, hard truth is that our energy grid, the massive interconnected web which delivers power from producers to consumers, is outdated and vulnerable to attack. Whether the culprit is natural or of more nefarious origins, the results are the same: unacceptable disruption.

We paint this rather dire backdrop because it will serve as the catalyst for a massive overhaul to our grid and a major shift into renewable energy. And it makes perfect sense that a utility company controlling over 40,000 miles of transmission capabilities will be a major part of the movement.
The big transition from dirty to clean energy. One reason $40 billion utility American Electric PowerAEP $80 remains off the radar screen for most investors is the erroneous assumption that it is in an antiquated sector. Granted, a plurality of the company’s energy capacity remains coal-generated, but management has an aggressive, $36 billion plan to shift to renewables over the coming five years. The sector is morphing, and investors should pay attention.
Management is targeting a 7% annual rate base growth rate over the next five years, meaning solid growth in revenues. Speaking of rate base expansion, which directly calculates into a regulated utility’s top line potential, AEP has been accumulating wind and solar assets, further adding to the company’s footprint.
We counted eleven major wind and solar projects AEP is currently developing across the country. Back in 2019, the firm bought
the wind assets of Sempra Renewables for $1.05 billion, and last year it completed the acquisition of Invenergy’s interests in the Desert Sky (170MW) and Trent Mesa (156MW) wind farms in Texas.
From an organic growth standpoint, AEP Renewables is constructing a 128MW wind farm in Kingman County, Kansas to be known as Flat Ridge 3. Once completed, AEP Renewables’ clean energy portfolio will generate an impressive 1,495MW of power.
In the Nasdaq? Maybe it is a growth stock. It almost seems blasphemous for a 115-year-old utility to be listed on the techladen Nasdaq exchange, but there it sits. Furthermore, as of late last year it is a member of the prestigious Nasdaq 100, which includes the largest non-financial companies on the exchange. Its fat 3.5% dividend yield also makes it somewhat of an outlier.
No, we are not calling AEP an Apple or Zoom, but we actually like it because it isn’t a typical stock. If we are correct, it is an amalgamation of everything we want from a holding: growth potential, an income stream, and a stalwart in downturns.
We’ve outlined our case for the first two components, but what about the third? AEP has a crazy-low beta of 0.2469—about one-fifth that of conservative Apple. It may sound cliche, but no Americans turn off their utilities during a recession, and electricity doesn’t get any cheaper for consumers when the markets are cratering. Let others write off AEP as an old fashioned blue chip, but it looks like a screaming value to us right now.
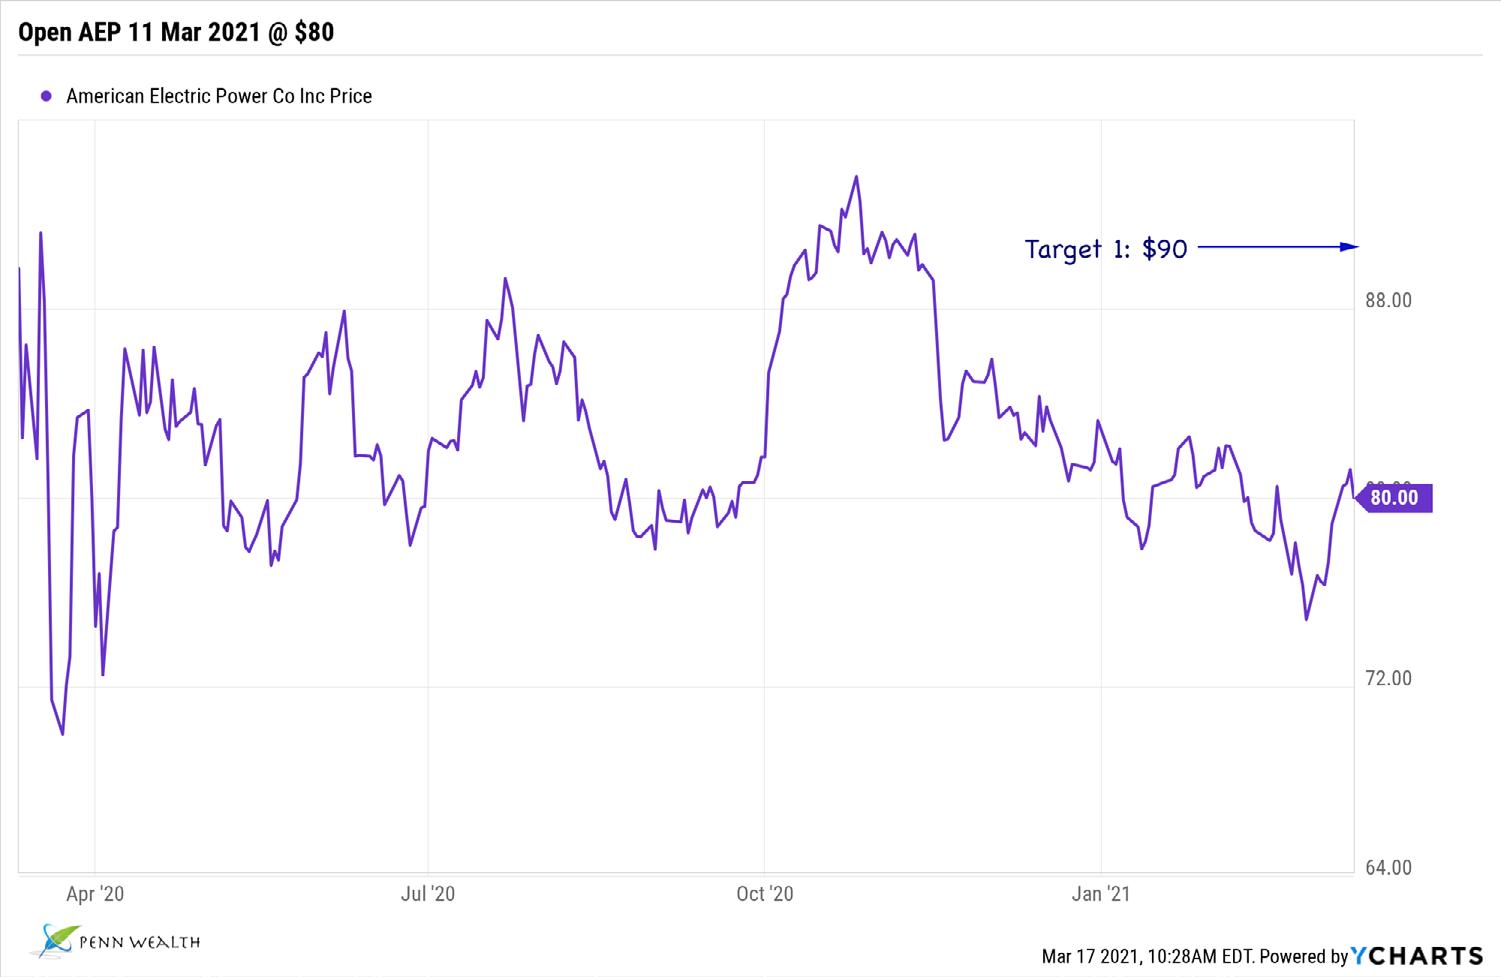
We added American Electric Power to the Penn Global Leaders Club at $80 per share. We considered it for the Strategic Income Portfolio, but ended up putting it in the GLC because of our belief in its long-term story. While our first target price on the shares is $90, we could see them hitting triple-digits in the not-too-distant future.
14 penn wealth Report volume 9 issue 02 21 mar 2021 Penn Wealth Report Copyright 2021. All Rights Reserved. investment intelligence
AEP
The utilities sector is about to morph into something new and exciting, and one particular utility appears especially well-poised to take advantage of the changes. ...everything we want from a holding: growth potential, an income stream, and a stalwart in downturns.
@ $80
INVESTMENT PROFILE
Symbol: AEP
Class: Large-Cap Value Sector: Utilities
Industry: Regulated Electric
Purchase Price: $80.00
Target Price 1*: $90.00
American Electric Power, through its ten operating utilities, is one of the largest regulated utilities firms in the United States. Engaged in the generation, transmission, and distribution of electricity to residential and business customers, AEP provides power to some five million Americans in eleven states.
Half of AEP’s power capacity is coal or nuclear generated, with the remainder emanating from natural gas (30%) and renewables (20%). AEP is undertaking a major renewables push.
Suitable for the Global Leaders Club
At $80 per share, investors seem to be ignoring this well-managed utility. Perhaps they don’t see the growth opportunities ahead as the firm increases its rate base via acquisitions and new builds to greatly expand their renewables footprint.


Penn Wealth Report Copyright 2021. All Rights Reserved. investment intelligence 21 mar 2021 penn wealth Report volume 9 issue 02 15
See disclaimers on the back cover of The Report. This is not a solicitation to invest. Always consult your financial professional before making an investment. *As of date/time written
AEP is making a major strategic move into renewables
The contents of this report reflect the personal views, opinions, and research of Penn Wealth Publishing. While measures are taken to help assure the accuracy of data, no guarantees can be made and the firm is not liable for any losses incurred by subscribers. This is not a solicitation to buy. Always consult your investment professional before investing any money.
ETF Spotlight
Blue Horizon New Energy ETF
The way in which the world generates, delivers, and uses energy is rapidly changing. While there are no shortage of utility, energy, and infrastructure funds to choose from, one new vehicle—in our opinion—embraces the various facets of the new energy environment with efficiency.

The Blue Horizon BNE ETFBNE $29 invests in the companies which comprise the Blue Horizon New Energy Economy 100 Index. This index follows a basket of 100 companies which are leaders, enablers, and beneficiaries of a transformational shift in the way energy is produced, stored, distributed, and consumed.
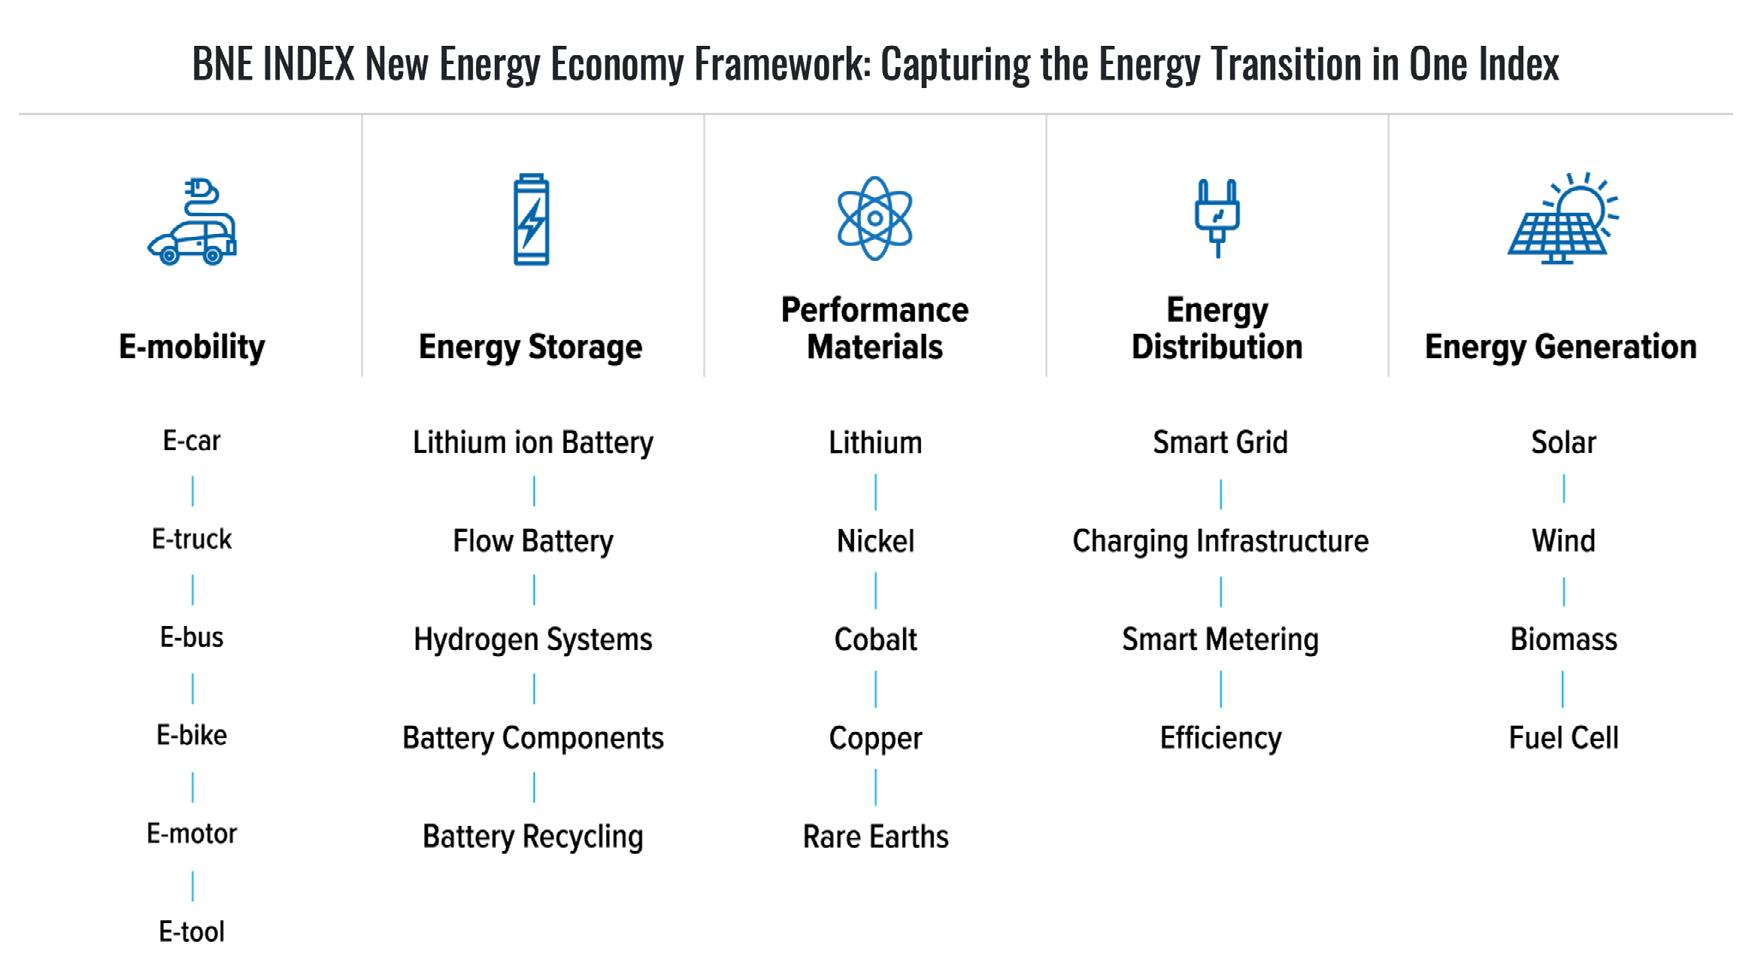
We love the fund’s vertically-integrated approach, which allows it to invest in all five segments of this dynamic field: e-mobility, energy storage, performance materials, energy distribution, and energy generation. These five segments are further broken down into 25 sub-segments, and the 100 or so holdings in the fund are selected judiciously from those sub-segments.
For example, the top holding in BNE is FuelCell Energy IncFCEL $18, a mid-cap electrical equipment and parts manufacturer which designs, makes, sells, installs, operates, and services fuel cell products.
Next on the current list of holdings is a mid-cap semiconductor firm: Daqo New Energy CorpDQ $117 This company makes high-purity polysilicon which it sells to downstream manufacturers who process the substance into ingots, cells, and modules for solar power systems.
Buying into any one of these companies individually would require investors to take on some serious beta (risk), so allowing an experienced management team to hand-pick a basket of holdings makes sense for anyone wishing to participate in this exciting field.
We also like the geographic and industry exposure offered by BNE. About half of the holdings are US firms, another 30% are spread among Asian countries, and 20% hail from developed Europe.
Drilling down to the industry level, about one-quarter of the names are industrials, another quarter are pure technology plays, and the remaining half are basic materials, consumer cyclical, and utilities firms. It is still a thematic investment, meaning increased risk, but we are impressed with the team’s thoughtful selection and risk mitigation process.
We added BNE to the Penn New Frontier Fund (our emerging technologies portfolio) on 26 Feb 2021 @ $28.65 per share.
Table courtesy of Blue Horizon Capital
16 penn wealth Report volume 9 issue 02 21 mar 2021 Penn Wealth Report
investment intelligence
Copyright 2021. All Rights Reserved.
BNE
@ $28
Thematic investments always carry added risk, but we uncovered a new fund in an exciting corner of the energy market.
Under
radar

Headquartered in Fresno, United Security BancsharesUBFO $7 was formed in 2001 as a bank holding company to provide commercial banking services through its wholly-owned subsidiary, United Security Bank. The company’s two primary sources of revenue are interest income from outstanding loans, and investment securities. With a p/e ratio of 14, UBFO has annual operating revenues of $37 million, and net income of $9 million (2020 full-year figures). The company has a cash dividend payout ratio of 60% and a dividend yield of $5.91%. As rates begin to creep higher, we are becoming more bullish on the financial sector, especially the regional banks with sound balance sheets. While UBFO offers a unique growth opportunity for investors, its size ($129M) makes it a bit riskier.
Air Water IncAWTRF $15 is a Japan-based mid-cap ($3.3 billion) specialty chemicals company founded in 1929. The firm manufactures and sells a variety of chemical-based products and operates in five segments: industrial gas, chemicals, medical gases, and agricultural/food products. This under-the-radar gem has a tiny five-year beta of 0.14, a P/E ratio of 12, and a 3% dividend yield. In fiscal 2020, the firm generated $7.4 billion in revenues and $268 million in profits. A cash cow in a steady industry, it hasn’t had an unprofitable year for as far back as the eye can see. We actually like all five of the company’s operating segments going forward, especially the medical and agricultural/food products divisions.
Booz Allen HamiltonBAH $79 provides management consulting services to the US government, major corporations, and institutions on areas ranging from cybersecurity to cloud computing to engineering. As an example, the firm has held contracts with the US Army and US Navy for the past 70 years. Largely on concerns that the new administration might not be willing to fund the Department of Defense as aggressively as the old administration, BAH shares dropped 20% in February. We believe the drop was not warranted, as the firm operates in a number of strong growth industries, such as energy and utilities (think green infrastructure), homeland security, and transportation. BAH carries a low p/e ratio of 20 and a low beta (risk factor) of 0.7695.
Algonquin Power & Utilities CorpAQN $16 is an Ontario-based renewable energy company. This $9 billion utility is engaged in the generation, transmission, and distribution of power. Within the firm’s distribution group, Algonquin (an Indigenous people of Ontario, by the way) owns and operates regulated water, natural gas, and electricity distribution utilities in the US. In its generation group, the company sells electricity produced by its energy facilities, which include hydroelectric, wind, solar, and thermal power plants. Within this group, the firm’s wind farms account for most of the revenue. Finally, in its transmission group, the company focuses on building and investing in natural gas pipelines and electric transmission systems. AQN has a p/e ratio of 19 and a dividend yield of 3.84%.
21 mar 2021 penn wealth Report volume 9 issue 02 17 Penn Wealth Report Copyright 2021. All Rights Reserved. investment intelligence
Security
Financials Regional Banks
The
Four investments being ignored—or missed—by the financial press United
Bancshares
Air Water Inc Basic Materials Specialty Chemicals Booz Allen Hamilton Holding Corp Industrials Consulting Services Algonquin Power & Utilities Corp Utilities Renewables
3 2 1 4
Trading Desk
Actions we have taken at the Penn Trading Desk, plus a look at what other Wall Street analysts have to say...

Penn: Close IRBT In new FRonTIeR
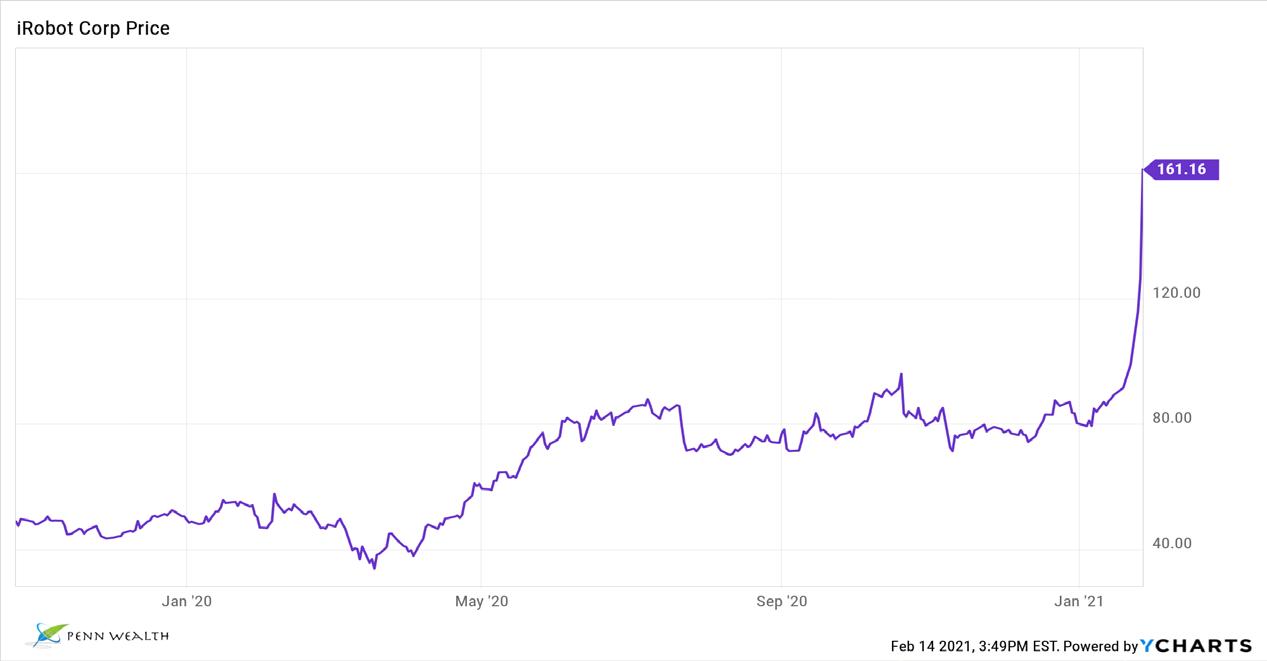
We planned on holding consumer electronics firm iRobot for the long haul, but the reddit brigade changed that. They drove the price up to ridiculous levels, so we took our long-term profit. If it heads back down near the $80 level, we will probably re-add to the NFF. We sold at $176 per share for a 260% longterm profit.
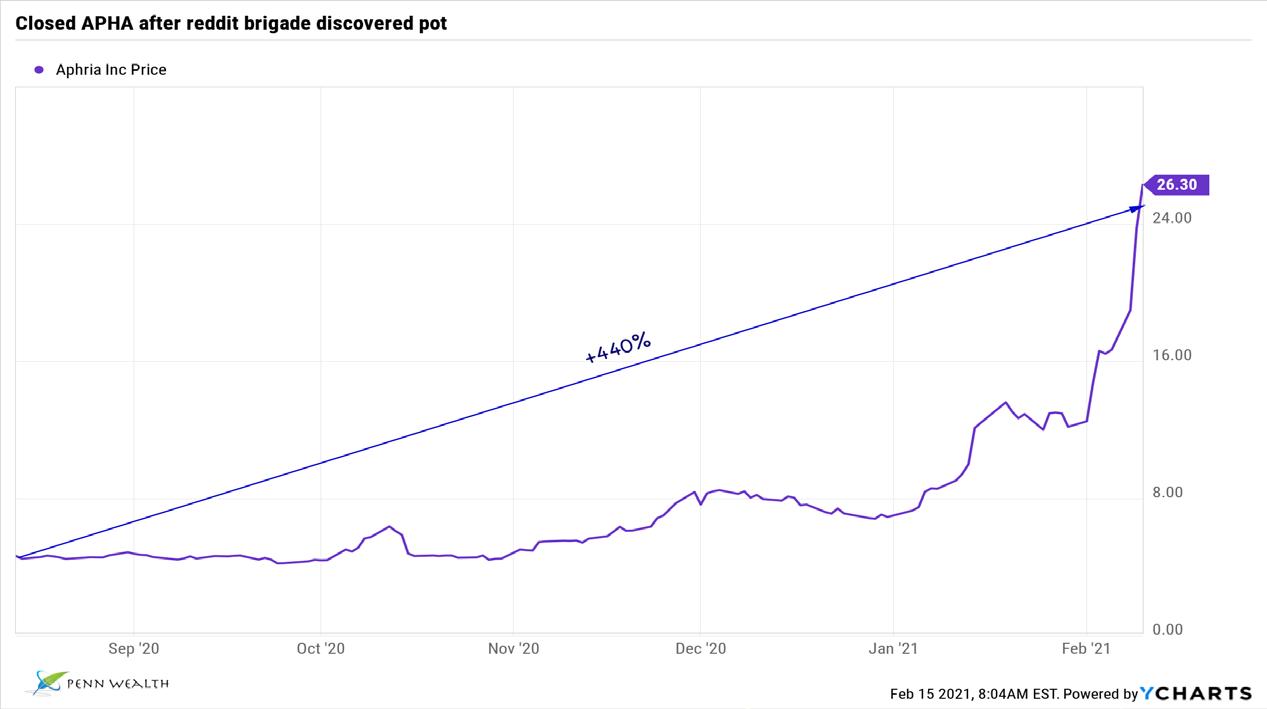
Penn: Close APHA In InTRePId
To remain on top of all recommended trades as they happen, be sure and subscribe to our Twitter feed @ PennWealth. All trade details can be found at the Penn Wealth Trading Desk .
We purchased Canadian pot stock Aphria for $4.63 on 13 Aug 2020 in large part because Irwin Simon took over as CEO. While we expected a longer hold time, the massive run-up in price couldn’t be ignored. We took our 440%, short-term gain, stopping out at $25 per share.
Penn: oPen KGC In GloBAl leAdeRs
Kinross Gold Corp is an $8 billion midcap miner of gold and silver. The Toronto-based firm has strong financials, a very manageable debt load, and a minuscule P/E ratio of 6. With an all-in sustaining cost (AISC) of roughly $1,000 per ounce on gold, and the increasing demand for silver, we see Kinross as an excellent way to play an elongated bull cycle for these metals. We purchased KGC @ $6.54/share on 19 Feb 2021 in the Penn Global Leaders Club, with an initial target price of $10.
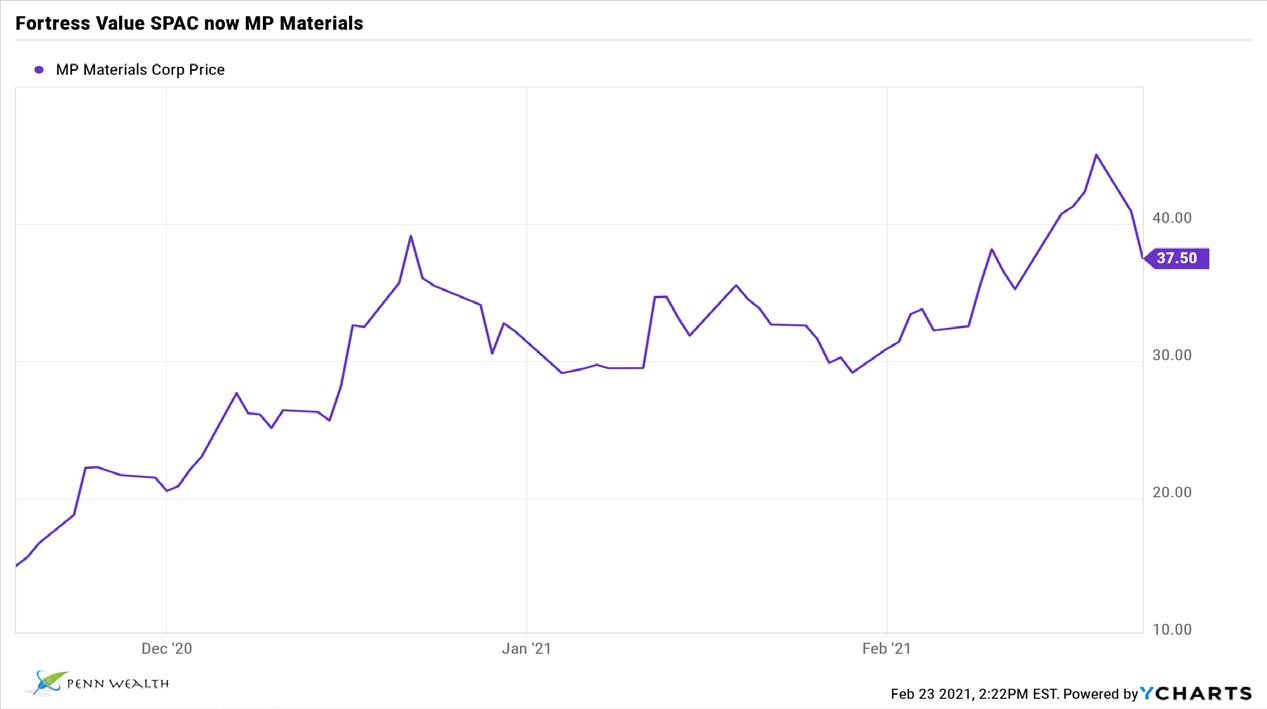
Penn: oPen MP In InTRePId
Penn: oPen Bne In new FRonTIeR
One of the most exciting new areas of the economy is the push into renewable energy. Hundreds of billions of dollars will be spent over the next decade on creating the infrastructure for this dynamic field. There are so many aspects to this area (storage, generation, distro, etc.) that we recommend investors purchase a basket of names across the various fields. We added the Blue Horizon BNE ETF to the New Frontier Fund on 26 Feb @ $28.65/sh.
Ms: loweR TARGeT on VIATRIs
Morgan Stanley lowered its price target on Pfizer spin-off ViatrisVTRS $14 from $18 to $16 per share. This $17B drug manufacturer is actually a combination of Pfizer’s Upjohn and Mylan acquisitions. We are keeping our eye on this dynamic biosimilar focused firm due to its deep bench. Biosimilars are generic-type drugs, different in that they are formulated from living cells (meaning they cannot be identical, just similar). We tend to disagree with this call, meaning a good entry point may be close at hand.
Penn: oPen AeP In GloBAl leAdeRs
The content of this report reflects the personal views, opinions, and research of Penn Wealth Publishing. While measures are taken to help assure the accuracy of data, no guarantees can be made and the firm is not liable for any losses incurred by subscribers. This is not a solicitation to buy. Always consult your investment professional before investing any money.
We have written extensively about China’s rare earth mining dominance— thanks to America’s abdication of that role. Now, one company plans to restore order in this critical corner of the market. MP MaterialsMP $37 owns and operates Mountain Pass, the only rare earth mine remaining in North America. Brought public by the SPAC Fortress Value Acquisition Corp, we added MP to the Intrepid Trading Platform at $37.15/share.
American Electric PowerAEP $80 is one of the largest regulated utilities in the United States, with over 40,000 miles of transmission lines and five million customers spread among eleven states. Not only are we bullish on utilities this year, we also like the firm’s commitment to renewables going forward. We opened AEP in the Global Leaders Club at $80/sh.
deuTsCHe BAnK: Buy AlCoA
Shares of storied aluminum producer AlcoaAA $31 were trading up 6% after Deutsche Bank upgraded the firm to a buy, with a $36 price target. The firm cited the improving outlook for aluminum and an attractive cash flow at AA.
18 penn wealth Report volume 9 issue 02 21 mar 2021 Penn Wealth Report Copyright 2021. All Rights Reserved. investment intelligence
We bought iRobot for the long term, but the reddit brigade forced our hand.
The US is committed to regaining its rare-earth-mining dominance. MP will be the major conduit.
“Boring” utilities may just become one of our best friends during the next downturn.

Close
21 mar 2021 penn wealth Report volume 9 issue 02 19 Penn Wealth Report Copyright 2021. All Rights Reserved. investment intelligence
Open AEP in Global Leaders
We closed our position in Aphria for a 440% gain in six months. IRBT in New Frontier Closed APHA in Intrepid Open MP Materials in Intrepid
Weekly Business Report
The content of this report reflects the personal views, opinions, and research of Penn Wealth Publishing. While measures are taken to help assure the accuracy of data, no guarantees can be made and the firm is not liable for any losses incurred by subscribers. This is not a solicitation to buy. Always consult your
our maritime shipper spikes on the growing concern over container shortage
For anyone who believes that America, or the world in general, is ready to stand up to China’s trade practices, try this one on for size: the communist nation ended 2020 with a record trade surplus. The demand for Chinese goods is now so great that the world is facing a shipping container crisis. Just how bad is it? Because the shippers can make so much more money on the goods leaving China as opposed to the goods entering the country—like grain from the United States—they are literally rushing back empty containers to China to alleviate the backlog of goods waiting at Chinese ports. Spot freight rates are up nearly 300% from a year ago.
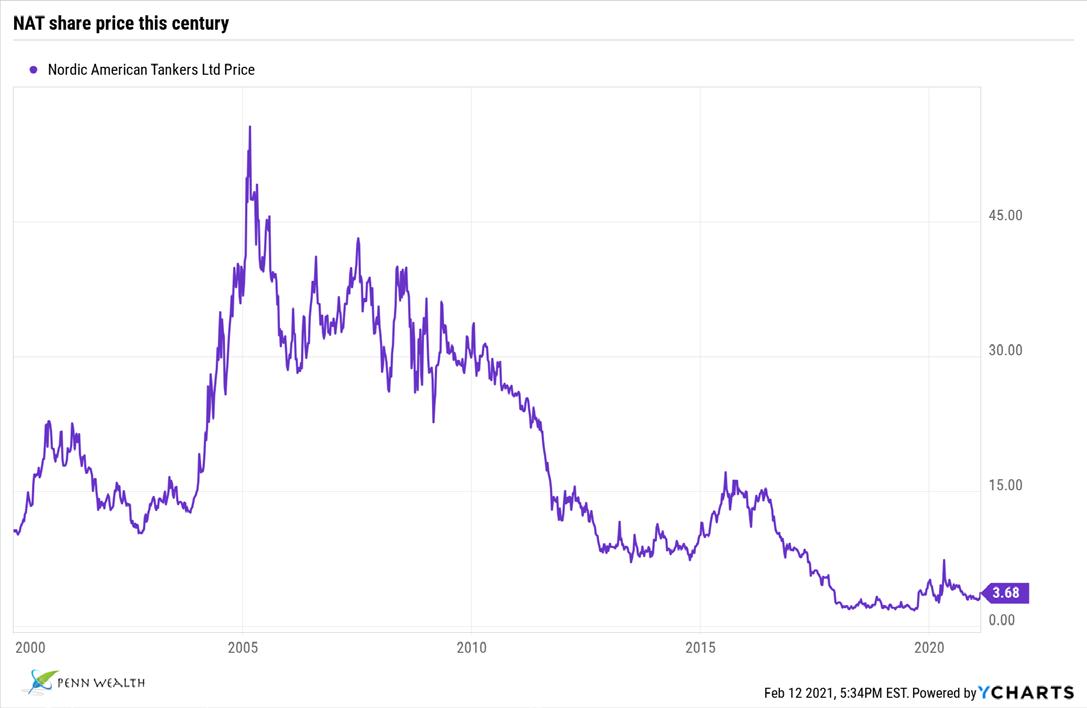
While that is a sick testament to the state of global trade, one industry is certainly reaping the rewards: the maritime shippers which had been crushed during the trade war and subsequent pandemic. We have been fascinated by this highly-cyclical industry for decades, and when one of our favorites, Nordic American Tankers (NAT $4), saw its share price drop to $2.80 this past October, we jumped in, adding the Bermuda-based shipper to the Penn Intrepid Trading Platform. NAT jumped 14% in one day on news of the container shortage.
Think the run will be short-lived or that the shippers are now overvalued? Take a look at the accompanying chart on NAT. Despite the fact that there are nearly 200 million intermodal freight containers around the world, the rapid increase in demand caught nearly everyone off guard. Ready for the icing on the cake? 97% of these containers are now made in, you guessed it, China.
For a brief refresher on the shipping industry, visit our 2018 Penn Wealth Report story on The State of Global Shipping. We see the upswing continuing to gain momentum as global economies revive.
for Hawaii, had one of its two engines suffer an “uncontained failure,” with fire and smoke visible to passengers, and with debris dropping down on a Denver suburb. Thankfully, the aircraft was able to make it back to the airport on one good engine and with no passenger injuries—unlike a very similar incident in 2018 which involved the death of a passenger following engine debris striking a window. That incident occurred just two months after a United Airlines 777 suffered engine failure, with a cracked fan blade forcing the aircraft to make an emergency landing in Honolulu.
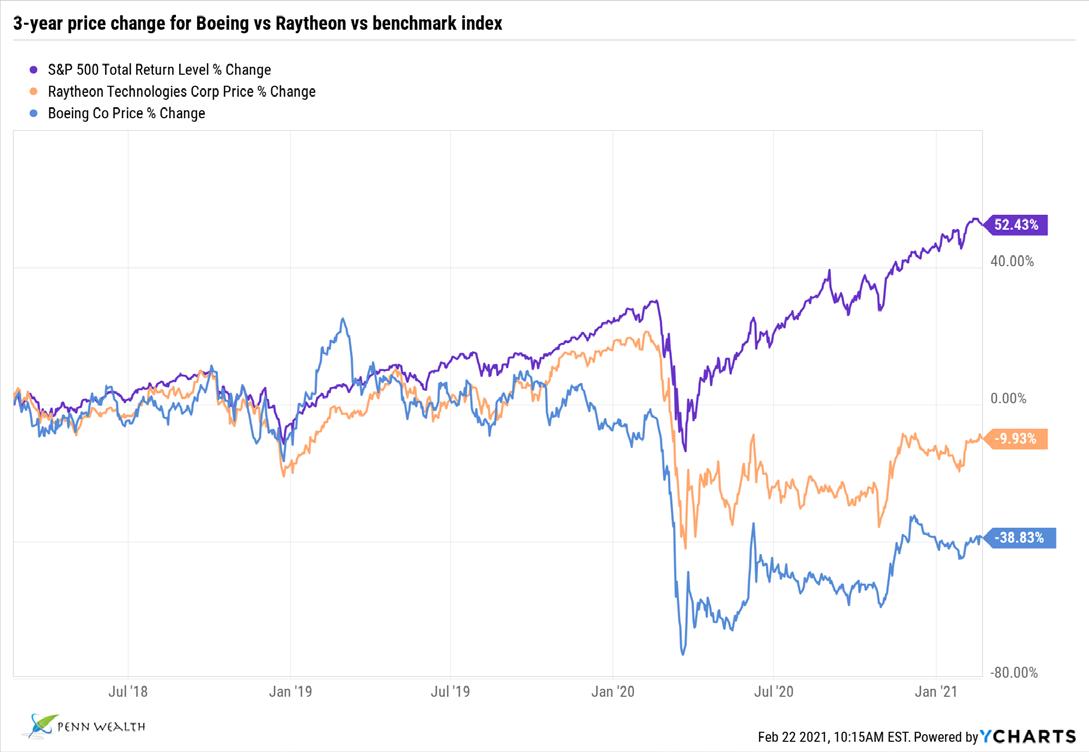
This is an extremely disturbing trend, and one which certainly places Raytheon’sRTX $73 Pratt & Whitney unit in the hot seat. But aircraft maker Boeing shares some blame, as problems continue to mount for the Chicago-based firm. First there were the deadly 737 crashes which grounded the fleet for the better part of two years. Then came the 787 Dreamliner “design flaws” and canceled orders. Now the 777 faces grounding in the US—and probably around the world. And the situation isn’t looking much better on the space side of the business, with the company’s problem-laden Starliner capsule and its high profile recent failures. In each case, Boeing can point fingers at suppliers or partners, but there is a point at which all fingers will point back to them. A sad state of affairs for a formerly-great American company.
The entire Boeing board of directors, along with its C-suite executives, should be broomed. The company needs a clean sweep if it has any chance of returning to its position of aerospace and defense dominance. Unfortunately, the very individuals which need to be fired are all part of the mutual admiration society which controls the decisions on leadership. If ever a company needed an aggressive activist investor to come along and force change, it is right now, and it is at Boeing. Even then, the company’s downward flight path may be too steep to pull out of.
yet more proBlems for Boeing as engine failures mount
It was the last thing BoeingBA $212 needed (how many times have we said that over the past three years?): A Boeing 777, leaving Denver
It has been one of those “new investor” cult stocks with one of the key buzz phrases, or acronym in this case, that the new wave of retail money flocks to: EV. The company is WorkhorseWKHS
20 penn wealth Report volume 9 issue 02 21 mar 2021 Penn Wealth Report
investment intelligenceweekly Business Report
Copyright 2021. All Rights Reserved.
investor darling workhorse has its shares cut in half after losing usps contract
$16 ,
maritime shipping & ports
automotive
investment professional before investing any money.
aerospace & defense
Some of our favorite stories, expounded from “ Penn...After Hours ”...
which has seen its stock price go from $2 per share a year ago to $43 per share a few weeks ago—all on the back of microscopic revenues and chronic annual losses. The financials didn’t matter; pie-in-the-sky promises were enough to bring money flooding into the stock.
The latest promise was the imminent contract by the United States Postal Service to replace its fleet of 150,000+ outdated vehicles. To Workhorse devotees, it was a foregone conclusion that their company would be the recipient. When the contract was awarded to the defense unit of $8 billion industrial firm Oshkosh (OSK $117), WKHS shares nosedived more than 50% in one day. The drop was so rapid that any stop order to protect gains would have been essentially worthless: investors would have been stopped-out at the bottom.
There are some great lessons in this story. Investors need to understand what they are buying, and they need do have at least some inkling as to a company’s fundamentals. Forget the fact that Workhorse had never turned an annual profit, how about the fact that they were barely generating sales? As for “boring” old Oshkosh, the company has a pristine balance sheet and generates solid revenues—and profits— year after year. But who wants boring?
Anyone willing to take a little time to do some basic research can be greatly rewarded by the flow of “dumb money” right now. Don’t get caught up in the hype and follow the lemmings off the cliff; use their moves to help uncover the value plays present in the market.
move will allow AT&T to focus on “connectivity and content,” meaning the 5G wireless, fiber internet, and HBO Max businesses. The deal should close in the second half of this year.
AT&T claims its future lies in the ability to attract and retain customers by melding its telecom and media businesses together, but the company has done a horrendous job with that strategy thus far. It has the power: over 150 million customers provide one heck of a good staging area; but management must implement, and it has yet to show such prowess.
One final point. Technology is disrupting the telecom industry immensely, and AT&T is not one of the disruptors. Not too long ago, the barrier to entry for the competition was massive, but technology is the great equalizer, and that is not good news for Stankey and his team.
We purchased AT&T in the Penn Strategic Income Portfolio years ago, based primarily on its fat dividend yield and seemingly reasonable price. The dividend yield now sits at 7% and the share price remains flat from where we bought in. Management continues to disappoint, but we still believe a fair value of the shares is around $35, or roughly 20% higher from here. We are keeping a keen eye out for any possible destruction in the payout rate, as that may be the first real sign of trouble ahead.
at&t is finally spinning off its satellite and caBle tv services, But that doesn’t necessarily make the company attractive
Back in 2015, telecom giant AT&TT $30 acquired satellite television service provider DirecTV for $66 billion ($49B plus debt), thus beginning a comical boondoggle for the firm. Finally, six years later, T is offloading the albatross for a fraction of what it paid. More accurately, the company is spinning off its satellite and cable operations into a new company with the help of private equity group TPG Capital, which will pay nearly $8 billion in cash to become a minority owner.
The new entity will hold DirecTV, AT&T TV (the firm’s cord-cutting attempt), and U-Verse (which it left on the vine to die when it bought DirecTV). Fair value of the company sits somewhere around $16 billion, with T owning 70% and TPG owning the remaining 30%.
What will management do with the $8 billion windfall? The company said it plans to pay down debt; based on the fact that this $210 billion telecom has approximately $346 billion in short- and longterm debt, that is probably not a bad idea. CEO John Stankey said the
a massive chinese hack hits microsoft...and some 60,000 of its organizational and corporate customers
While there may not be a “hot” war raging between the United States and both China and Russia, the actions of these two nation-states clearly indicate that they are at battle with this country. What it will take for the United States to get on a war footing is unclear, as thousands of victims continue to fall prey to these adversaries.
The most recent attack took place within the MicrosoftMSFT $235 Exchange—a mail and calendar server used by some 200 million individuals and corporations. Unlike the rather cowardly stance taken by AmazonAMZN $3,080, at least Microsoft has been forthcoming with respect to the attacks made on its systems, and has been willing to identify the culprits to help other companies better protect their customer data.
This latest attack, according to the company, was perpetrated by a Chinese-sponsored group known as Hafnium. This group typically targets infectious disease researchers, defense contractors, and other critical agencies in an effort to both steal knowledge and cause general disruption. Adding insult to injury, the group gets its guidance from the Chinese government but uses servers it leases within the United States.
21 mar 2021 penn wealth Report volume 9 issue 02 21 Penn Wealth Report
weekly Business
Copyright 2021. All Rights Reserved.
telecom services
cyBersecurity
The hackers first gained access to the Exchange by exploiting previously-unknown vulnerabilities, then created a malicious webbased interface to take control of the compromised servers remotely. Finally, they used this remote access to steal data from the targeted individuals and organizations. While Microsoft has identified and patched the vulnerability, the perpetrators already in the “body” may still operate untouched. In other words, they were already on the inside when the patch was put in place.
While a serious federal response is needed, which includes an ongoing series of counterstrikes to send a message, companies and individuals must take responsibility and adopt next-level security practices such as multi-factor authentication and deployment of the highest possible level of cybersecurity protection. Unfortunately, these measures will be irritating and costly, but it sure beats the alternative.
Interestingly, Microsoft shares were unfazed by the massive breach. Since taking the helm in 2014 (it is really hard to believe it has been that long since the blowhard Steve Ballmer left), Satya Nadella has transformed the company into a leader in cloud services. It remains one of our strongest conviction buys.
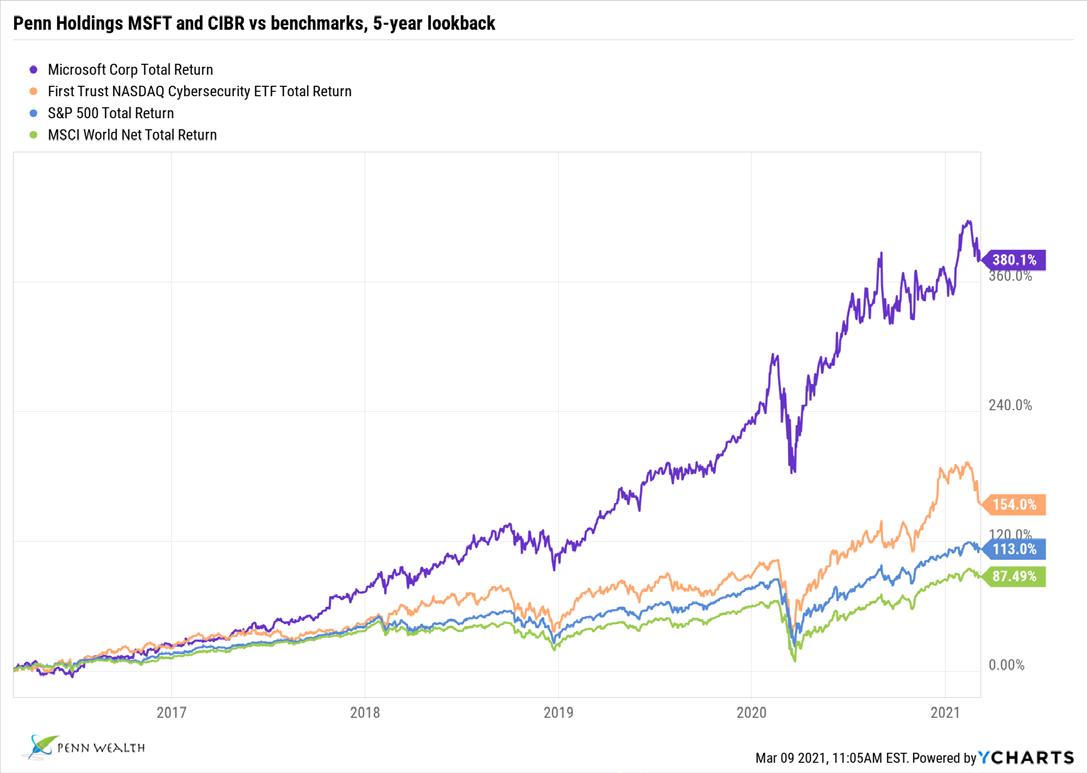
We praise Microsoft for having the guts to be transparent with regard to these attacks, and encourage timid firms like Amazon to follow suit. For investors, cybersecurity—sadly—will be one of the hottest industries for the foreseeable future. We recommend scanning the Penn holding CIBR, the First Trust NASDAQ Cybersecurity ETF, for individual names to consider.
There is incredibly exciting news on the pandemic front: nearly one-quarter of the US population has received at least one dose of the vaccine, causing hospitalization rates to plummet. Let us never forget, however, that over half-amillion Americans never recovered from the deadly virus.
Graph courtesy of Penn Wealth/ YCharts.
pharmaceuticals
vaccine spring: all along, there was only one covid-19 vaccine we said we would not take
Long before the world knew anything about the Wuhan-borne virus which would rapidly escalate into a global pandemic, we were highly bullish on American pharmaceutical and biotech companies. The more politicians bashed these companies, which create the life-saving medications hundreds of millions of people use annually, the angrier we got. If these politicians had their way, cutting-edge research and development within the pharmaceutical industry would take a major hit—as would the overall health of Americans. Before we work ourselves into a lather once again, let’s focus on the incredible progress researchers at these firms made with respect to uncovering a vaccine for the pandemic. With Manhattan Projectlike speed, the men and women at these pharma and biotech companies developed, tested, produced, and delivered highly effective therapies to prevent the deadly disease (535,000 Americans have died from Covid as of this writing).
While we would feel comfortable receiving the Pfizer-BioNTech (PFE/BNTX), Moderna (MRNA), or Johnson & Johnson (JNJ) vaccines, we have held serious reservations about one company’s efforts from the start. Since early testing began, AstraZeneca PLC’s (AZN) vaccine seemed to generate more questions than it answered, and we didn’t like the answers management was doling out. Thankfully, the AZN vaccine was never approved for emergency use in the United States, as it was in Europe. Now, three major European countries, Germany, France, and Italy, are joining a rapidly-growing list of nations having reservations about the vaccine following reports of blood clots in the legs and/or lungs of a number of recipients. True to form, the company quickly blasted the reports, claiming that the percentage of those vaccinated who developed clots were in line with what could be expected within the general population. It should be noted that a number of those coming down with the conditions resided in younger age groups; i.e., below the age these maladies would typically develop.
The company’s objections were reminiscent—at least to us— of management’s response following the questionable trial results. There never seemed to be a sense of “let’s make absolutely sure of this...” so much as “nothing to see here, move along.” And that makes us uncomfortable. A lot of nations now seem to be feeling ill at ease with the company’s vaccine as well.
22 penn wealth Report volume 9 issue 02 21 mar 2021 Penn Wealth Report Copyright
All
weekly Business Report
2021.
Rights Reserved.
Quotes of the Week (For more, visit our blog at PennWealth.wordpress.com)
Apprehension
By Rembrandt Peale; Public Domain


Following Your Passion
By George Frederic Watts Peale; Public Domain

Risk Management
By Joseph Duplessis; Public Domain
21 mar 2021 penn wealth Report volume 9 issue 02 23 Penn Wealth Report Copyright 2021. All Rights Reserved. weekly Business report weekly Business
“When you’re testing to see how deep the water is, never use two feet.”
“The happiness of one in this life does not consist in the absence but in the master of their passions.”
Alfred Lord Tennyson
“How much pain evils have cost us that have never come to pass!”
Thomas Jefferson
Benjamin Franklin
Penn Strategic Income Portfolio (the

Asset Class Classification SymYieldName Equity-Income Derivative Income JEPI 7.60% JPMorgan Equity Income Emerging Markets Bond PYEMX 6.53% Payden Emerging Equities Oil & Gas Midstream ENB 5.82% Enbridge Inc Government Bond - Treasury Inflation-Protected Bond TIP 5.50% iShares TIPS Bond Equities Telecom Services VZ 4.74% Verizon Communications Income Bank Loan SRLN 4.57% SPDR Blackstone Taxable Bond Emerging Markets Bond EMB 4.55% iShares JP Morgan Equities Banks - Diversified BNS 4.43% Bank of Nova Scotia Equities Banks - Regional UBSI 4.20% United Bankshares Equities REIT - Office OFC 4.02% Corporate Office Multisector Bond Multisector Bond HSNIX 3.68% Hartford Strategic Income Multisector Bond NFLT 3.60% Virtus Newfleet Growth and Income Intermediate Core-Plus Bond TOTL 3.48% SPDR® DoubleLine Worldwide Bond World Bond DODLX 3.13% Dodge & Cox Global Growth and Income
Allocation--50% to 70% Equity FAYZX 3.06% Fidelity Advisor® Income Intermediate Core-Plus Bond BOND 2.84% PIMCO Active Bond Taxable Bond Corporate Bond LQD 2.58% iShares iBoxx $ Invmt Allocation
Convertibles CWB 2.19% SPDR® Blmbg Convert Growth and Income Short-Term Bond IGSB 1.62% iShares 1-5 Year Multisector Bond Intermediate Core Bond TGCFX 1.64% TCW Core Fixed Growth and Income Intermediate Core-Plus Bond FIXD 1.56% First Trust TCWOpportunistic Government Bond - Treasury Intermediate Government GOVT 1.10% iShares US Treasury Taxable Bond Short Government AGZ 0.79% iShares Agency Taxable Bond Ultrashort Bond JPST 0.61% JPMorgan Ultra-Short Corporate Bond - High Yield Ultrashort Bond FLRN 0.37% SPDR® Blmbg Inv
Penn Wealth Report investment intelligence Copyright 2021. All Rights Reserved. 24 penn wealth Report volume 9 issue 02 21 mar 2021
Penn Strategies
Penn Strategic Income Portfolio
(the income generator; Risk Level 37)
52 Wk Low Price 52 Wk High 1-yr returnStopDuration
Equity Premium Income ETF $57.08 $61.35 $63.67 13.87% 7.71
Emerging Markets Bond $11.08 $11.30 $13.67 -9.85% 7.71 $36.21 $46.32 $47.42 33.68% N/A
Bond ETF $120.90 $121.71 $131.37 2.07% 7.44 Communications Inc $49.69 $53.70 $59.85 -1.75% N/A
Blackstone Senior Loan ETF $43.83 $44.69 $46.34 1.50% N/A Morgan USD Em Mkts Bd ETF $93.68 $94.47 $113.64 -10.73% 8.14 Scotia $59.05 $68.25 $74.86 15.14% N/A Bankshares Inc $31.74 $33.80 $42.50 -9.60% N/A Office Properties Trust $23.89 $27.37 $30.51 5.15% N/A
Strategic Income I $8.21 $8.23 $9.38 -6.74% 5.06 Multi-Sect Bd ETF $23.54 $23.59 $25.75 -3.31% N/A
DoubleLine Total Return Tact ETF $43.80 $43.96 $48.67 -6.31% 5.32 Global Bond $10.75 $10.77 $12.13 -5.44% 4.00
Advisor® Multi-Asset Income I $13.77 $14.15 $15.19 3.36% 8.49
Bond ETF $99.10 $99.60 $112.27 -7.34% 5.86
Invmt Grade Corp Bd ETF $115.78 $116.49 $136.78 -9.20% 9.30
Convert Secs ETF $70.60 $75.51 $89.78 -10.88% 2.06
Year invmt Grd Corp Bd ETF $51.21 $51.41 $55.00 -4.69% N/A Income I $10.49 $10.49 $11.75 -7.56% 6.32
TCWOpportunistic Fxd Inc ETF $48.21 $48.48 $54.42 -7.81% 6.30
Treasury Bond ETF $24.31 $24.43 $27.05 -6.38% N/A Bond ETF $110.86 $111.29 $119.50 -5.00% 3.82
Ultra-Short Income ETF $50.20 $50.24 $50.77 -0.28% 0.49
Inv Grd Flt Rt ETF $30.36 $30.51 $30.68 -0.05% 0.05
21 mar 2021 penn wealth Report volume 9 issue 02 25 Copyright 2021. All Rights Reserved. investment intelligence
Penn Strategies
Penn Dynamic Growth Strategy

Specialty
Symbol% of PortName FunctionStyle
Aerospace & Defense PPA 5%Invesco Aerospace & Defense ETF SatelliteIndustry
Commodities: AgricultureDBA 4%Invesco DB Agriculture SatelliteThematic$16.57$21.84$22.6426.17%62
Commodities: General BCI 4%abrdn Blmb AllCmdStrK1Fr ETF SatelliteCommodity$22.24$29.01$31.2544.25%62
Consumer Staples RHS 4%Invesco S&P 500® Eql Wt Cnsm Stapl ETFSatelliteSector
Cybersecurity CIBR 4%First Trust NASDAQ Cybersecurity ETF SatelliteThematic$40.66$48.12$56.5812.35%48
Health Care XLV 4%Health Care Select Sector SPDR® ETF SatelliteIndustry$113.35$128.94$141.9814.43%46
Health Care XBI 4%SPDR® S&P Biotech ETF SatelliteSector
Industrials
XLI 3%Industrial Select Sector SPDR® ETF SatelliteIndustry
Inflation INFL 3%Horizon Kinetics Inflation Bnfcrs ETF SatelliteThematic$26.21$32.23$33.0019.41%59
Information Technology FTEC 3%Fidelity® MSCI Information Tech ETF SatelliteSector
International DevelopedIQLT 4%iShares MSCI Intl Quality Factor ETF SatelliteGeographic$33.48$34.34$40.81-3.17%37
International Emerging IEMG 4%iShares Core MSCI Emerging Markets ETFSatelliteGeographic$52.44$52.47$68.18-18.37%30
Large-Cap Blend MOAT 5%VanEck Morningstar Wide Moat ETF SatelliteStrategy
Large-Cap Growth IUSG 5%iShares Core S&P US Growth ETF CoreMarket
Large-Cap Value USMV 7%iShares MSCI USA Min Vol Factor ETF CoreStrategy
Materials
Mid-Cap
Mid-Cap
Mid-Cap
XLB 2%Materials Select Sector SPDR® ETF SatelliteSector
Natural Resources GUNR 5%FlexShares Mstar Glbl Upstrm Nat Res ETFSatelliteSector
Precious Metals GLD 2%SPDR® Gold Shares SatelliteCommodity$157.55$185.09$193.3014.59%62
Real
Small
Blend SCHM 5%Schwab US Mid-Cap ETF™ SatelliteMarket
Growth VLIFX 5%Value Line Mid Cap Focused CoreMarket
Value PAVE 3%Global X US Infrastructure Dev ETF SatelliteThematic$23.38$26.88$29.4510.22%52
Estate ICF 4%iShares Cohen & Steers REIT ETF SatelliteSector
Cap Growth IJT 4%iShares S&P Small-Cap 600 Growth ETFCoreMarket
Utilities XLU 3%Utilities Select Sector SPDR® ETF SatelliteSector 26 penn wealth Report volume 9 issue 02 21 mar 2021 Penn Wealth Report Copyright 2021. All Rights Reserved. investment intelligence
Technology XLK 4%Technology Select Sector SPDR® ETF SatelliteSector
Penn Dynamic Growth Strategy
Strategy (the ETF portfolio)
FunctionStyle
52 wk Low Price 52 wk High 1-year Return RSI Notes
SatelliteIndustry $67.46$75.04$78.756.17%53 replaced ITA 25 Feb 2022
SatelliteThematic$16.57$21.84$22.6426.17%62 replaced ROBO 01 Mar 22
SatelliteCommodity$22.24$29.01$31.2544.25%62
ETFSatelliteSector $153.08$160.45$173.867.11%35
SatelliteThematic$40.66$48.12$56.5812.35%48
SatelliteIndustry$113.35$128.94$141.9814.43%46
SatelliteSector $81.71$84.61$149.24-42.41%40
SatelliteIndustry $93.40$97.94$107.883.93%44
SatelliteThematic$26.21$32.23$33.0019.41%59
SatelliteSector $101.72$110.88$138.085.08%38 Stop loss @ $60
SatelliteGeographic$33.48$34.34$40.81-3.17%37
ETFSatelliteGeographic$52.44$52.47$68.18-18.37%30
SatelliteStrategy $67.29$70.18$78.434.10%38
CoreMarket Cap$87.54$96.05$117.497.38%39
CoreStrategy $67.59$73.23$81.339.50%44100 least vol S&P stocks; rebal qtrly
SatelliteSector $75.83$81.85$92.316.19%45
SatelliteMarket Cap$69.78$71.61$83.73-3.67%42
CoreMarket Cap$27.30$27.85$33.467.87%44
SatelliteThematic$23.38$26.88$29.4510.22%52
ETFSatelliteSector $34.65$45.41$46.3424.95%62 replaced XLC 27 Jan 22
SatelliteCommodity$157.55$185.09$193.3014.59%62
SatelliteSector $56.09$67.38$76.5722.64%49specialty REIT (cell towers, cloud, etc)
ETFCoreMarket Cap$116.25$121.30$144.69-8.42%44
SatelliteSector $127.72$144.06$177.049.67%38
SatelliteSector $61.21$70.43$72.3717.91%60
21 mar 2021 penn wealth Report volume 9 issue 02 27 Penn Wealth Report Copyright 2021. All Rights Reserved. investment intelligence
Sector Industry
Basic MaterialsChemicals
Penn Strategies
Penn Global Leaders Club
SymbolCompany
52-Wk Low
DOWDow Inc $52.07
Basic MaterialsGold NEMNewmont Corp $52.60
Communication ServicesInternet Content & InformationFBMeta Platforms Inc $186.11
Consumer CyclicalAuto Parts
BWABorgWarner Inc $34.85
Consumer CyclicalHome Improvement Retail HDThe Home Depot Inc $266.76
Consumer CyclicalInternet Retail AMZNAmazon.com Inc $2,671.45
Consumer CyclicalRestaurants
CMGChipotle Mexican Grill Inc$1,277.41
Consumer CyclicalSpecialty Retail TSCOTractor Supply Co $165.10
Consumer DefensiveDiscount Stores
DGDollar General Corp $173.50
Consumer DefensiveDiscount Stores TGTTarget Corp $176.68
Consumer DefensiveDiscount Stores WMTWalmart Inc $129.90
Consumer DefensivePackaged Foods GISGeneral Mills Inc $56.67
Energy Oil & Gas Integrated CVXChevron Corp $92.86
Financial ServicesBanks - Diversified RYRoyal Bank of Canada $91.14
Financial ServicesCredit Services PYPLPayPal Holdings Inc $92.25
Financial ServicesCredit Services VVisa Inc $186.67
Financial ServicesFinancial Data & Stock ExchangesCBOECboe Global Markets Inc$96.27
Healthcare Drug Manufacturers - GeneralAMGNAmgen Inc $198.64

Healthcare Drug Manufacturers - GeneralBMYBristol-Myers Squibb Co$53.22
Healthcare Drug Manufacturers - GeneralGILDGilead Sciences Inc $57.32
Healthcare Drug Manufacturers - GeneralGSKGlaxoSmithKline PLC $35.32
Healthcare Drug Manufacturers - GeneralPFEPfizer Inc $34.51
Healthcare Medical Devices
MDTMedtronic PLC $98.38
Healthcare Medical Devices STESteris PLC $179.26
Industrials
Industrials
Industrials
Industrials
Aerospace & Defense
Aerospace & Defense
Airlines
Railroads
LMTLockheed Martin Corp$324.23
RTXRaytheon Technologies Corp$74.63
UALUnited Airlines Holdings Inc$30.54
Pacific Corp
UNPUnion
$195.68 Industrials Specialty Industrial MachineryGNRCGenerac Holdings Inc $251.74 Real Estate REIT - Office DLRDigital Realty Trust Inc$130.10 Real Estate REIT - Residential ESSEssex Property Trust Inc$271.51 Real Estate REIT - Specialty AMTAmerican Tower Corp$212.28 Technology Consumer Electronics AAPLApple Inc $118.86 Technology Electronic Components GLWCorning Inc $33.93 Technology Semiconductor Equipment & MaterialsAMATApplied Materials Inc$112.14
28 penn wealth Report volume 9 issue 02 21 mar 2021 Penn Wealth Report Copyright 2021. All Rights Reserved. investment intelligence
Technology Software - Infrastructure ADBEAdobe Inc $415.43 Technology Software - Infrastructure MSFTMicrosoft Corp $229.35 Utilities Utilities - Diversified EXCExelon Corp $40.11 Utilities Utilities - Regulated Electric AEP American Electric Power Co Inc $79.69 Utilities Utilities - Regulated Electric SOSouthern Co $58.53
Penn Global Leaders Club
Club (the stalwart portfolio)
$60.91 71.38-0.95%$44,81454,96811.48%$4,6857 $76.89 80.7536.09%$60,93612,2229.54% $2,62653
$187.61 384.33-31.50%$510,664117,92933.38%$39,11614 $36.32 55.55-24.96%$8,71614,8383.62% $63816
$316.79 420.6120.26%$330,805151,15710.87%$14,00520 $2,910.49 3,773.08-6.52%$1,480,987469,8227.10%-$14,72645 $1,475.41 1,958.550.91%$41,3597,5478.65% $84064 $226.52 239.8634.67%$25,54512,7317.83% $51026 $205.55 240.149.22%$47,62733,9847.19% $1,61020 $206.97 268.9817.11%$95,707106,0056.55% $5,08115 $142.07 152.579.23%$394,085572,7542.39%$11,07529 $62.27 69.9510.66%$37,56218,60812.02%$2,52517
$170.90 174.7661.32%$332,837155,60610.04%$21,13121 $108.38 119.4120.95%$153,53336,84035.29%$29,36612 $96.57 310.16-61.95%$112,50525,37116.43%$5,43227 $196.71 252.67-12.48%$412,69225,47751.59%$15,22833
$114.00 139.0012.31%$12,1533,49515.14%$1,50723 $228.85 261.002.18%$127,47625,97922.68%$8,38122 $68.87 69.7517.84%$150,11746,38515.08%$15,234neg $58.00 74.12-4.14%$72,72527,30522.80%$10,80512 $40.56 46.8620.31%$103,10046,89412.90%$6,90817 $50.27 61.7150.03%$282,68681,28827.04%$29,86913 $103.82 135.89-10.23%$139,27931,78515.46%$5,67829 $218.76 248.3021.44%$21,9044,2486.57% $41276 $439.04 479.9933.01%$119,56267,0449.42% $7,69919 $96.92 104.3428.76%$144,63764,3886.00% $4,74938 $34.87 63.70-35.50%$11,32024,634-7.97% -$40neg $261.52 270.1424.28%$166,56221,80429.92%$6,09626 $281.64 524.31-15.11%$17,9643,73714.27% $30134 $135.68 178.223.69%$38,5974,42838.60%$1,70223 $336.02 359.4924.54%$21,9251,44133.91% $78445 $234.84 303.7211.96%$107,0609,35727.44%$3,44341 $154.73 182.9427.62%$2,525,107378,32326.58%$101,85326 $36.44 46.82-6.65%$30,82314,08213.54%$1,77529 $123.64 167.066.25%$109,22324,17227.10%$5,98817 $416.38 699.54-7.69%$196,67615,78530.55%$6,88242 $280.07 349.6719.07%$2,099,647184,90338.50%$60,69330 $43.63 58.217.15%$42,76336,3474.69% -$4,96925 $95.54 98.1523.65%$48,17216,79214.82%-$1,92419 $68.69 69.7720.72%$72,82723,11310.42%-$1,07131
52-Wk High 1-Yr Ttl Rtn Mkt Cap ($M) Rev TTM ($M) Prft Mgn TTM Free $ Flow TTM ($M) PE Ratio
Price
21 mar 2021 penn wealth Report volume 9 issue 02 29 Penn Wealth Report
investment intelligence
Copyright 2021. All Rights Reserved.
Position #Entry
Penn Strategies
Penn Intrepid Trading Platform
ExitSymbolCompany
210/30/2020 RGRSturm Ruger & Co Inc 32/23/2021 MPMP Materials Corp 53/4/2022 DOCUDocuSign Inc 63/4/2022 ZMZoom Video Communications Inc
Closed7/20/20213/7/2022WGOWinnebago Industries Inc
Closed5/28/20203/7/2022DALDelta Air Lines Inc
Closed11/24/20213/2/2022JWNNordstrom Inc
Closed6/16/20212/7/2022COINCoinbase Global Inc
Closed6/26/20201/24/2022PK Park Hotels & Resorts Inc
Closed5/27/20201/18/2022MDYSPDR® S&P MIDCAP 400 ETF Trust
Closed7/27/20201/18/2022XLYConsumer Discret Sel Sect SPDR® ETF
Closed10/6/20211/13/2022MKCMcCormick & Co Inc
Closed8/13/20202/10/2021APHAAphria
Closed5/18/202011/23/2020M Macy's Inc
Closed7/9/202010/2/2020BBBYBed Bath & Beyond Inc
Closed6/25/20207/30/2020SIXSix Flags Entertainment Corp
Closed7/7/20207/24/2020REGNRegeneron Pharmaceuticals Inc
Closed5/27/20207/13/2020CLXClorox Co
Closed6/26/20207/7/2020IPHIERR: INVALID COMPANY
Closed6/3/20207/6/2020STAAStaar Surgical Co
Closed6/19/20206/22/2020PLAYDave & Buster's Entertainment Inc
Closed5/7/20206/19/2020SMGThe Scotts Miracle Gro Co
Closed5/28/20206/3/2020SNAPSnap Inc
30 penn wealth Report volume 9 issue 02 21 mar 2021 Penn Wealth Report Copyright
Rights Reserved. investment intelligence
2021. All
Penn Intrepid Trading Platform
The Penn Intrepid Trading Platform is precisely what the name implies. Up to eleven positions are held at any one time, though the number may be far less based on market conditions. The goal of the trades made within the ITP is to notch short-term, double-digit gains (10% would be considered a “win”), while protecting each position with a tight stop-loss order (perhaps 5-7% below purchase price). To calculate the size of a trade, the entire portfolio value is divided by 12, with the share price divided by that number. Note we hold a maximum of 11 positions: the other one-twelfth is always held in cash. On occasion, a half-position may be taken in a stock.
Platform (the trading portfolio)
Open Price
Current/Close Price Stop Gain/Loss Notes
$66.72 $70.64 $59.29 5.88% TP1 $81.40 $37.00 $43.73 $32.93 18.19% TP1 $44.40 $100.00 $75.01 -24.99% TP1 $123.68 $108.00 $98.12 $97.01 -9.15% TP1 $132.98 $68.66 $61.11 -11.00% 11% loss $26.00 $34.00 $34.00 30.77% 31% l/t gain $22.75 $27.00 18.68% 19% gain, three months $233.00 $207.37 -11.00% 11% loss on stop $9.54 $17.50 83.44% 83% gain $325.93 $500.00 53.41% 53% gain $135.89 $190.00 39.82% 40% gain $79.50 $95.40 20.00% 20% gain, three months $4.63 $25.00 439.96% 440% gain, six months $5.55 $10.09 81.80% 82% gain, 6 months $7.75 $18.30 136.13%136% gain, three months $19.23 $17.47 -9.15% 9.15% loss; 1 month $648.04 $602.59 -7.01% 7% loss; 3 weeks $200.00 $229.00 14.50% 14.5% gain, six weeks $110.70 $122.04 10.24% 10.24% gain, 2 weeks $42.74 $59.00 38.04% 38% gain, one month $16.00 $14.47 -9.56% 9.56% loss, < 1 week $136.17 $129.14 -5.16% 5.16% loss, one month $18.23 $19.00 4.22% 4.22% gain, one week
21 mar 2021 penn wealth Report volume 9 issue 02 31 Penn Wealth Report Copyright 2021. All Rights Reserved. investment intelligence
Penn Strategies
Penn New Frontier Fund (the emerging
SymbolCompany Price
Mkt Cap ($M) Rev TTM ($M) Profit TTM
AJRD Aerojet Rocketdyne Holdings Inc $38.78 $3,124 $2,188 6.57%
ATRO Astronics Corp $12.78 $403 $445 -5.75%
TSLA Tesla Inc $795.35 $822,000 $53,823 10.25%
BMRN Biomarin Pharmaceutical Inc $75.98 $13,983 $1,846 -3.47%
JAZZ Jazz Pharmaceuticals PLC $154.68 $9,550 $3,094 -10.65%
LGND Ligand Pharmaceuticals Inc $103.05 $1,737 $277 20.62%

VRTX Vertex Pharmaceuticals Inc $236.48 $60,202 $7,574 30.92%
BIIB Biogen Inc $197.67 $29,050 $10,982 14.17%
GLW Corning Inc $36.44 $30,823 $14,082 13.54%
ARW Arrow Electronics Inc $119.86 $8,114 $34,477 3.21%
RBLX Roblox Corp $39.24 $23,064 $1,919 -25.62%
CTSH Cognizant Technology Solutions Corp $88.04 $46,180 $18,507 11.55%
EPAM EPAM Systems Inc $200.14 $11,384 $3,758 12.82%
UBER Uber Technologies Inc $30.76 $60,119 $17,455 -2.84%
LRCX Lam Research Corp $483.39 $67,433 $16,524 27.78%
PLAB Photronics Inc $17.07 $1,054 $702 10.05%
UCTT Ultra Clean Holdings Inc $40.00 $1,798 $2,102 5.69%
HIMX Himax Technologies Inc $10.54 $1,835 $1,547 28.24%
MU Micron Technology Inc $72.82 $81,542 $29,619 24.86%
QCOM Qualcomm Inc $152.34 $171,687 $36,036 27.71%
CVLT CommVault Systems Inc $60.41 $2,692 $755 4.22%
FTNT Fortinet Inc $279.13 $44,888 $3,342 18.16%
PLTR Palantir Technologies Inc $11.39 $23,123 N/A N/A
32 penn wealth Report volume 9 issue 02 21 mar 2021 Penn Wealth Report Copyright 2021. All Rights Reserved. investment intelligence
Penn New Frontier Fund
emerging technologies portfolio)
Profit Mgn TTM Free $ Flow TTM ($M) PS RatioIndustry 6.57% $162 1 Aerospace & Defense -5.75% -$12 1 Aerospace & Defense 10.25% $3,483 17 Auto Manufacturers -3.47% $185 8 Biotechnology -10.65% $733 3 Biotechnology 20.62% $70 6 Biotechnology 30.92% $2,409 8 Biotechnology 14.17% $3,345 3 Drug Manufacturers - General 13.54% $1,775 2 Electronic Components 3.21% $336 0 Electronics & Computer Distribution -25.62% $558 10 Electronic Gaming & Multimedia 11.55% $2,216 3 Information Technology Services 12.82% $461 3 Information Technology Services -2.84% -$743 3 Software - Application 27.78% $4,030 4 Semiconductor Equipment & Materials 10.05% $73 1 Semiconductor Equipment & Materials 5.69% $152 1 Semiconductor Equipment & Materials 28.24% $380 1 Semiconductors 24.86% $3,882 3 Semiconductors 27.71% $7,416 5 Semiconductors 4.22% $149 4 Software - Application 18.16% $1,204 14 Software - Infrastructure N/A N/A 14 Software - Infrastructure
21 mar 2021 penn wealth Report volume 9 issue 02 33 Penn Wealth Report Copyright 2021. All Rights Reserved. investment intelligence
Most Heavily-Shorted
SymbolCompany
% of Float Short
PE Ratio Industry
PRLDPrelude Therapeutics Inc 69.71% ERR: NO DATABiotechnology
BBBYBed Bath & Beyond Inc 60.23% ERR: NO DATASpecialty
CRTXCortexyme Inc 51.33% ERR: NO DATABiotechnology
FIBKFirst Interstate BancSystem Inc 49.24% 15 Banks
HYMCHycroft Mining Holding Corp 49.22% ERR: NO DATAGold
IGMSIGM Biosciences Inc 49.05% ERR: NO DATABiotechnology
STARiStar Inc 48.55% 26 REIT
ISIGInsignia Systems Inc 46.53% ERR: NO DATAAdvertising
BIRDAllbirds Inc 45.45% ERR: NO DATAApparel
BRBRBellRing Brands Inc 44.17% 37 Packaged TILInstil Bio Inc 44.14% ERR: NO DATABiotechnology
IRBTiRobot Corp 41.70% 25 Furnishings, ICPTIntercept Pharmaceuticals Inc 41.16% ERR: NO DATABiotechnology
HRTXHeron Therapeutics Inc 41.13% ERR: NO DATABiotechnology
FUVArcimoto Inc 38.81% ERR: NO DATARecreational
BLNKBlink Charging Co 38.05% ERR: NO DATAEngineering
BYNDBeyond Meat Inc 37.63% ERR: NO DATAPackaged
CRSRCorsair Gaming Inc 36.55% 17 Computer
SAVACassava Sciences Inc 35.89% ERR: NO DATABiotechnology
LBCLuther Burbank Corp 35.60% 10 Banks
LMNDLemonade Inc 34.93% ERR: NO DATAInsurance
BEEMBeam Global 34.58% ERR: NO DATASolar
INVAInnoviva Inc 34.56% 5 Biotechnology
DDSDillard's Inc 34.03% 9 Department
CRKComstock Resources Inc 33.30% ERR: NO DATAOil &
TTCFTattooed Chef Inc 32.31% 292 Packaged
VLDRVelodyne Lidar Inc 31.66% ERR: NO DATA Scientific
LESLLeslies Inc 31.33% 34 Home
BFRIBiofrontera Inc 30.66% ERR: NO DATA Drug
BGFVBig 5 Sporting Goods Corp 30.65% 4 Specialty
CNKCinemark Holdings Inc 30.20% ERR: NO DATAEntertainment
GTLBGitLab Inc 30.16% ERR: NO DATASoftware
BIGBig Lots Inc 29.54% 7 Discount
AMCXAMC Networks Inc 29.43% 6 Broadcasting
BKEBuckle Inc 29.41% 8 Apparel
ARCHArch Resources Inc 29.21% 96 Thermal
SDCSmileDirectClub Inc 28.95% ERR: NO DATA Medical
OCGNOcugen Inc 28.47% ERR: NO DATABiotechnology
34 penn wealth Report volume 9 issue 02 21 mar 2021 Copyright 2021. All Rights Reserved. investment intelligence
Heavily-Shorted Stocks List
Industry
1-Yr Low Price
1-Yr High Mkt Cap ($B)
DATABiotechnology $8.82 $9.52 95.380.45
DATASpecialty Retail $12.51 $15.46 53.901.49
DATABiotechnology $10.15 $10.68 121.980.32 Banks - Regional $37.23 $44.28 51.242.75
DATAGold $0.43 $0.45 7.800.03
DATABiotechnology $20.03 $21.88 127.110.71 - Diversified $14.75 $25.21 27.751.75
DATAAdvertising Agencies $4.80 $19.40 35.500.03
DATAApparel Retail $12.56 $13.92 32.442.04 Packaged Foods $20.36 $25.92 34.191.01
DATABiotechnology $13.16 $13.85 29.491.79
Furnishings, Fixtures & Appliances $63.37 $66.80 197.401.80
DATABiotechnology $11.60 $17.76 38.940.52
DATABiotechnology $8.09 $8.70 20.450.89
DATARecreational Vehicles $7.02 $7.30 36.800.27
DATAEngineering & Construction $22.52 $23.38 64.500.99
DATAPackaged Foods $58.00 $66.58 221.004.22 Computer Hardware $19.74 $20.72 49.601.95 DATABiotechnology $9.98 $45.88 146.161.84 Banks - Regional $9.18 $14.34 15.370.74
DATAInsurance - Property & Casualty$33.77 $35.22 182.902.17 DATASolar $13.95 $14.35 71.290.13
Biotechnology $10.92 $16.77 18.971.17 Department Stores $63.55 $250.28 416.714.86 & Gas E&P $4.37 $8.89 11.342.07 Packaged Foods $13.36 $13.89 26.901.14 Scientific & Technical Instruments $3.98 $4.15 26.740.82
Home Improvement Retail $19.80 $22.07 32.844.03
Drug Manufacturers - Specialty & Generic $2.25 $4.95 14.630.07 Specialty Retail $10.76 $19.98 47.650.45
DATAEntertainment $13.84 $17.38 27.852.08
DATASoftware - Application $63.30 $64.06 137.009.28 Discount Stores $40.06 $43.41 73.231.33 Broadcasting $32.96 $42.20 83.631.78 Apparel Retail $32.08 $36.29 57.101.81 Thermal Coal $39.02 $96.58 105.581.48 Medical Instruments & Supplies $1.97 $2.25 16.080.87 DATABiotechnology $1.40 $4.25 18.770.85
21 mar 2021 penn wealth Report volume 9 issue 02 35 Copyright 2021. All Rights Reserved. investment intelligence
Penn Wealth Publishing

Your use of this report and the information in the products provided is subject to applicable copyright laws and regulations. You agree to use the products and services provided only for personal purposes. The services and the content provided are the property of Penn Wealth Publishing, LLC, and all content is protected by copyright and other intellectual property laws. You understand and agree that Penn Wealth Publishing owns all legal rights, titles, and interest in all content appearing in the report and in the products provided, including but not limited to the copyrighted content, trademarks, servicemarks, logos, and domain names.
Content in the report and within the products include the views, opinions, and recommendations of the individuals at Penn Wealth Publishing. While measures are taken to help assure the accuracy of data, no guarantees can be made and the firm is not liable for any losses incurred by subscribers. The products and services offered provide information designed to educate the general public. This information does not take into account the unique circumstances which may affect an individual’s decisions and nothing within the information provided should be deemed as personalized advice tailored to an individual’s needs. Do not invest in any of the ideas or recommendations presented in this report without first consulting a financial professional familiar with your unique situation. All investments have risk, including the possible loss of the prinicipal invested. Penn Wealth Publishing is not responsible for the results of actions taken based on the information presented.
This report and its corresponding products may provide hyperlinks to websites. These links are provided only for your reference and convenience, and this does not imply that the firm endorses the operator of or the content within these sites. You are solely responsible for determining the extent to which you use any content on any website we may provide a link to, and you agree not to hold Penn Wealth Publishing responsible for the content or operation of such sites. 9393 West 110th Street, 51 Corporate Woods, Overland Park, KS 66210 913.538.7174 www.pennwealthreport.com member.services@pennwealth.com
36 penn wealth Report volume 9 issue 02 21 mar 2021 Penn Wealth Report Copyright 2021. All Rights Reserved.
