Welcome to the 2022 Fourth Quarter Cape Cod Market Report

For many of us, 2022 marked a return to normalcy. To an extent, the same can be said of the real estate market.
After a white-hot start through the first half of the year, the last six months saw conditions normalize across the country in response to interest rate hikes. In some markets, this has led to falling housing prices. On Cape Cod, however, prices have largely remained stable.
While median sales price growth waned during the last two quarters, the Cape market finished 2022 with a 12% year-overyear increase, marking the third straight year of double-digit gains. Overall, the velocity of the market slowed, particularly in the second half of the year, creating a more balanced environment for buyers and sellers as inventory continues to grow.
In my opinion, there are multiple explanations for why price gains are holding on Cape Cod. First, the sheer amount of wealth created over the past several years has made more cash buyers impervious to interest rates than ever before. Similarly, although sellers are no longer in a position to seek aspirational prices, they are also not feeling any particular urgency.
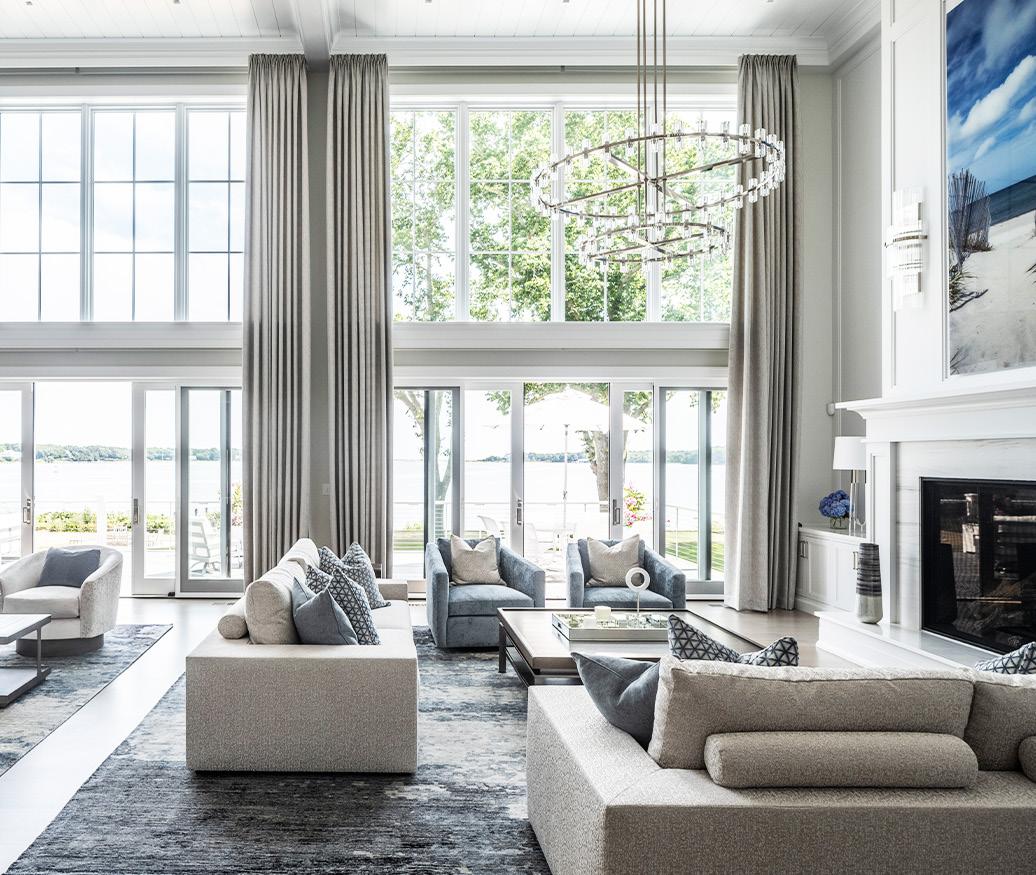
Further, luxury property on Cape Cod will always be extremely limited and it will always be more than just an asset. It caters to a lifestyle where people can spend time with family, enjoy their favorite outdoor activities, and entertain friends, all amidst pristine natural beauty. These, of course, are all things that we have come to value more highly in recent years.
In the pages that follow, you will find a detailed look at the current housing market on Cape Cod over the last quarter of 2022. I hope that this report helps to provide you with a better understanding of the current climate. For more information, or to receive a confidential market analysis of your home, please contact me directly.
ACTIVE LISTINGS $80M +
Paul E. Grover, Principal Broker

AGENTS NATIONWIDE Top 1% CAREER SALES VOLUME $2B +
PRINICIPAL BROKER
PAUL E. GROVER
Luxury Market Summary
Osterville, Massachusetts South Bay Road
Cape Cod
$3,000,000 - $3,999,999
$4,000,000 - $4,999,999
$3,000,000 - $3,999,999
$3,000,000 - $3,999,999
$4,000,000 - $4,999,999
Q4 2022 % Δ (QTR) Q3 2022 % Δ (YR) Q4 2021
32 CARET-DOWN
36 CARET-DOWN
40
15 CARET-UP
13 CARET-UP
14
6 CARET-UP
5
6
7
7 CARET-DOWN
14
60 CARET-DOWN
61 CARET-DOWN
74
Q4 2022 % Δ (QTR) Q3 2022 % Δ (YR) Q4 2021
21 CARET-DOWN
43 CARET-DOWN
23
5 CARET-DOWN
13 CARET-DOWN
4 CARET-DOWN
7 CARET-DOWN
5 CARET-DOWN
9 CARET-DOWN
35 CARET-DOWN
72 CARET-DOWN
45
Q4 2022 % Δ
Q3 2022 % Δ
Q4 2021
54 CARET-UP 8% 50 CARET-UP
43
25 CARET-DOWN
31 CARET-UP
21
6 CARET-DOWN
7 CARET-DOWN
9
31 CARET-DOWN
36 CARET-UP
20
116 CARET-DOWN
124 CARET-UP
93
All data from the Cape Cod and Islands Association of REALTORS ® Sold
$2,000,000 - $2,999,999
11.1%
20%
15.4%
7.1%
20%
0%
$5,000,000+
0%
50%
Total
1.6%
18.9%
Pending
$2,000,000 - $2,999,999
51.2%
8.7%
61.5%
44.4% 9 $4,000,000 - $4,999,999
42.9%
33.3% 6 $5,000,000+
44.4%
28.6% 7 Total
51.4%
22.2%
Active
(QTR)
(YR)
$2,000,000 - $2,999,999
25.6%
19.4%
19%
14.3%
33.3%
$5,000,000+
13.9%
55%
Total
6.5%
24.7%
RESIDENTIAL, $2M+
Mashpee, Massachusetts Daniels Island
All data from the Cape Cod and Islands Association of REALTORS ® Cape Cod Q4 2022 % Δ (QTR) Q3 2022 % Δ (YR) Q4 2021 New Listings 629 CARET-DOWN 42.3% 1091 CARET-DOWN 16.1% 750 Active Listings 393 CARET-DOWN 35.1% 606 CARET-UP 17% 336 Pending Sales 653 CARET-DOWN 29.6% 928 CARET-DOWN 23.7% 856 Closed Sales 768 CARET-DOWN 16.8% 923 CARET-DOWN 30.5% 1105 Average DOM 38 CARET-UP 58.1% 24 CARET-UP 26.7% 30 Median Sales Price $685,000 0% $685,000 CARET-UP 5.4% $650,000 SINGLE FAMILY HOMES Highest Sale $10.5M Closed Sales YOY CARET-DOWN 30.5% Median Sales Price YOY CARET-UP 5.4% KEY TAKEAWAYS Cape Cod Upper Cape | Mid Cape | Lower Cape | Outer Cape
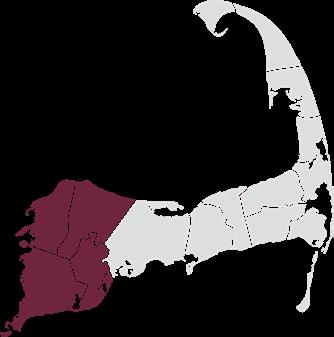
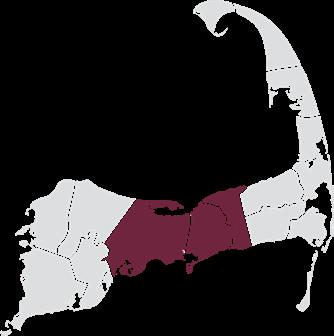
Upper Cape Upper Cape Q4 2022 % Δ (QTR) Q3 2022 % Δ (YR) Q4 2021 New Listings 204 CARET-DOWN 46.2% 379 CARET-DOWN 6% 217 Active Listings 147 CARET-DOWN 36.1% 230 CARET-UP 30.1% 113 Pending Sales 209 CARET-DOWN 33.2% 313 CARET-DOWN 21.4% 266 Closed Sales 257 CARET-DOWN 15.5% 304 CARET-DOWN 24.2% 339 Average DOM 39 CARET-UP 44.4% 27 CARET-UP 34.8% 29 Median Sales Price $670,000 CARET-DOWN 3.6% $695,000 CARET-UP 4.9% $639,000 SINGLE FAMILY HOMES Highest Sale $6.9M Active Listings YOY CARET-UP 30.1% Median Sales Price $670K Sandwich | Bourne | Mashpee | Falmouth KEY TAKEAWAYS All data from the Cape Cod and Islands Association of REALTORS ®
All data from the Cape Cod and Islands Association of REALTORS ® Mid Cape Q4 2022 % Δ (QTR) Q3 2022 % Δ (YR) Q4 2021 New Listings 229 CARET-DOWN 45.3% 419 CARET-DOWN 28.7% 321 Active Listings 115 CARET-DOWN 43.6% 204 CARET-DOWN 10.9% 129 Pending Sales 265 CARET-DOWN 28.4% 370 CARET-DOWN 27.2% 364 Closed Sales 316 CARET-DOWN 16% 376 CARET-DOWN 29.6% 449 Average DOM 39 CARET-UP 77.3% 22 CARET-UP 25.8% 31 Median Sales Price $590,000 CARET-DOWN 1.7% $600,000 CARET-UP 9.3% $540,000 SINGLE FAMILY HOMES Highest Sale $10.5M Avg. DOM QOQ CARET-UP 77.3% Median Sales Price QOQ CARET-DOWN 1.7% KEY TAKEAWAYS Mid Cape Barnstable |
| Yarmouth
Dennis
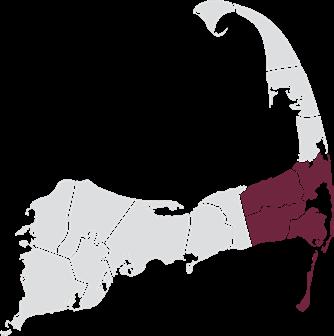
All data from the Cape Cod and Islands Association of REALTORS ® Lower Cape Q4 2022 % Δ (QTR) Q3 2022 % Δ (YR) Q4 2021 New Listings 137 CARET-DOWN 27.5% 189 CARET-DOWN 4.9% 144 Active Listings 86 CARET-DOWN 18.9% 106 CARET-UP 22.9% 70 Pending Sales 118 CARET-DOWN 29.8% 168 CARET-DOWN 23.4% 154 Closed Sales 133 CARET-DOWN 23.1% 173 CARET-DOWN 38.4% 216 Average DOM 39 CARET-UP 95% 20 CARET-UP 30% 30 Median Sales Price $855,500 CARET-DOWN 2.2% $875,000 CARET-UP 6.9% $800,000 SINGLE FAMILY HOMES Highest Sale $7M Avg. DOM QOQ CARET-UP 95% Median Sales Price $855K KEY TAKEAWAYS Lower Cape Chatham | Orleans | Brewster | Harwich
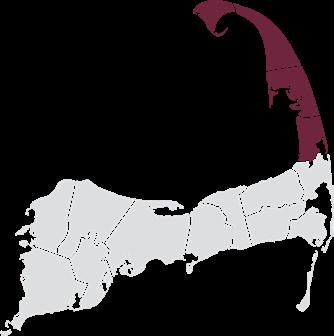
All data from the Cape Cod and Islands Association of REALTORS ® Outer Cape Q4 2022 % Δ (QTR) Q3 2022 % Δ (YR) Q4 2021 New Listings 59 CARET-DOWN 43.3% 104 CARET-DOWN 13.2% 68 Active Listings 45 CARET-DOWN 31.8% 66 CARET-UP 80% 25 Pending Sales 61 CARET-DOWN 20.8% 77 CARET-DOWN 15.3% 72 Closed Sales 62 CARET-DOWN 11.4% 70 CARET-DOWN 38.6% 101 Average DOM 24 CARET-DOWN 20% 30 CARET-DOWN 22.6% 31 Median Sales Price $947,000 CARET-UP 18.4% $800,000 CARET-UP 15.5% $820,000 SINGLE FAMILY HOMES Highest Sale $4.88M Active Listings YOY CARET-UP 80% Median Sales Price QOQ CARET-UP18.4% KEY TAKEAWAYS Outer Cape Provincetown | Truro | Wellfleet | Eastham

© 2023 BHH Affiliates, LLC. An independently owned and operated franchisee of BHH Affiliates, LLC. Berkshire Hathaway HomeServices and the Berkshire Hathaway HomeServices symbol are registered service marks of Columbia Insurance Company, a Berkshire Hathaway affiliate. Equal Housing Opportunity. The information contained herein is deemed accurate but not guaranteed. (508) 364-3500 pgrover@robertpaul.com 867 Main Street Osterville, MA 02655 140 Newbury Street Boston, MA 02116 An Elevated Real Estate Experience

 PRESENTED BY PAUL E. GROVER