CAPE COD
Market Report
PRESENTED BY PAUL E. GROVER

Q1 2023
Welcome to the Q1 2023 Cape Cod Market Report
The spring real estate market is well underway and, if the first quarter is any indicator, it’s going to be a busy season for the luxury sector on Cape Cod.
From the 30,000-foot view, low inventory continues to be the market’s most defining factor. The first quarter saw an 8% decrease year-over-year in active listings on the Cape and a 19% drop in transactions, while the median sales price climbed 4%.
However, the luxury segment, defined as listings priced at $2M and above, was a different story altogether, with inventory up an impressive 55% compared to Q1 last year. Through the first quarter, the $5M+ segment was particularly strong, with six sales and another eight listings put under agreement.
From my standpoint, the high-end sector’s encouraging activity has a rather simple two-pronged explanation: many sellers have quickly adjusted to a more balanced market than we have seen over the last few years and buyers continue to view prime Cape Cod real estate as a safe investment in a time of economic uncertainty. The key to success on both sides has been
professional representation with an indepth understanding of the latest data.
In the pages that follow, you will find a detailed look at the current housing market on Cape Cod over the first quarter of 2023. I hope that this report helps to provide you with a better understanding of the current climate. For more information, or to receive a confidential market analysis of your home, please contact me directly.
Paul E. Grover, Principal Broker

IN CLOSED SALES
$32M
Q1 STATISTICS
$92M UNDER AGREEMENT $17.5M

IN ACTIVE LISTINGS
GROVER
BROKER
PAUL E.
PRINICIPAL
Cape Cod
Luxury Market Summary
South Bay Road
Osterville, Massachusetts
RESIDENTIAL, $2M+
All data from the Cape Cod and Islands Association of REALTORS ®
Sold Q1 2023 % Δ (QTR) Q4 2022 % Δ (YR) Q1 2022 $2,000,000 - $2,999,999 20 CARET-DOWN 37.5% 32 CARET-DOWN 13% 23 $3,000,000 - $3,999,999 4 CARET-DOWN 73.3% 15 CARET-DOWN 69.2% 13 $4,000,000 - $4,999,999 4 CARET-DOWN 33.3% 6 CARET-UP 33.3% 3 $5,000,000+ 6 CARET-DOWN 14.3% 7 0% 6 Total 34 CARET-DOWN 43.3% 60 CARET-DOWN 24.4% 45 Pending Q1 2023 % Δ (QTR) Q4 2022 % Δ (YR) Q1 2022 $2,000,000 - $2,999,999 21 0% 21 CARET-DOWN 32.3% 31 $3,000,000 - $3,999,999 6 CARET-UP 20% 5 CARET-DOWN 57.1% 14 $4,000,000 - $4,999,999 3 CARET-DOWN 25% 4 CARET-DOWN 25% 4 $5,000,000+ 8 CARET-UP 60% 5 CARET-UP 14.3% 7 Total 38 CARET-UP 8.6% 35 CARET-DOWN 32.1% 56 Active Q1 2023 % Δ (QTR) Q4 2022 % Δ (YR) Q1 2022 $2,000,000 - $2,999,999 58 CARET-UP 7.4% 54 CARET-UP 65.7% 35 $3,000,000 - $3,999,999 21 CARET-DOWN 16% 25 CARET-UP 40% 15 $4,000,000 - $4,999,999 10 CARET-UP 66.7% 6 CARET-UP 66.7% 6 $5,000,000+ 34 CARET-UP 9.7% 31 CARET-UP 47.8% 23 Total 123 CARET-UP 6% 116 CARET-UP 55.7% 79
Scraggy Neck Road
Cataumet, Massachusetts
Cape Cod
All data from the Cape Cod and Islands Association of REALTORS ®
Cape Cod Q1 2023 % Δ (QTR) Q4 2022 % Δ (YR) Q1 2022 New Listings 617 CARET-DOWN 1.9% 629 CARET-DOWN 19.8% 769 Active Listings 331 CARET-DOWN 15.8% 393 CARET-DOWN 8.1% 360 Pending Sales 613 CARET-DOWN 6.1% 653 CARET-DOWN 10.1% 682 Closed Sales 539 CARET-DOWN 29.8% 768 CARET-DOWN 19.1% 666 Average DOM 53 CARET-UP 39.7% 38 CARET-UP 43.2% 37 Median Sales Price $675,000 CARET-DOWN 1.5% $685,000 CARET-UP 4% $649,000 SINGLE FAMILY HOMES Highest Sale $12.2M Active Listings QOQ CARET-DOWN
Median Sales Price YOY CARET-UP
KEY TAKEAWAYS
15.8%
4%
Upper Cape | Mid Cape | Lower Cape | Outer Cape
Upper Cape
All data from the Cape Cod and Islands Association of REALTORS ®
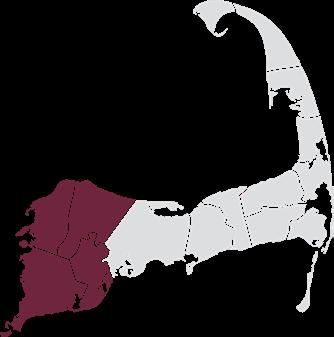
Upper Cape Q1 2023 % Δ (QTR) Q4 2022 % Δ (YR) Q1 2022 New Listings 226 CARET-UP 10.8% 204 CARET-DOWN 25.9% 305 Active Listings 127 CARET-DOWN 13.6% 147 CARET-DOWN 1.6% 129 Pending Sales 224 CARET-UP 7.2% 209 CARET-DOWN 10.8% 251 Closed Sales 192 CARET-DOWN 25.3% 257 CARET-DOWN 12.3% 219 Average DOM 58 CARET-UP 48.7% 39 CARET-UP 65.2% 35 Median Sales Price $699,500 CARET-UP 4.4% $670,000 CARET-UP 11.9% $625,000 SINGLE FAMILY HOMES Highest Sale $7.25M Closed Sales YOY CARET-DOWN 12.3% Median Sales Price YOY CARET-UP
11.9% Sandwich | Bourne | Mashpee | Falmouth
KEY TAKEAWAYS
Barnstable | Dennis | Yarmouth
Mid Cape
3.4%
All data from the Cape Cod and Islands Association of REALTORS ®
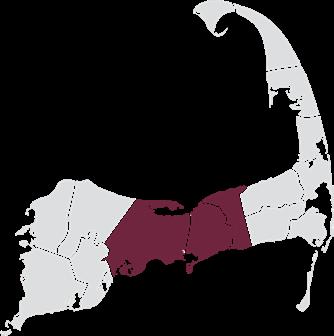
Mid Cape Q1 2023 % Δ (QTR) Q4 2022 % Δ (YR) Q1 2022 New Listings 229 0% 229 CARET-DOWN 27.1% 314 Active Listings 104 CARET-DOWN 9.6% 115 CARET-DOWN 16.8% 125 Pending Sales 231 CARET-DOWN 12.8% 265 CARET-DOWN 19.2% 286 Closed Sales 204 CARET-DOWN 35.4% 316 CARET-DOWN 28.4% 285 Average DOM 53 CARET-UP 35.9% 39 CARET-UP 39.5% 38 Median Sales Price $570,000 CARET-DOWN 3.4% $590,000 0% $570,000 SINGLE FAMILY HOMES Highest Sale $12.2M Closed Sales YOY CARET-DOWN
Median Sales Price QOQ CARET-DOWN
28.4%
KEY TAKEAWAYS
10.2%
All data from the Cape Cod and Islands Association of REALTORS ®
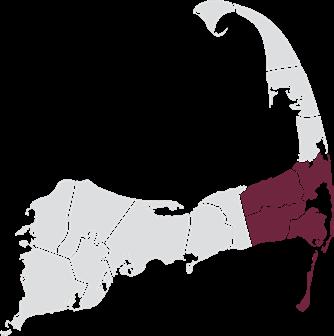
Lower Cape Q1 2023 % Δ (QTR) Q4 2022 % Δ (YR) Q1 2022 New Listings 114 CARET-DOWN 16.8% 137 CARET-UP 7.5% 106 Active Listings 81 CARET-DOWN 5.8% 86 CARET-UP 42.1% 57 Pending Sales 119 CARET-UP 0.8% 118 CARET-UP 14.4% 104 Closed Sales 98 CARET-DOWN 26.3% 133 CARET-DOWN 13.3% 113 Average DOM 45 CARET-UP 15.4% 39 CARET-UP 12.5% 40 Median Sales Price $750,000 CARET-DOWN 12.3% $855,500 CARET-DOWN 10.2% $835,000 SINGLE FAMILY HOMES Highest Sale $4.1M Pending Sales YOY CARET-UP
Median Sales Price YOY CARET-DOWN
KEY TAKEAWAYS
14.4%
Lower Cape
Chatham | Orleans | Brewster | Harwich
All data from the Cape Cod and Islands Association of REALTORS ®
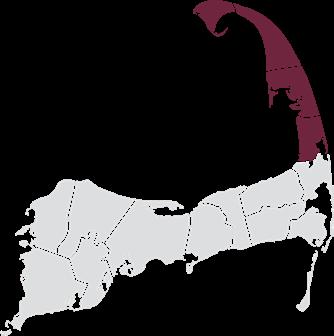
Outer Cape Q1 2023 % Δ (QTR) Q4 2022 % Δ (YR) Q1 2022 New Listings 48 CARET-DOWN 11.1% 54 CARET-UP 9.1% 44 Active Listings 48 CARET-UP 6.7% 45 CARET-UP 140% 20 Pending Sales 39 CARET-DOWN 23.5% 51 CARET-DOWN 4.9% 41 Closed Sales 45 CARET-DOWN 2.2% 46 CARET-DOWN 8.2% 49 Average DOM 49 CARET-UP 75% 28 CARET-UP 53.1% 32 Median Sales Price $766,750 CARET-DOWN 19% $947,000 CARET-DOWN 4.2% $800,000 SINGLE FAMILY HOMES Highest Sale $2.83M Active Listings YOY CARET-UP 140% Median Sales Price QQQ CARET-DOWN 19% KEY TAKEAWAYS Outer Cape Provincetown | Truro | Wellfleet | Eastham

© 2023 BHH Affiliates, LLC. An independently owned and operated franchisee of BHH Affiliates, LLC. Berkshire Hathaway HomeServices and the Berkshire Hathaway HomeServices symbol are registered service marks of Columbia Insurance Company, a Berkshire Hathaway affiliate. Equal Housing Opportunity. The information contained herein is deemed accurate but not guaranteed. (508) 364-3500 pgrover@robertpaul.com 867 Main Street Osterville, MA 02655 140 Newbury Street Boston, MA 02116 An Elevated Real Estate Experience
