CAPE COD
Market Report
PRESENTED BY PAUL E. GROVER

Q2 2023
Welcome to the Q2 2023 Cape Cod Market Report
It was a busy first half of the year for the Cape Cod real estate market. Based on the latest statistics, we can expect this to continue through the rest of the summer.
Perhaps the biggest story of the second quarter was the strength of the luxury market. Year-over-year, listings put under agreement priced at $2 million and above were up an impressive 33%. At the top of the market, nine properties over $5 million were put under agreement, even with the second quarter in 2022.
At all price points, sales were down nearly 17% compared to last year, and the average number of days on market ticked up but is still nowhere near pre-pandemic levels. Nonetheless, prices are largely holding, with a marginal drop of 0.1% in median sales price year-over-year.
As high-end inventory grows and buyers are increasingly met with options to choose from, we can expect to see a busy luxury market through the summer. Sellers who are strategic with pricing and presentation
are seeing competitive offers as the market continues to trend in a positive direction.
In the pages that follow, you will find a detailed look at the current housing market on Cape Cod over the second quarter of 2023. For more information, or to receive a confidential market analysis of your home, please contact me directly.
Paul E. Grover, Principal Broker

IN CLOSED SALES $65M
FIRST HALF 2023 STATISTICS
$110M UNDER AGREEMENT
IN ACTIVE LISTINGS

GROVER PRINICIPAL BROKER
$33M PAUL E.
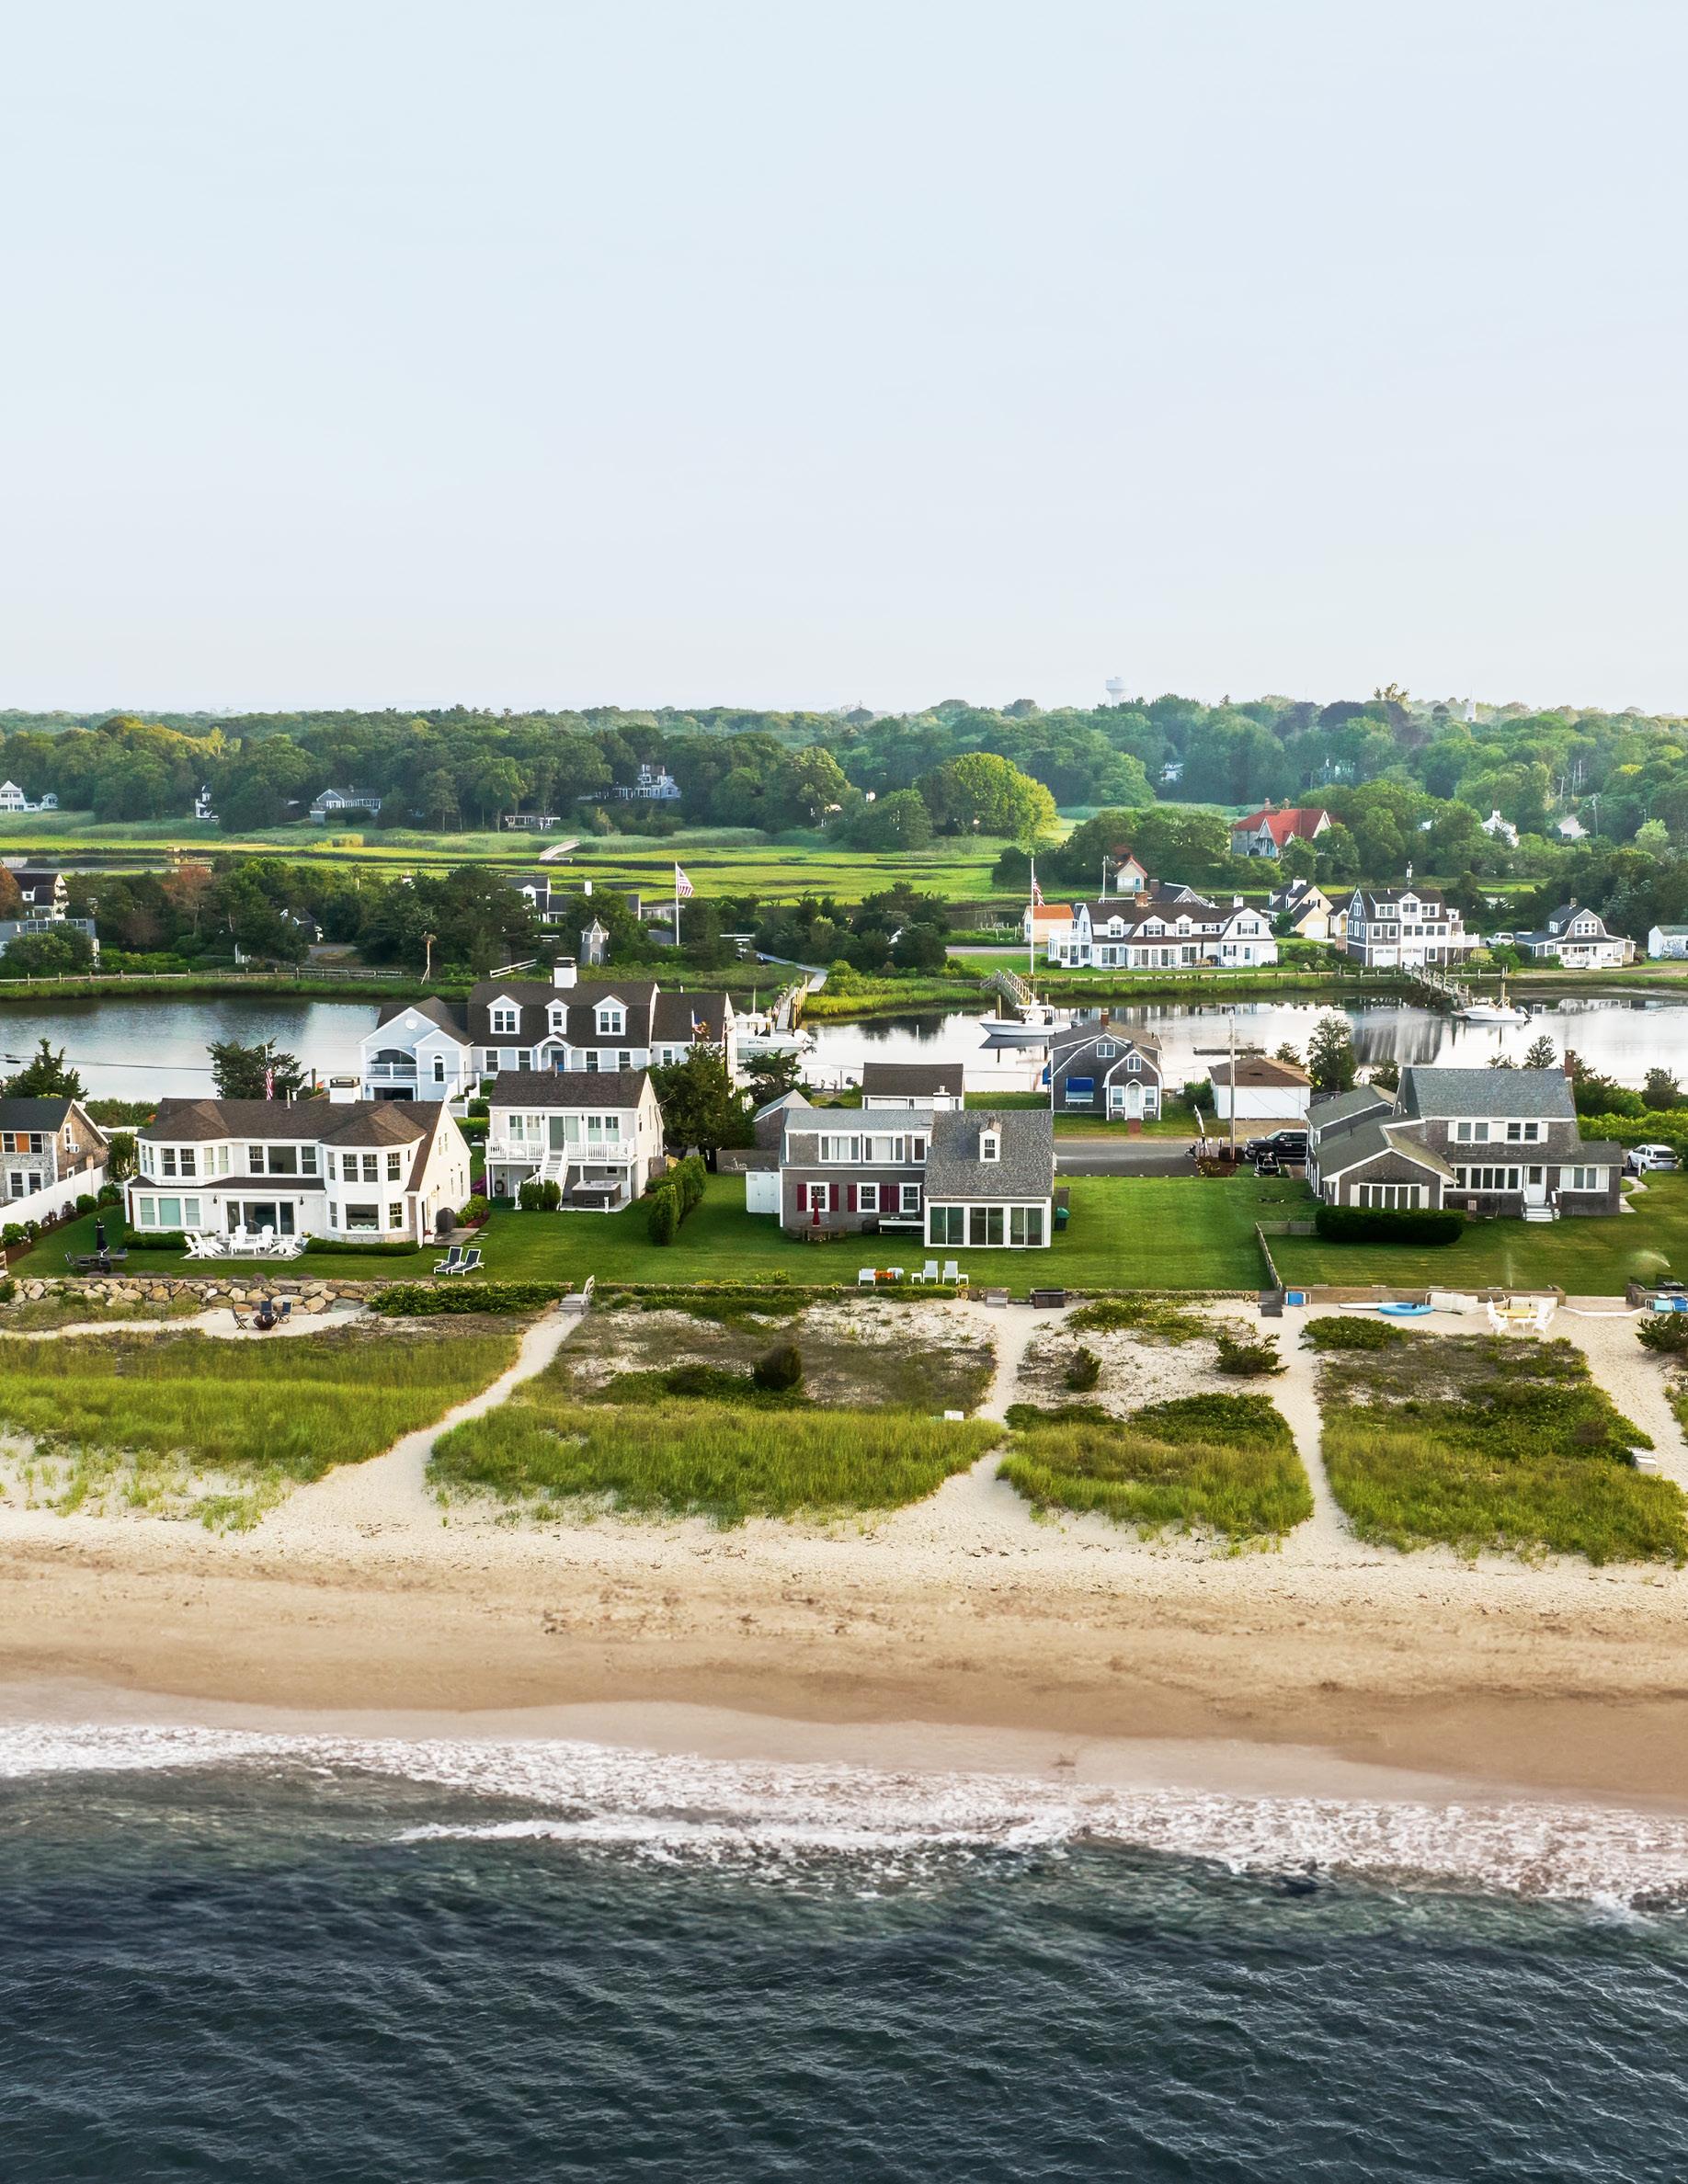
Cape Cod
Luxury Market Summary
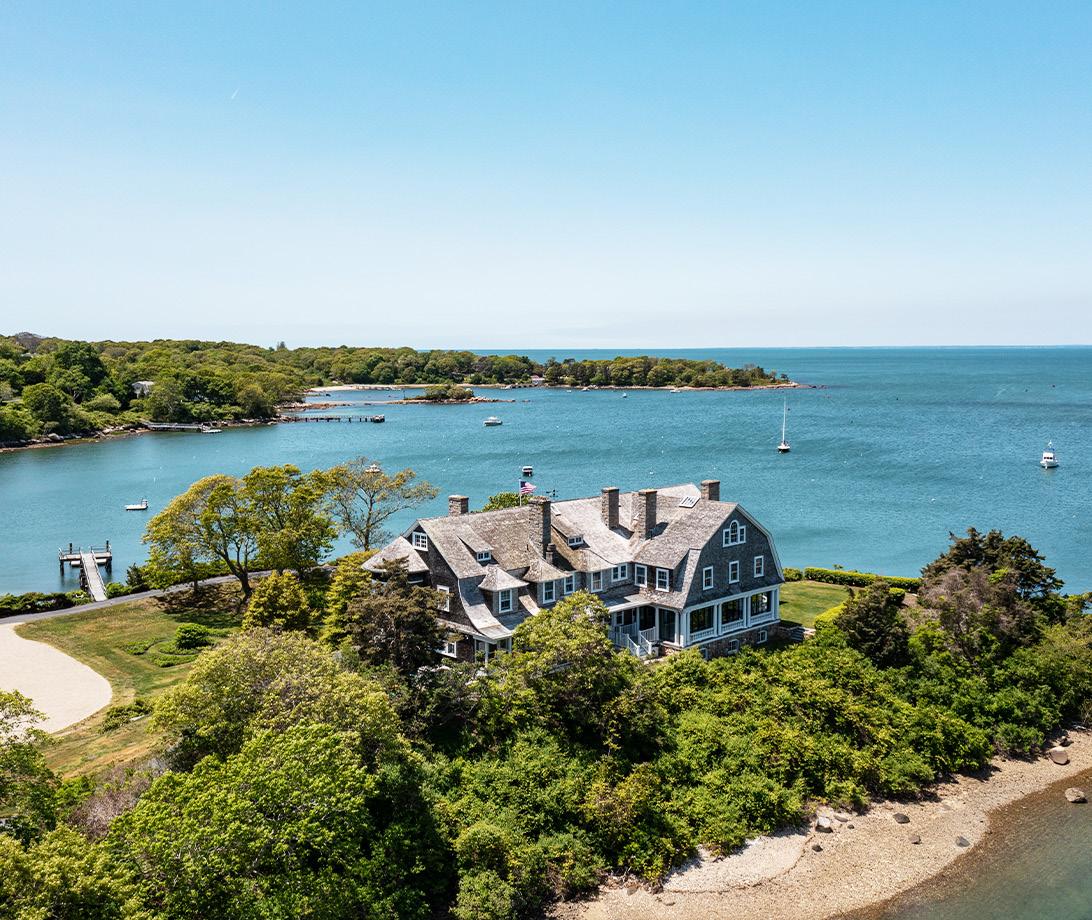
Quissett Avenue
Woods Hole, Massachusetts
RESIDENTIAL, $2M+
All data from the Cape Cod and Islands Association of REALTORS ®
Sold Q2 2023 % Δ (QTR) Q1 2023 % Δ (YR) Q2 2022 $2,000,000 - $2,999,999 29 CARET-UP 45% 20 CARET-DOWN 23.7% 38 $3,000,000 - $3,999,999 6 CARET-UP 50% 4 CARET-DOWN 66.7% 18 $4,000,000 - $4,999,999 1 CARET-DOWN 75% 4 CARET-DOWN 50% 2 $5,000,000+ 8 CARET-UP 33.3% 6 CARET-DOWN 20% 10 Total 44 CARET-UP 29.4% 34 CARET-DOWN 35.3% 68 Pending Q2 2023 % Δ (QTR) Q1 2023 % Δ (YR) Q2 2022 $2,000,000 - $2,999,999 51 CARET-UP 142.9% 21 CARET-UP 82.1% 28 $3,000,000 - $3,999,999 7 CARET-UP 16.7% 6 CARET-DOWN 58.8% 17 $4,000,000 - $4,999,999 9 CARET-UP 200% 3 CARET-UP 200% 3 $5,000,000+ 9 CARET-UP 12.5% 8 0% 9 Total 76 CARET-UP 100% 38 CARET-UP 33.3% 57 Active Q2 2023 % Δ (QTR) Q1 2023 % Δ (YR) Q2 2022 $2,000,000 - $2,999,999 68 CARET-UP 17.2% 58 CARET-UP 36% 50 $3,000,000 - $3,999,999 30 CARET-UP 42.9% 21 CARET-UP 25% 24 $4,000,000 - $4,999,999 19 CARET-UP 90% 10 CARET-UP 90% 10 $5,000,000+ 38 CARET-UP 11.8% 34 CARET-UP 35.7% 28 Total 155 CARET-UP 26% 123 CARET-UP 38.4% 112
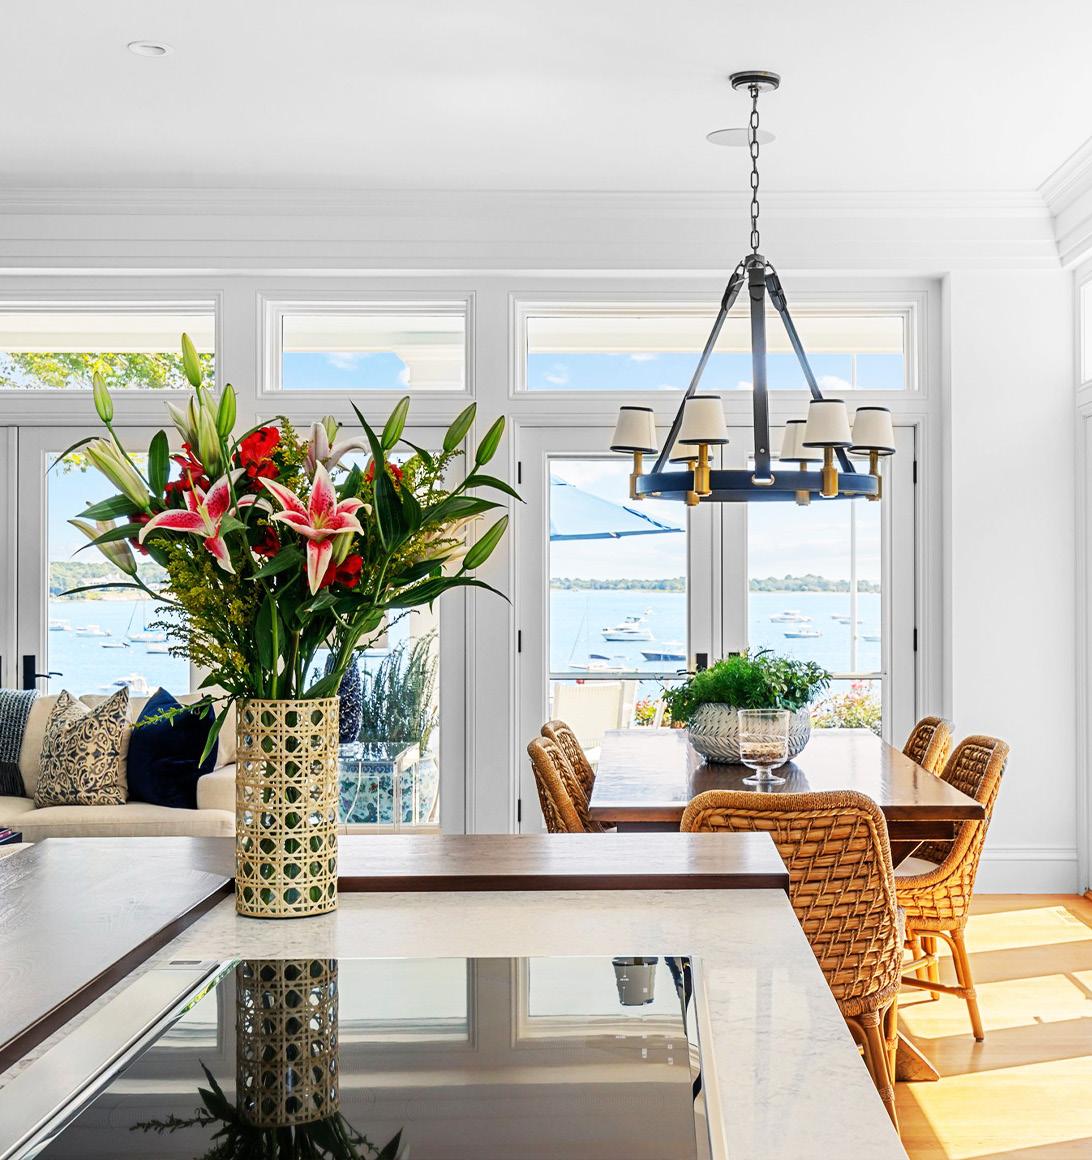
Cotuit, Massachusetts Main Street
Cape Cod
0.1%
16.8%
All data from the Cape Cod and Islands Association of REALTORS ®
Cape Cod Q2 2023 % Δ (QTR) Q1 2023 % Δ (YR) Q2 2022 New Listings 952 CARET-UP 54.3% 617 CARET-DOWN 26.2% 1290 Active Listings 447 CARET-UP 35% 331 CARET-DOWN 18.6% 549 Pending Sales 822 CARET-UP 34.1% 613 CARET-DOWN 14.6% 963 Closed Sales 739 CARET-UP 37.1% 539 CARET-DOWN 16.8% 888 Average DOM 36 CARET-DOWN 32.6% 53 CARET-UP 33.3% 27 Median Sales Price $726,000 CARET-UP 7.6% $675,000 CARET-UP 0.1% $725,000 SINGLE FAMILY HOMES Highest Sale $10.9M Closed Sales YOY CARET-DOWN
Median Sales Price YOY CARET-UP
KEY TAKEAWAYS
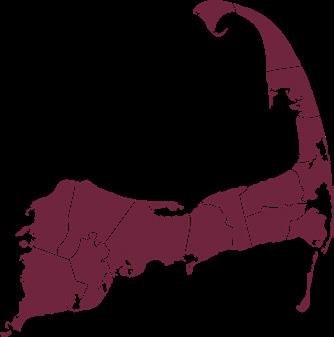
Upper Cape | Mid Cape | Lower Cape | Outer Cape
Sandwich | Bourne | Mashpee | Falmouth
Upper Cape
KEY TAKEAWAYS
All data from the Cape Cod and Islands Association of REALTORS ®
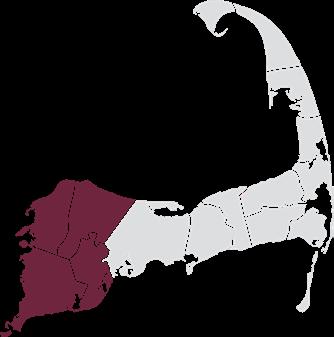
Upper Cape Q2 2023 % Δ (QTR) Q1 2023 % Δ (YR) Q2 2022 New Listings 296 CARET-UP 31% 226 CARET-DOWN 34.5% 452 Active Listings 129 CARET-UP 1.6% 127 CARET-DOWN 38.3% 209 Pending Sales 276 CARET-UP 23.2% 224 CARET-DOWN 16.4% 330 Closed Sales 273 CARET-UP 42.2% 192 CARET-DOWN 12.5% 312 Average DOM 37 CARET-DOWN 36.2% 58 CARET-UP 70.2% 22 Median Sales Price $700,000 CARET-UP 0.1% $699,500 CARET-DOWN 0.7% $705,000 SINGLE FAMILY HOMES Highest Sale $6M Closed Sales YOY CARET-DOWN 12.5% Median Sales Price YOY CARET-DOWN 0.07%
Barnstable | Dennis | Yarmouth
Mid Cape
3.1%
All data from the Cape Cod and Islands Association of REALTORS ®
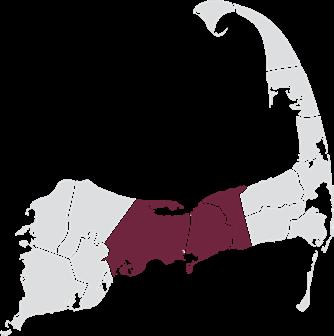
Mid Cape Q2 2023 % Δ (QTR) Q1 2023 % Δ (YR) Q2 2022 New Listings 368 CARET-UP 60.7% 229 CARET-DOWN 29.4% 521 Active Listings 153 CARET-UP 47.1% 104 CARET-DOWN 22.3% 197 Pending Sales 308 CARET-UP 33.3% 231 CARET-DOWN 23.6% 403 Closed Sales 266 CARET-UP 30.4% 204 CARET-DOWN 30% 380 Average DOM 27 CARET-DOWN 49.1% 53 CARET-UP 8% 25 Median Sales Price $649,500 CARET-UP 13.9% $570,000 CARET-UP 3.1% $630,000 SINGLE FAMILY HOMES Highest Sale $10.9M Closed Sales YOY CARET-DOWN
Median Sales Price YOY CARET-UP
KEY TAKEAWAYS
30%
5.4%
1.4%
All data from the Cape Cod and Islands Association of REALTORS ®
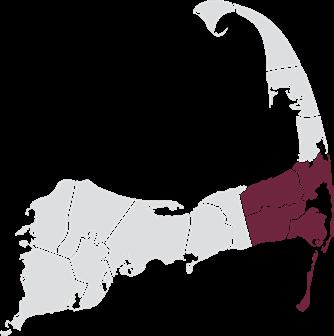
Lower Cape Q2 2023 % Δ (QTR) Q1 2023 % Δ (YR) Q2 2022 New Listings 198 CARET-UP 73.7% 114 CARET-DOWN 13.2% 228 Active Listings 105 CARET-UP 29.6% 81 CARET-UP 7.1% 98 Pending Sales 161 CARET-UP 35.3% 119 CARET-DOWN 5.8% 171 Closed Sales 147 CARET-UP 50% 98 CARET-UP 1.4% 145 Average DOM 47 CARET-UP 4.4% 45 CARET-UP 17.5% 40 Median Sales Price $875,000 CARET-UP 16.7% $750,000 CARET-DOWN 5.4% $925,000 SINGLE FAMILY HOMES Highest Sale $9.2M Closed Sales YOY CARET-UP
Median Sales Price YOY CARET-DOWN
KEY TAKEAWAYS
| Orleans |
|
Lower Cape Chatham
Brewster
Harwich
1.2%
3.9%
All data from the Cape Cod and Islands Association of REALTORS ®
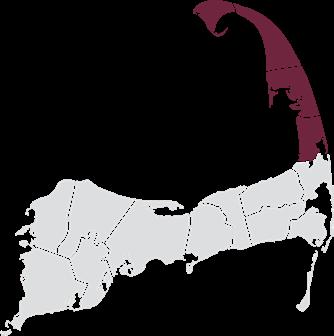
Outer Cape Q2 2023 % Δ (QTR) Q1 2023 % Δ (YR) Q2 2022 New Listings 90 CARET-UP 87.5% 48 CARET-UP 1.1% 89 Active Listings 60 CARET-UP 25% 48 CARET-UP 33.3% 45 Pending Sales 77 CARET-UP 97.4% 39 CARET-UP 30.5% 59 Closed Sales 53 CARET-UP 17.8% 45 CARET-UP 3.9% 51 Average DOM 54 CARET-UP 10.2% 49 CARET-UP 42.1% 38 Median Sales Price $930,000 CARET-UP 21.3% $766,750 CARET-DOWN 1.2% $941,000 SINGLE FAMILY HOMES Highest Sale $2.92M Closed Sales YOY CARET-UP
Median Sales Price YOY CARET-DOWN
KEY TAKEAWAYS
Cape Provincetown | Truro | Wellfleet | Eastham
Outer

© 2023 BHH Affiliates, LLC. An independently owned and operated franchisee of BHH Affiliates, LLC. Berkshire Hathaway HomeServices and the Berkshire Hathaway HomeServices symbol are registered service marks of Columbia Insurance Company, a Berkshire Hathaway affiliate. Equal Housing Opportunity. The information contained herein is deemed accurate but not guaranteed. (508) 364-3500 pgrover@robertpaul.com 867 Main Street Osterville, MA 02655 140 Newbury Street Boston, MA 02116 An Elevated Real Estate Experience
