Market Report
 PRESENTED BY PAUL E. GROVER
Q3 2022
Welcome to the 2022 Third Quarter Cape Cod Market Report
Looking back on the third quarter of 2022, we can safely conclude that the real estate market is normalizing. Across Cape Cod, inventory is up and median sales prices are starting to cool as we return to a more balanced market in the wake of an unprecedented two-year buying frenzy.
While some buyers are adopting a “wait-and-see” approach, those who remain active are finding less competition, more options, and, in some cases, even price reductions. As you will see in the following pages, this translated to a decline in total market sales year-over-year on Cape Cod, however, the luxury sector recorded an encouraging quarter with transactions at $2 million and above nearly even to Q3 last year.
The good news for sellers is that the sky is not falling. Indeed, the bidding wars and over-asking offers of the postpandemic boom are likely behind us, yet properties that are priced appropriately continue to sell. Further, to put the current market into perspective it is
worth pointing out that median sale prices are still up compared to this time last year.

As the market continues to shift, working with an experienced agent is the key to making informed decisions. Pricing, presentation, and an in-depth understanding of the data are just a few of the ways that we give our clients a competitive edge. To learn more about the current market or inquire about our comprehensive services, please do not hesitate to contact me directly.
Paul E. Grover, Principal Broker2021 SALES VOLUME $175M +

$1.5B + CAREER SALES VOLUME2021 AVERAGE SALE PRICE $4.06M PAUL E. GROVER PRINICIPAL BROKER
Luxury Market Summary
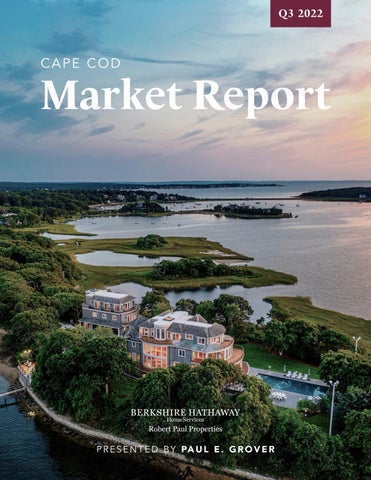
Cataumet, Massachusetts 178 - 180 Scraggy Neck Road
Cape Cod
RESIDENTIAL, $2M+
Pending
$2,999,999
- $3,999,999
$4,999,999
- $2,999,999
- $3,999,999
- $4,999,999
$2,999,999
$3,999,999
All data from the Cape Cod and Islands Association of REALTORS ® Sold Q3 2022 % Δ (QTR) Q2 2022 % Δ (YR) Q3 2021 $2,000,000 -
36 CARET-DOWN 2.7% 37 CARET-UP 9.1% 33 $3,000,000 -
13 CARET-DOWN 27.8% 18 CARET-DOWN 19% 16 $4,000,000 - $4,999,999 5 CARET-UP 150% 2 CARET-UP 67% 3 $5,000,000+ 7 CARET-DOWN 30% 10 CARET-DOWN 30% 10 Total 61 CARET-DOWN 9% 67 CARET-DOWN 1.6% 62
Q3 2022 % Δ (QTR) Q2 2022 % Δ (YR) Q3 2021 $2,000,000
43 CARET-UP 43.3% 30 CARET-UP 7.5% 40 $3,000,000
13 CARET-DOWN 23.5% 17 CARET-DOWN 18.8% 16 $4,000,000
7 CARET-UP 75% 4 CARET-UP 40% 5 $5,000,000+ 9 CARET-DOWN 10% 10 CARET-DOWN 40% 15 Total 72 CARET-UP 18% 61 CARET-DOWN 5.3% 76 Active Q3 2022 % Δ (QTR) Q2 2022 % Δ (YR) Q3 2021 $2,000,000 -
50 CARET-UP 8.7% 46 CARET-DOWN 20.6% 63 $3,000,000
31 CARET-UP 14.8% 27 CARET-UP 47.6% 21 $4,000,000 -
7 CARET-DOWN 42% 12 CARET-DOWN 13% 8 $5,000,000+ 36 CARET-UP 24.1% 29 CARET-UP 33.3% 27 Total 124 CARET-UP 8.8% 114 CARET-UP 4.2% 119
Triton Way
Seabury, Massachusetts
New
78

All data from the Cape Cod and Islands Association of REALTORS ® Cape Cod Q3 2022 % Δ (QTR) Q2 2022 % Δ (YR) Q3 2021 New Listings 1091 CARET-DOWN 15% 1284 CARET-DOWN 19.6% 1357 Active Listings 606 CARET-UP 20.2% 504 CARET-UP 10.2% 550 Pending Sales 928 CARET-DOWN 7.8% 1006 CARET-DOWN 18.4% 1137 Closed Sales 923 CARET-UP 6.5% 867 CARET-DOWN 20.8% 1165 Average DOM 24 CARET-DOWN 11.1% 27 CARET-DOWN 4% 25 Mediam Sales Price $685,000 CARET-DOWN 5.5% $725,000 CARET-UP 12.3% $610,000 SINGLE FAMILY HOMES Highest Sale $18.5M # of Homes Sold Q3 923 Median Sale Price YOY CARET-UP12.3% KEY TAKEAWAYS Cape Cod Upper Cape | Mid Cape | Lower Cape | Outer Cape
TAKEAWAYS
FAMILY HOMES
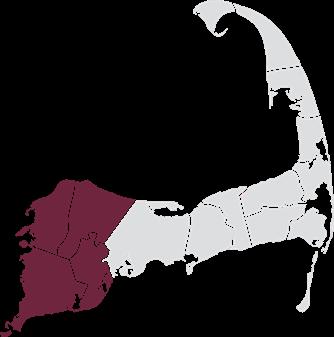
Upper Cape Upper Cape Q3 2022 % Δ (QTR) Q2 2022 % Δ (YR) Q3 2021 New Listings 379 CARET-DOWN 1.3% 384 CARET-DOWN 14.6% 444 Active Listings 230 CARET-UP 21.1% 190 CARET-UP 16.2% 198 Pending Sales 313 CARET-UP 4.3% 300 CARET-DOWN 12.3% 357 Closed Sales 304 CARET-UP 13.9% 267 CARET-DOWN 19.6% 378 Average DOM 27 CARET-UP 50% 18 CARET-DOWN 2.1% 28 Mediam Sales Price $695,000 CARET-DOWN 1.4% $705,000 CARET-UP 8.7% $639,500 SINGLE
CARET-UP 8.7% Median Sale Price YOY Avg. DOM QOQ Highest Sale CARET-UP 50% $5.3M Sandwich | Bourne | Mashpee | Falmouth KEY
All data from the Cape Cod and Islands Association of REALTORS ®
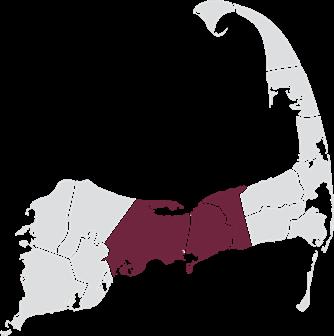
All data from the Cape Cod and Islands Association of REALTORS ® Mid Cape Q3 2022 % Δ (QTR) Q2 2022 % Δ (YR) Q3 2021 New Listings 419 CARET-UP 6.6% 393 CARET-DOWN 22.4% 540 Active Listings 204 CARET-UP 11.5% 183 0% 204 Pending Sales 370 CARET-UP 8.5% 341 CARET-DOWN 18.7% 455 Closed Sales 376 CARET-UP 23.3% 305 CARET-DOWN 20.7% 474 Average DOM 22 CARET-DOWN 29% 31 0% 22 Mediam Sales Price $600,000 CARET-DOWN 4.8% $630,000 CARET-UP 19.9% $500,500 SINGLE FAMILY HOMES Highest Sale $18.5M Closed Sales YOY CARET-DOWN 20.7% Median Sale Price YOY CARET-UP19.9% KEY TAKEAWAYS Mid Cape Barnstable | Dennis | Yarmouth
Sales Price
Sale
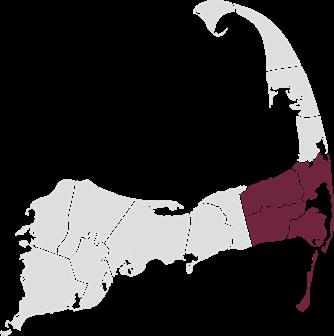
All data from the Cape Cod and Islands Association of REALTORS ® Lower Cape Q3 2022 % Δ (QTR) Q2 2022 % Δ (YR) Q3 2021 New Listings 189 CARET-DOWN 12.9% 217 CARET-DOWN 27.6% 261 Active Listings 106 CARET-UP 24.7% 85 CARET-DOWN 3.6% 110 Pending Sales 168 CARET-DOWN 3.4% 174 CARET-DOWN 25.7% 226 Closed Sales 173 CARET-UP 22.7% 141 CARET-DOWN 24.8% 230 Average DOM 20 CARET-DOWN 52.4% 42 CARET-DOWN 23.1% 26 Mediam Sales Price $875,000 CARET-DOWN 5.4% $925,000 CARET-UP 17.1% $747,500 SINGLE FAMILY HOMES Highest
$8.23M Median
$875K Active Listings QOQ CARET-UP 24.7% KEY TAKEAWAYS Lower Cape Chatham | Orleans | Brewster | Harwich
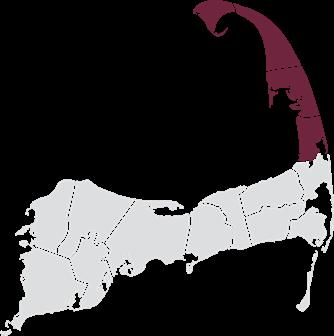
All data from the Cape Cod and Islands Association of REALTORS ® Outer Cape Q3 2022 % Δ (QTR) Q2 2022 % Δ (YR) Q3 2021 New Listings 104 CARET-UP 15.6% 90 CARET-DOWN 7.1% 112 Active Listings 66 CARET-UP 43.5% 46 CARET-UP 73.7% 38 Pending Sales 77 CARET-UP 28.3% 60 CARET-DOWN 22.2% 99 Closed Sales 70 CARET-UP 40% 50 CARET-DOWN 15.7% 83 Average DOM 30 0% 30 CARET-UP 20% 25 Mediam Sales Price $800,000 CARET-DOWN 15% $941,000 CARET-DOWN 4.2% $835,000 SINGLE FAMILY HOMES Highest Sale $4.79M Active Listings YOY CARET-UP 73.7% Median Sales Price QOQ CARET-DOWN15% KEY TAKEAWAYS Outer Cape Provincetown | Truro | Wellfleet | Eastham

© 2022 BHH Affiliates, LLC. An independently owned and operated franchisee of BHH Affiliates, LLC. Berkshire Hathaway HomeServices and the Berkshire Hathaway HomeServices symbol are registered service marks of Columbia Insurance Company, a Berkshire Hathaway affiliate. Equal Housing Opportunity. The information contained herein is deemed accurate but not guaranteed. (508) 364-3500 pgrover@robertpaul.com 867 Main Street Osterville, MA 02655 140 Newbury Street Boston, MA 02116 An Elevated Real Estate Experience