
10 minute read
It's all algorithms


Roman Bershader, Independent Compressor Consultant, USA, details the best practices for compressor surge and choke protection in the LNG industry.
ver the past four decades, LNG has established itself as the preferred fuel and energy source around the world. As demand for cleaner natural gas, replacing solid and liquid fossil fuels, continues to grow, emission standards will tighten in the long-term, requiring development and innovation in the LNG industry.
Compressors play a central role in the transportation, processing, and liquefaction of natural gas, having a significant impact on the overall performance of LNG plants and production efficiency. Improvements in compressor control and protection, which have remained largely unchanged, can reduce energy consumption, resulting in lower emissions. Dynamic compressors used in the LNG industry have very different characteristics depending on licensed technology and plant capacity. Regardless of size and design, the operation of any dynamic compressor is limited by severe unstable conditions, known as surge, at relatively low flowrates; and at relatively high flowrates known as choke or stonewall.
Both conditions must be considered when designing the control system so that they can be prevented. Due to the severity of surge and the much higher likelihood that compressors will operate at relatively low flowrates, this issue has received more attention. If the choke phenomenon is not as severe as surge, prolonged operation in the choke zone is not only very ineffective but can also damage the compressor. Compressors are usually tested for


unstable conditions, then the test results are combined into compressor maps that graphically describe the performance of a particular compressor under specified inlet test conditions and gas properties. Compressor maps show compressor performance using a set of constant speed performance curves with surge line, and can also display a choke line to indicate a dynamically stable operating envelope. Very often compressor maps provided by manufacturers have a vertical axis as the compressor outlet pressure or compressor pressure ratio, and the horizontal axis as a mass flow or volumetric flow.
Since dynamically unstable compressor operation due to surge or choke is a fluid mechanics phenomenon that can occur at different rotational speeds, inlet pressures, and inlet temperatures, the principle of similarity and dimensional analysis are used, which are common in experimental fluid dynamics. The compressor performance can then be displayed in dimensionless rectangular co-ordinates, selected so that the process parameters at the compressor inlet, such as pressure and temperature, molecular weight of the gas, and rotation speed, are irrelevant. In other words, any particular operating point plotted on the dimensionless compressor map will define the corresponding prototypes regardless of inlet conditions, gas properties, and rotational speed. The first most commonly used dimensionless horizontal co-ordinate on compressor maps that characterises compressor performance is the corrected flowrate. The second dimensionless co-ordinate used as the vertical co-ordinate in compressor maps is the compressor pressure ratio.
Compressor performance
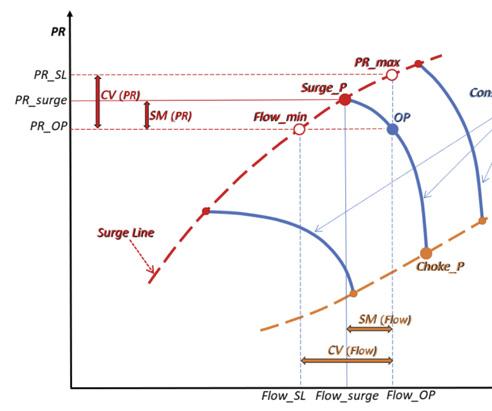
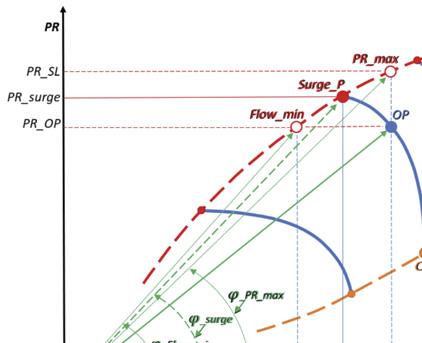
Figure 1. The first and second concepts of protection.
Figure 2. The third concept of protection. Compressor performance curves at constant speeds plotted on compressor maps can vary considerably in shape and slope. Figure 1 shows a hypothetical compressor map that includes constant speed performance curves, surge, and choke limit lines, where the horizontal axis represents the corrected flow and the vertical axis represents the pressure ratio.
Proportional-integral-derivative with feedback (PID) controllers are the most practical and are commonly used to regulate an anti-surge valve to protect the compressor from crossing the surge line, or a discharge throttle valve to protect the compressor from crossing the choke line. The antisurge and anti-choke PID controllers continuously calculate the ER value as the difference between the desired setpoint SP (%) and the variable input CV (%) to correct the control output. For this reason, the surge line must be stored in the compressor control system as a table function of pressure ratio and corrected minimum flow, and the choke line as a table function of pressure ratio and corrected maximum flow, which define the compressor operating limits. The actual operating point OP must then be calculated based on inputs from the flow and pressure sensors in order to calculate the controlled variable. A concept called surge margin is used as a parameter that defines the physical meaning of the actual distance between the operating point and surge point that belong to the same performance curve. But in a rectangular co-ordinate system, the surge margin can only be represented as a projection onto one or another axis. The most used definition of the surge margin SM (Flow) in industrial applications is the distance between the projections of the Surge_P surge point and the OP operating point on the horizontal axis shown in Figure 1. The Surge_P projection is present on the compressor map but cannot be measured and is therefore unknown to the PID controller. Instead, the projection of the surge point Flow_min is available as the intersection of the horizontal line drawn from the operating
point to the surge line, which is stored in the control system as a function of the pressure ratio.
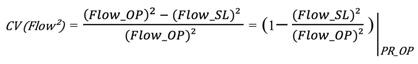
In the case of differential pressure flowmeters, which is widely used in the LNG industry, the horizontal axis on the compressor map is replaced by the square of the corrected flow (Corrected Flow2), so the controlled variable CV (Flow2) for the anti-surge PID controller at a given pressure ratio PR_OP is calculated according to the formula:
Protection from surge
Now a fundamental question arises, how to choose a safety threshold to protect the compressor from surge. The most recommended safety threshold is 10% or more, measured from the surge line to the operating point at a given pressure ratio PR_OP, as shown in Figure 1, where the horizontal co-ordinate is the corrected flowrate. Figure 1 shows that the surge margin SM (Flow) and the controlled variable CV (Flow) are not equal. If the safety threshold is required to correspond to the actual surge margin, then the setpoint for the controlled variable should be set higher. How much higher depends largely on the shape and slope of the performance curves and the slope of the surge line. The safety threshold or setpoint SP (%) after it has been set in the controller remains fixed. Consequently, the fixed setpoint in this method does not provide equivalent surge protection, which can vary significantly from one constant speed performance curve to another, being overprotective in one case and insufficient in another. The next question is whether the 10% safety threshold, defined as the distance between the minimum stable flow point on the surge line and the operating point, should be considered a true 10% safety margin if it does not represent the full operating range covering the distance from surge point to choke point.
Another approach to the concept of surge margin SM (PR), which is typical for compressors with almost vertical performance curves, can be defined as the distance between projections of the surge point Surge_P and the operating point OP on the vertical axis for a given corrected flowrate Flow_OP of the operating point, as shown in Figure 1. But the PR_max point as the intersection of the vertical line drawn up from the operating point to the surge line is available instead of the Surge_P surge point. Therefore, the controlled variable CV (PR) in percentage can be calculated for the anti-surge PID controller using the formula:
As in the previous algorithm, the surge margin SM (PR) and the controlled variable CV (PR) are not equal, and if the safety threshold is to match to the actual surge margin, then the controlled variable setpoint must be set higher. The fixed setpoint in this method also does not provide the equivalent surge protection for various constant speed performance curves.
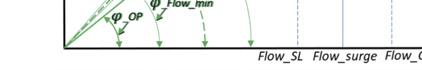
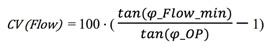
The third approach is considered more advanced and is depicted in Figure 2, expressed in terms of both the corrected flowrate and the pressure ratio, which actually determines the surge margin SM (PR; Flow) as the ratio between the tangent of an angle of the surge point and the tangent of an angle of the operating point:
In fact, the co-ordinates of the PR_max and the Flow_min points on the surge line are available, then there are two options for calculating the controlled variable CV (%) for the anti-surge PID controller: Relative to the PR_max point on the surge line using the equation:
Relative to the Flow_min point on the ...surge line using the equation:
This method, like the two above using rectangular co-ordinates, has the same notable disadvantage in that the actual surge margin cannot be directly measured or accurately estimated.
In addition, none of these methods can simultaneously determine the position of the operating point relative to the surge and choke limit lines in order to reproduce the full operating range due to the geometric constraints imposed on the performance curves by rectangular co-ordinates.
To simultaneously determine the operating point position between the surge
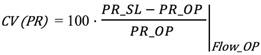
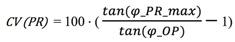
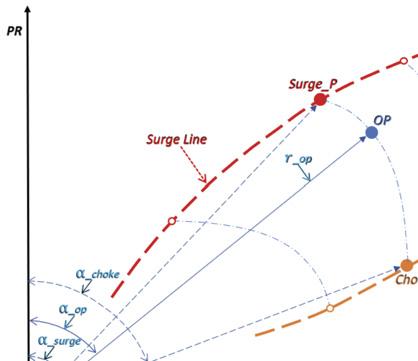
Figure 3. The fourth concept of protection.
and choke limits and at the same time estimate the real surge and choke margins, an unconventional virtual parameter must be created.
In general, compressor operation can be described as moving the operating point towards surge or choke limits along a performance curve, or moving from one curve to another in terms of a variable radius from some imaginary centre point. Such movements are more like movements in polar co-ordinates than in rectangular ones. Hence, polar co-ordinates seem to be the most appropriate choice for illustrating operating point activities.
In this context, the position of the OP operating point in Figure 3 can be described by two polar co-ordinates: the angle α_op and radius r_op. Surge points α_surge forming a surge line and choke points α_choke forming a choke line can be stored in the compressor control system after converting rectangular co-ordinates to polar co-ordinates, and the point polar angle α_op of the operating point can be calculated according to the input signals.
It is important to note that the controlled variable CV and the surge margin SM are the same only in the polar co-ordinate system defined by the polar angle α_op.
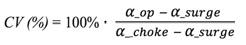
Then the controlled variable CV (%) for the surge protection in a case of the polar co-ordinate system can be defined as the polar angle of the operating point α_op minus the polar angle α_surge of the surge point divided by the entire operating range, measured from the polar angle α_choke of the choke point to the polar angle α_surge of the surge point:
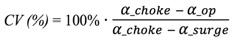
The controlled variable CV (%) for the choke protection in a case of the polar co-ordinate system can be calculated as:
Conclusion
Equality of the controlled variable CV and the surge margin SM makes the polar co-ordinate algorithms the most accurate methods for determining the true operating point position relative to surge and choke limits. In a polar co-ordinate system, unlike rectangular co-ordinate methods, the entire range of the operating points can be displayed in real-time, which is critical for setting the actual safety thresholds for surge and choke protection.
Polar co-ordinate methods provide the same protection for all compressor operating conditions, regardless of the shape and slope of the performance curves, the slope of the surge line or the slope of the choke line, making them the most effective for protecting compressors. The controlled variable CV (%) in the polar co-ordinate algorithms is linear over the entire operating range, making it easy to tune PID controllers using standard tuning methods and incorporating modern control technologies.
ADINDEX
Advertiser Page
ACME Cryogenics 29
Chart 09
Corban Energy Group 05
Dunkerque LNG - Dunkirk LNG Terminal 39
Eilbeck Cranes 53
Emerson OBC
Energy Global 30
European Gas Conference 22
Golden Pass LNG 13 Advertiser Page
Intertek IFC
Indra Srl 35
IRI/The Marshall Islands Registry 43
LNG Industry IBC, 40, 53
NIKKISO 02
RegO 33
SIAD Macchine Impianti 15
Temati 35
Uniper SE OFC, 19