October 2024

Optimize asset performance with crude stability monitoring

October 2024
Optimize asset performance with crude stability monitoring

For nearly a century, Grace catalysts have kept fuel and petrochemical feedstocks flowing from the industry’s largest refineries to the trucks, trains, planes, and ships that keep our world running.
We are leveraging our long history of innovation in fluid catalytic cracking to develop products that enable lower carbon fuels and help meet the challenges of the energy transition.

34 Turning a challenge into an opportunity
10 Middle East: oil market shepherd
Nancy D. Yamaguchi, Contributing Editor, examines the Middle Eastern oil sector, with a focus on its role in stabilising oil markets amongst constantly shifting geopolitics.
18 Optimising asset performance with crude stability modelling
More than ever refiners are looking for opportunity crudes to increase economic profitability and optimise finished product delivery. Wesley Teasdale and Timothy Oubre, Halliburton Multi-Chem, explain how these crudes, along with overall crude diet changes, can have far-reaching impacts on multiple refining processes.
23 The next step in dissolution recycling
Polymer recycling presents both a critical challenge and an opportunity to incorporate sustainability in industrial practices worldwide. To achieve widespread, long-term adoption, the practice must be supported by effective methods. Luis Hoffmann and Emmanuelle Chauveau, Sulzer, explain.
27 Diesel no.2: the biomass-based alternative Jim Aiello, Merichem Technologies, USA, discusses the rise of renewable diesel and the global transition to cleaner fuels.
31 Sustainable fuels are here
The world’s first commercial production plant for ultra-low carbon eFuels began supplying product to customers in 2023. But what will it take to bring these sustainable, hydrogen-based fuels to the mainstream? Liz Myers and Roger Harris, Infinium, USA, explain.


Fabio E.G. Ferrari, Luca E. Basini, Leonardo Falbo and Edoardo Disarò, NEXTCHEM Tech, Italy, explain the opportunity for valuable hydrocarbons to be utilised from the flaring of associated petroleum gas (APG).
41 Going greener
Larry Emch, Integrated Global Services (IGS), USA, presents advanced solutions for reducing emissions and improving process efficiency at refineries.
44 Peak performance
Rhys Jenkins, Servomex, UK, explains how tunable diode laser (TDL) gas analysis technology supports more efficient combustion for cleaner industry.
50 Controlling nucleation corrosion
Osvaldo Heredia and Maria Alma Droppelmann, ENAP, Trevor Place, Enbridge Inc., and Moshood Adewale, Tatiana Barbosa and Luis Orellana Galarce, Veolia Water Technologies & Solutions, explore how nucleation corrosion in liquid hydrocarbon systems can be mitigated and present a case study examining nucleation corrosion in a refinery distillation overhead reflux line.
57 The power of prediction
G. Simon A. Weiland, Optimized Gas Treating, Inc., USA, highlights the advantages of predictive sulfur recover unit (SRU) simulators and how they can help to optimise plant operations.
63 Playing offence
Tim Gale, Cameron Hamari, and Brett Seales, 1898 & Co., USA, explain why adopting an offensive approach is the best strategy to defend against cyber threats in the downstream oil and gas sector.
68 Looking back to see ahead
Bernard Montel, Tenable, France, explores the benefits of adopting a preventative cybersecurity stance in the downstream industry.
Halliburton Multi-Chem provides industrial water and process treatment solutions to refineries and petrochemical plants. Through onsite technical service and engineering support, the company helps customers with business goals, including improving reliability, increasing throughput, and enhancing the efficiency and flexibility of operating units. Halliburton Multi-Chem’s aim is to protect assets and maximise value.


MANAGING EDITOR James Little james.little@palladianpublications.com
SENIOR EDITOR Callum O'Reilly callum.oreilly@palladianpublications.com
ASSISTANT EDITOR Poppy Clements poppy.clements@palladianpublications.com
EDITORIAL ASSISTANT Emilie Grant emilie.grant@palladianpublications.com
SALES DIRECTOR Rod Hardy rod.hardy@palladianpublications.com
SALES MANAGER Chris Atkin chris.atkin@palladianpublications.com
SALES EXECUTIVE Ella Hopwood ella.hopwood@palladianpublications.com
PRODUCTION MANAGER Kyla Waller kyla.waller@palladianpublications.com
HEAD OF EVENTS Louise Cameron louise.cameron@palladianpublications.com
DIGITAL EVENTS COORDINATOR Merili Jurivete merili.jurivete@palladianpublications.com
DIGITAL CONTENT ASSISTANT Kristian Ilasko kristian.ilasko@palladianpublications.com
DIGITAL ADMINISTRATOR Nicole Harman-Smith nicole.harman-smith@palladianpublications.com
ADMIN MANAGER Laura White laura.white@palladianpublications.com
CONTRIBUTING EDITORS Nancy Yamaguchi Gordon Cope
SUBSCRIPTION RATES
Annual subscription £110 UK including postage /£125 overseas (postage airmail). Two year discounted rate £176 UK including postage/£200 overseas (postage airmail).
SUBSCRIPTION CLAIMS
Claims for non receipt of issues must be made within 3 months of publication of the issue or they will not be honoured without charge.
APPLICABLE ONLY TO USA & CANADA
Hydrocarbon Engineering (ISSN No: 1468-9340, USPS No: 020-998) is published monthly by Palladian Publications Ltd GBR and distributed in the USA by Asendia USA, 701C Ashland Avenue, Folcroft, PA 19032. Periodicals postage paid at Philadelphia, PA & additional mailing offices. POSTMASTER: send address changes to HYDROCARBON ENGINEERING, 701C Ashland Ave, Folcroft PA 19032.
15 South Street, Farnham, Surrey
GU9 7QU, UK
Tel: +44 (0) 1252 718 999

CALLUM O'REILLY SENIOR EDITOR
The energy transition has hit a number of hurdles in recent times. Geopolitical uncertainty, complexities within the supply chain, and higher inflation have combined to make the transition to a cleaner energy future more challenging. In its recent ‘Energy Transition in Oil and Gas’ report, GlobalData notes that heightened energy security fears have increased the focus on fossil fuels and led some companies to scale down their energy transition pursuit. Meanwhile, in its ‘Global Energy Perspective’ report, McKinsey & Co. states that the global energy transition is entering a “new phase”, which is marked by rising costs, complexity and technical challenges: “Growing energy demand and resulting emissions could affect the pace of the energy transition, which will require a rethink of both low-carbon and fossil fuel strategies to meet the goals outlined in the Paris Agreement.”
McKinsey’s analysis demonstrates that the build-out of clean energy technologies has not been fast enough to meet growing energy demand worldwide. And although there are concerns that the pace of the energy transition will slow in the short-term as the world navigates choppy geopolitical waters, it’s very clear that change is both necessary and inevitable. In early September, Hydrocarbon Engineering hosted its inaugural ‘World Energy Transition Conference’ a virtual event dedicated to exploring innovative decarbonisation technology and solutions that are driving the transition to a low-carbon energy future. The conference featured a number of very interesting presentations from leading subject matter experts. In the opening keynote presentation, Jon Hansen, Head of Energy Scenario at Rystad Energy, outlined decarbonisation pathways for the downstream sector. He introduced a “toolbox” of opportunities for the sector to effectively reduce emissions. These include improving energy efficiency (optimising plants, minimising power consumption and implementing an energy sourcing strategy), carbon capture, utilisation and storage (CCUS), switching to alternative fuel sources, adopting clean hydrogen, and integrating renewable energy systems and pursuing electrification strategies.
During the conference, we also gained an insight into Wood Mackenzie’s outlook for oil demand growth, courtesy of Alan Gelder, Vice President of Refining, Chemicals and Oil Markets. Alan spoke of the value of petrochemical integration and explained why now is the time for refiners to plan to adapt in order to thrive during the energy transition.
If you missed Alan’s presentation, you can read more about his thoughts in a brand-new supplement to Hydrocarbon Engineering that we are launching next month. EnviroTech 2024 will include a range of interesting technical articles and case studies exploring innovative technology and solutions that will help your business thrive within the energy transition. In addition to Wood Mackenzie’s keynote piece, EnviroTech 2024 will include articles from leading experts on a range of topics including emissions reduction, energy efficiency, CCUS, SAF, electrification, blue hydrogen, renewable energy integration, and much more. If you would like to be a part of EnvrioTech 2024 or a future edition of this new supplement, please reach out to us via the contact information on the left of this page. And to ensure you don’t miss out on a free copy of this supplement sent directly to your inbox, scan this QR code and follow the simple on-screen instructions.

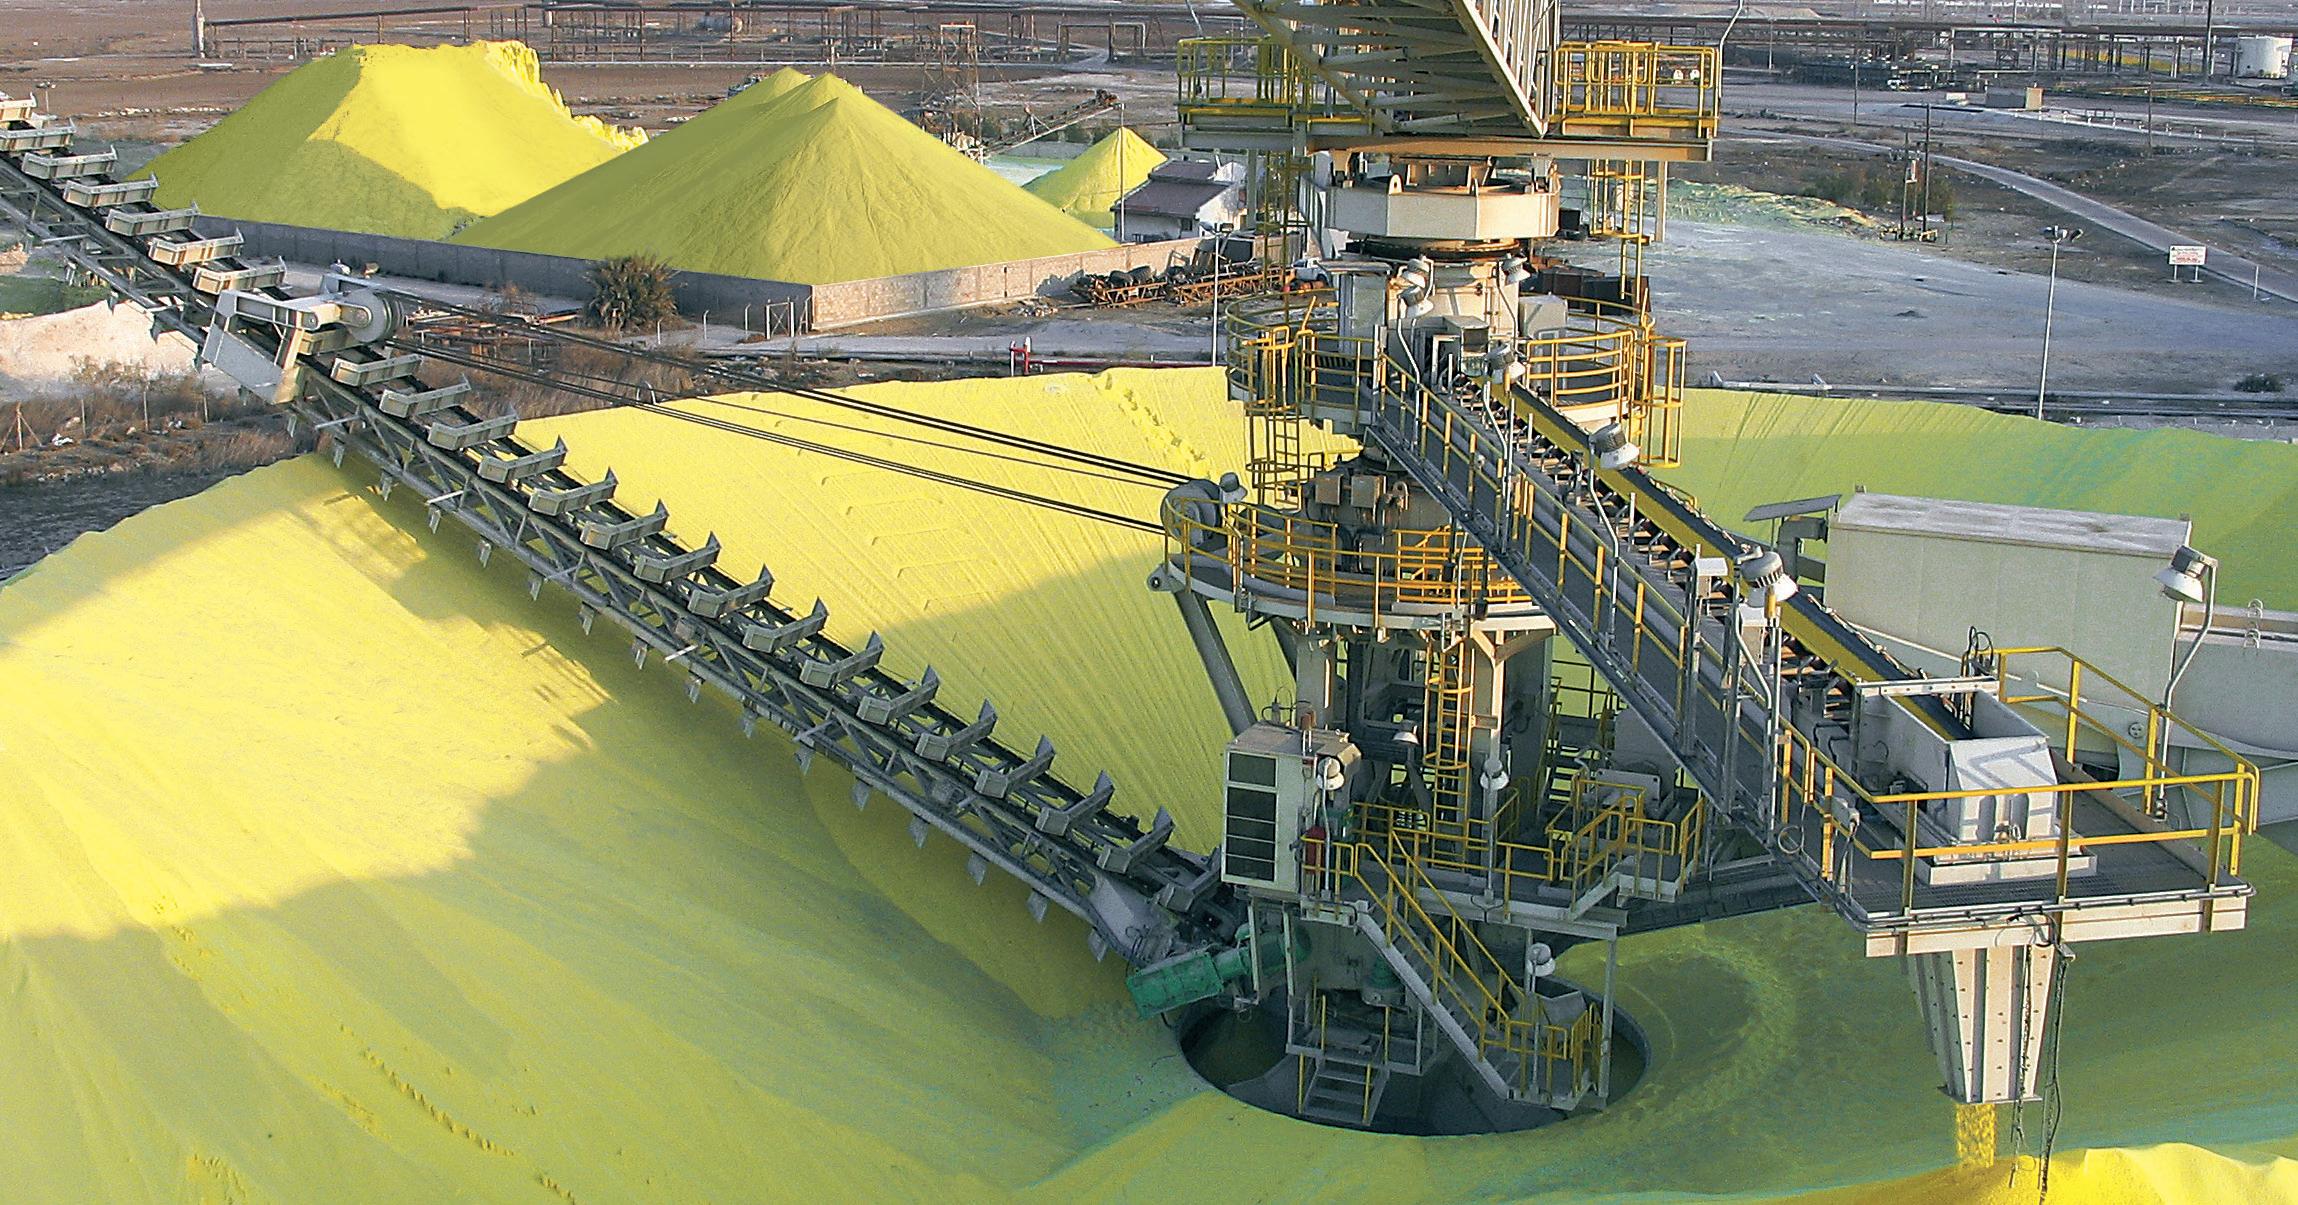
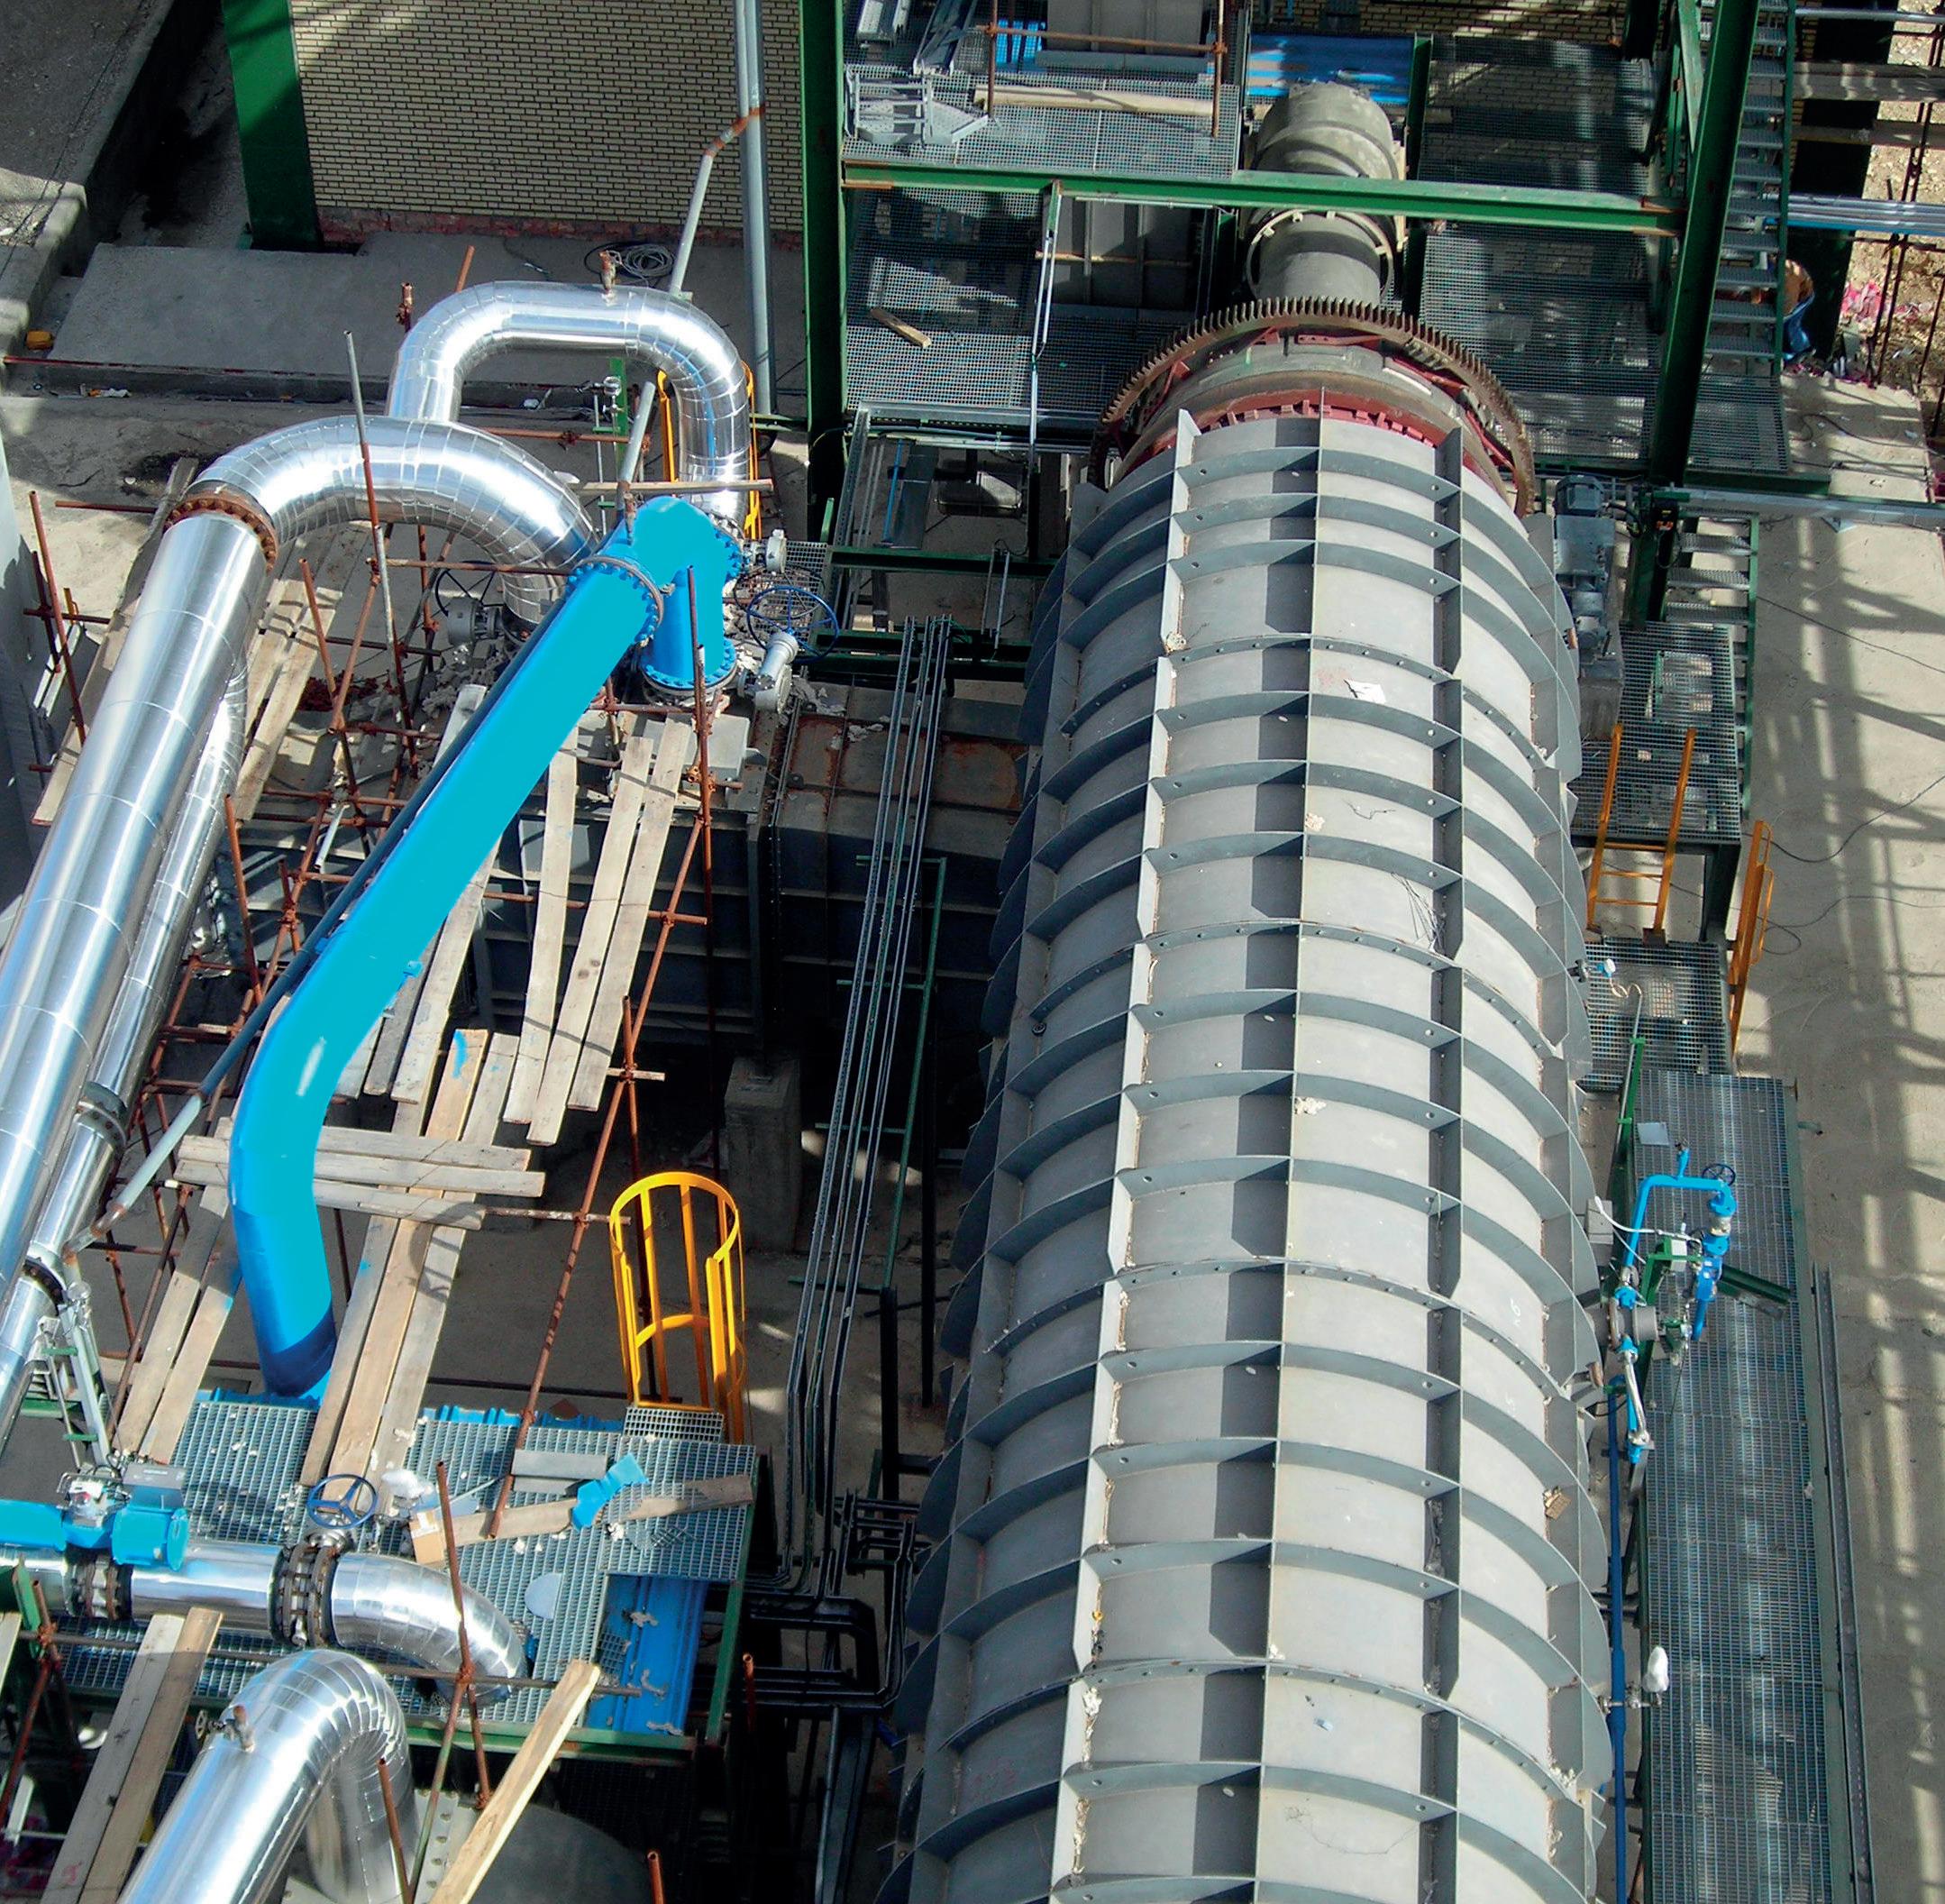
We are a world leading manufacturer of sulphur processing equipment as well as solutions for downstream silo/stockpile storage and reclamation, and bulk loading systems for truck, rail and ships.
ROTOFORM PASTILLATION
With 700+ systems in use by the sulphur industry, Rotoform is the world’s most widely used process for small to mid-capacity production of premium quality pastilles and offers unrivalled product uniformity and environmentally friendly operation.
SG DRUM GRANULATION
Where higher capacity is required, our SG rotating drum system is a fully automated, ‘once through’, sulphur granulation process based on a size enlargement process by continued coating of seed material.

KEY FEATURES
Solidification capacity up to 280 mtpd.
Duplex steel belts alloyed for maximum lifetime.
Pastilles according to SUDIC premium quality spec.
KEY FEATURES
Capacity up to 2,000 mtpd.
Single pass, no need for screens.
Process simulation to suit all conditions.
Simple operation, precise control.

Worley will support Shell with the transformation programme at its Energy and Chemicals Park Rheinland, converting the site into a base oil production unit, and enabling the production of renewable hydrogen at the facility.
Worley is supporting Shell on a project that will convert a hydrocracker
into a production unit for base oils at the Wesseling site in the facility, near Cologne, Germany. The Wesseling site plans to stop processing crude oils in 2025. The new base oil plant will have a production capacity of around 300 000 tpy. This is equivalent to around 9% of the EU and 40% of Germany’s demand for base oils.
BASF has announced that it has inaugurated a new world-scale production plant for alkyl ethanolamines at its Verbund site in Antwerp, Belgium.
This new investment will increase the company’s global annual production capacity for alkyl ethanolamines, including dimethyl ethanolamine (DMEOA) and methyl diethanolamine (MDEOA), by nearly 30% to over 140 000 tpy.
The new plant is an important part of the BASF production network for this portfolio at the company’s sites in Ludwigshafen, Germany; Antwerp, Belgium; Geismar, Louisiana; and Nanjing, China.
The versatile alkyl ethanolamines are mainly used as precursors for gas treatment chemicals, for flocculants applied in water treatment, and as binders between pigments and resins in the coatings industry.
Wood has been awarded a three-year contract to operate and maintain the Freepoint Eco-Systems plant in Hebron, Ohio, US.
The flagship facility spans 25 acres, utilising a 260 000 ft2 warehouse, making it one of the largest advanced recycling facilities in the world.
This facility will apply advanced pyrolysis recycling technology to convert approximately 90 000 t of end-of-life plastics into a petrochemical feedstock, pyrolysis oil, through a depolymerisation process. The feedstock can then be used in applications such as food-grade and medical-grade plastic packaging.
Wood will provide full facility operations and maintenance management, employing upwards of 100 people, supporting Freepoint Eco-Systems with operational readiness processes including the development of safety and maintenance management systems.
EET Fuels (trading name of Essar Oil (UK) Ltd), which plans to create the world’s leading low-carbon process refinery, has progressed to the front-end engineering design (FEED) stage of its industrial carbon capture (ICC) project.
The company has appointed Toyo Engineering India Pvt Ltd (Toyo-India) (100% subsidiary of Toyo Engineering Corp., Japan) to carry out the FEED phase – an integral part of the project management process. Toyo-India will oversee design completion, project de-risking, detailed costing analysis and
other vital work. Completion of FEED will enable the company to take Final Investment Decision (FID) on the ICC project.
Upon completion (expected in 2028), the ICC project will capture carbon dioxide emitted from Stanlow refinery’s full-residue fluid catalytic cracking (FCC) unit – one of Europe’s largest units. Leveraging Stanlow’s unique location, the captured CO2 will use a repurposed existing gas transportation network and be permanently sequestered into depleted gas fields in Liverpool Bay, as
part of the HyNet industrial decarbonisation cluster in the North West of England.
The ICC project is expected to capture approximately 1 million tpy of CO2, removing around 45% of all Stanlow’s emissions. The project has applied for the right to negotiate with the UK government for a revenue support mechanism as part of the Department of Energy Security and Net Zero’s Track One expansion programme in the carbon capture, usage and storage (CCUS) cluster sequencing process.

15 - 17 October 2024
AFPM Summit
New Orleans Louisiana, USA summit.afpm.org
15 - 17 October 2024
ESF MENA
Riyadh, Saudi Arabia
www.europetro.com/esfmena
04 - 07 November 2024
ADIPEC
Abu Dhabi, UAE www.adipec.com
11 - 14 November 2024
ERTC Lisbon, Portugal
www.worldrefiningassociation.com/event-events/ertc
20 November 2024
Global Hydrogen Conference
Virtual www.accelevents.com/e/ghc2024
03 - 05 December 2024
Valve World Expo Düsseldorf, Germany www.valveworldexpo.com
10 - 12 December 2024
17th National Aboveground Storage Tank Conference & Trade Show
The Woodlands, Texas, USA www.nistm.org
21 - 22 January 2025
NARTC Houston, Texas, USA
www.worldrefiningassociation.com/event-events/nartc
24 - 27 February 2025
Laurance Reid Gas Conditioning Conference
Norman, Oklahoma, USA pacs.ou.edu/lrgcc
6 - 10 April 2025
AMPP Annual Conference + Expo Nashville, Tennessee, USA ace.ampp.org
20 - 22 May 2025
ESF North America
Houston, Texas, USA www.europetro.com/esfnorthamerica
Air Products has completed the sale of its LNG process technology and equipment business to Honeywell for US$1.81 billion in cash. First announced in July 2024, closing conditions for the transaction have been fully met and regulatory approvals received.
The divestiture of the LNG process technology and equipment business is strategic, reflecting Air Products’ focus on its two-pillar growth strategy to profitably grow
its core industrial gases and related equipment businesses, and to deliver clean hydrogen at scale.
With the sale, related assets, manufacturing capability and personnel associated with the LNG process technology and equipment business have transferred successfully to Honeywell. This is the fourth acquisition Honeywell has closed in 2024 as part of its disciplined capital deployment strategy.
Woodside has signed a sale and purchase agreement (SPA) with JERA for the long-term supply of LNG to Japan.
Under the SPA, Woodside will supply approximately 0.4 million tpy of LNG over 10 years on a delivered basis, commencing in April 2026.
LNG delivered to JERA under the SPA will be sourced from volumes across Woodside’s global portfolio.
The execution follows the announcement in February 2024 whereby Woodside reached an agreement for the sale to JERA of a 15.1% non-operating participating interest in the Scarborough Joint Venture.
Woodside expects the Scarborough equity sale to JERA to be completed before the end of 2024.
EnerMech has become the integrated service contract supplier of choice to KENT Energies Ltd for ExxonMobil’s new low sulfur diesel facility at its Fawley Petrochemical Complex, located in Hampshire, UK. The project comprises the construction of the new low sulfur diesel facility encompassing the development of a new hydrogen plant at the country’s biggest integrated complex. It aims to help reduce the
UK’s reliance on diesel imports and pave the way for the potential production of sustainable aviation fuel (SAF). The project will increase the output by 38 000 bpd.
Chuck Davison, EnerMech CEO, said: “This contract represents a major milestone for the business as it partners us with KENT Energies to support ExxonMobil and one of the UK’s most strategic petrochemical sites.”

Ever-changing market conditions, global economic challenges, and the shared journey of the energy transition all mean it is crucial to evaluate easy-to-implement and costeffective improvement opportunities. At Shell Catalysts & Technologies, our solutions open new possibilities for smarter investments while preserving cash through revamping, reconfiguring, or optimising your existing assets. Our experts co-create tailored solutions while keeping your margins in mind – ensuring the investments you make right now can help you maintain your competitive advantage into the future.
Learn more at catalysts.shell.com/revamps.
Superior process and water treatment solutions supported by service excellence
Superior process and water treatment solutions supported by service excellence
Halliburton Multi-Chem collaborates with customers to improve reliability, increase throughput, and enhance operating unit efficiency and flexibility. We offer a broad range of chemistries, equipment, automation, and services to help our customers maximize asset value.
Halliburton Multi-Chem collaborates with customers to improve reliability, increase throughput, and enhance operating unit efficiency and flexibility. We offer a broad range of chemistries, equipment, automation, and services to help our customers maximize asset value.
Our experienced team provides onsite technical services and engineering support. We listen to understand your challenges and respond with solutions.
Our experienced team provides onsite technical services and engineering support. We listen to understand your challenges and respond with solutions.

Nancy D. Yamaguchi, Contributing Editor, examines the Middle Eastern oil sector, with a focus on its role in stabilising oil markets amongst constantly shifting geopolitics.
The past year has brought sustained geopolitical risk and elevated prices for oil. In retrospect, however, prices have eased considerably since early 2022, when Russia invaded Ukraine and Brent crude spot prices jumped above US$120/bbl. This war is now in its third year. Consumers dread additional price spikes and supply disruptions, but the market has been far calmer than expected, without spikes and crashes. The Israel-Hamas war caused another uptick in prices in late 2023, but prices did not surge above US$100/bbl. In late August 2024, strife in Libya shut in roughly half of the country’s production, but as this issue of Hydrocarbon Engineering goes to press, prices have not risen.
The global oil market is a constantly shifting entity, with so many players that no one can claim to control it. The Middle East, however, is the site of the largest OPEC producers, immense reserves, rapidly growing demand, and a significant downstream industry. This article provides a briefing on the Middle Eastern oil sector, with a focus on its crucial role in stabilising the global market, despite a continuing stream of geopolitical risk factors. OPEC producers and their allies have had notable and enduring success via the Declaration of Cooperation (DoC). This success

appears to be aiding the producers in their quest to be shepherds of the global oil market.
In December 2016, OPEC member countries and 11 non-OPEC oil producing countries met at OPEC Headquarters in Vienna, Austria. They signed the Declaration of Cooperation (DoC). OPEC states that the DoC’s official goal is ‘to contribute to a secure energy supply and lasting stability for the benefit of producers, consumers, investors and the global economy.’1 OPEC’s membership currently consists of Algeria, Angola, Equatorial Guinea, Gabon, Iran, Iraq, Kuwait, Libya, Nigeria, Republic of the Congo, Saudi Arabia, the UAE, and Venezuela. Ecuador, Indonesia and Qatar are former OPEC members. Producer countries meeting with OPEC in 2016 were Azerbaijan, the Kingdom of Bahrain, Brunei Darussalam, Equatorial Guinea (which joined OPEC in 2017), Kazakhstan, Malaysia, Mexico, the Sultanate of Oman, the Russian Federation, the Republic of Sudan, and the Republic of South Sudan. The DoC was launched to be a platform for producers to discuss market issues and cooperate in market stabilisation efforts.
The DoC countries became known as the OPEC+ Group, though the group refers to itself as the DoC. Many market analysts predicted that this group would not be able to hold together for long, much less agree upon meaningful production controls that would stabilise prices. The DoC prizes consensual decision making, and it is a challenge to have such a large, diverse group of 23 countries reach consensus. But time and time again, they have achieved this. The DoC countries set and maintained a programme of production ceilings that began to finally drain some of the global oversupply. Prices began to recover. When countries exceeded their production allowance, this was often called ‘cheating’ in the trade press, but the group stayed together and managed compliance internally.
Saudi Arabia often used its immense production capacity to singlehandedly rebalance the DoC’s output.
Now, in 2024, the DoC group has proven its staying power, and it is a key shepherd in the market, constantly monitoring and forecasting supply and demand. Some countries have requested that OPEC raise production to help ease prices, including India, where demand growth is very strong.
The DoC’s plan is to gently raise production in 4Q24. However, OPEC recently revised downward its forecast of global demand in 2024 from 2.25 million bpd to 2.11 million bpd, so it is possible that the group will maintain disciplined production ceilings.
When futures market or spot prices for crude and products surge, ‘geopolitical risk’ is often cited as the cause. This has become such a huge catchall phrase that a brief discussion is needed. Reviewing recent history identifies geopolitical risk factors including, but not limited to:
n Trade disputes, particularly over strategic commodities (including oil and energy).
n Economic sanctions, which can disrupt trade and cause economic damage.
n Political instability, including civil unrest, can force regime change.
n Borders and disagreements over access to infrastructure and resources (once again including oil and energy).
n Globalisation, a double-edged sword that allows countries to grow together, yet also allows the spread of distress from one region to another.
n Natural disasters, such as earthquakes, storms and floods, which can cut across national boundaries and stymie relief efforts when cross-border relations are unfriendly.
n Geographic features such as canals and choke points.
n Armed conflict and outright war.
This list is not exhaustive. It is also near-universal – can there possibly be any country on Earth that is immune to geopolitical risk? However, it is striking that all these factors have affected the Middle East, since the concept of geopolitical risk tends to focus on the global petroleum market. Indeed, the recent past has been a time of sustained geopolitical risk, to the point that it must be considered the norm rather than the exception. The number and types of geopolitical risk factors seem to keep growing, and events in one area easily spread to others. If these risks are now the norm, they often are ‘baked in’ to market outlooks and investment strategies. Have OPEC and the DoC countries become more adept at balancing the market?
The recent price trends discussed in the section following suggest that this may be true.
Oil prices have spiked and slumped repeatedly since the first oil prices shock of the 1970s, but prices have been surprisingly stable over the past year. Figure 1 tracks monthly spot prices for Brent crude from 2012 through August 2024. In March 2012, prices exceeded US$125/bbl. Saudi Arabia launched its oil price war in 2014, ramping up production to recapture market share and push out higher-cost producers. Prices began to fall, subsiding to the US$50 - 70/bbl range. In early 2016, however, sanctions on Iran were lifted, and prices collapsed as Iranian exports rose. The DoC group launched its production cut agreement to support prices. In 2020, the COVID-19 pandemic caused the greatest price collapse in history, with Brent spot prices bottoming out at US$18.38/bbl in April 2020.
Oil prices began to rise steadily as the world emerged from the pandemic, as did prices for many other commodities. During the slump, investment in many economic sectors had been stifled, not just in the oil sector, and the recovery in demand outpaced recovery in output. Many countries cooperating in the OPEC+/DOC group had production ceilings that exceeded the volumes they were able to produce. Saudi Arabia alone seemed to have spare production capacity.
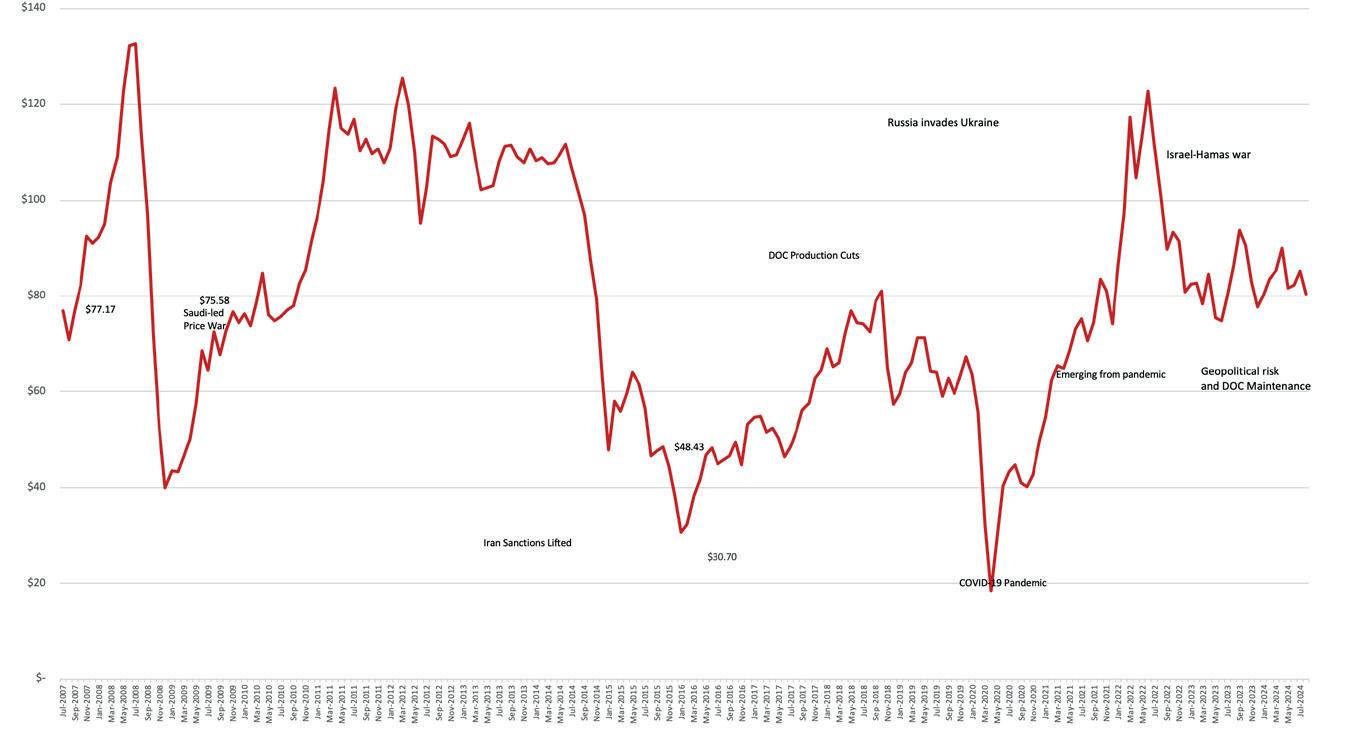
Prices shot up when Russia invaded Ukraine in early 2022, reaching US$122.71/bbl in June 2022. The market gradually adjusted despite the continuation of this war. Prices eased into the US$75 - 85/bbl range.
Poorer-than-expected economic data from China could have moved prices even lower, until the Israel-Hamas war brought prices back into the


The industry leaders in nitrogen rejection, BCCK’s NiTech® technology has enabled operators to profitably recover once bypassed reserves for decades. Whether a single or dual tower design, our proven design has become the industry standard for both higher and lower N 2 inlet gas streams. BCCK’s latest NiTech enhancement is designed to achieve methane contents in the vent as low as 10 ppmv, resulting in minimal methane losses to the environment. Stay Ahead of the Curve with BCCK’s most sustainable technology yet.
www.bcck.com • 1-800-922-2599
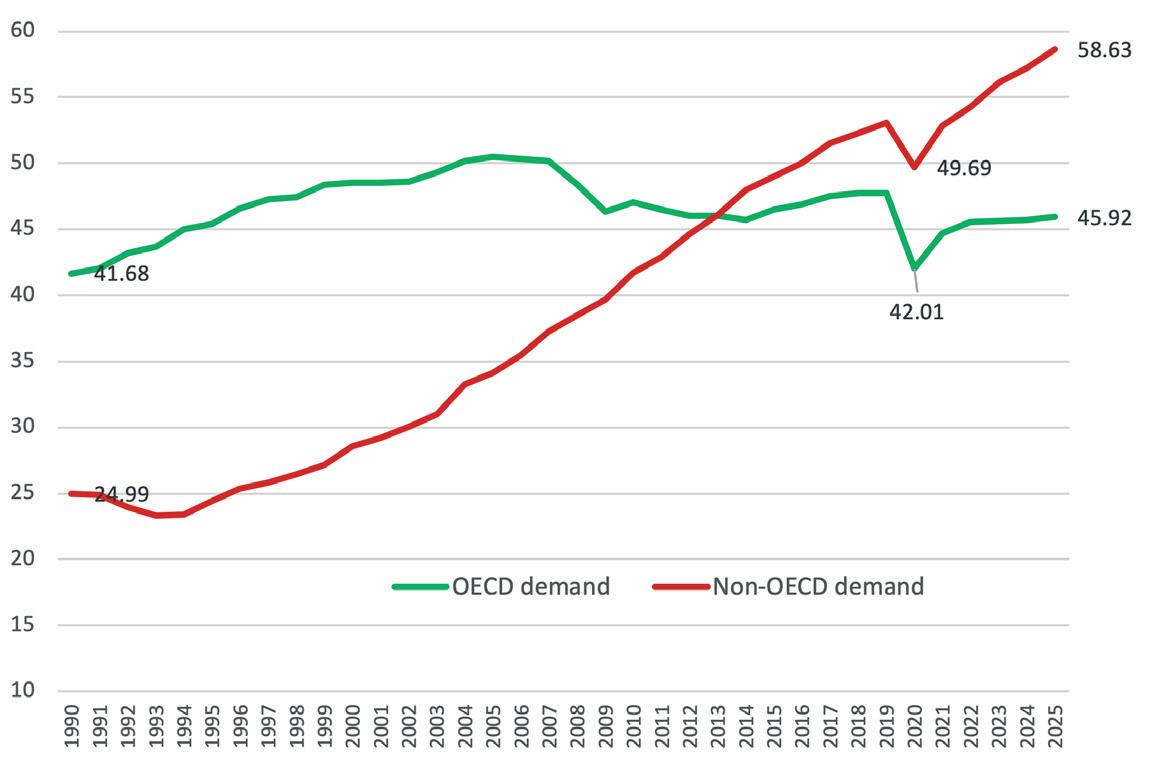
2. Non-OECD countries dominate global oil demand, (million bpd). Source: US Energy Information Administration.
US$85 - 90/bbl range in late 2023. The market adjusted to this as well, and prices since then have stayed mainly in the range of US$80 - 85/bbl. At the end of August 2024, conflict in Libya shut in over half of the country’s production, reportedly around 700 000 bpd. Yet daily spot prices for Brent crude, rather than rising, slid below US$80/bbl in early September 2024.
Middle Eastern oil producers continually monitor global oil demand. Producers must assess whether weaker-than expected demand will force oil into inventory and weigh upon prices, or whether hotspots in demand will produce prices spikes and disruptions. All international energy agencies track these forces, and they produce their best-guess forecasts of future demand. Naturally, there is a strong focus on events in the largest markets, where seemingly small events can translate into demand shifts totalling hundreds of thousands of barrels up or down.
A mind-boggling shift is occurring in oil demand in the Organisation for Economic Co-operation and Development (OECD) and non-OECD markets, as shown in Figure 2. According to the US Energy Information Administration (EIA), in 1990, OECD oil consumption was 16.69 million bpd more than non-OECD consumption. However, non-OECD demand grew quickly, and it caught up with OECD demand in 2013. The EIA forecasts that non-OECD demand will exceed OECD demand by 12.71 million bpd in the year 2025.
According to the Energy Institute (EI)’s and BP’s Statistical Review of World Energy, during the decade from 2013 through 2023, OECD oil demand fell at an average rate of -0.1% per year, led by a -0.4%/year drop in the EU.2 Historically, the OECD countries accounted for the bulk of the world’s oil consumption and imports. In 1973, OECD demand accounted for 75% of global demand. The oil price shocks of the 1970s cut OECD demand, and growth began to be led by the rest of the world.
Over the past decade, oil demand grew by 2.1% per year in the non-OECD countries. The fastest growth, 2.3% per year, was in the Asia-Pacific market. China was the key to this growth, where demand expanded at 4.6%/year. The EI reported that Chinese oil demand was 16.577 million bpd in 2023, second only to the US, where demand totalled 18.984 million bpd. Currently, the Chinese economy is facing headwinds caused in part by a property market slump. China’s GDP growth in 2024 may fall short of its 5% target, which will have knock-on impacts on oil imports and refinery activity.
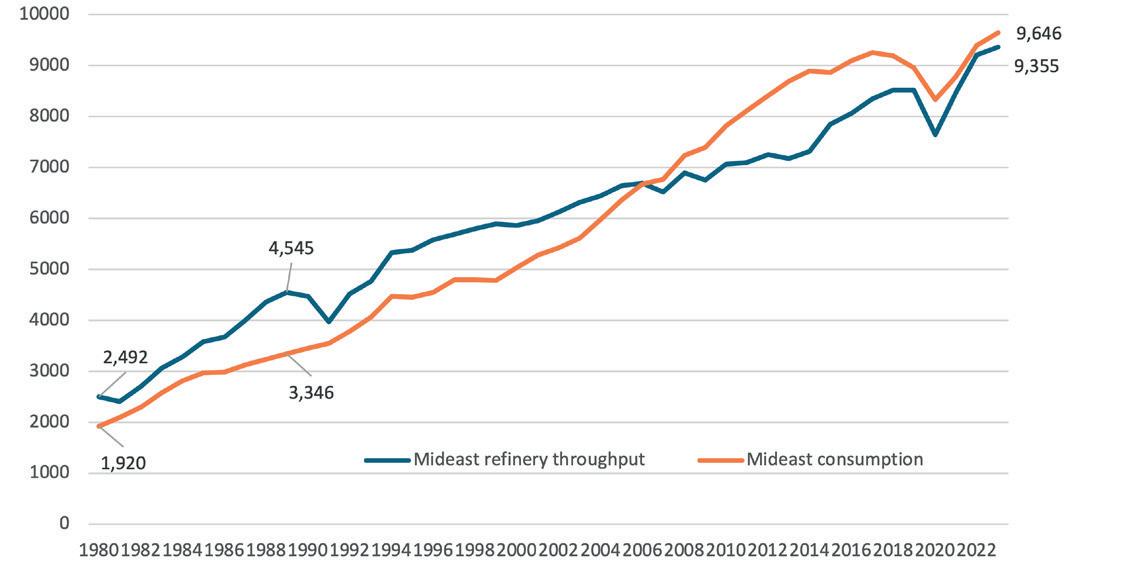
Like much of the non-OECD world, Middle Eastern oil demand has been growing, and the refining sector has been pressed to keep up with demand. Figure 3 shows the upward trend in Middle Eastern demand juxtaposed against the region’s refinery throughput. In 1980, demand of 1.92 million bpd was 0.572 million bpd below refinery throughput of 2.492 million bpd. In the 1980s, Saudi Arabia launched its plan to build export-oriented refineries, or ‘EXORS’. The goal was to capture the value-added of refining local crudes. Saudi Arabia’s refinery throughput jumped from 610 000 bpd in 1980, to 1 512 000 bpd in 1990, and to 1 669 000 bpd in 2000. Other Middle Eastern countries also launched refinery construction programmes, including export-oriented facilities. As Figure 3 illustrates, refinery throughput was comfortably higher than demand in the 1980s and 1990s. Yet demand grew even more swiftly, surpassing throughput by the year 2006. The great majority of refined fuel stayed within the region rather than being exported. At the time, the idea of ‘EXORS’ became ‘INDORS.’
Despite continued growth in the refining sector, throughput has not exceeded demand since 2006. The COVID-19 pandemic caused the sharp drop in demand and throughput seen in 2020. Both recovered and grew again between 2022 and 2023.
Given the strength of Middle Eastern oil demand, the focus of refinery expansions shifted partly to domestic markets, but not entirely. Technologically, the Middle East could increase its refinery runs and expand exports, but as was illustrated in Figure 2, demand stagnated and began to fall in many of the OECD countries that had inspired some of the export plans. Middle Eastern refiners looked also to the booming Asia-Pacific region, but refinery expansion programmes there were even

API’s Process Safety Site Assessment Program (PSSAP®) demonstrates a commitment to a culture of safety and continuous improvement at refining, petrochemical and chemical sites.
PARTICIPANTS BENEFIT FROM SHARED LEARNING, INDUSTRY BENCHMARKING, EXPERIENCED ASSESSORS AND MORE. To learn more visit:
more extraordinary than they were in the Middle East. Between 1980 and 2010, the Middle East added 4.632 million bpd of refinery capacity. The Asia-Pacific region added 17.904 million bpd, nearly four times as much. Although the Asia-Pacific region is a key customer for Middle Eastern exports, its refining industry satisfies the majority of its fuel demand.
Refinery expansion in the Middle East has been impressive, but there has been less incentive to invest in export-oriented facilities when utilisation rates have been lacklustre. According to the EI, in the early 1990s, refinery utilisation rates were often 90% and higher. Rates dropped below 90% in 2009 (the Great Recession) and never again achieved 90% utilisation. Rates collapsed to 74% during the COVID-19 pandemic. The year 2022 brought them back to 85%, but 2023’s utilisation rate dipped again to 81%. In comparison, OPEC reported that in July 2024, US refinery utilisation rates averaged 92.3%, European utilisation rates averaged 84.6%, and the selected Asian countries of Japan, China, India, Singapore and South Korea had a utilisation rate of over 94%.3
Despite relatively low refinery utilisation rates, there are several refinery projects underway or recently completed. These include fuel quality upgrades for domestic and export markets. Some projects were delayed during the COVID-19 pandemic, but 2022 - 2024 brought renewed activity.
Saudi Arabia’s recent refinery project was the 400 000 bpd Jazan refinery. This was completed in late 2021 and began to ramp up production and export capabilities in 2023. The refinery was run at 50% capacity initially. At full capacity, the refinery is designed to produce up to 75 000 bpd of gasoline, 250 000 of ultra-low sulfur diesel (ULSD), and 90 000 of vacuum residue. The vacuum residue provides feedstock for the integrated gasification combined cycle plant. The Jizan refinery started exporting refined products in early 2022. The completion of the hydrocracker is boosting ULSD output for export and cutting exports of lower-value vacuum gasoil and residual fuel oil. In 2023, Saudi Aramco and TotalEnergies also awarded contracts for the US$11 billion Amiral Project, a petrochemical plant integrated with the SATORP refinery.
Kuwait completed its 615 000 bpd Al Zour refinery in November 2022, after a delay caused by the COVID-19 pandemic. It exported its first cargo of naphtha, low-sulfur fuel oil, and jet fuel that month. This project is part of Kuwait’s Environmental Fuel Project (EFP). EFP was formerly known as the Clean Fuels Project, which upgraded the Mina Abdulla and Mina al-Ahmadi refineries. The Al Zour refinery has three 205 000 bpd crude distillation units, plus three 110 000 bpd atmospheric residuum desulphurisation units to produce low-sulfur fuel oil for use in the rapidly growing power sector. Transport fuels output will comply with EURO5 standards. There are three 62 000 bpd diesel hydrotreaters, two 53 000 bpd kerosene hydrotreaters, and two 18 200 bpd naphtha hydrotreaters.
Iraq’s 140 000 bpd Karbala grassroots refinery started trial operations in September 2022. The refinery was inaugurated by the Prime Minister in April 2023, producing only fuel oil at the time. The plan is to have the refinery start by refining 70 000 bpd of crude, then to ramp up to the full 140 000 bpd as the downstream units come online. This refinery was long-awaited. Construction began in February 2014. It faced numerous delays, but it will be a sophisticated plant capable of producing EURO standard fuels. The Basra refinery expansion project was delayed
by a contract dispute, but it is making progress once again. Iraq secured a loan for the project in August 2023, which will expand crude capacity by 70 000 bpd and will add a catalytic cracking unit. Iraq awarded the contract for the planned 300 000 bpd Faw refinery to the China National Chemical Engineering Company. Iraq plans several other refinery projects as well.
QatarEnergy awarded the contract for its Laffan Refinery 1 Upgrade project, which focuses on maintenance and safety.
In Oman, the government is working with Kuwait Petroleum International to build a joint venture refinery known as ‘OQ8’ at Duqm. This will be a 230 000 bpd deep conversion refinery with hydrocracker plus coker. The project is nearly complete, and the crude unit started operations in April 2023. The timing has been less urgent, however, because of the COVID-19 pandemic, and because of the expansions completed at the Sohar refinery, which now has a capacity of 198 000 bpd.
The global oil market is complex, and it has so many moving parts that no single entity can claim to control it, though hundreds of entities try to predict it. The price shocks of the 1970s and 1980s set producers and consumers at opposite corners. OPEC and the Middle East were often seen as adversaries by importing countries. The Middle East adapted to changing market conditions first by engaging in producer-consumer dialogue, often via OPEC. Eventually, both sides reached the conclusion that huge price swings, followed by alternating boom-bust cycles in demand, were bad for everyone.
The market is now changing, and Middle Eastern oil producers are changing as well. The traditional importers of the OECD have tamped down demand, working toward sustainable, carbon-neutral energy whenever possible. Oil demand growth has shifted to the non-OECD world, though many of these countries also are working toward cleaner energy. Moreover, OECD production has risen, largely because of the success of US oil production. US crude production grew to an average of nearly 13.1 million bpd during the 1H24, making it the largest oil producer in the world. This has greatly reduced the need for imports from the Middle East, thereby easing the supply-demand balance.
Middle Eastern producers have been adapting by having not only producer-consumer dialogue, but also producer-producer dialogue. Outside of the world of oil, the DoC is not well-known, but inventing and maintaining it has been a largely-unsung diplomatic feat. There is no doubt that this group can move the market. Indeed, there have been times when the market seemed to need adjustment, and the DoC stated that it would have a meeting. This became known as ‘verbal intervention’, because prices might move without any action being taken. The last two years have been ones of constant geopolitical risk, yet oil prices have been relatively stable in the US$80 - 85/bbl range. Why have they not spiked above US$100/bbl? There are too many moving parts to be sure, but supply and demand have been kept in reasonable balance. The Middle East and the DoC have worked since 2016 to shepherd the market and promote stability.
References
1. https://www.opec.org/opec_web/en/press_room/7063.htm.
2. https://www.energyinst.org/statistical-review.
3. OPEC Monthly Oil Market Report, (12 August 2024).


More than ever refiners are looking for opportunity crudes to increase economic profitability and optimise finished product delivery. Wesley Teasdale and Timothy Oubre, Halliburton Multi-Chem, explain how these crudes, along with overall crude diet changes, can have far-reaching impacts on multiple refining processes.
Crude purchasing and blending is an integral part to the overall health of a refinery’s operation.
Sourcing long-term crude contracts and market spot purchases allows refineries to optimise their output for the consumer. The economic drivers for which crudes are purchased and processed at certain ratios typically do not involve the stability of the actual crude blend.
A challenging crude blend can have far-reaching impacts on several areas of the refinery.
Incompatible or unstable crude blends can impact tank farm operations, fouling in multiple areas including cold and hot preheat trains and/or distillation towers, desalter reliability, and wastewater issues.1
As these challenges have developed, a response to understanding the cause and mitigating the risks has also been studied. Crude stability testing has emerged as central to the method of reliably processing various crude diets. When stability testing and predictive modelling are combined, technical solutions can be developed to facilitate the most economical operation of the refinery, and in some cases, process the most extreme crude diets with minimal or no interruption.
The increased presence of opportunity crudes on refinery slates is driving more crude compatibility issues for refiners. It is a lucrative business but demands an effective treatment programme to help mitigate against challenges such as separation in tanks, fouling in preheats, and emulsion stability in desalters.
Crude stability and asphaltene precipitation are a balance of the chemistry of the individual crudes and the proposed blends. Asphaltenes exist in many, but not all, crudes and they are stabilised within the crude based on the total chemical balance of that crude. If that balance is shifted by blending of multiple crudes together, then the solubility of the asphaltene in the crude can be reduced, forcing them out of the solution. In some cases, even individual crudes may be in such a state that asphaltenes are not stable prior to blending.
Understanding how a refinery’s typical crude diet behaves is critical, especially when an opportunity crude is introduced to the diet. When routine stability testing and modelling of the traditional diet are tracked with monitoring of unit operations – a baseline for expected performance can be established. Subsequently, when a change in diet – either by opportunity crude or ratio of crude feed – is introduced, modelling can be used to look for potential challenges and then plans can be developed to mitigate these risks.
Without upfront analysis of what is coming into a refinery and a treatment plan, there is a big and potentially costly risk for refiners to take.
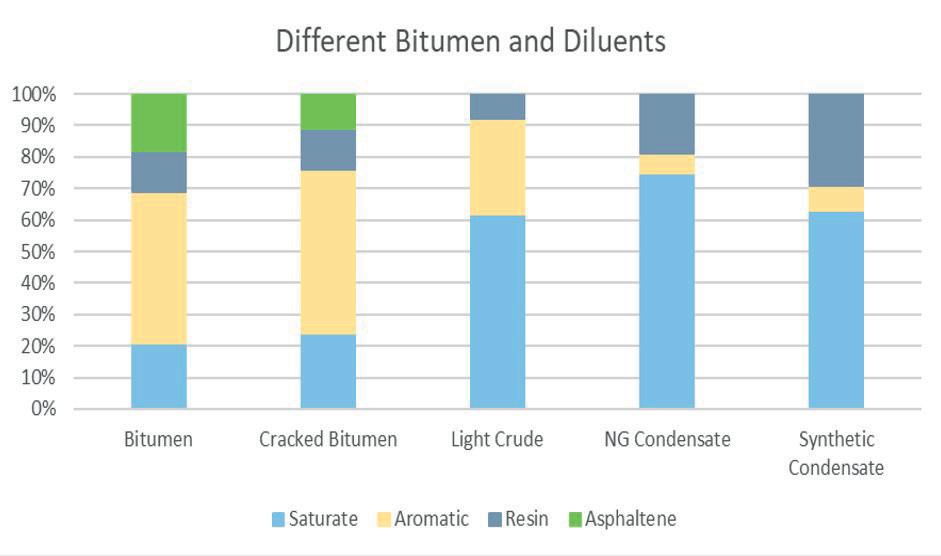
Crude oil can be classified compositionally by several techniques, one of these being the saturate, aromatic, resin, and asphaltene (SARA) analysis. When crudes are blended, the new crude blend can change compositionally and the balance keeping asphaltenes in solution can be altered enough to cause them to precipitate.2
The SARA analysis in particular is used to describe crude oil when referencing asphaltene stability because this analysis identifies the fractions of the oil that influence stable or unstable conditions.3 Saturates are nonpolar, saturated hydrocarbons, existing in linear, branched, or cyclic form. Aromatics contain one or more aromatic rings and act as good solvents for asphaltenes. Resins and asphaltenes have polar substituents. To distinguish between the two, asphaltenes are defined as n-heptane insoluble.3
Conducting SARA analysis on individual crudes can lead to a better understanding of how those crudes may potentially behave when blended. The colloidal instability index (CII) is a scale that looks at the components of the SARA analysis and relates how stable a crude oil potentially is. Typically used for reservoir monitoring, CII is useful for understanding the component relationship of various crudes.2
Refiners, however, usually are not concerned with one crude, but the blend of crudes and the economic incentives particular blends may offer. Understanding how the individual components of crude oil can impact a new blend’s stability is critical.1 By looking for potential negative impacts, steps can be taken to modify and lessen the risks of those impacts.
Crude assays, although frequently outdated, are another resource affording a preliminarily gauge of problematic blends. Using the example in Table 1, blending Canadian diluted bitumen (DilBit) with shale oil containing a higher paraffin and lower aromatic content could be problematic. The ratio of the blends is also critical, as well as understanding that the higher the asphaltene content does not necessarily lead to more deposition.


Find out more at arielcorp.com/applications
While water and process treatment programmes involving mechanical, operational, and chemical solutions will always be part of the solution, advances in these areas need to be made as crude compatibility issues become more prevalent.
Crude stability testing is one area where advances are being made and the results are showing. There are a few models employed by different chemical vendors in the market. The approach which Halliburton has seen the best results from includes a testing model that allows for a comprehensive review and modelling of crude blends. This in turn allows for the proper selection of chemicals – either part of a vendor’s portfolio or a customised chemistry designed to inhibit asphaltene precipitation.
The model which has had great success involves sourcing several crude samples, which are analysed in the lab and the resulting testing data is entered into the model. Within the model, it is possible to select a blend of as few as two crudes or multiple ones (in the double digits).
n Refinery had unexpected crude unit upset.
n 100 000 bbl of Albian heavy synthetic stranded on a barge, substantial demurrage costs.
n Crude model predicted no issue.
n Samples obtained and hand blends evaluated and aligned with model results.
n Crude processed without incident.
n US$1.5 million in margin opportunity and demurrage savings realised.
n Effluent hydrocarbon carry-under observed at desalters.
n Upset corresponded with a change in the ratio of crudes being processed, same crudes different % of each.
n Model showed new blend to be near incompatible.
n Stability test performed, confirmed model output.
n Increased emulsion breaker achieved desired brine quality, limiting impacts at waste water while this blend was processed.
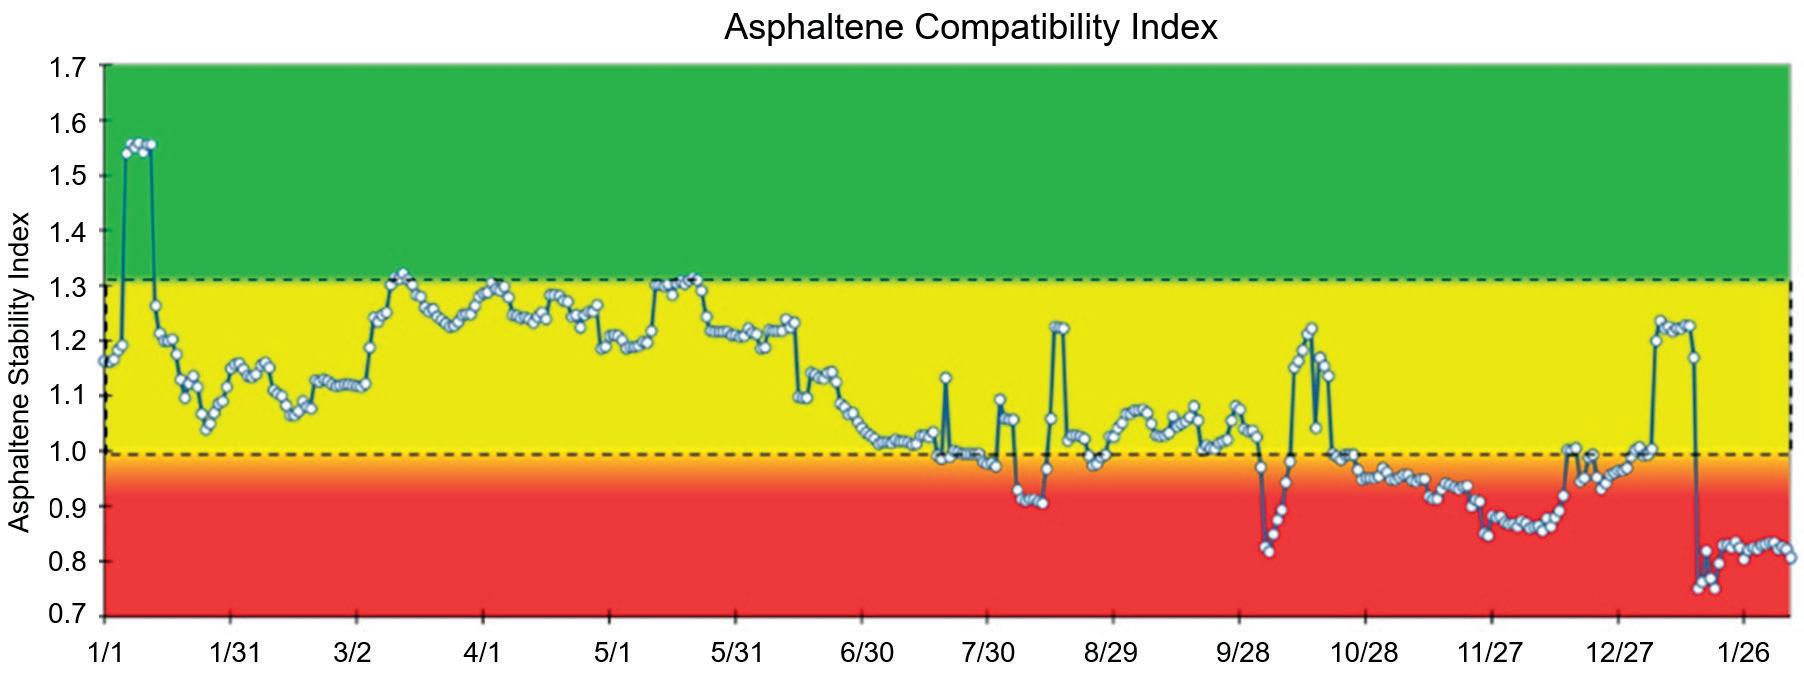
Based on the percentage of the different crudes blended and the physical properties from the lab analysis, the model can calculate areas of compatibility, near compatibility, and incompatibility (Figure 2). This allows operators to identify if there will be issues with the blend – and if so, plan for the right chemistry and appropriate chemical response.
The quality of the data put into the model impacts the quality of the output from the model. There are several issues and factors that need to be satisfied and reviewed by experienced users to validate the conditions of the model. This includes knowing the ratio of blended crudes, collecting multiple samples from key points in the process, and performing several tests for flocculation, emulsion tendency, asphaltene concentration, solvency, wash water quality impact, solubility, slop impact, and more.
The capability to generate this data not only allows for real-time monitoring, but scheduled future blends can be modelled for compatibility. The goal being not to change the crude blends, but to be aware if chemical adjustments need to be considered before the blend is created to minimise any issues the model predicts. So, instead of chasing a problem, the problem’s impact can be lessened.
If not monitored, incompatible crude blends will create process issues across a refinery that can lead to downtime, equipment repairs, and loss of production and revenue.
When crudes are mixed, these blends can disrupt the balance of the individual crude components – saturates, aromatics, resins, and asphaltenes, leading to compatibility issues.
Asphaltenes are solid particles in the bulk oil. They are the heaviest and most polar component within crude oil. When blending them with saturates (i.e. paraffins), the solvency of the asphaltenes in the crude blend is limited. Resins and aromatics within the crude can stabilise them; however, if the ratio of resins and aromatics to saturates is disrupted, asphaltenes can fall out of solution (destabilised) and create challenges for refiners.
Water and process treatment programmes involving mechanical, operational, and chemical solutions are the solution. The strength of their performance requires effective upfront crude stability testing and subsequent modelling of the data by experts, who have experienced treating different crude types. This combination can ensure the power of the model is used effectively to maximise the value of a refiner’s assets.
1. BAMBINEK, K., PRZYJASNY, A., and BOCZKAJ, G., ‘Compatibility of Crude Oil Blends – Processing issues related to asphaltene precipitation, methods of instability prediction – a review’, Industrial & Engineering Chemistry Research , (2023), 62, 2 - 15.
2. ASHOORI, S., SHARIFI, M., MASOUMI, M., and SALEHI, M.,: ‘The relationship between SARA fractions and crude oil stability’, Egyptian Journal of Petroleum, (2017).
3. FAN, T., WANG, J., and BUCKLEY, J., ‘Evaluating Crude Oils by SARA Analysis’, SPE 75228, (April 2002).

economic and environmental viability. The process typically requires significant energy input and can generate byproducts that need further treatment, adding complexity and cost.
Dissolution recycling has captured the space between mechanical recycling and chemical recycling technologies, offering superior product purity and quality over mechanically recycled polymers while preserving polymer structure. It allows for lower energy consumption and related CO2 footprint compared to other technologies that break down polymers into smaller fragments, like pyrolysis.
Sulzer Chemtech is at the forefront of this innovation with its DEVOTM technology, a solution designed to optimise the separation of solvents from polymers in such dissolution recycling processes. This technology not only enhances environmental benefits, but also significantly improves economic efficiency and product quality.
The global production of plastics hit a staggering 400 million t in 2022. Only 55 million t were recycled – a fraction of which ended up in landfills (174 million t) or was mismanaged (82 million t) in 2019 – as per the Organisation for Economic Cooperation and Development (OECD).1
The 2023 UNEP report2 further reveals that 56% of the generated plastic waste is dumped in landfills or dumpsites, posing a severe threat as hazardous chemicals can seep into the environment.
There are several key reasons explaining low recycling rates, including the difficulty with collection and sorting, the limited amount of recycling infrastructure and technology maturity, as well as economic viability. If industry is going to achieve circularity of products and materials, these issues must be addressed, and one of the key ways of achieving this is through the use of dissolution recycling.
This innovative process offers a promising middle ground between mechanical recycling and chemical recycling. It is one of the few technologies that keeps the polymer structure intact, as it does not involve any chemical reactions, which break down polymer chains into primary building blocks.
Most existing plants are on a pilot and demonstration scale, but as the technology quickly matures and the demand for recycled plastics grows, larger commercial-scale plants with a capacity of thousands of tons per year have now become viable.
The effectiveness of plastic recycling often depends on the consumer waste management systems in place within a country. In many regions, specific types of plastic are collected separately to streamline the recycling process.
For instance, in Switzerland, PET bottles have long been collected separately and successfully recycled back into new bottles, creating a closed-loop system. Similarly, polyolefin bottles are also collected, but the systematic collection of other types of consumer plastics is still in its early stages.
To enhance the efficiency and quality of recycling, advanced sorting and washing technologies are being developed. These innovations are crucial as they allow for the more effective separation of different plastic types, removing contaminants and improving the purity of recycled materials. As these technologies evolve, they promise to simplify subsequent recycling steps and significantly enhance the overall quality of recycled polymers, leading to more sustainable and high-quality recycled products.
As its name indicates, the core of dissolution recycling is the dissolution step itself, where a solvent, or mixture of solvents, selectively dissolves a specific type of polymer. The choice of solvent is crucial and is based on its ability to effectively dissolve the target polymer while leaving others intact, but also on other technical and environmental aspects as well as on economic factors like availability and price.
Polymers do not dissolve instantaneously; the solvent needs time to diffuse into the polymer through the surface and disentangle the polymer chains. This process is faster with lower molecular weight polymers, at higher temperatures, and smaller particle sizes. Smaller solvent molecules tend to diffuse faster than larger ones.
Several methods were developed to speed up dissolution, such as applying microwaves or adding a small portion of a non-solvent. Ideally, the selected solvent dissolves only the target polymer, and not the others. 3,4
After the initial dissolution, the next phase in the recycling process focuses on separating the target polymer from impurities and any undissolved plastics. This separation can be accomplished using various methods, such as filtration or centrifugation, to purify the solution. Despite these efforts, the solution may still contain unwanted additives like colourants, antioxidants, and processing aids. To address this, the solution undergoes further
purification, often involving adsorbing agents or other methods designed to remove these residual contaminants.
After purification, the target polymer is optionally selectively precipitated from the solution. This is typically accomplished by adding an antisolvent or by adjusting the temperature or pressure to induce the polymer to solidify and separate from the solution.
The final steps of the process involve the critical task of separating the remaining solvent from the polymer. This is typically done through devolatilisation, which can be carried out using either static or rotating equipment.
Sulzer’s DEVO technology was initially created for the purification of virgin plastics, but it also enables recycling facilities to increase the quality of recycled polymers and the overall throughput, optimising their processes.
This is achieved through a multi-stage process that increases the polymer concentration from initial concentrations of 5 - 20 wt% to the required residual solvent level, typically achieving > 99.9 wt% polymer concentration. It uses static mixer heat exchangers and degassing chambers with customised internals. The number of degassing stages is designed according to the needs of the process and could vary according to the process requirements.
The process starts with a polymer solution of 5 - 20 wt% concentration, which is heated up to temperatures where the saturation pressure of the volatile becomes higher than the pressure in the flash chamber.
The heat exchangers are engineered for optimal thermal transfer, allowing the rapid evaporation necessary for solvent removal while preserving polymer integrity. Since the solution’s viscosity is low in this stage, the volatile is removed rapidly by evaporation. Vapour bubbles form and expand, and the volatile leaves the solution.
The equipment is designed to avoid the entrainment of the polymer by the volatile gas stream. During this process, the temperature is lowered due to the evaporation energy required, and viscosity increases due to the temperature decrease and concentration increase. The now concentrated polymer solution leaves the vessel at the bottom and is transferred to the next stage.
Second stage: intermediate concentration
In the second stage, the now higher viscous polymer solution undergoes further solvent removal. The solution is reheated prior to entering the degassing chamber to reach the optimal conditions for removing volatiles. The concentration is increased to over 90 wt%.
The system maintains tight control over process conditions to prevent polymer degradation, ensuring consistent quality.
Third stage: final purification
The final stage employs heat exchangers, such as the Sulzer mixer reactor (SMR TM ), again to set the


Up dated with data from DOE partnership & extensively tested within the EU-funded carbon capture consortium, “SCOPE ”
Updated with data from DOE partnership & extensively tested within the EU-funded carbon capture consortium, “SCOPE ”
Updated with data from DOE partnership & extensively tested within the EU-funded carbon capture consortium, “SCOPE ”
➢ Thoroughly tested as part of EUfunded consortium , “SCOPE”
➢ New 1-CESAR model updated with cutting edge lab and plant data from DOE partnership
Applications:
Applications:
Applications:
➢ P ower generation
➢ Power generation
➢ Power generation
➢ CO2 capture from LNG -fueled ship s
➢ CO2 capture from LNG -fueled ship s
➢ CO2 capture from LNG -fueled ship s
➢ Hydrogen production via reforming :Reliable
➢ Renewable methane from landfill gas and organic waste
➢ Renewable methane from andfilll gas and organic waste
➢ Renewable methane from landfill gas and organic waste
➢ Renewable methane from landfill gas and organic waste
➢ Hydrogen production via reforming
➢ Hydrogen production via reforming
➢ Hydrogen production via reforming
➢ 2CO capture from LNG fueled- ship s
➢ P ower generation
Reliable:
Reliable:
Reliable:
Applications:
➢ New CESAR-1 model updated with cutting edge lab and plant data from DOE partnership
➢ New CESAR-1 model updated with cutting edge lab and plant data from DOE partnership
➢ New CESAR-1 model updated with cutting edge lab and plant data from DOE partnership
pU dated with data from DOE partnership & extensively tested within the funded-EU carbon capture ,consortium “SCOPE ”
➢ Thoroughly tested as part of EUfunded consortium , “SCOPE”
➢ Thoroughly tested as part of EUfunded consortium , “SCOPE”
➢ Thoroughly tested as part of EUfunded consortium , “SCOPE”


temperature of the now very viscous solution. Volatile removal is now controlled by diffusion of the volatile to the interface between molten polymer and gas phase. Therefore, this process requires increased residences times and efficient renewal of the polymer/gas interface.
At this point, a stripping agent may be added for enhanced performance. The effect of the stripping agent is, firstly, the reduction of the partial pressure of the volatile in the vapour phase and, hence, the equilibrium concentration in the polymer phase; secondly, it improves the foaming of polymer melts.
By designing the optimal internals for the degassing chamber, residence time can be controlled, and polymer concentrations greater than 99.9 wt% can be achieved. This step is critical for end-uses demanding the highest purity levels, eliminating solvent traces to meet existing standards of the polymer industry.
After the devolatilisation, additives can be blended into the polymer stream prior to pelletisation to tailor the final product properties.
Devolatilisation is essential for dissolution-based polymer recycling processes, requiring precise control of interphase generation, pressures, and temperatures to effectively separate volatile components. Different technologies, such as DEVO and twin-screw degassing extrusion, offer varied approaches to this process.
While both methods are effective, DEVO technology uses static equipment that excels in handling wide ranges of viscosity polymers, offering a streamlined and efficient solution. In contrast, twin-screw extruders are dynamic, allowing for rapid volatile reduction but with different operational characteristics.
The following sections will compare the key benefits of DEVO technology against degassing extrusion.
In dissolution recycling processes, two key factors determine the degradation of the recycled polymer: the shear rates and the combined temperature/time profile the material experiences over time.
DEVO technology uses static devolatilisers that offer precise temperature control, minimising mechanical energy use and allowing for optimal polymer quality. By recirculating a fraction of the devolatilised stream, DEVO ensures consistent heat application and milder temperature profiles, reducing the risk of polymer degradation.
While degassing extruders constantly renew the polymer surface, they operate at higher shear rates, especially with viscous media, leading to increased temperatures and potential material degradation. DEVO operates at around 90% lower shear rates with highest shear rates appearing in the polymer pumps and maintains lower peak temperatures, which helps preserve the polymer’s molecular weight – a critical factor for all polymers, but specifically for materials like polyesters, polyamides, and polyolefins.
DEVO technology utilises static equipment that significantly lowers both CAPEX and OPEX. Compared to degassing extrusion, it achieves lower total investment costs not only through reduced equipment costs, but also by minimising outside battery limits (OSBL) costs.
A major factor in these savings is the reduction in electric power demand by up to 90%, made possible by shifting from electricity to more cost-effective energy sources like natural gas. Optionally, DEVO can be operated using renewable energy sources.
Unlike extruders, which depend entirely on electricity, the technology can harness heat from energy recovery sources such as waste incineration and fuel gases. This results in operational cost savings of 60 - 70% per kWh. Beyond energy savings, DEVO’s maintenance costs are notably lower than those of typical degassing extruders. This is because its rotating equipment is limited to gear pumps, which require significantly less maintenance compared to the more complex systems in extruders.
The technology was initially developed for the traditional polymer industry and has been proven in more than 40 reference projects at capacities up to 450 000 tpy, achieving remaining VOC levels in the parts per million (ppm) range.
The technology’s reliability is enabled by extensive piloting facilities in Switzerland, ensuring that scale-up from small technical size to industrial capacities is seamless and predictable.
Dissolution recycling presents a promising solution for achieving high-quality plastic recycling, especially for polymer streams that are difficult to recycle mechanically. It allows for the removal of impurities, several additives, and degradation products, producing a recycled material with properties comparable to virgin plastics.
As the demand for high-quality recycled plastics continues to grow, driven by sustainability trends and regulatory pressures, advanced technology enables the recycling industry to meet increasingly strict recycling targets while delivering materials with qualities close to those of virgin polymers.
The authors would like to acknowledge the valuable contributions of Irina Yarulina, Ulla Trommsdorff and Simone Ferrero, Sulzer.
1. https://www.oecd.org/en/topics/resource-efficiency-and-circulareconomy.html
2. United Nations Environmental Programme and Secretariat of the Basel, Rotterdam and Stockholm Conventions, ‘Chemicals in plastics: a technical report’, Geneva, Switzerland, (2023).
3. TRIEBERT, D. and HANEL, H., https://researchoutreach.org/articles/ waste-starting-materials-solvent-based-recycling-polymer-industry/ 4. KraussMaffei, Coperion brochure on integrated devolatilisation processes.


Jim Aiello, Merichem Technologies, USA, discusses the rise of renewable diesel and the global transition to cleaner fuels.
Renewable diesel, often made from hydrotreated vegetable oils (HVO) and biomass-based diesel, is now an established and growing industry. It provides one of the most efficient direct routes to lowering greenhouse gas emissions. Although it is produced from used cooking oils (UCO), waste animal fats (tallow), and/or certified sustainable vegetable oils, such as soybeans and rapeseed, renewable diesel – unlike fatty acid methyl ester (FAME) based biodiesel – has a nearly identical chemical structure to petroleum diesel and is 100% renewable and sustainable. It is a drop-in alternative to petroleum diesel and requires no vehicle modifications. Renewable diesel is the latest, greenest diesel on the market.
In its ‘Short-Term Energy Outlook’, released on 6 February 2024, the US Energy Information Administration (EIA) reported expectations of increased renewable diesel production by approximately 30% annually in 2024 and 2025. Production capacity continues to expand, with California at the eye of the storm as the primary driver of demand.
In Europe, a strategy for lowering greenhouse gas emissions from road transport is driving a series of regulations, such as the Renewable Energy Directive (RED). This has spurred the use of renewable diesel in the EU in recent years. Further expansion is planned through the end of 2025, making it one of the largest biofuel markets globally.
In the face of fluctuating market conditions for traditional oil-derived fuel markets, refiners are increasingly focusing on the energy transition. Their goals are to improve the profitability of their assets and secure long-term operations while reducing greenhouse gas emissions and moving towards carbon neutrality. Many refineries around the world are producing renewable fuels at either existing refineries that will continue to process crude oil, or those that are idle and have existing infrastructure to accommodate new processing units to refine renewable fuels.
The HVO process produces renewable fuels via hydrogenation and hydrocracking of vegetable oils and animal fats using hydrogen and catalysts at high temperatures and pressures. The oxygen is stripped in a reactor with a catalyst that often requires sulfiding to promote conversion chemistry and avoid catalyst deactivation. Dimethyl-disulfide (DMDS) –which is the most commonly used chemical for sulfiding the catalyst – is converted to hydrogen sulfide (H2S), and the oxygen from the feedstock is converted to carbon dioxide (CO2) and water during the deoxygenation reaction.
The hydrocarbon liquids exit the reactor and are routed to a three-phase separator, where the water is removed, and vapours are collected for cleaning and recycling. The hydrocarbon liquids are then routed to an isomerisation reactor before being separated into various cuts to create light fuels, sustainable aviation fuels (SAFs), and renewable diesel fuel.
The vapours from the separator are then routed to an amine unit to remove the H2S and CO2 formed in the deoxygenation reactor. The treated gas from the amine unit is rich in hydrogen and recycled to the HVO process. A slipstream may be used as fuel gas. Acid gases may be further processed
to reduce H2S at the site depending on other units that may be operating at the refinery.
In August 2019, a multinational oil and gas company based in Europe operating a biofuel refinery with renewable diesel production commissioned a LO-CAT® unit to serve as the SRU to treat the amine unit offgas. LO-CAT, which stands for Liquid Oxidation CATalyst, is a patented, wet scrubbing, liquid redox system that uses a chelated iron solution to convert H2S to innocuous, elemental sulfur.
The existing higher capacity Claus SRU had been shut down when petroleum oil processing ceased. The typical minimum H2S content for a feed to a Claus unit is 35 mol%, but that condition cannot be met when the HVO process with lower H2S loading is operating. Modified Claus units can operate with limited reduction of H2S in the feed stream, but to achieve >99.9% sulfur recovery, a tail gas treating unit is required downstream of any Claus SRU, which increases cost. Turndown conditions can also negatively affect Claus unit sulfur recovery efficiency.
A highly flexible sulfur recovery process was needed to account for the range of feed gas conditions. The selected process needed to achieve high recovery percentages over a wide range of operating flow rates and H2S concentrations. The refiner’s requirements were:
n Maintain sulfur removal efficiency at turndown conditions.
n Handle minimum H2S concentration in the feed acid gas stream.
n Guarantee to meet customer requirements.
The LO-CAT process operating at this location employs a rectangular-shaped autocirculation vessel. The equipment was installed and ran successfully for the first full year of service. During the first unit turnaround, the LO-CAT solution was drained from the autocirculation vessel and stored for use after the turnaround. The vessel was opened, cleaned, and inspected. There was a small amount of sulfur buildup on the vessel’s floor. The unit was cleaned with a warm water wash, and no corrosion was noted. The shutdown for maintenance took one week –the equivalent of 98% availability in the first year of operation.
In 2020, the biorefinery reached full operation with a five-fold increase in biofuel productions compared to 2019. The unit has been running continuously and successfully since that time.
The LO-CAT process utilises an aqueous iron solution with the catalytic performance enhanced by a proprietary blend of chemicals. The H2S is converted to elemental sulfur by redox chemistry according to the following overall reaction:
Direct oxidation reaction: H2S + 1/2 O2 → H2O + S°
The redox reaction is carried out in separate sections of the process, as summarised below:
Absorber: H2S + 2Fe++ → S° + 2Fe++ + 2H+
Oxidiser: ½ O2 + H2O + 2Fe++ → 2OH– + 2Fe+++


• Simple hydraulic installation − no welding
• Helium leak tight seal to 1x10 -10 cc/sec
• 100% Lot tested to ensure unmatched quality
• Pressure ratings Up to 7000 PsiG (483 BarG)
• Wide range of sizes and ASME/ASTM certified materials available


ASME PCC-2 Compliant Heat Exchanger Tube Plugging System


877.383.1029 l est-sales@curtisswright.com l cw-estgroup.com/he-24
Trusted by plants around the world as their go-to tube leak solution, Pop-A-Plug Tube Plugs from Curtiss-Wright are engineered for optimal performance throughout the life cycle of heat exchanger equipment. Controlled hydraulic installation eliminates welding and time-consuming pre-/post-weld heat treatments that can cause damage to tubes, tube sheet ligaments, and joints.


The exothermic absorber reaction represents the oxidation of H2S to elemental sulfur and the accompanying reduction of the ferric iron state (active) to the ferrous iron state (inactive). This reaction is irreversible and not equilibrium dependent. The oxidiser reaction (also exothermic) represents the oxidation of the ferrous iron back to the ferric iron state.
LO-CAT technology produces a sulfur ‘cake’, which contains approximately 65% sulfur, 35% moisture, and trace amounts of proprietary chemicals. It does not produce any other products or byproducts, so no additional treatments are required. The process is inherently safe because the reaction occurs in the aqueous phase at near-ambient temperatures. The removal of sulfur is not affected by turndown conditions, and the process can be applied to almost any vapour stream containing H2S.
Liquid redox is an economical process for H2S removal and sulfur recovery within a given range. On the low end of sulfur recovery of less than 1 long tpd, non-regenerative chemical absorbents (scavengers) such as SULFURTRAP® EX are likely to be more economical due to the low capital cost of a lead, lag two-vessel design, even with the higher operating costs. As the sulfur removal requirement increases, operating costs become prohibitive using scavengers or adsorbents. This is when a liquid redox process is advantageous due to significantly lower operating costs. The higher capital cost of a LO-CAT unit is quickly paid out in operating savings vs replacement of the non-regenerative scavenger or adsorbent.
Fleets across the US that have switched to renewable diesel have found that they can reduce emissions using the same infrastructure as diesel, and operating characteristics remain the same or better as with petroleum diesel.
Titan Freight Systems has been providing overnight services across the Pacific Northwest for more than 50 years. To reduce emissions by 20%, in 2010, the company installed air deflectors, side skirts, low-rolling-resistance tyres, and other aerodynamic improvements to its fleet of inline trucks and trailers, each of which travels 144 000 miles annually. By 2019, their investments had only reduced emissions by 6%. Titan switched to renewable diesel, which led to a 36% reduction in emissions over the entire three-state fleet and lowered its overall maintenance costs.
In partnership with industry, the National Renewable Energy Laboratory (NREL) has evaluated alternative fuels’ in-use performance in delivery, transit, and freight vehicles.
In 2015, in cooperation with United Parcel Service (UPS) and Clean Cities’ National Clean Fleets Partnership, NREL compared the fuel economy and emissions impact of renewable diesel vs petroleum diesel in fleet vehicles.
To gather real-world operational field data, NREL instrumented 12 vehicles – six regional tractors and six package-delivery vans – with data recorders. Representative drive cycles were selected for chassis dynamometer evaluation to determine the fuel economy and emissions impact of renewable vs petroleum diesel in a controlled setting. Fuel properties of the renewable diesel and petroleum diesel were also analysed, which revealed that the renewable diesel was less
dense than petroleum diesel and exhibited a higher mass-based heating value yet lower volume-based heating value.
The NREL tests concluded that renewable diesel reduces CO2 emissions by 4.2% on average compared to petroleum diesel, which is attributable to the higher mass-based heating value and lower carbon-to-hydrogen ratio of renewable diesel. Fuel consumption and economy trended strongly with mass, and volume-based heating values, respectively, leaving the engine thermal efficiency unchanged for a given cycle.
UPS is now one of the world’s largest users of renewable diesel.
The City of Oakland became an early adopter of renewable diesel. The city transitioned its fleets from petroleum diesel as part of its low-cost strategy to meet sustainability goals. The cities of San Diego and Long Beach have followed suit.
In 2022, Neste, Altens, and TRAPIL collaborated on the first-ever transport of renewable diesel by pipeline from Le Havre in northwestern France to Gennevilliers, just outside Paris. By transporting fuel via pipeline vs tanker trucks, greenhouse gas emissions were reduced by 92% compared to conventional logistics. Altogether, they transported 3.5 million litres of renewable diesel, which helped make large volumes of renewable diesel available widely in the region, especially to large cities such as Paris.
In 2023, New York City announced its plans to convert all heavy-duty vehicles in its fleets to renewable diesel, which includes more than 12 600 on- and off-road trucks.
The rise of renewable diesel is a direct response to the growing concerns over the carbon emissions associated with fossil fuels. Demand currently outpaces supply, with major fuel producers investing in retooling petroleum refineries to produce renewable diesel and jet fuel.
The US Department of Energy (DOE) Alternative Fuels Data Center substantiates the increase in interest with reports that domestic production and plants under construction are growing significantly. The Union of Concerned Scientists calls the renewable diesel production capacity in the US ‘a massive expansion’.
The International Energy Agency (IEA)’s latest ‘World Energy Investment’ report, released in 2023, reveals that approximately US$2.8 trillion was spent on energy in 2023. More than US$1.7 trillion was invested in clean technologies, which underscores the potential and importance of renewable fuels in the energy sector.
The global transition to renewable fuels is not just a trend. It is a significant shift towards sustainable energy consumption and represents a practical solution that balances ecological concerns with economic needs and performance expectations. It is a crucial step in the decarbonisation of the transportation sector.
fuels as an alternative to emissions-heavy fossil fuels. Methane, food crops and alcohol are being used to create some volume of these novel fuel alternatives. But those feedstocks are costly, not easily obtained and controversial, and the industry needs scale to meet global decarbonisation targets.
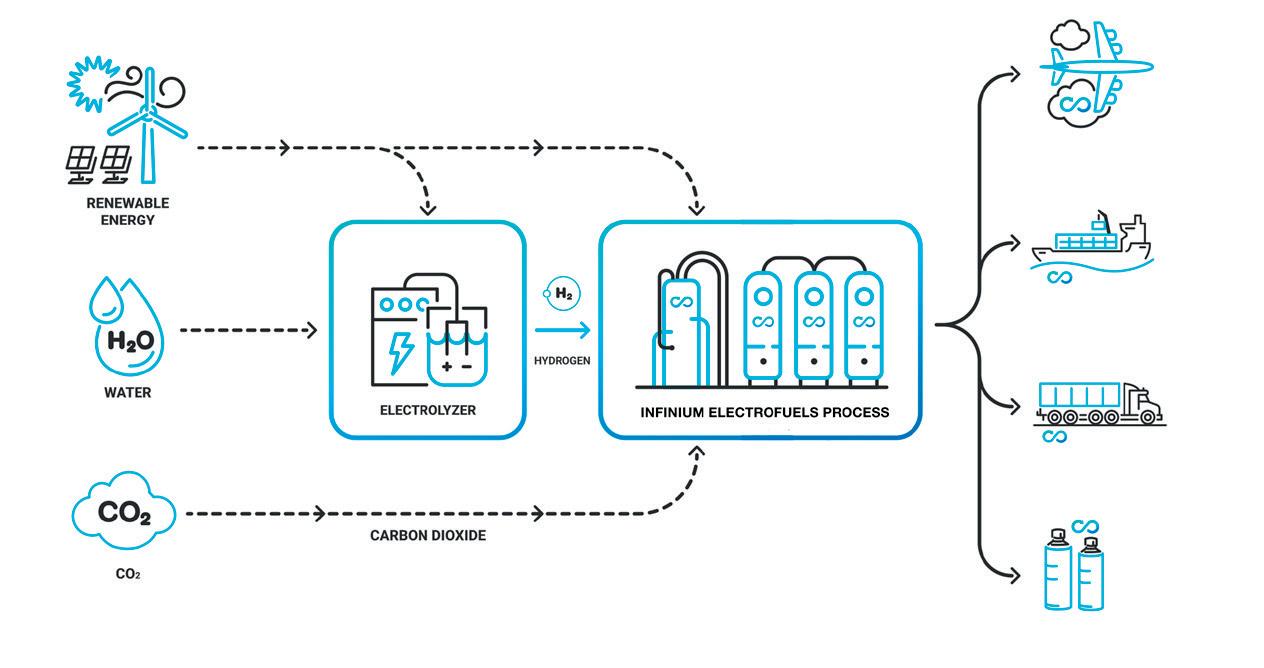
US-based clean fuels provider Infinium has taken a different approach. Using what is known as a power-to-liquids (PtL) pathway, a new class of sustainable electrofuels, or eFuels, came to market last year for the first time. These eFuels are created through a proprietary
technology platform that takes water, renewable power (from solar or wind farms) and waste carbon dioxide (CO 2 ) to create ultra-low carbon eFuels.
These eFuels offer new hope for industries ranging from trucking to aviation and even manufacturing. They net out to 90% or greater lower lifecycle greenhouse gas emissions over today’s fossil-based fuels, making them a suitable option for the long overdue decarbonisation of the global supply chain.
But how does it all work?

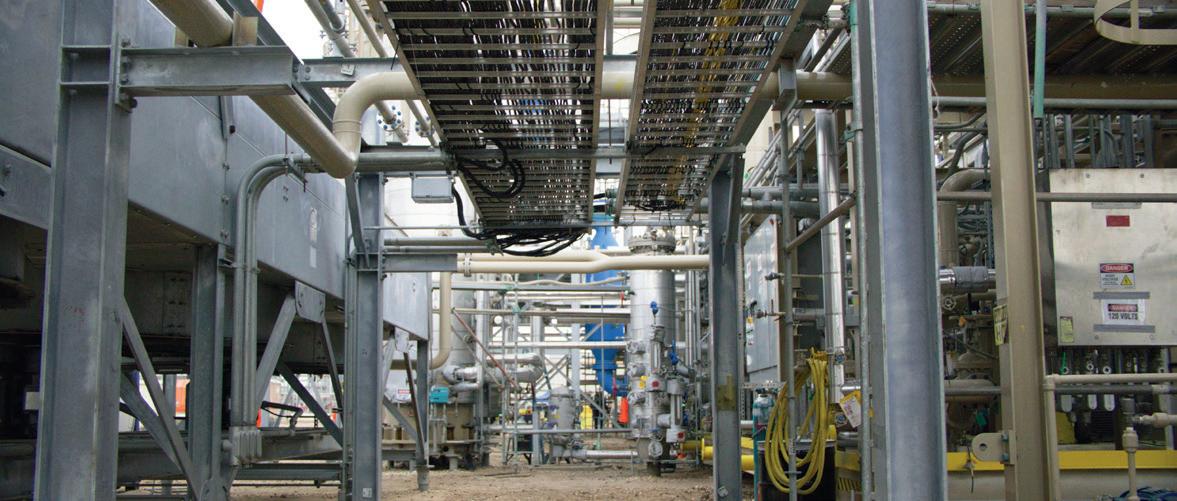
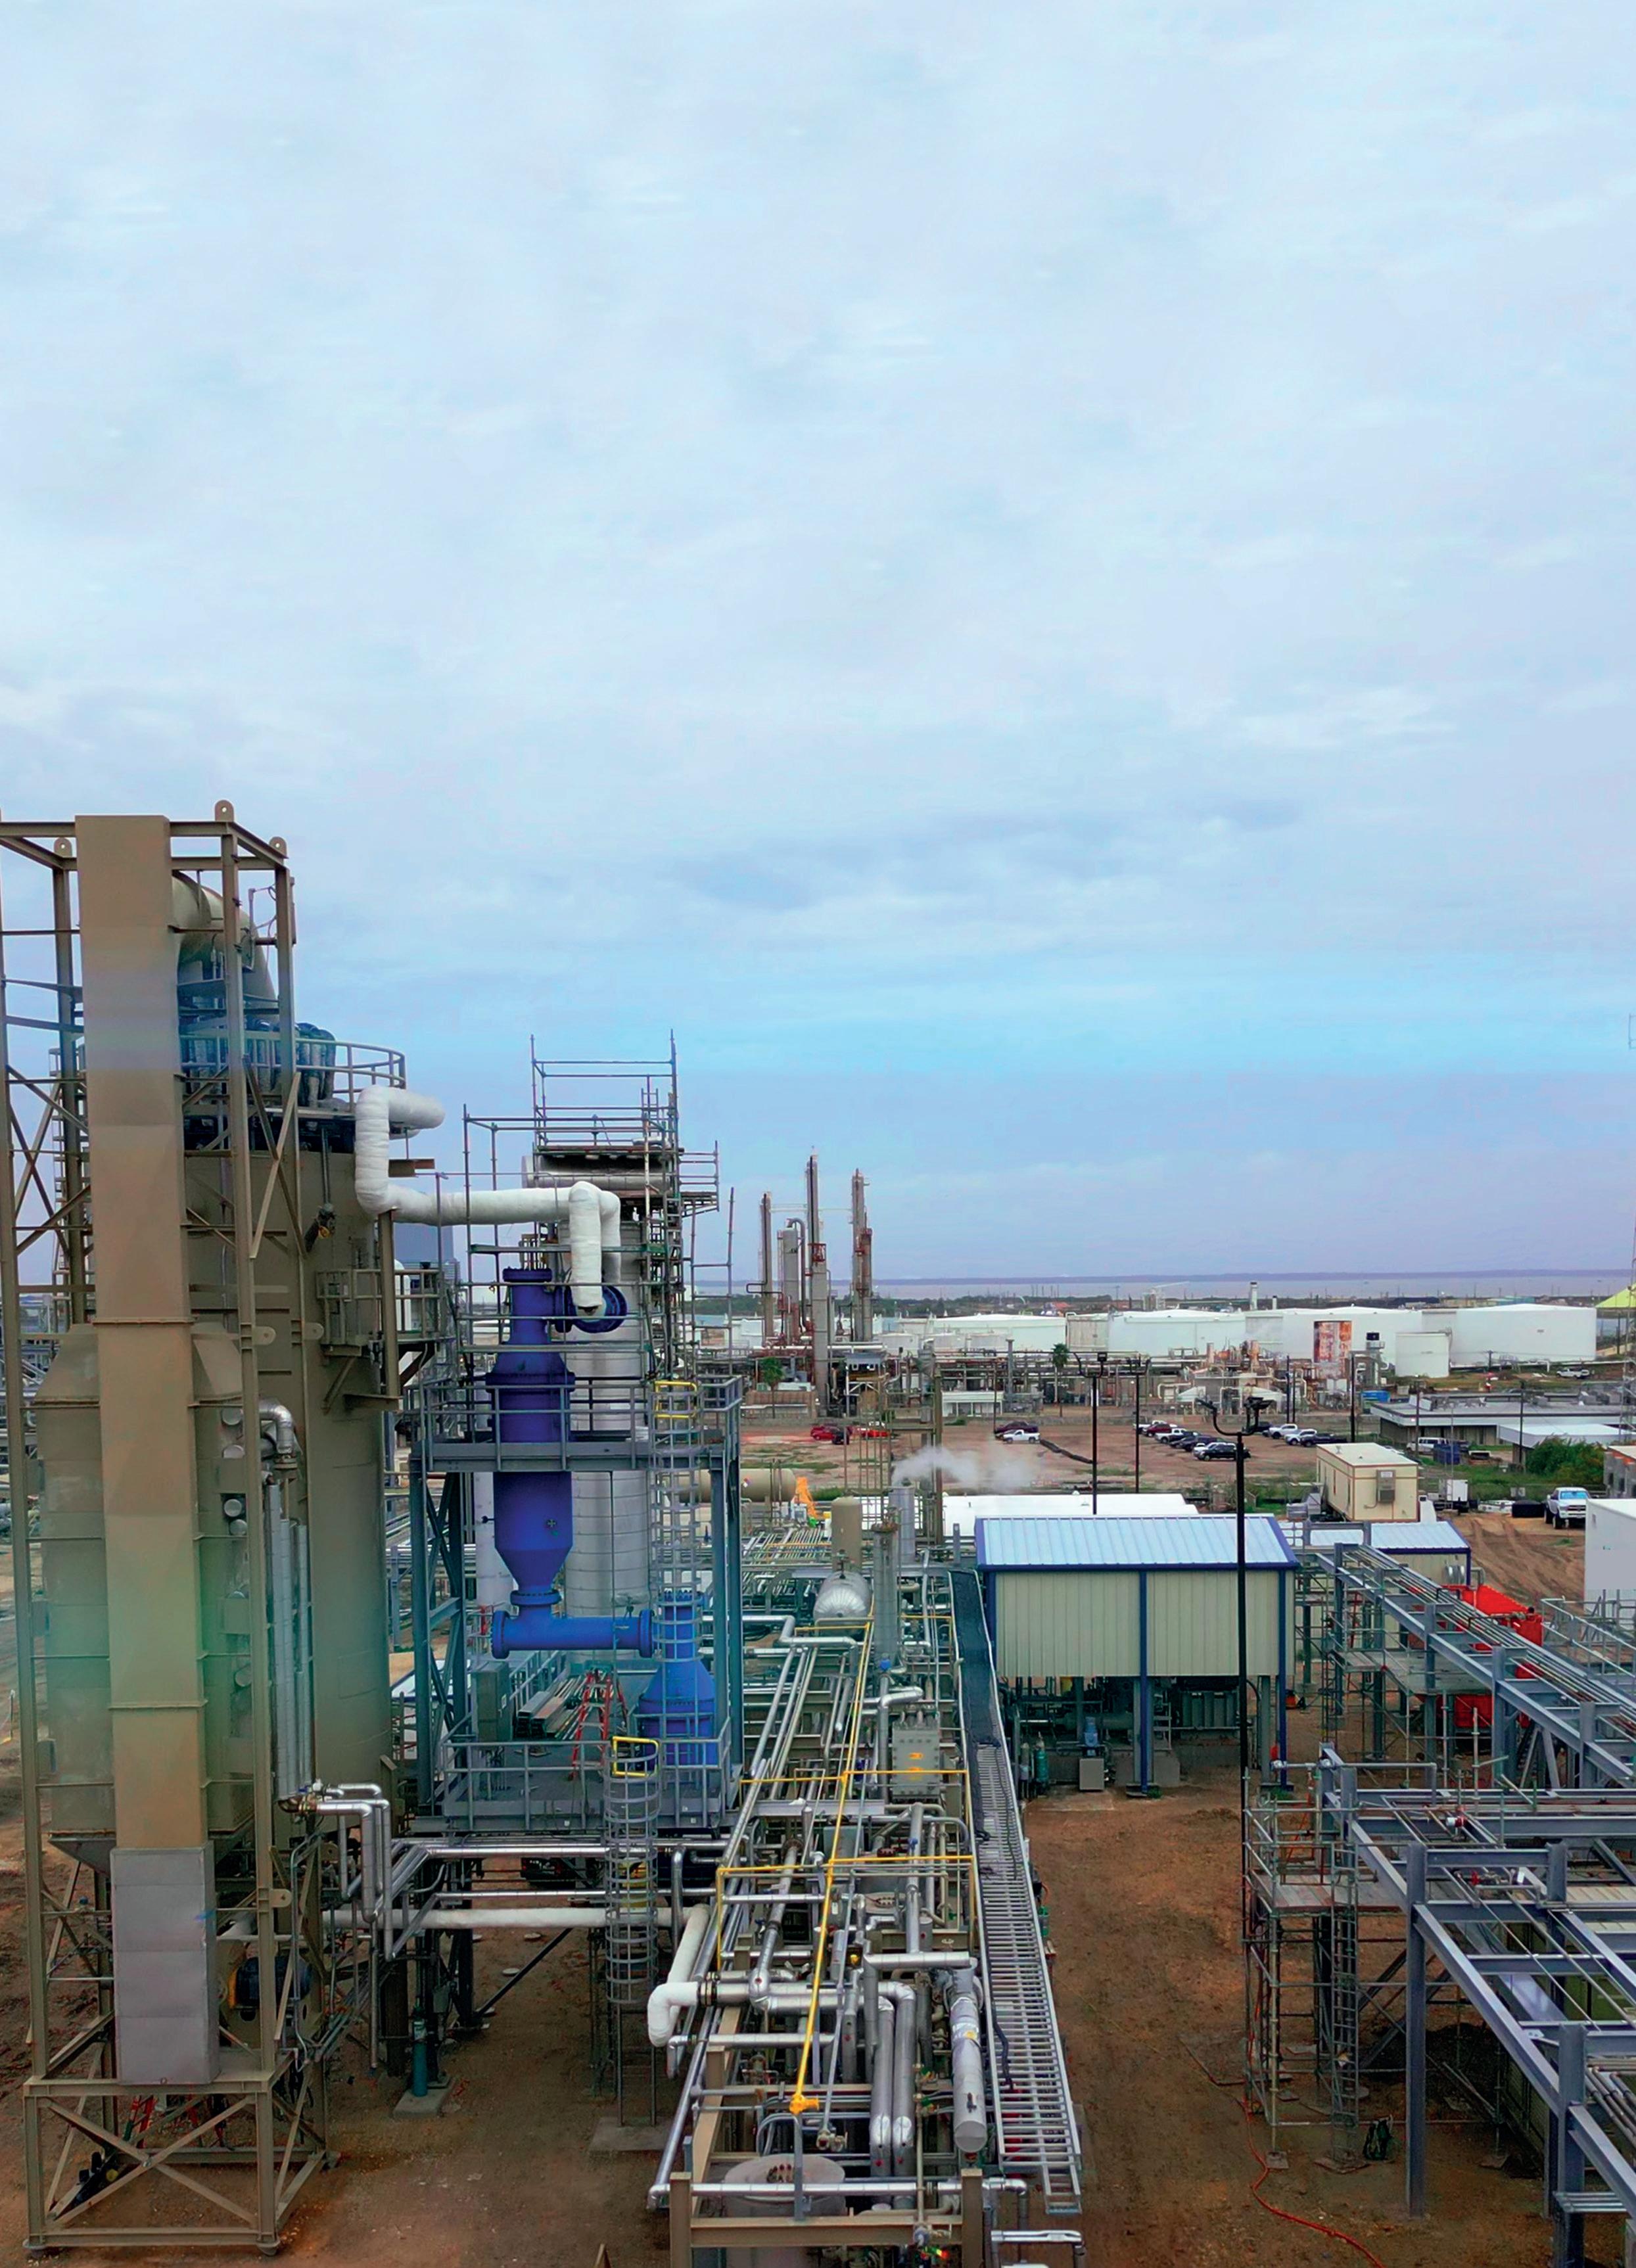
In 2023, Infinium began operations of its Project Pathfinder production facility in the Port of Corpus Christi, Texas, US.
The site is the first eFuels production facility in the world to produce commercial volumes of fuels that are being shipped to customers today.
The plant is strategically located in Corpus Christi largely because the necessary feedstocks for the eFuels –notably water, waste CO 2 and renewable energy – are plentiful in the area.
Waste CO 2 is captured from Howard Energy Partners, a Texas-based midstream energy provider with operations nearby. The capture of this CO 2 not only prevents its release into the atmosphere, but also gives it a new, meaningful purpose as a necessary feedstock.
Power is sourced from local wind and solar assets, and water is readily accessible and recycled as part of Infinium’s production processes.
With plentiful feedstocks and strong business relationships, it has been possible to bring the Project Pathfinder plant online in record time.
The project is specifically producing sustainable alternatives to fossil-based diesel and naphtha, the latter of which is commonly used in manufacturing chemicals and plastics. Infinium eDiesel and eNaphtha are considered ‘drop-in’ fuel alternatives, meaning they can be used immediately with no changes to engines, machines, or other processes using the conventional fuels and feedstocks today. Today’s trucks, planes, ships and manufacturing equipment can run on eFuels with no costly changes required.
In 2023, Amazon was announced as Infinium’s first commercial buyer for eDiesel, and the retail giant plans to use the fuels in its trucking fleet.
In August 2024, Infinium announced that European-based polyolefins manufacturer, Borealis, had begun using eNaphtha in its
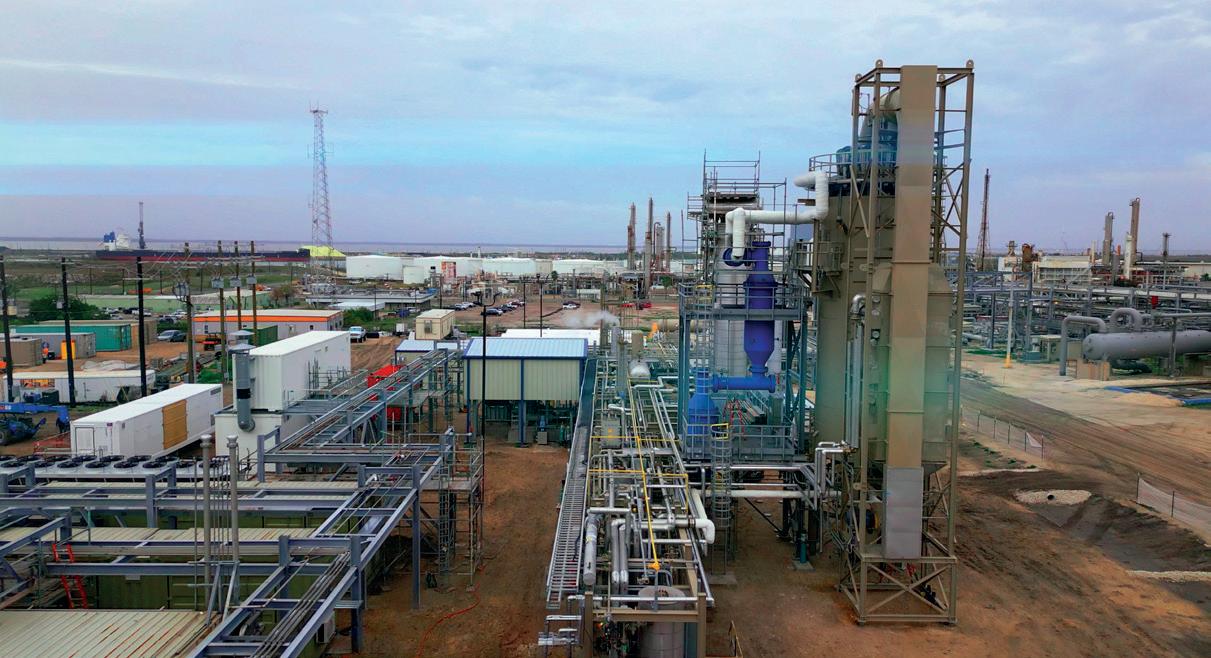
Figure 4. The Project Pathfinder site is located in Corpus Christi, Texas, US, and uses water, waste CO2 and renewable energy to produce eFuels.
operations in Finland to help create low-carbon plastic options. Borealis is helping its end customers – which include manufacturers in a wide range of consumer goods industries ranging from apparel to medical devices to electronics – to decarbonise their supply chains with these more sustainable chemical alternatives.
Infinium has finalised plans and investment for a second eFuels production site in Texas. Codenamed ‘Project Roadrunner’, the plant will be based in West Texas and will primarily produce eSAF – ultra-low carbon sustainable aviation fuel (SAF).
American Airlines recently announced its commitment to purchase the eSAF from the Roadrunner site, bolstering visibility for the new class of fuel and accelerating the airline’s progress toward its sustainability goals. Breakthrough Energy Catalyst, the climate investment fund founded by Bill Gates, committed a US$75 million investment in Roadrunner earlier this year.
With additional deals underway and the growing demand for eFuels, Project Roadrunner is predicted to produce 10x the volume of eFuels currently being manufactured at the Project Pathfinder site.
A dozen other production sites are under consideration globally, with a goal of producing eFuels in as many markets as possible where renewable power, CO 2 and water are easily accessible.
Like any breakthrough innovation, widespread adoption of eFuels will take time. Costs are naturally higher than traditional fossil fuels today, but government regulation and corporate sustainability mandates will continue to drive interest and investment in these ultra-low carbon fuels.
The UK recently passed new regulatory requirements mandating increased percentages of SAF to be used by airlines using UK airports. Policy experts predict other countries will continue to further tighten their own regulations and require the use of higher volumes of sustainable fuels such as eSAF to help curb growing greenhouse gas emissions.
While much work remains, confidence in eFuels will continue to grow as the new standard for sustainable fuels are enforced globally. With production scaling and more deals in the works, Infinium is racing to expand its operations footprint globally. It is a complex technology that took years to develop – but one which ultimately can help stop the dangerous effects of climate change and benefit generations to come.

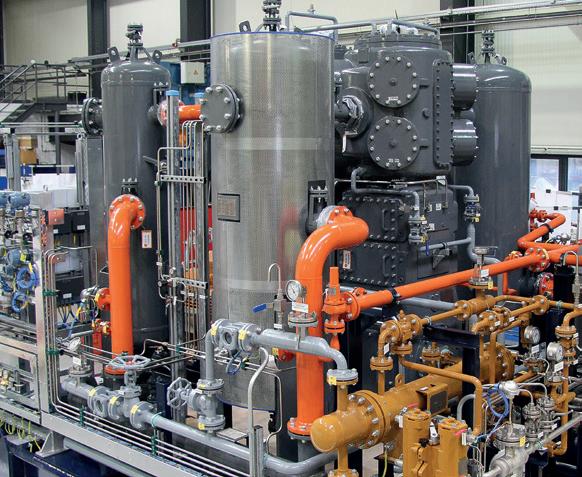


Fabio E.G. Ferrari, Luca E. Basini, Leonardo Falbo and Edoardo Disarò NEXTCHEM Tech, Italy, explain the opportunity for valuable hydrocarbons to be utilised from the flaring of associated petroleum gas (APG).
The ‘BP Statistical Review of World Energy’ in 2017 estimated that global natural gas production reached 3.68 trillion m 3 , as the growing industrial energy demand has led to an unprecedented acceleration in the production of hydrocarbons from oil and gas wells that has significantly increased the release of greenhouse gases. 1
The free release and flaring of the associated petroleum gases (APGs) produced during extraction activities is one of the major sources of emissions. 2 Approximately 143 billion m 3 of natural gases are flared annually, producing approximately 377 million t of CO 2 that make up around 1 wt% of world CO 2 emissions.
Over 17 000 flares are continuously operating at refineries and extraction wells, releasing – along with CO 2 – a variety of other harmful substances that might be better managed and exploited.
The biggest contributors to APG flaring are Russia, Iraq, Iran, the US, Algeria, Venezuela, and Nigeria, which together produce about 40% of the world’s oil per year, burning the 65% of the overall global APG produced. 3
APGs are typically made of methane and volatile low-molecular-weight alkane molecules: hydrogen sulfide (H 2 S), carbon dioxide (CO 2 ), and nitrogen (N 2 ). Multiple causes contribute to the global approach to flaring APG, substantially wasting a valuable source of hydrocarbons.
Gas markets and the point of production are often far away from one another, therefore limiting the opportunity to sell the extracted lower quality gas, especially in areas where there is a lack of dedicated transport infrastructure.
Moreover, the gap between oil prices and the value of gas, especially due to the presence of contaminants, is another critical factor that makes the option of burning APG more attractive than selling it. 4
The most common technical options available for exploiting APG can be summarised as follows:
n Re-injection into the well, to dispose the sour gas or to enhance oil recovery.
n Power generation, through electrical generators or combined cycles.
n Purification and compression of dry gas.
n Processing APG to liquefy the gas into LPG.
n Converting APG to naphtha, kerosene and diesel through Fischer-Tropsch synthesis.
n Converting APG in methanol or ammonia.
Multiple studies have been carried out in the main geographical locations where extraction wells are located 2 and the results show a convergence towards
the same solutions, typically conditioned by the existing reservoir volume (Table 1).
Even if the main component in APG is methane (approximately 70 - 90 wt%), the stream often contains CO 2 that might strongly affect the possibility to easily manage and convert the hydrocarbon feedstock, unless the reacting system is specifically designed to treat this component. 5
The primary impact of the high CO 2 content is the additional criticality in increasing the feedstock inlet temperature and the high possibility to have soot formation within the catalytic bed, therefore compromising its operation if the system is not designed to manage it.
If the feedstock capacity is sufficiently large, the possibility to separate the CO 2 component from the hydrocarbon content might become more technically feasible and economically viable, for example through cryogenic distillation, especially if this stream can be used for enhanced gas recovery. Unfortunately, in most of the extraction wells, APG capacity is large enough to render the simpler solutions inapplicable (e.g. separation through membranes), but not large enough to allow implementing the most efficient techniques.
This characteristic therefore strongly pushes the market in the direction of flaring APG.
APG composition contains a variety of contaminants, especially sulfuric components, that compromise its direct utilisation in conversion processes, especially if catalytic.
Therefore, the need to purify the gas before its utilisation is another major element that may dramatically increase the production cost associated with APG commercial use. To mitigate the impact of this aspect, the solution has often been to utilise the spare capacity of existing processing plants, for example in sour gas treatment facilities. But this possibility is so limited that in Russia, the high contaminant content is one of the reasons for the high level of gas flaring at oilfields. 6
Multiple algorithms have been proposed to identify the least expensive solution to process the APG.
The results of these studies often lead to options that provide the highest conversion (e.g. ‘deep conversion’) 6,7 , because the possibility to maximise the value from the hydrocarbon content provides better economic returns.
Another approach is to examine and test a technological path that provides the best CO 2 emission reduction and the highest energy efficiency.
According to NextChem Tech’s experience at looking at both approaches, there is no preferred product that can be considered the best option. The off-taking of plant output shall always remain the main

driver, counterbalanced with the possibility of minimising the plant’s carbon footprint and its CAPEX requirement.
According to this approach, the production of higher hydrocarbons through Fischer-Tropsch reaction might become less favoured and methanol synthesis can be identified as an effective/simpler solution to gas flaring. 8
NextChem Tech’s approach follows a simplified scheme to identify the solution that can lead to better results:
n Analyse the main logistic context criticalities at the emission point.
n Identify the required product by finding the off taker (e.g. methanol, fuels, ammonia).
n Evaluate the available utilities (i.e. steam, oxygen, hydrogen availability).
The listed points might seem trivial, but they are essential to carving out a more effective implementation that adopts the right technical solution and avoids increasing the system’s complexity with an unnecessary holistic approach.
As discussed in the previous paragraphs, APG’s CO 2 content can be considered one of the main criticalities in finding a solution to process and valorise the stream.
NextChem Tech offers the possibility to use a different technology to convert APG to syngas using its proprietary NX CPO Reactor TM , which performs a
catalytic partial oxidation (CPO) of the hydrocarbon components.
The unique feature of this technology is that users enjoy the advantages of the conventional oxidation reactions (e.g. POx or ATR), but its performance is not affected by the high CO 2 content, because it has a very low residence time in the reactor.
Methanol production has been the subject of many studies, thanks to the ability to use the reaction of CO 2 activation to directly convert the CO 2 molecule into a valuable product.
Of course, the conversion is affected by a low efficiency due to the partial consumption of hydrogen to produce water as side product. However, the need to utilise this molecule has been the target of recent studies in view of the more stringent GHG emissions regulations.
The result is that CO 2 consumption is higher when its utilisation is present both in the reforming step and in the methanol synthesis step of methanol process, therefore contributing together to CO 2 reduction.
According to those studies, the highest net CO 2 reduction (NCR) value is 0.23 kg CO 2 /kg CH 3 OH, which can be reached using a configuration with the autothermal reformer (ATR), fed with a feedstock composition that is 30 mol% of CO 2 and 70 mol% of methane. 9
The composition is in line with the available and typical ones for APG, while the interesting results on ATR can be furtherly operationally improved by using CPO as an alternative for syngas production.
NX CPO TM technology is based on a specific CPO reactor where, due to the catalyst located inside the reactor, the following reactions occur:
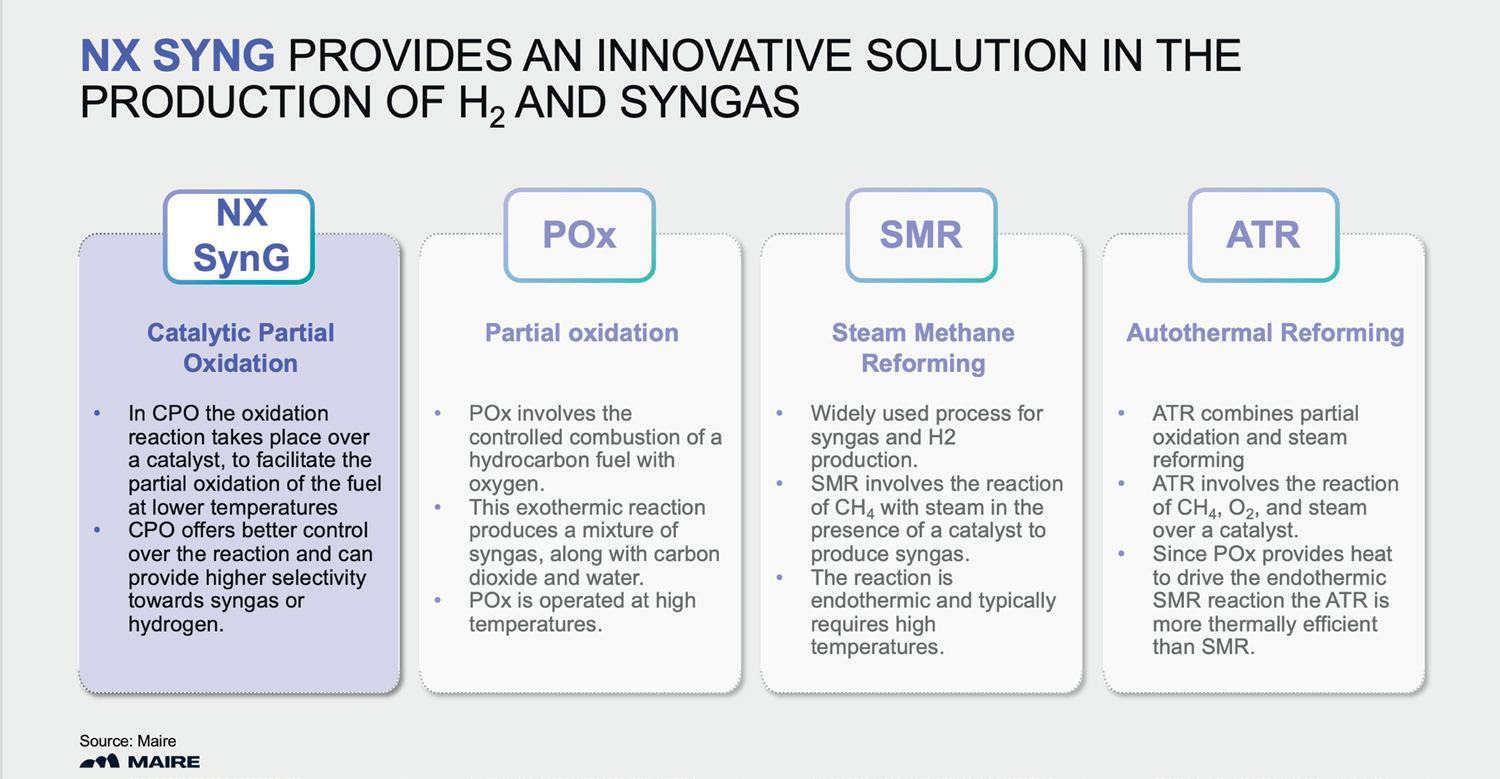
During stationary conditions, contribution of reactions (2) and (3) is predominant.
The exothermic reaction of total oxidation (1) occurs in the first section of catalytic bed, reaching a temperature higher than 750°C, where the partial oxidation (2) is both thermically and kinetically favoured. These reactions consume the oxygen included inside the reagent mixture and increase the temperature in some sections of the catalytic bed up to 1200°C, while the temperature of


the gas phase remains lower. In the second section of the catalytic bed, other reverse water gas shift and steam-CO 2 reforming reactions occur, adjusting the composition of the produced syngas.
The methane and the other hydrocarbons are hence converted into a mixture of CO, CO 2 , H 2 and H 2 O.
Carbon conversion is higher than 97% and the outlet temperature is typically higher than 950°C.
The NX CPO TM reactor includes internal refractory layers, allowing it to operate in nearly adiabatic conditions, and it is designed for promoting heterogeneous reactions by mixing the gaseous reactants and flowing them on extremely hot catalytic surfaces. Chemical reactions remain confined inside a thin (<1 mm) solid–gas inter-phase zone surrounding the solid catalytic particles for nearly 10 -6 s at high temperature, while the gaseous phase temperatures remain lower.
NX CPO TM intrinsic technical characteristics provide the following advantages, improving the numbers when compared to the conventional ATR technology:
n Higher feedstock flexibility, because the very short contact time inside the reactor does not allow for undesired side reactions, therefore demonstrating a higher tolerance on CO 2 content in the feedstock.
n Lower inlet temperature requirement (e.g. 400°C), therefore offering the opportunity to avoid a fired heater upstream NX CPO TM reactor.
n Higher control on the outlet syngas composition, by tuning the operating variables (e.g. steam/carbon or oxygen/carbon ratios) at reactor inlet.
Due to the NX CPO TM reactor’s small size, the system design is very compact compared to conventional reforming technologies.
This characteristic has led NextChem Tech to design modular pre-built and skid mounted plants that enable a drastic reduction of on-site activities, therefore making it possible to use them even in remote areas where APG is produced.
To qualify the advantage in converting the hydrocarbon content in APG, it is possible to analyse the following case study where a conventional gas from a well is treated.
The composition of the gas is as follows:
n C1: 40 vol.%
n C2: 5 vol.%
n C3: 3 vol.%
n C4: 1 vol.%
n C5+: 2 vol.%
n CO 2 : 45 vol.%
n N 2 : 4 vol.%
A heavier hydrocarbon content may require the addition of a pre-reforming section, but the high CO 2 concentration does not compromise the possibility to implement a CPO reactor that can be used to produce hydrogen with a dedicated pre-combustion
carbon capture section to separate the CO 2 upstream of a pressure swing absorption unit.
This decarbonised hydrogen can be used to produce ammonia first, and then urea that will be consuming half of the overall CO 2 in the process (where 37 vol.% of the CO 2 is the one in the feedstock, while the rest is generated by the hydrocarbon content conversion).
For 15 000 Nm 3 /h of feedstock with the above listed characteristics, the resulting capacities can be calculated as seen in Table 2.
This scenario (Table 2) foresees an excess of CO 2 (approximately 9000 Nm 3 /h) that can be used for enhanced oil recovery at the well after compression. As an alternative in some specific geographical locations, it is possible to consider increasing the overall system capacity, including 130 MW of electrolysis, to produce the additional hydrogen necessary to convert all the available CO 2 , therefore reaching a capacity of approximately 1150 tpd of decarbonised urea.
The chemical conversion of wasted gas resources into other products such as ammonia, liquid fuels and/or methanol represents a substantial market that will make a strong contribution to the improvement of the sustainability of the exploitation of the APG that is extracted from hydrocarbon reservoirs.
The NX CPO TM reactor technology is a valuable alternative that can offer the opportunity to use skid mounted and transportable plants at oil and gas wells to valorise APG and contribute to the reduction of the GHG emissions associated with its flaring.
1. ‘BP Statistical Review of World Energy’, BP, (June 2017).
2. MANSOOR, R., and MUHAMMAD, T., ‘Recent Developments in Natural Gas Flaring Reduction and Reformation to Energy-Efficient Fuels: A Review’ Energy & Fuels, 35. 10.1021/ acs.energyfuels.0c04269, (2021).
3. FARUOLO, M., GENZANO, N., MARCHESE, F., and PERGOLA, N., ‘A Tailored Approach for the Global Gas Flaring Investigation by Means of Daytime Satellite Imagery’, Remote Sens., vol. 14, no. 24, p. 6319, (2022).
4. LABEYRIE, H., ROCHER, A., ‘Reducing Flaring and Improving Energy Efficiency: An Operator, in: SPE International Conference on Health, Safety and Environment in Oil and Gas Exploration and Production’, Society of Petroleum Engineers, https://doi. org/10.2118/126644-MS, (2010).
5. AREGBE, A., ‘Natural Gas Flaring – Alternative Solutions’, World Journal of Engineering and Technology, 5, 139 - 153. 10.4236/wjet (2017).
6. GOMES, A.C.S., SHCHERBA, V.A., VOROBYEV, K.A., CHEKUSHINA, T.V., ‘Analysis of Associated Petroleum Gas (APG) Utilization in Russia and Abroad’, In: RADIONOV, A.A., ULRIKH, D.V., TIMOFEEVA, S.S., ALEKHIN, V.N., GASIYAROV, V.R. (eds), ‘Proceedings of the 5th International Conference on Construction, Architecture and Technosphere Safety. Lecture Notes in Civil Engineering, vol 168. Springer, Cham. https://doi.org/10.1007/978-3-03091145-4_42, (2022).
7. RIADINSKAIA, A., and CHEREPOVITSYNA, A., ‘Associated Petroleum Gas Utilization: New Opportunities for the Oil and Gas Complex in a Circular Economy’, E3S Web of Conferences. 378. 06006. 10.1051/e3sconf/202337806006, (2023).
8. SALAHUDEEN, N., RASHEED, A. A., BABALOLA, A., and MOSES, A.U., ‘Review on technologies for conversion of natural gas to methanol’, Journal of Natural Gas Science and Engineering, vol. 108, 1875-5100, (2022).
9. CHEN, Y.H., WONG, D.S.H., CHEN, Y.C., CHANG, C.M., and CHANG, H., ‘Design and Performance Comparison of Methanol Production Processes with Carbon Dioxide Utilization’, Energies, 12, 4322. https://doi.org/10.3390/en12224322, (2019).
Environmental concerns are at the forefront of processing operations with refineries and petrochemical plants facing mounting pressure to reduce their carbon footprint. With fired heaters emitting an estimated 400 to 500 million tpy of carbon dioxide (CO2) and accounting for at least 73% of average refinery CO2 emissions, the industry is searching for cost-effective solutions to meet increasingly stringent government targets. The good news is that advanced technologies are available that reduce emissions and improve energy efficiency and plant profitability.
Fired heaters represent the most significant running cost in refineries and petrochemical sites. Even a minor inefficiency of 1 - 2% in these heaters can generate additional fuel consumption worth US$1 million over a year and lead to millions in lost revenue. This high fuel consumption directly translates to elevated emissions levels, creating a two-fold challenge for operators: maintaining productivity while reducing environmental impact.
Integrated Global Services (IGS) has developed a comprehensive approach to tackle both Scope 1 (direct plant production) and Scope 3 (indirect, including product use by consumers) emissions. The solutions are designed to be implemented within existing
turnaround cycles, offering dramatic reductions in CO2 and NO x emissions, while enabling refineries to operate at full capacity.
For Scope 1 emissions, IGS provides four proprietary fired heater efficiency technologies, which focus on improving both radiant and convection section efficiency of fired heaters.
Key benefits include:
n Fuel savings of 2 - 15% depending on the heater type (see Table 1).
n CO2 reduction of 2 - 15%.
n NO x reduction of 5 - 30%.
n Typical payback period of 2 - 12 months.
n Implementation time of 5 - 15 days per asset during scheduled turnarounds.
A catalytic reforming unit (CRU) converts low-octane, straight-run naphtha fractions, particularly heavy naphtha, into a high-octane, low-sulfur reformate, which is a major blending product for gasoline/petrol.
The process is endothermic and is carried out by feeding a naphtha and hydrogen mixture to a furnace, where it is heated in a series of fired heaters to the desired temperature, 450°C to 520°C

Larry Emch,
Integrated Global Services (IGS), USA, presents advanced solutions for reducing emissions and improving process efficiency at refineries.
(840° to 965°F), before passing through a series of reactors. Catalytic reformer tube coatings help to maximise process efficiency.
In a high temperature environment, steel alloy process tubes will oxidise and scale will develop (Figure 1). This oxidation scale layer acts as an insulator and will lead to a decrease in heat transfer as the scale increases in thickness. To compensate for the insulating effect of the scale, the heater is subjected to excessive fuel firing.
The resulting increased temperate promotes the development of further scale. As oxidation continues,
tube metal is consumed, leading to a decrease in tube wall thickness, which shortens the tube life.
Cetek thin film coatings for process tubes prevent oxidation and scale formation for approximately two turnarounds.
This thin-film coating maintains the process tube in a like-new condition, maximising conductive heat transfer to the process and increasing radiant section efficiency. Likewise, by stopping oxidation, tube metal loss is prevented.
The emissivity of typical refractory linings in fired heaters ranges from 0.45 - 0.65. When radiant energy encounters these refractory linings, much of the energy is reflected back and is absorbed into the flue gas and carried out of the radiant section, into the convection section and out the stack, with the majority never reaching the process.
High emissivity coatings for refractory surfaces increase surface emissivity to 0.92, a near black body. Radiant energy is absorbed by the high emissivity lining and reradiated across a broad spectrum. The reradiated energy is able to penetrate the flue gas and be absorbed by the process, increasing radiant section efficiency. This coating, standalone or complementary to the reformer tube coating, can further increase radiant efficiency.
A refinery reported that excessive process tube scale on its catalytic reformer was creating a limitation. IGS visited the site to conduct an infrared inspection of the heaters. After reviewing the infrared images and the data supplied by the refinery’s process engineer, a fired heater expert recommended both high emissivity coatings for process tubes and refractory surfaces for all heater cells. The results of this evaluation are summarised in Table 2.
With the predicted fuel savings and capacity increase from the application of high emissivity CRU tube and refractory coatings, a payback period and return on investment was calculated over the life of the coating.

Keeping the same production rate, the coating would produce over US$2.9 million in fuel savings. When keeping the same firing rate and increasing throughput, over US$10.5 million in additional profit could be realised from the increase in production.
After the catalytic reformer was returned to service and conditions in the heaters were similar to the pre-evaluation conditions, a fired heater study was completed to measure the actual benefits of the ceramic coatings. The actual increase radiant efficiency of 10% was achieved.
Taking the cost of the project and the benefits into consideration, the payback was less than one year. These results underscore the significant impact that advanced technologies can have on both emissions reduction and operational efficiency.
In addressing Scope 3 emissions, high velocity thermal spray (HVTS) technology is an innovative approach that is proving valuable in lowering the cost of fuel conversion projects by extending the life of existing equipment and upgrading its capabilities.
HVTS technology is particularly relevant in the context of the energy transition, where it can:
n Decrease CAPEX in biofuel conversion projects.
n Address challenges in new energy exploration, such as unexpected corrosion issues in carbon capture and storage (CCS) projects.
n Upgrade the metallurgy of existing equipment to withstand new operating conditions in renewable fuel conversions.
An example is a project where HVTS was used to upgrade a low-pressure separator for renewable diesel conversion. The solution cost half as much and took only a third of the time compared to traditional weld overlay, while preserving and converting the metallurgy of existing equipment.
Beyond these core technologies, additional solutions exist to enhance efficiency and reduce emissions:
IGS has developed a comprehensive engineered solution to eliminate selective catalytic reduction (SCR) fouling, which can lead to insufficient NO x reduction, excessive ammonia consumption, and reduced catalyst life. The approach includes emergency relief
measures, long-term prevention strategies, and restoration of SCR performance, resulting in up to 35% improvement in NOx reduction.
IGS’s Tube Tech robotic system can remove 90 - 95% of fouling in convection sections without causing refractory damage. In one case study, this resulted in:
n 14.0 million Btu/hr fuel saving (1.7%).
n 6570 million tpy CO2 reduction.
n 130°F stack temperature reduction.
n 13 300 lb/hr steam gain.
As the industry continues to find solutions to the challenges of maintaining productivity and reducing environmental impact, solutions like those outlined will play an increasingly crucial role. Cost-effective, efficient and proven technologies will enable refineries to meet stringent emissions targets without sacrificing operational capacity or profitability.
By taking a holistic approach – addressing both direct (Scope 1) and indirect (Scope 3) emissions – IGS positions itself as a valuable partner for refineries and petrochemical plants worldwide. As regulations tighten and pressure for cleaner operations intensifies, the ability to implement comprehensive solutions will become a competitive advantage for forward-thinking operators. Adaptability will be crucial as the energy sector continues to evolve towards cleaner alternatives.


Rhys Jenkins, Servomex, UK, explains how tunable diode laser (TDL) gas analysis technology supports more efficient combustion for cleaner industry.
In today’s era of heightened environmental awareness, the need to reduce the industrial emissions of carbon dioxide and other greenhouse gases is more pressing than ever. With the knowledge that air pollution harms our health and the planet, industrial operators worldwide are looking to operate in a more environmentally responsible and socially conscious way.

For many, this includes reducing carbon emissions, which contribute to respiratory illness and climate change.
Achieving sustainable development and moving rapidly towards a carbon net-zero future are among the most important challenges confronting industrial operators today. Central to these efforts are clean air strategies, underpinned by advanced and reliable gas analysis technologies, which play a crucial role in mitigating harmful emissions from industrial processes.
This situation has put suppliers of gas analysis technology at the forefront of the battle for a cleaner, more productive world. By delivering innovative solutions, gas analysis suppliers can empower their clients to reduce global resource consumption and decrease atmospheric pollution.
At the same time, ongoing research and development initiatives are bolstering clean air and hydrogen projects, which are pivotal to efforts to reduce global carbon footprints and industrial emissions.
As technology develops, gas sensors and analyser systems are likely to play an increasingly integral role in supporting low-carbon and carbon-free industries. These tools, deployed throughout various industrial processes, will not only enhance operational efficiency but can also significantly contribute to reducing emissions, promoting a cleaner environment.
Controlling combustion efficiency is a key part of any strategy that seeks to ensure cleaner air. By doing so, the level of key pollutants is lowered, fuel consumption is reduced, and safety is improved.
At present, there are limited alternatives to the combustion process as a method of creating the high temperatures needed for many hydrocarbon processing applications. This means that achieving an efficient reaction is crucial.
In the combustion reaction, fuel is mixed with oxygen (O 2 ) (usually from air) at the burner and ignited to create heat energy for use in the process. Typically, this reaction consumes a significant amount of fuel, creates potential safety hazards, and generates harmful emissions.
Before the development of reliable continuous gas analysis, fired heaters were run in conditions of high excess air. This was inefficient and increased the level of fuel consumption, but it did ensure that unsafe, explosive conditions were avoided.
A further disadvantage, particularly from the environmental perspective, is that excess O 2 combines with nitrogen and sulfur from the fuel to produce unwanted emissions such as oxides of nitrogen (NO x ) and sulfur (SO x ).

With the development of gas analyser technology, it became possible to accurately measure both oxygen and combustibles – principally carbon monoxide (CO) – within the combustion reaction.
As a result, the air-to-fuel ratio can be optimised to control the reaction and reduce fuel consumption. In turn, this also reduces emissions of NO x , SO x , CO, and carbon dioxide (CO 2 ).
On large-scale furnaces, such as the bigger ethylene crackers, it has become common practice to use multiple oxygen analysers for combustion monitoring. For some time, there has been the understanding that, on these larger processes, there are different zones of combustion, with the effects of layering and convection providing different concentrations of gases along the length of the furnace.
Tunable diode laser (TDL) sensing technology measures across the stack, providing an average result for gas concentration rather than a
single-point result. This ensures a better overall picture of conditions within the fired heater. However, since TDL sensing is highly specific to the gas being measured, separate analysers are required for O 2 and CO.
TDL analysers use a single-line ‘monochromatic’ spectroscopic technique that offers a continuous and fast in-situ measurement which avoids optical cross-interference from other gases, with up to a 12-month calibration interval, and the avoidance of optical cross-interference from other gases.
The TDL system consists of a laser light source, transmitting optics, an optically accessible absorbing medium, receiving optics and detector(s).
The signal information is held in the gas absorption line shape, which is obtained by scanning the laser wavelength over the specific absorption line. This causes a reduction of the measured signal intensity, which is detected by a photodiode and used to determine the gas concentration and other properties.
Some TDL analysers, such as those developed by Servomex, use a second harmonic detection (2f) modulation technique that delivers greater accuracy, sensitivity and reliability of measurement, especially in low ppm-level measurements.
This high-performance technology enables industrial operators to achieve the measurements required to control process efficiency and reduce emissions, with the added benefits of ease-of-use and low maintenance requirements.
In recent years, the knowledge that a fuel-rich situation – one where CO levels are high – is a potential source of flame-out leading to the risk of explosions has caused the measurement of CO to move from a supporting combustion measurement to a key safety measurement.
This has also been driven by the increasing use of low-NO x burners, which are highly effective at reducing unwanted emissions, but run with a cooler, larger, and more complex flame which is inherently less stable than older, high-NO x -producing burners.
Flame instability leads to a requirement for improved flame-out detection, and customers who use natural gas as a fuel have turned to TDL analysers as a key part of their safety system.
TDL measurements for CO show a much more effective performance compared with alternative analysis techniques such as thick film sensors. A faster speed of response and superior sensitivity make TDL technology ideally suited to both efficiency and safety monitoring.
A TDL analyser can be configured to measure methane (CH 4 ) and CO at the same time, and this highly specific measurement also provides more detailed data and analysis of conditions inside the furnace.
The cross-stack measurement allows TDL analysers to detect any developing flame-out situation quickly,
To prevent oily water from penetrating the soil and contaminating groundwater, there is only one solution: API 421 refurbishment
Upgrade your basic separation system with the Veolia API 421 Separator
• Improved Safety: Reduce hazardous vapours using the fixed light cover
• Extended Lifespan: Prolong your plant’s operational life
• Regulatory Compliance: Meet current industry standards and requirements
• ATEX Certified: Fully compatible with hazardous environments
• Energy Efficient: Low power consumption for cost-effective operation
• Quick Availability: Rapid delivery times for standard product range Contact us for more information


across the whole process. As it is a light-based technology, with no sample extraction, TDL sensing delivers a rapid response to changes in the boiler condition, typically within a few seconds.
This speed is vital to safety monitoring, as a boiler can shift from safe to unsafe conditions very quickly. The faster the analyser can respond, the more time the operator has to take corrective action.
Additionally, the non-contact nature of TDL sensing means that it is not seen as a potential source of ignition in the presence of flammable gases, enhancing safety without the requirement for a flame arrestor, such as those used by other sensor technologies.
Servomex’s SERVOTOUGH Laser 3 Plus Combustion TDL analyser can be configured to measure either O 2 or CO. It can also be configured for a joint measurement of CO and CH 4 and provides a rapid-response measurement for safety in natural gas-fired heaters and boilers.
The analyser’s compact design means it can be installed, configured, and calibrated by just one person, with a multi-directional mounting assembly that ensures precision alignment from the outset. This combines with the quick-release mechanism to help make reinstallation simple after maintenance.
A built-in line lock cuvette system helps to ensure measurement reliability, which is particularly key to process control and safety applications.
In the absence of the gas of interest, older-generation TDL analysers would drift to measure a nearby, incorrect absorption line instead. For example,
a CO analyser that had no CO present to measure might pick up an adjacent water line and deliver an incorrect reading.
With the line lock cuvette system, the analyser has a secondary detector targeted on a cuvette filled with the required gas. This means that the analyser always has a known target gas to sense, enabling the main detector to stay locked-in, delivering an accurate measurement even if the measured gas is zero.
The line lock cuvette system requires no maintenance and has built-in self-diagnostics to monitor the concentration within the cuvette, triggering an alarm if this concentration is not detected.
For applications where incorrect measurements may lead to heavy fines for non-compliance, the line lock system provides confidence that the measurement is stable and secure.
Gas analysis is essential to creating cleaner plant and refinery operations. It also supports the rapidly emerging trends in global industry, such as the desire for greater process optimisation, the move towards cleaner fuels, and the achievement of higher product yields.
Meeting this wide range of objectives requires an equally wide range of sensing technologies, so partnering with an expert gas analysis supplier offering a diverse selection of technologies is vital to ensure the best-fit and most cost-effective solution for each application.
When developing partnerships with suppliers of gas analysers and other key systems, it is also important to look at the sustainability of those organisations to ensure they have a demonstrable and measurable commitment to operating responsibly.

Service support is another key consideration in maintaining gas analysis systems at peak performance to ensure that plant operations remain as clean as possible.
By combining all these elements into a coherent, connected clean air strategy supported by accurate and reliable gas analysis, plants and refineries can fully address the impact of their operations on the environment, helping to create a better, cleaner world.


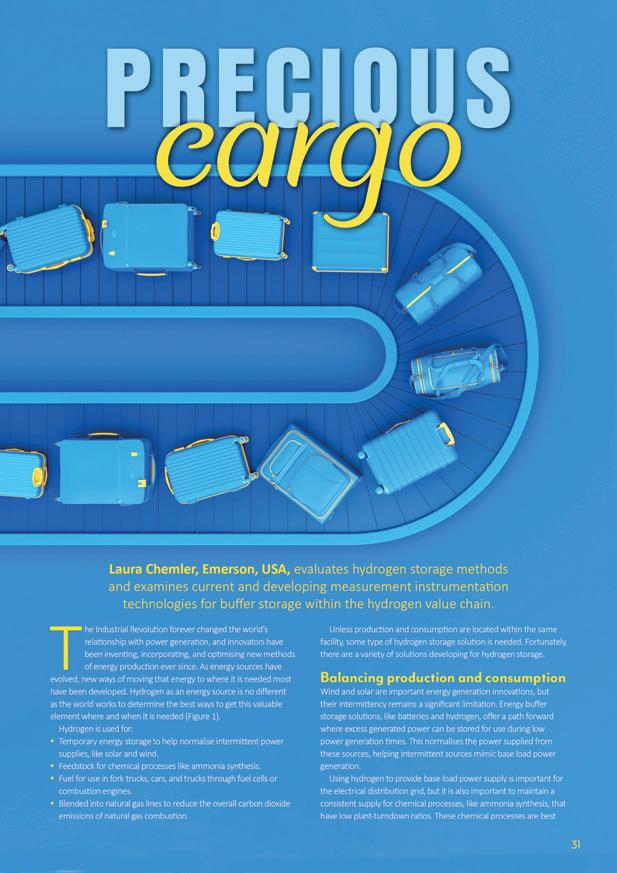

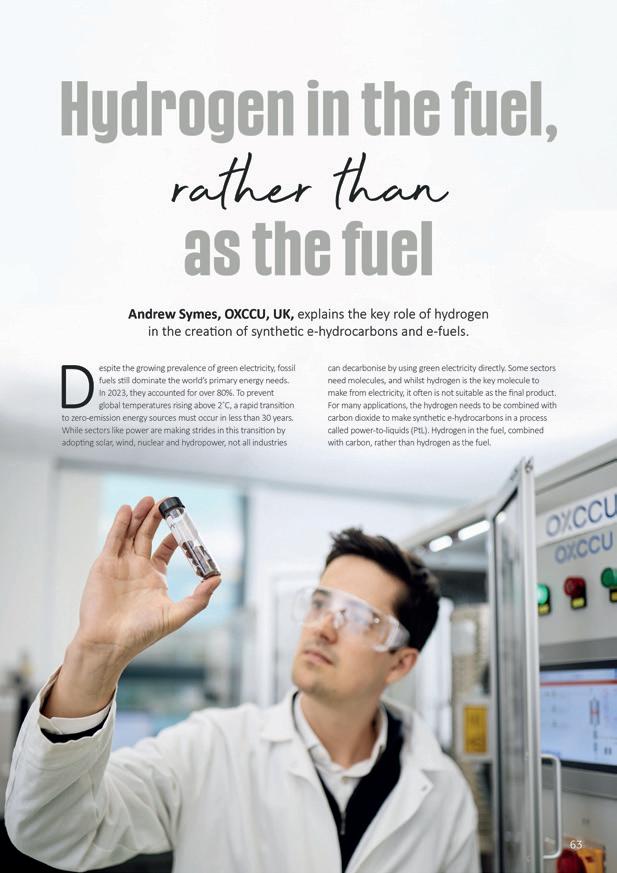


Osvaldo Heredia and Maria Alma Droppelmann, ENAP, Trevor Place, Enbridge Inc., and Moshood Adewale, Tatiana Barbosa and Luis Orellana Galarce, Veolia Water Technologies & Solutions, explore how nucleation corrosion in liquid hydrocarbon systems can be mitigated and present a case study examining nucleation corrosion in a refinery distillation overhead reflux line.
Dew point corrosion from acid condensates has been known for decades in systems like flue gas stacks and refinery overheads.1,2 Key examples include sulfuric acid attack from flue gases and hydrochloric acid corrosion in distillation tower overheads.3,4 Recently, a similar ‘nucleation corrosion’ phenomenon was reported in liquid hydrocarbons (Figure 1).5,6 Water-saturated hydrocarbons exiting hot processes like oilfield operations or distillation overheads can become supersaturated if cooled further. The excess dissolved water then nucleates into
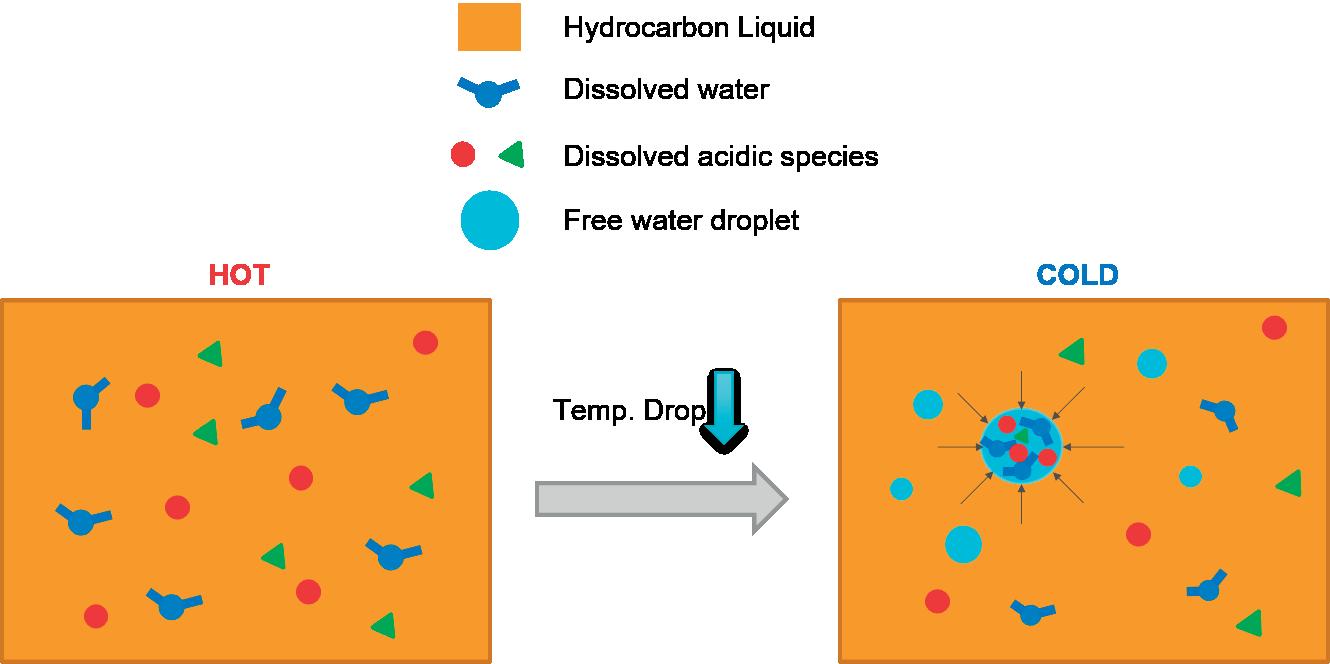
Figure 1. Schematic of nucleation corrosion, where dissolved water nucleates into acidic microdroplets upon cooling, making it potentially corrosive to metal surfaces.
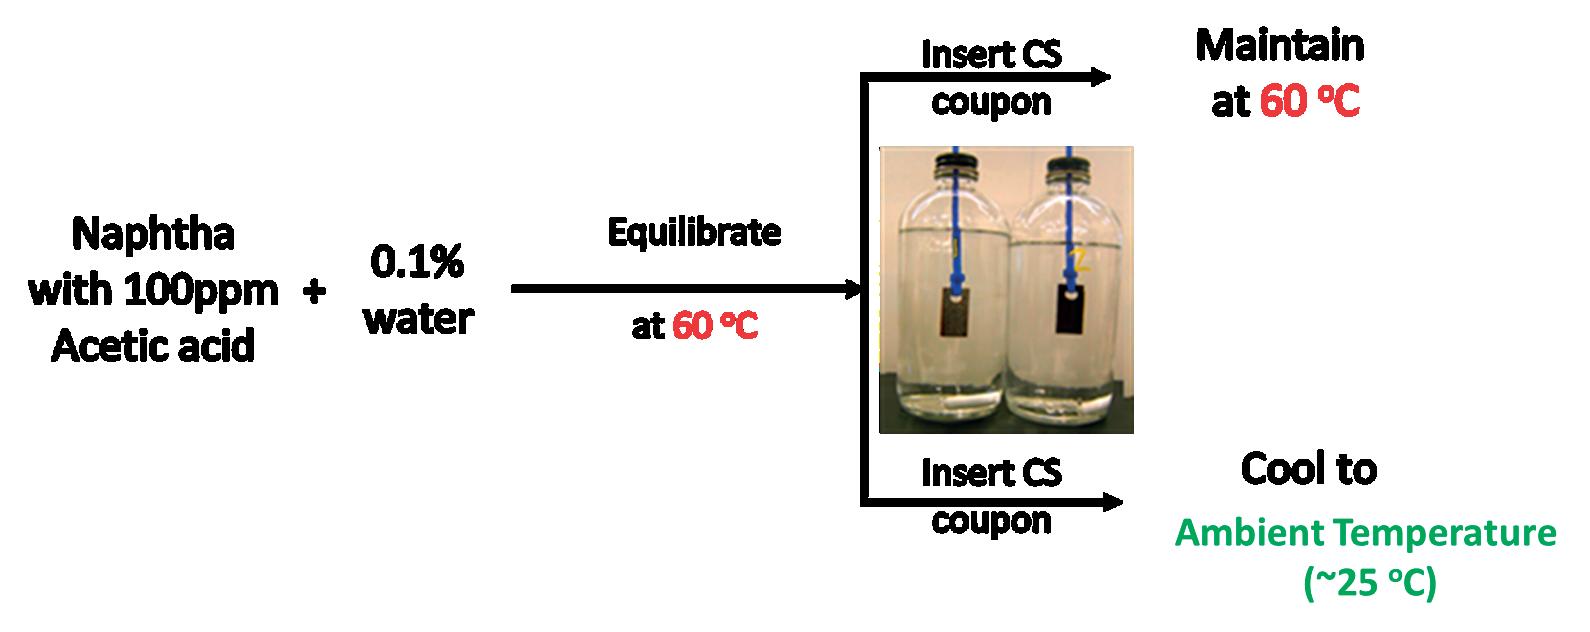
Figure 2. Bottle test setup to demonstrate nucleation corrosion using acetic acid-spiked naphtha.
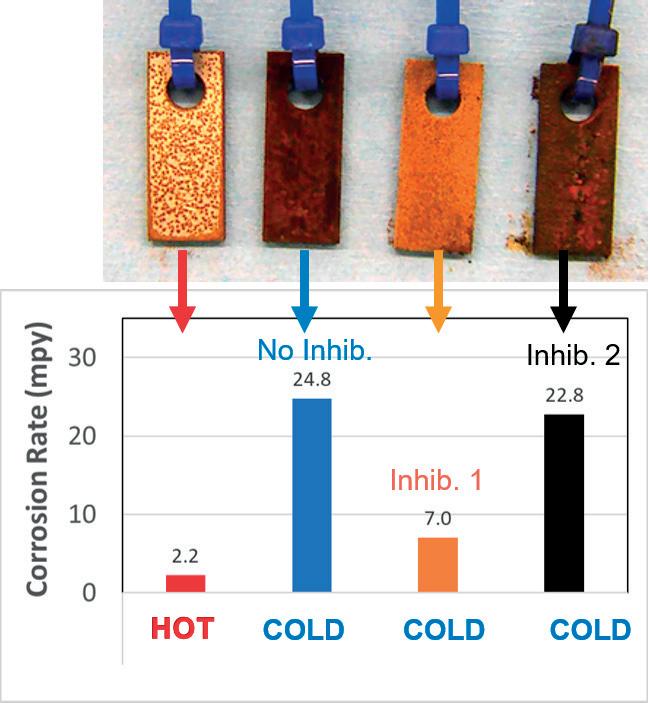
Figure 3. Nucleation corrosion inhibition in acetic acid-naphtha using an oil-soluble inhibitor (#1) vs a water-based inhibitor (#2).
fine droplets. Acidic species like organic acids and hydrogen sulfide (H2S) partition into these high surface area microdroplets, reducing their pH and potentially causing severe corrosion. Even changes in hydrocarbon composition from blending, flashing, or pressure drops can trigger water supersaturation and nucleation events.6,7 This article follows up on previous work demonstrating nucleation corrosion and explores the use of chemical inhibitors to mitigate it in liquid hydrocarbons.5,6 When process or engineering changes are impractical or provide unsatisfactory results, inhibitors can provide a cost-effective corrosion control method.8-11 The study shows how the test method chosen can significantly impact inhibitor performance and field application, highlighting the importance of simulating the actual corrosion mechanism. Two distinct inhibitor chemistries were tested using:
n A weight loss method demonstrating nucleation corrosion.
n The rotating cylinder electrode (RCE) method commonly used for oilfield inhibitor selection.12
A field case study then examines unexpected corrosion in a water-saturated naphtha reflux line, explained by nucleation corrosion. A comprehensive inhibitor programme is proposed to address both dew point and nucleation corrosion.
A 500 ml bottle was filled with 300 ml synthetic naphtha (isooctane, heptane, cyclohexane, toluene mix) spiked with 100 ppmv acetic acid. For H2S tests, the naphtha was saturated with 10 ppmw H2S by bubbling 5% H2S/N2 Then 0.1% deionised water was added, the bottle capped and aged at 60°C overnight to saturate the naphtha. A UNS G10180 carbon steel coupon was suspended in the naphtha (Figure 2). Cooling to 25°C initiated water nucleation. After exposure, the coupon was cleaned and weighed for corrosion rate. For inhibitor tests, the inhibitor was added to the oil before adding the water.5
A Pine Research Instruments RCE with 15 mm UNS G10180 carbon steel cylinder electrode was used for electrochemical testing.12
Results: inhibitor chemistries and test methods
Figure 3 shows uninhibited nucleation corrosion and the effect of two distinct inhibitors. Inhibitor #1 is a novel oil-soluble water-dispersible pHilmPLUS* inhibitor. Inhibitor #2 is a widely used water-based imidazoline filming inhibitor. Both were dosed at 20 ppm actives. The first two coupons from the left in Figure 3 show nucleation corrosion, with approximately 2 mpy at 60°C but 25 mpy after cooling to ambient due to acidic water nucleation.5
The third and fourth coupons show impact of inhibitors #1 and #2, respectively, on nucleation corrosion. Inhibitor #1 reduced corrosion to 7 mpy (~72% inhibition), while Inhibitor #2 only achieved 8% inhibition at 23 mpy. Inhibitor #1 likely performed better by partitioning from the oil into the nucleated water droplets that are dispersed in the oil and are the medium for corrosion. In contrast, the water-based Inhibitor #2 was unavailable in the oil phase to partition to the dispersed nucleated water.13
RCE is a standard method for qualifying oilfield inhibitors.11 Testing uses a synthetic brine representing typical produced water (Table 1). However, RCE is sometimes used for liquid hydrocarbon pipelines by bubbling carbon dioxide (CO2) through the brine to create a corrosive environment, despite pipelines having negligible CO2 Following this practice, Figure 4 shows RCE results with Inhibitors #1 and #2 dosed up to 14 ppm into CO2-saturated brine. Surprisingly, Inhibitor #2 reduced corrosion to <1 mpy at 7.4 ppm, while Inhibitor #1 failed even at 14 ppm.
This discrepancy compared to the bottle tests arises because RCE did not accurately simulate the nucleated water chemistry. The bottle tests indicated that the nucleated water contained percent levels of organic acid, which RCE could not replicate using a typical cumulative field water composition.5
Processing crude with high organic acid
Years ago, this refinery saw little corrosion in the naphtha splitter overhead reflux line (Figure 5) when the overhead boot water organic acid level was <10 ppm (Figure 5, centre). However, after switching to a crude with high concentration of low-molecular weight organic acids (200 ppm acetic, 40 ppm propionic, 200 ppm butyric), the expected increase in overhead dew point corrosion occurred, but was controlled with neutralisers and a first generation oil-based filming inhibitors. Unexpectedly, severe corrosion was also observed in the reflux line carrying no free water (Figure 5, right). While the first generation filmer offers good protection when filmed on the metal, its poor water partitioning limits the distribution to all parts of the overhead.
Inspection data including X-rays and ultrasound B-scans (Figure 6) revealed non-uniform corrosion from 5+ mm down to <2.5 mm wall thickness in some areas, requiring replacement. This was attributed to nucleation corrosion, where uninsulated sections of the warm, water-saturated naphtha reflux line cooled enough to nucleate water droplets that became acidic from the available organic acids. A bottle test with the field naphtha confirmed the mechanism.
Two strategies addressed the reflux line nucleation corrosion. First, a neutraliser was injected into the crude to
Table 1. Synthetic brine composition for RCE testing
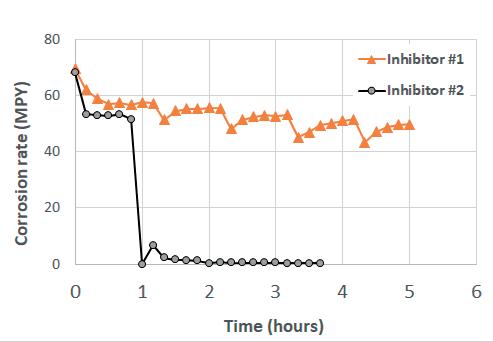
Figure 4. RCE testing of Inhibitors #1 and #2 in CO2-saturated brine, dosed up to 14 ppm.

our Distributed Feedback Laser Diodes (DFB) from 760 nm to 2800 nm and our Interband Cascade Lasers (ICL) from 2900 nm to 6500 nm


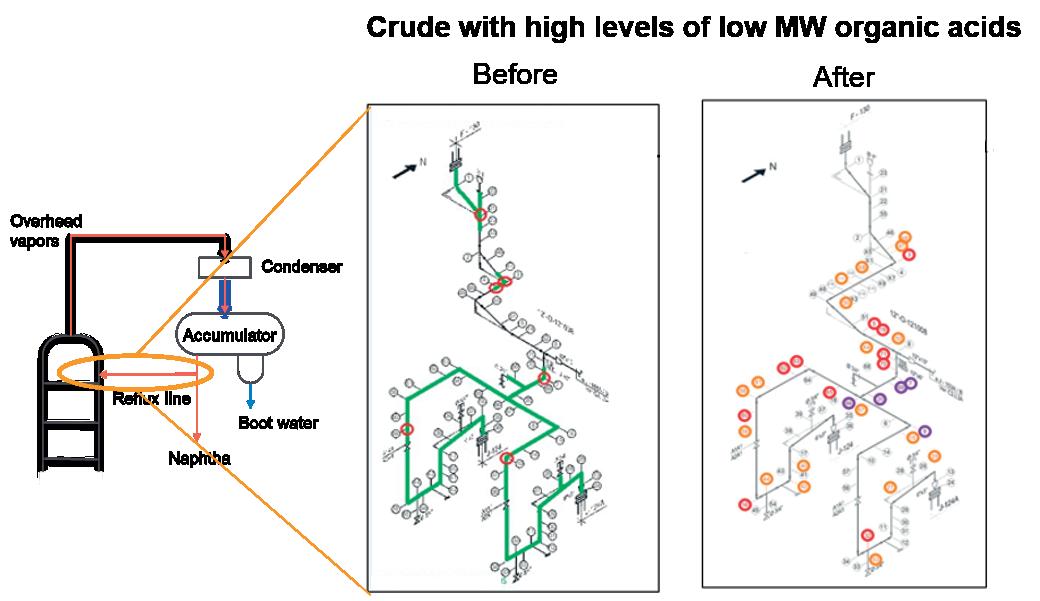

reduce organic acid carryover to the overhead (Table 2), decreasing the overall overhead corrosion rate. This is expected to also reduce reflux corrosion once new inspection data is collected as a baseline.
Secondly, once the corrosion mechanism involved was understood, the overhead chemical treatment programme was modified to mitigate the corrosion, which included operating at a higher pH range (above 8) to reduce the continuous solubilisation of the iron sulfide film on the metal surface. Additionally, the incumbent oil-soluble filming inhibitor was replaced with a new generation oil-soluble pHilmPLUS* filming inhibitor which can partition to water (i.e. Inhibitor #1). This advancement gives this inhibitor greater distribution in the aqueous phase, therefore protecting the system from attack by small water droplets formed in the hydrocarbon phase, and also providing better distribution in the liquid hydrocarbon and vapour phases.
Analytical results demonstrated a significant reduction in corrosion as evidenced by the lower total iron content in the accumulated top-side water, even with similar chloride concentrations and increased ammonia concentration in the system (Table 3). It should be noted that the overhead treatment modifications were carried out in two stages – Stage 1 involved only the adjustment of the pH range, while in Stage 2, the pH range was maintained, and the first generation filming inhibitor was replaced with the novel oil-soluble water-dispersible pHilmPLUS* inhibitor. During the application of the novel inhibitor, no thickness reduction was observed in the reflux circuit.
Nucleation corrosion in liquid hydrocarbons was studied using an oil-soluble filming inhibitor and a water-based imidazoline inhibitor tested by weight loss and RCE methods. The weight loss tests, designed to mimic nucleation corrosion, showed the oil-soluble inhibitor provided significant protection while the water-based inhibitor was ineffective. This was attributed to the oil-soluble inhibitor being available in the oil phase to partition into nucleated water droplets.
In contrast, traditional RCE testing, intended for high water-cut oilfield systems, gave the opposite result, favouring the water-based inhibitor. This discrepancy highlights the importance of accurately simulating the corrosion mechanism when screening inhibitors.
A refinery case study showed that processing crude with high organic acid levels caused severe corrosion in the overhead reflux line, in addition to the expected overhead dew point corrosion. Inspection data confirmed this was due to nucleation corrosion from acidic water droplets forming in the uninsulated reflux line. Mitigating this involved neutralising organic acids upstream and applying the novel oil-soluble water-dispersible inhibitor chemistry in the
system.
The authors thank the Veolia analytical testing lab in Tomball, Texas, US, and product application teams for their support with this work.
Some portions of this technical paper were originally presented at the AMPP Conference in New Orleans, Louisiana, US, from 3 to 7 March 2024. (paper # 21232).
© AMPP 2024.
The authors would like to acknowledge the valuable contributions of Hitesh Bagaria, Nimeshkumar Patel and Jennifer Sargent, Veolia Water Technologies & Solutions.
8. ACHOUR, M., and KOLTS, J., ‘Corrosion Control by Inhibition Part I: Corrosion control by film forming inhibitors’, Corrosion 2015 paper no. 5475 (Dallas, TX: NACE, 2015).
9. PLACE, T., ‘Managing corrosion of pipelines that transport crude oils’, Materials Performance, vol. 52, (May 2013).
10. SONKE, J., and GRIMES, W.D., ‘Guidelines for corrosion inhibitor selection for oil and gas production Part 2: corrosion inhibition performance validation’, Corrosion 2017 paper no. 8842, (New Orleans, US: NACE, 2017).
11. BAGARIA, H, WEISS, N., ADEWALE, M., SARGENT, J., WOLFE, D., and PLACE, T., ‘Monitoring Performance of Low-ppm Corrosion Inhibitor in Long Cross-Country Pipeline Carrying Very Light Hydrocarbons’, Corrosion 2020 paper no. 15186 (NACE, 2020).
12. ASTM G185-06(2020), ‘Standard Practice for Evaluating and Qualifying Oil Field and Refinery Corrosion Inhibitors using Rotating Cylinder Electrode’.
13. WOOLLAM, R. C., and MERRETT, S. J., ‘Why Water-Soluble Corrosion Inhibitors Should be the Preferred Choice for Continuous Applications’, SPE 27869-MS, https://doi.org/10.2118/27869-MS.

Since 1990, Catalyst Trading Company (CTC) has been redeploying and repurposing surplus catalyst from petroleum refining processes. Our acquisition and beneficial reuse process eliminates the need for traditional disposal or recycling while also reducing your storage requirements.
Contact CTC today to see how our surplus catalyst acquisition can benefit you.


G. Simon A. Weiland, Optimized Gas Treating, Inc., USA, highlights the advantages of predictive sulfur recovery unit (SRU) simulators and how they can help to optimise plant operations.
Until recently, sulfur recovery unit (SRU) simulators all relied on correlations of field-measured performance of existing SRUs to predict the performance of new units. By their very nature, field measurements have embedded in them a multiplicity of error sources ranging from the quality of the measurements themselves, to departures from steady state, and the necessity to extrapolate inherently unreliable data into operating regions where measurements have never been made. Since the original SRU simulators were first developed, a great deal more-fundamental information has been uncovered. Such information includes reaction kinetics,
elucidation of reaction mechanisms, and heterogenous catalytic reaction rates described in terms of parameters germane to catalysis. Much of this fundamental data is the work of Alberta Sulphur Research Ltd (ASRL) with catalyst modelling attributed to Huffmaster et al. (2023a–c). Every operation in an SRU can now be modelled using reaction kinetics fundamentals, thus enabling an SRU simulator to be predictive based on solid engineering and scientific principles vs just correlative.
Following development of ProTreat®, the first fully mass-transfer rate-based simulator for gas treatment using amines, OGT expanded into almost all facets of downstream gas treating, including glycol dehydration, absorption by physical solvents, caustic treating, and sulfur recovery, the latter marked by the release of SulphurPro® in 2016. This article specifically focuses on SRU simulation from a kinetics and heat transfer fundamentals viewpoint, using SulphurPro as the exemplary simulator.
SulphurPro development continued with the original philosophy underlying ProTreat. Each equipment item in the Claus SRU has been carefully developed with emphasis on fundamental reaction kinetics, mass transfer rates, and rigorous heat transfer. The following analyses each equipment item one piece at a time, starting at the front end with the thermal reactor and working back to the discharge from the SRU via the thermal oxidiser and stack.
The thermal reactor is the modern name for what was originally known as the reaction furnace. It is where the
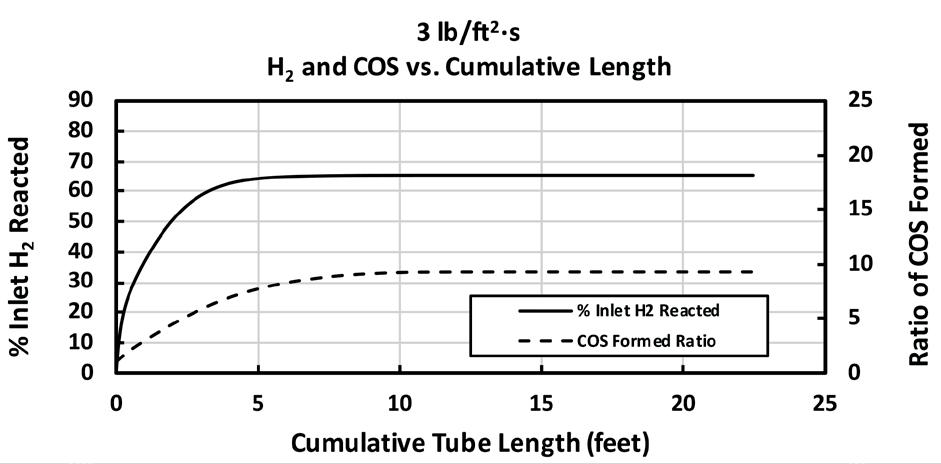
1. Reactions of H2 and CO through the boiler tubes at 1.5 in. tube OD (Sulphur-Pro simulation).
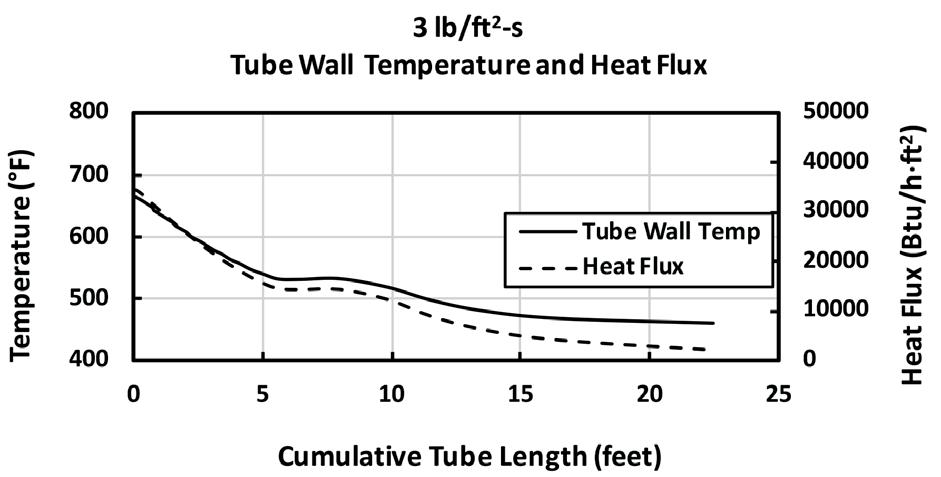
Figure 2. Heat flux and tube wall temperature in 1.5 in. OD boiler tubes (Sulphur-Pro simulation).
magic starts in a Claus SRU. The acid gas from the upstream acid gas recovery units (ARUs) is taken from the regenerators and (possibly) one or more sour water strippers. This acid gas is combined with oxygen (air, maybe oxygen enriched) and is fed through a burner where one third of the H2S is burned to SO2, as required for the downstream sulfur converters to function properly. The chemistry in the thermal reactor is:
2H2S + O2 → S2 + 2H2O
H2S + 3 2 - O2 → SO2 + H2O
2H2S → S2 + 2H2
2H2S + 12 O2→ H2 + S2 + H2O
If the SRU is processing sour water stripper off-gas (containing ammonia), care must be taken to ensure that it is combusted as completely as possible. The industry standard is 150 ppm maximum residual ammonia post combustion; however, this value is somewhat flexible. The upper limit of 150 ppmv is dictated by ammonia’s propensity to form ammonium salts which will precipitate in the cold section of downstream equipment. Any amount above this standard presents a possible (although not assured) hazard for salt formation and plugging. Ammonia destruction can follow several pathways:
2NH3 + 32 O2 → N2 + 3H2O
2NH3 → N2 + 3H2
2NH3 + SO2 → N2 + 2H2O + H2S
The first two are well documented and involve the oxidation of ammonia to nitrogen and water, and the thermal cracking of ammonia to nitrogen and hydrogen. The third pathway is a relatively recent finding of ASRL and is thought to be the predominant pathway for ammonia oxidation. To ensure ammonia is adequately destroyed, three factors must be considered: time, temperature, and turbulence (mixing). SulphurPro takes each of these factors into account to calculate the kinetic rate for ammonia destruction.
The waste heat boiler (WHB) converts the heat generated by H2S oxidation into high pressure steam and is arguably one of the most important and most fragile pieces of equipment in the SRU. Its main purpose is to cool the extremely hot gas from the thermal reactor before it continues through the rest of the SRU. Getting the heat transfer right is extremely important and there are numerous factors that go into calculating the heat transfer rate. Although its main purpose is heat transfer, because the gases entering the WHB are quite hot, there are other reactions that occur within the first few feet of the tube bundle:
H2+ 12 S2 → H2S CO+ 12 S2 → COS
These are called recombination reactions because they take previously formed hydrogen and sulfur and recombine them to form H2S and COS. These reactions are exothermic, so there is further heat released as they progress.
As Figure 1 shows, these reactions only progress to a certain extent and depend on several factors (mass velocity, tube diameter, temperature, etc.) to determine the exact reaction quench point.
These recombination reactions have significant implications for heat flux, tube wall temperature, and sulfidation corrosion. It is well documented in the literature that failures tend to become more common when heat fluxes exceed 50 000 Btu/h-ft2. At elevated heat flux, problems with steam blanketing on the utility (steam) side of the tubes become more common. Locally-high heat fluxes can result in local steam blanketing which can cause locally higher tube-wall temperatures and increased corrosion rates. The life cycle cost of a WHB depends greatly on the corrosion rate of the boiler tubes due to high heat flux and high tube-wall temperature. The tube-wall temperature together with the concentration of H2S present correlate directly into the sulfidic corrosion rate. Figure 2 shows the heat flux and process temperature through the exchanger at a mass velocity of 3 lb/ft2·s through a 1.5 in. OD tube.
Also, within the boiler tubes, the sulfur species shift from S2 to S6 and S8 (temperature-dependent sulfur redistribution) as can be seen by the inflection in the curves approximately one third of the way along the boiler tubes. Sulfidic corrosion is of tremendous concern and is shown in Figure 3 as a function of mass velocity.
Figure 3 shows how sulfidic corrosion progresses through the length of the boiler tubes. It is interesting to
note that higher mass velocity results in overall higher sulfidic corrosion rates throughout much of the tube length, particularly at the hot end (entry) of the tubes.
With all this in mind, it is only to be expected that unless their model considers all heat transfer mechanisms and sources, sulfur plant engineers are likely missing some critically important pieces of the puzzle, pieces that may provide an early warning and prevent an expensive refinery shutdown.
Condensers are very important equipment items and have the purpose of liquefying elemental sulfur formed in the thermal and each successive catalytic stage. The way SulphurPro models these is much the same as the WHB block. Although the condensers are not nearly as sensitive as the WHB, they should still be modelled with the full spectrum of heat transfer calculations as done for the WHB. With SulphurPro, condensers can be rated (existing design) or sized (new design).
Sulfur converters should be modelled using rigorous kinetic reaction rates, accounting not only for the type of catalyst used (titania vs alumina), but also considering the catalyst’s age (or activity). One important facet of the first Claus SRU Converter is to ensure adequate conversion of COS and CS2 These components are byproducts from combusting hydrocarbons in the presence of sulfur in the thermal reactor.

Hunter offers custom modular buildings, blast-resistant shelters and equipment shelters designed to meet your specific applications or project. Our off-site modular designs are also ideal for brownfield, greenfield and other expansion needs. Hunter serves as your trusted partner in streamlining and
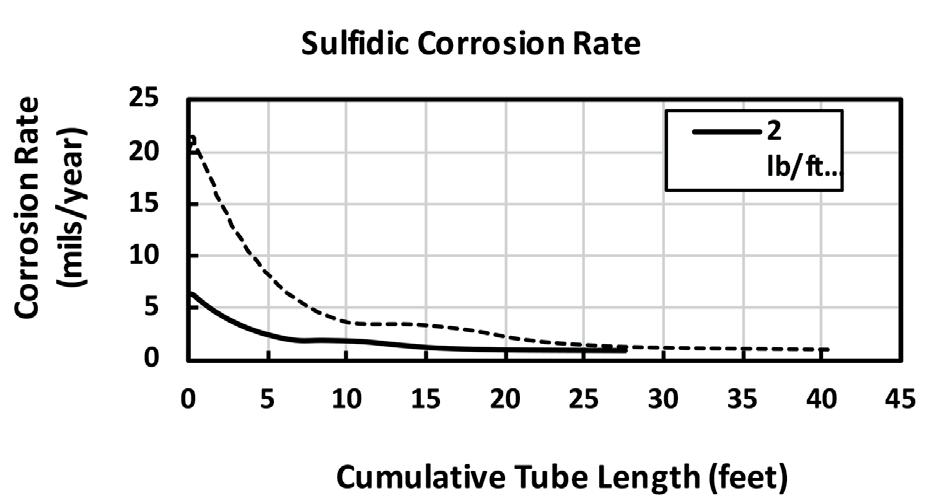
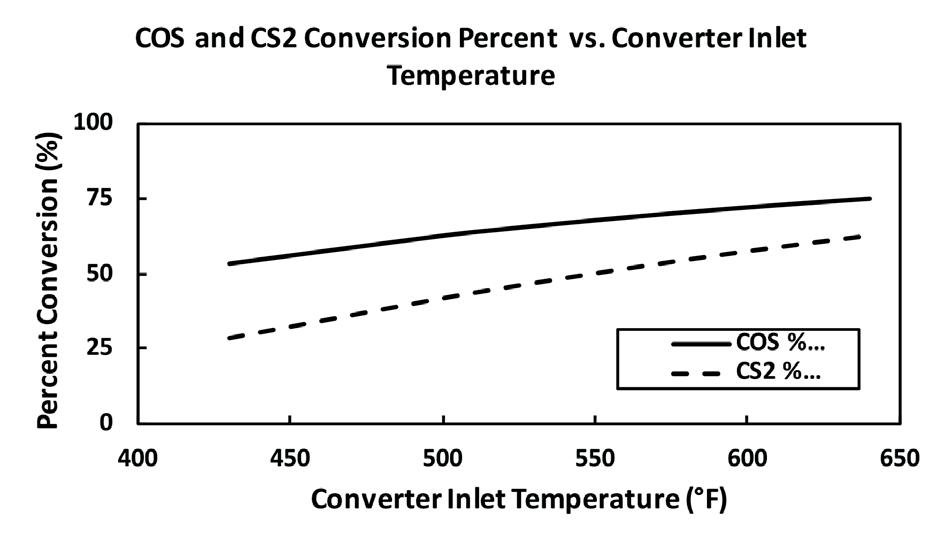
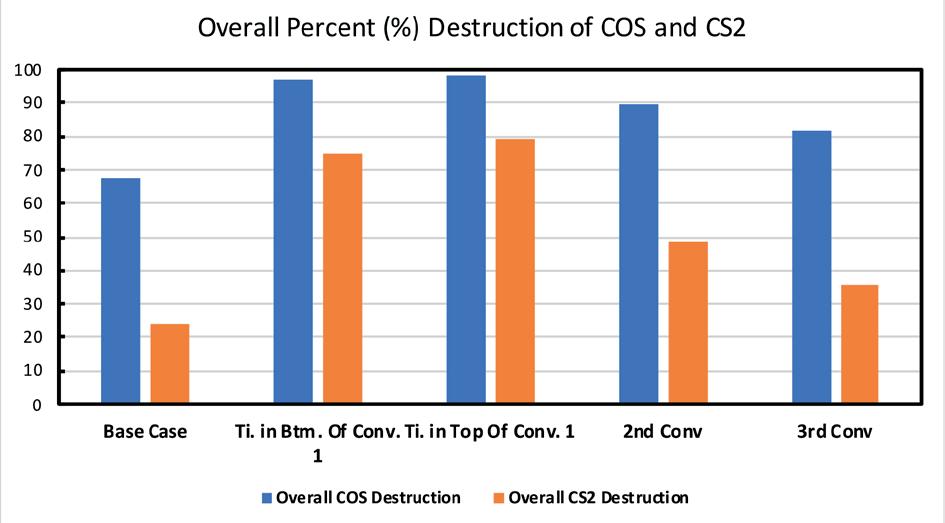
simulation).
Table 1. List of reactions for hydrogenation reactor and
These components are of particular interest because they do not participate in the main Claus reaction, where H2S and SO2 convert to elemental sulfur and water. Consequently, if no other means are provided to destroy them, they will end up contributing to the overall stack emissions and potentially push a facility over its environmentally regulated emission limits. The destruction of COS and CS2 is temperature dependent, and unlike the Claus reaction, it is favoured by high temperatures. Figure 4 shows the destruction of these components as a function of temperature.
One of the best ways to achieve high destruction of COS and CS2 is by using titania catalyst. Figure 5 shows the importance of alumina and titania catalyst placement in the converter beds.
Figure 5 makes clear that the most common placement in practice (titania at the bottom or top of the first converter) is the best possible placement. Not only does this ensure that the temperatures are higher than they would be at the top, but placing titania at the bottom results in a sacrificial layer of alumina on top. This protects the titania, being much more expensive and susceptible to contaminants.
Without further treatment, the tail gas from the final sulfur condenser in an SRU contains enough unconverted SO2 and H2S to present an often impossible-to-address challenge meeting sulfur emissions regulations when discharged to the stack. Conventional treatment involves tail gas hydrogenation to convert the SX, COS, CS2, and SO2 content to H2S so it can be removed and recycled by a second downstream treating unit (TGTU). A secondary function is CO conversion to CO2 through the water gas shift reaction, which provides additional hydrogen. Hydrogenation (also called hydrodesulfurisation) is followed by a water quench step to cool the hydrogenated gas to a low enough temperature to make H2S removal by an amine TGTU feasible. The hydrogenation catalyst is usually cobalt-molybdenum (or nickel-molybdenum) supported on γ-alumina. The hydrogenation reactor model in SulphurPro is the result of having taken great pains to ensure that the model reflects as much of the physical and chemical detail of the catalysts as possible. Model accuracy is critically important because hydrogenation is such an important step in determining final sulfur recovery and setting sulfur emissions.
A sizeable number of reactions occur in the hydrogenation reactor, including not just H2S generation from SO2, but also hydrogen production via the water-gas-shift reaction, methyl mercaptan, and CS2 and COS formation and destruction. The SulphurPro simulator provides a wealth of information on the performance of multi-layered beds of spherical, cylindrical and trilobe catalyst particles. It includes 10 reactions in horizontally and vertically
Take a look at our ABC Certificate. It shows our circulation has been independently verified to industry agreed standards. So our advertisers know they’re getting what they paid for.
ABC. See it. Believe it. Trust it.

aligned vessels, catalyst bed heat loss, and the effect of catalyst ageing and poisoning. The left two columns of Table 1 show the extensive reactions that are accounted for in SulphurPro’s hydrogenation reactor model.
The sulfur pit is an often-overlooked piece of equipment when it comes to modelling. In SulphurPro, the pit is modelled with the same rigorous methods as the rest of the SRU. Provisions are made to accurately model the H2S evolution (degassing), as well as the sweep air to provide a very accurate representation of material flow throughout the plant.
The thermal oxidiser (TO) and stack are the last pieces of equipment in an SRU. They represent the final step before the waste gas is released to atmosphere, and they are responsible for ensuring the complete combustion of all sulfur species into SO2. The thermal oxidiser and stack share the same reaction set (rightmost two columns in Table 1) and, fundamentally, one is very much like the other in terms of their purpose.
The stack provides a bit more information than the thermal oxidiser. Stack emissions can be calculated and reported as both the raw and dry emissions composition, as well as the emissions composition on wet/dry oxygen-free and wet/dry excess-air-free bases. This can be extremely useful when looking at regulatory emission limits for the SRU.
Today it is possible to use a comprehensively complete, fundamentals-based, truly predictive SRU simulator. By using reaction kinetics and rigorous heat and mass transfer, SulphurPro® allows sulfur plant engineers and designers to work with an extremely accurate representation of their plant. Reliably predictive simulation allows one to make important decisions for optimisation, new projects, troubleshooting and corrosion assessment, and to allow for factors that are hidden from view in an operating plant, but whose excursion can cause equipment failure and require costly unit shutdowns, including the whole refinery.
SulphurPro and ProTreat share the same code. Being able to run these together as a single simulation allows the simulated SRU to be fed by multiple acid gas removal and enrichment units and sour water strippers, and for tail gas streams to be further treated in TGTUs. This produces a powerful picture of how changes in the operation of one or more units affects the operation of all the others in just a single simulation.
1. HUFFMASTER, M., CHANDRAN, P., HATCHER, N., JENSEN, D., and WEILAND, R., ‘Kinetic model for TGU hydrogenation reactors: Part 1 –model development’, Petroleum Technology Quarterly, Q1, p. 45 (2023).
2. HUFFMASTER, M., CHANDRAN, P., HATCHER, N., JENSEN, D., and WEILAND, R., ‘Kinetic model for TGU hydrogenation reactors: Part 2 – Catalyst model validation’, Petroleum Technology Quarterly, Q2, p. 55 (2023).
3. HUFFMASTER, M., CHANDRAN, P., HATCHER, N., and JENSEN, D., ‘TGU catalyst poisoning and deactivation’, Sulphur, 408, p. 48, September - October (2023).


Tim Gale, Cameron Hamari, and Brett Seales, 1898 & Co., USA, explain why adopting an offensive approach is the best strategy to defend against cyber threats in the downstream oil and gas sector.

Protecting oil, gas or chemical plant operational technology (OT) systems against cyber-enabled compromise comes with a unique set of challenges. OT refers to a wide variety of purpose-built hardware and software that monitors,
provides communication and controls processes in industrial facilities. An industrial control system (ICS) is a critical part of the OT environment and includes systems like distributed control systems (DCS), supervisory control and data acquisition (SCADA), and
safety instrumented systems (SIS). These OT systems are part of the plant critical infrastructure and require the highest uptime possible. This means that there are limited opportunities to harden or re-engineer during normal operation.
Many OT systems typically needed to run plant equipment have not been designed with security in mind. Until relatively recently, cyberattacks were not on anyone’s radar because OT systems were isolated from external connections, running non-ethernet-based communication protocols and were considered too obscure to be a target. However, this is no longer the case. With the convergence of OT and IT systems and connectivity needed to achieve the efficiencies of robust data exchange and real-time monitoring, the risk to an ICS has increased.
Threats from malicious software, advanced threat actors and even threats from the supply chain all exist and require a dedicated effort to reduce risk. To provide the necessary security and resiliency to critical ICS, industry must begin to address vulnerabilities in the design and implementation. Vulnerabilities are flaws in the design and configuration of OT equipment that may be exploited by malicious parties. Which should be targeted first and which can wait?
Typically, mitigations are prioritised through vulnerability and risk assessment. Once an operator has identified the vulnerabilities in an ICS and has tied those to specific risks to health and safety, the environment or operational downtime, they may still be left with a large number of gaps to address during the infrequent downtime possible in an operational environment. Some controls are simple to deploy and may be handled easily. Others require significant technology integration, or re-engineering of the ICS networks.
Risk assessment identifies risk that may be possible, but to really prioritise the work required to address the deficiencies identified, an offensive security programme may help identify the vulnerabilities that are most exploitable.
Offensive security refers to the proactive approach of identifying and addressing vulnerabilities in an ICS before they can be exploited. This may involve simulating attacks, penetration testing, and employing ethical hacking techniques to uncover weaknesses. Because of the limited time to perform these activities, they should be prioritised by the highest risk and most critical systems first. This approach enables organisations to strengthen their defences by understanding how adversaries might exploit security flaws, and to exercise their defences and response strategies.
Conducting offensive security operations in the ICS space carries inherent risks due to the critical nature of these systems. Simulating attacks or testing vulnerabilities in ICS environments can inadvertently impact safety or disrupt operations, potentially leading to significant financial losses. Offensive security in this domain requires careful planning, coordination with operational teams, and thorough risk management to ensure that testing activities do not compromise system integrity or operational stability.
Employing a variety of approaches to offensive security provides invaluable insights into safeguarding systems effectively from multiple perspectives. A diverse approach not only enhances an organisation’s ability to anticipate and counteract potential threats, but also ensures that security measures are both resilient and adaptable to evolving cyber challenges.

A targeted approach to offensive security is penetration testing, or pentest, which specifically focuses on the systems known to be the most critical to uninterrupted operations. The scope of a penetration test is usually well-defined and focuses on specific targets, aiming to identify as many vulnerabilities as possible within the boundaries defined in the rules of engagement. Unlike a red team exercise, which simulates broad and deep attack scenarios, the goal of a pentest is to perform rigorous testing of security controls to determine breaking points of defence to allow a critical attack path and report the vulnerabilities they find. Penetration testing in an ICS environment is surgical in nature to keep critical systems operational. After the testing, the pentest assessment team provides recommendations on how to improve
Today’s automated systems need better protection from cyberthreats.
Even the most highly automated systems are still vulnerable to cyberthreat vectors. 1898 & Co. provides industry-leading assessments, cyber program development, road maps, training, detection and incident responses to help you meet these challenges head-on.

Working with the Blue Team, this active assessment or simulation of a real-world cyberattack tests an organization’s cybersecurity capabilities and exposes vulnerabilities within technology, people and processes.
This simulated, adversarial assessment attempts to identify and exploit weaknesses within an organization’s cyber defenses. Detection capability efficacy may also be validated.
Working with the Purple Team is a more collaborative approach between the Red Team and the Blue Team. The Blue Team may extend beyond the core ICS cyber team to include site ops, engineering and IT.
security controls, helping the organisation to strengthen its defences before actual cybercriminals can exploit them.
The rules of engagement for the red team often require them to emulate the thoughts and processes of an actual adversary. Red teams use various techniques to find weaknesses in personnel, networks, applications, and other systems, just like real attackers would. They look at the entire organisation’s security, including physical security and social engineering to obtain sensitive information from employees. Unlike penetration testing, which focuses on specific areas and identifies vulnerabilities, a red team has a broader and potentially deeper scope. The red team’s goal is not just to find weak spots, but to simulate real-world attack scenarios and see how well the company can detect and respond to advanced threats. This helps organisations improve their overall security and defence strategies.
The purple team is traditionally an outside group that helps improve an organisation’s security by facilitating better collaboration between the red and blue teams during a red team engagement. While the red team simulates attacks to find weaknesses and the blue team focuses on defending against those attacks (see below for more information on blue teams), the purple team works with both teams to ensure that lessons learned from the red team’s testing are used to strengthen the blue team’s defences. They help analyse the results of simulated attacks, identify areas for improvement, and develop strategies to enhance security measures. The purple team’s role is crucial because they ensure that the insights gained from offensive and defensive efforts are coordinated and communicated effectively.
In a culture of safe and reliable operations, everyone is responsible for defending their organisation’s systems and data from cyber threats. The dedicated blue team experts monitor networks and systems to detect any suspicious activity or potential attacks. When a threat is identified, the blue team quickly executes the organisation’s cybersecurity incident response plan, containing the threat and mitigating the impact of malicious activity to allow for safe, secure, and reliable operations to continue. The blue team also continuously improves the organisation’s defences by setting up and maintaining security measures like firewalls, intrusion detection systems, encryption, and sound security policies. Working with the other offensive security teams, the blue team focuses on maintaining and strengthening the security infrastructure against vulnerabilities, ensuring the organisation’s data and systems remain safe and secure.
Unlike traditional reactive approaches that rely on automated alerts and predefined signatures, threat hunting involves a human-driven analytical approach where blue teams develop, and then prove or disprove, a hunt hypothesis to identify indicators of compromise that may have evaded existing security measures. This analytical process combines an analyst’s deep knowledge of the threat landscape with advanced intelligence sources, tools and techniques to scrutinise network traffic, endpoint activity, and system logs for anomalies or suspicious behaviour.
Proactive threat hunting allows cybersecurity professionals to identify hidden threats and vulnerabilities that automated tools may miss, particularly those specific to ICS protocols and devices.
There is no question that industries in all sectors are becoming much more sensitive to the risks of cyberattacks and that the sophistication of the malicious actors is increasing. Solutions to address and mitigate attacks must account for the fact that each OT environment is unique. Arriving at the right answers is highly dependent on assessing and analysing the variables that exist within each engagement.
Assessments of complicated ICSs may result in hundreds of recommendations. It is imperative to prioritise that list to the most critical controls to be deployed first. A well-developed cyber security programme is the start in evaluating and prioritising where to spend valuable resources. Establishing an experienced cybersecurity team and conducting thorough and robust offensive testing are crucial for proactively identifying and mitigating vulnerabilities, ensuring the resilience and security of critical systems against sophisticated cyber threats.
By adopting an attacker’s perspective, security professionals can anticipate potential threats to an ICS, validate existing security controls, and fortify defences accordingly. This approach not only helps in identifying and addressing vulnerabilities, but also in testing the effectiveness of existing security measures, ensuring they are robust enough to withstand real-world attacks.
In addition, offensive security in the OT environment fosters a culture of continuous improvement and preparedness. Regularly engaging in these testing activities keeps security teams vigilant and informed about the latest attack techniques and trends. This ongoing engagement ensures that security evolves with emerging threats, rather than becoming outdated.
In an OT environment, where the stakes are high due to the potential for severe safety and economic consequences, the power of offensive security lies in its ability to anticipate attacks before they can cause significant harm, thereby enhancing the overall resilience and reliability of critical systems.


Bernard Montel, Tenable, France, explores the benefits of adopting a preventative cybersecurity stance in the downstream industry.
In 2024, the focus on cybersecurity will heighten for those in the energy sector given the deadline for EU Member States to transpose NIS2 into national law by October 2024, with enforcement from January 2025. While legislation is one driver for secure working practices, organisations cannot afford to wait until October to strengthen defences. In recent years, cyber attacks impacting critical infrastructure have increased and that threat looks set to worsen.
By understanding the threats faced, is it possible to take action and prevent devastating cyber incidents in 2024 and beyond?
Threat actors increasingly understand the magnitude of damage that can be inflicted on organisations that are heavily reliant on operational technology (OT), particularly the downstream industry. Ransomware has

proved to be a particularly effective weapon of choice for threat actors. For impacted organisations, many are forced to shut down operations in a desperate bid to prevent the malware causing further damage and begin the unenviable task of restoring systems. All too often it is not just physical damage inflicted as hackers will also steal sensitive information, in order to extort money from affected organisations looking to prevent the publication of this data. As an illustration, and given the
heightened political tensions in the region, Iran recently suffered a significant cyber attack that disrupted services at fuelling stations across the country. But it is not just those in conflict zones that are targets as Canadian energy company, Suncor, can attest. It suffered a cyber attack that resulted in its PetroCanada business experiencing temporary disruptions.
In addition to the obvious financial gain, threat actors recognise that OT targets provide them with
brand awareness and publicity as these attacks tend to be high-profile. Hacktivist groups in particular will target those in the energy sector to further their ideology, gaining maximum exposure and notoriety for their causes.
The threat is not going away any time soon as evidenced in the recent WEF Global Risks Report, which ranked ‘cyber insecurity’ in the top five of the most severe risks over the next two years. 1
When we think of traditional computing environments, IT systems are used for data-centric computing while OT systems monitor events, processes and devices, and make adjustments in enterprise and industrial operations. While they have two distinct objectives, increasingly the line between them has been blurred as IT/OT convergence has seen the integration of information technology (IT) systems with operational technology (OT) systems, allowing them to interoperate efficiently as a single cohesive system. This collaboration results in many benefits for organisations improving efficiency, safety and resiliency. However, this also hugely expands the attack surface organisations have to defend.
It is not surprising that the cloud remains one of the fastest-growing trends that has been seen in the past few years. The growing attention and increase of costs and penalties around energy useage and carbon emissions means companies are turning to smarter management of their operations with OT-based sensor deployment and controls. The result is more Internet of Things (IoT) and OT devices deployed in smart buildings, factory management and building management systems. This exposes the company to further risk as they expand the attack surface and connect these environments to the internet.
There is also a persistent trend among businesses opting to continue to use on-premise solutions. The reluctance to rely solely on the cloud has driven companies to adopt a dual approach, leveraging both on-premise and cloud resources for enhanced security and stability.
According to the findings of a commissioned survey of 100 UK-based cybersecurity and IT leaders, conducted in 2023 by Forrester Consulting on behalf of Tenable, 7 in 10 organisations say they use multi-cloud and/or hybrid cloud environments. However, over two-thirds of respondents (67%) cite cloud infrastructure as one of the highest areas of risk exposure in their organisation. 2
This approach is predominantly embraced by larger organisations, while small and medium enterprises are swiftly transitioning exclusively to the cloud due to financial constraints. The balance between on-premise and cloud solutions is not uniformly split between big and medium-sized companies. Depending on the sector and its operational requirements, their approach varies.
Recent cyber attacks often exploit vulnerabilities across cloud resources, data, and on-premise networks
due to identity misconfiguration or lapses in security protocols.
Another avenue that is often exploited, particularly for large and listed organisations, is attacks rallied against connected third-parties. Hackers looking for low-hanging fruit will target smaller organisations whose security practices may be less mature. For threat actors, compromising these organisations can be the first layer of a successful infiltration, facilitating further incursion into third-parties. In 2023 there were a number of successful attacks against Software as a Service (SaaS) organisations systems which exposed data and systems of connected organisations. There is some light in the darkness as this problem is being addressed by NIS2. The order aims to promote a more secure business ecosystem for thousands of companies that form part of critical national infrastructure.
Meeting the compliance standards for NIS2 will be vital for all organisations that fall within its scope, but particularly so for smaller organisations currently at the behest of hackers looking for easy wins. SMEs invariably pay ransoms at a higher rate due to the severe impact it has on the continuity of their business, because of their lack of recovery protocols. Forward thinking SMEs will focus on preventing attacks before they occur, weatherproofing their company against an increased pace of threat.
All that said, organisations should not be lulled into a false sense of security that, by ticking the relevant boxes of regulation requirements and frameworks, such as the NIS2 directive, they are protected. The reality is that adherence with NIS2 principles will strengthen defences, but that does not always equate to being secure. Organisations should use NIS2 as a guide to minimise their cyber risk and not the defacto standard. The onus has to be on every organisation to implement secure working practices that protect their infrastructure and the sensitive data and critical systems contained.
An evolving operational landscape, driven by technological innovation and modern warfare demands, highlights the need for robust, secure and efficient cyber-physical systems. However, for many, that seems easier said than done.
Attackers see many ways in and multiple paths through technology environments to do damage to organisations. They are probing for the right combination of vulnerabilities, misconfigurations and identity privileges. Rather than wait for defences to be breached and then react, security teams must take a preventative security stance and address the risks that threat actors look to exploit.
A preventative approach in industrial cybersecurity is paramount to eliminate many of the core risks associated with the new trends and challenges that are present. This requires a holistic view of both IT and OT


environments – of IT and OT assets, IoT, Building Management Systems, and everything in between. Knowing what is there is only part of the equation as it is imperative to build a picture of how OT devices are interconnected and the interdependencies that exist for critical functionality. With that, intelligence security teams then need to identify where weaknesses and vulnerabilities exist and prioritise those assets that could become possible attack paths. By taking this stance, steps can be taken to remediate the risks where possible, or monitor the assets related to the risk for deviations, to attacks.
Gaining this broad visibility can be difficult, challenging security teams to conduct analysis, interpret the findings and identify what steps to take to reduce risk as quickly as possible. Artificial intelligence (AI) has the potential to address this – it can be used by cybersecurity professionals to search for patterns, explain what they are finding in the simplest language possible, and help determine what actions they should take to reduce cyber risk. AI can – and is – being harnessed by defenders to power preventive security solutions that cut through complexity to provide the concise guidance required to stay ahead of attackers and prevent successful attacks. Harnessing the power of AI enables security teams to work faster, search faster, analyse faster and ultimately make decisions faster. Additionally, establishing incident response plans and practising and reviewing those plans once or twice
a year ensures that stakeholders – executives, engineers and security personnel – are ready to respond. Tabletop exercises should evaluate the impact on operations if different combinations of equipment are unavailable, as well as communication plans for shareholders, employees and customers in the event of an attack.
Taking security to the next level requires investment in OT security, which has lagged behind its IT counterpart. When considering return on investment, this reality is flipped. For every pound spent on OT security, organisations get more than what they would get with a pound in IT security investment. OT investments buy down risk much more so than IT security.
Preventing cyber incidents requires full visibility into all assets and exposures, extensive context into potential security threats, and clear metrics to objectively measure cyber risk. By knowing which threats are being actively targeted against those in the downstream sector, and how, security teams can take action. Knowing the adversary means organisations can anticipate cyber attacks, ensuring they are best positioned to defend against today’s emerging threats.
References
1. https://www.weforum.org/publications/global-risksreport-2024/.
2. https://www.tenable.com/analyst-research/2023-forresterexposure-management-study


Improving reliability, increasing throughput, and enhancing the efficiency and flexibility of operating units is important to you. Halliburton Multi-Chem offers a broad selection of chemistries, equipment, services, and automation to ensure successful results.
Through onsite technical service and engineering support, Multi-Chem collaborates with you to deliver solutions to your challenges. We’re here to help you.

Our analyzers make tough SRU work a little easier
We know how hard it is to manage sulfur recovery unit (SRU) processes, and the levels of skill, concentration, and dedication your team needs.
That’s why we make sure you don’t have to worry about your analyzers, too. We’ve been designing industry-standard SRU analyzers for decades, focusing on reliability, longevity, accuracy, robust design, and ease of use.
We make analyzers for every part of the sulfur removal process – from SRU feed gas to the measurement of stack emissions, and everything in-between - so you get one convenient source for unparalleled engineering and support.