Advancing Overpressure Protection
Fully certified portfolio of ASME I & VIII with proven quality and performance, exceeding industry expected standards
Predictive maintenance and diagnostics through our Valve Lifecycle Management suite of tools
Supported by a global network of certified Green Tag™ service centers Safer, cleaner and more efficient flow control.
Table 2 lists the 33 African countries without oil production. Net imports are assumed to equal consumption. These are small to mid-sized markets. Oil demand for these 33 countries totalled approximately 808 500 bpd in 2023, slightly less than Egypt’s consumption. Kenya and Ethiopia are the largest markets among the non-producers. Kenya had a refinery but, for economic reasons, it ceased running crude oil and was converted to a product terminal.
Among the non-producers, several countries are actively pursuing oil development. These include Burundi, Eswatini, Malawi, Namibia, Rwanda, Sierra Leone, and Somalia. In order to
launch new exploration and development projects, governments typically use a mix of strategies such as conducting seismic surveys and geological mapping, hosting licensing rounds to attract international companies, and codifying policies and laws that clarify the process and offer incentives for investment. Governments often use production sharing contracts (PSCs) to balance their need for revenue with the need to make projects attractive to foreign companies.
Demand growth and net imports continue
Africa is a vibrant and growing market. The Energy Institute/BP ‘Statistical Review of World Energy’ notes that African oil demand grew at the robust rate of 1.2%/y during the decade 2013 - 2023,3 despite the sharp downturn caused by the COVID-19 pandemic. In 2013, African oil demand was 3.753 million bpd. This grew at a rapid rate of 1.54%/y between 2013 and 2019, reaching 4.113 million bpd in 2019. The pandemic caused demand to collapse to 3.694 million bpd in 2020, and then recovery brought demand to 4.244 million bpd in 2023. The African Energy Chamber anticipated even more rapid demand growth, forecasting growth rates of 3.1% between 2023 - 2026.4 The events of 2025 are likely to slow some of this growth, but in relative terms, Africa will remain a growth market.
As Table 2 illustrated, at least 33 African countries rely solely upon imports for their fuel needs. Some of these had refineries in the past. Some were small and inefficient, and they could not compete with supplies from external refineries. Kenya’s refinery, for example, was converted to a product import terminal, and the government is considering the site also as a strategic petroleum reserve.
Figure 1 presents the growth in Africa’s refined product imports between 2015 - 2023, as reported by the Energy Institute. In 2023, Africa imported 133 million t of product, while exporting 30 million t. In net terms, imports accounted for 53% of demand.
The continued growth of oil demand in Africa, coupled with a refining sector that is both quantitatively and qualitatively substandard, continues to motivate countries to build new refineries. With imports supplying over half of demand, there is room, only as long as the capacity expansions can compete with foreign imports.
Refining: new planning parameters
Table 1 noted the 15 refining countries in Africa. Some existing refineries process little crude, however. Other countries have had refineries in the past, but these have been closed. As noted, many African refineries are small and relatively unsophisticated. Some were built decades ago in the 1960s, 1970s, and 1980s.
As time passed, infrastructure aged, and the costs of repair, maintenance, and upgrading rose beyond what was rational to produce fuel that no longer met international quality standards. Refining technology advanced remarkably as industrialised nations began to progressively tighten fuel quality standards. Africa was considered one of the last places on earth where refineries were still able to market poorer quality fuels. Indeed, Algeria was the last country in the world to fully phase out the use of leaded gasoline, officially achieving this in July 2021. Sub-Saharan Africa had phased out leaded gasoline by 2006, beating Algeria by 15 years. In contrast, however, Japan fully banned leaded gasoline 20 years prior, in 1986. Africa has lagged behind the rest of the world for decades.
Table 2. African countries without petroleum production
There were many reasons African countries have sought to build refineries, including:
n National sovereignty.
n Strengthening regional influence.
n Fuel supply security.
n Capturing value-added from processing domestic crudes.
n Import substitution.
n Production of exportable commodities.
n Using refineries as anchor sites to stimulate additional economic development.
n Integrating refineries with petrochemical plants.
These reasons still exist, and many African countries have plans to build or expand their refineries. These include Nigeria, Angola, Ghana, Algeria, Uganda, and Libya. Sierra Leone plans to resuscitate its small refinery, closed since the mid-1980s. However, building new refineries or fully modernising older ones with new technologies is costly. African refinery utilisation rates remain anaemic, estimated at approximately 55%. Asia and the Middle East have been completing massive refinery expansion programmes, and they manage to provide high-quality fuel to smaller markets in Africa at a lower cost. Currently, refinery construction projects must pass rigorous economic analysis as well as meeting some or all of the previous listed reasons. Moreover, financing oil refineries has grown more difficult as international banks and lending agencies are pulling away from fossil energy projects in favour of renewable energy projects.
Nigeria’s Dangote project changed the regional market by satisfying multiple goals, by ‘super-sizing,’ by integrating refining with petrochemicals, and by getting there first. At 650 000 bpd, it is Africa’s largest refinery, and one of the largest in the world. The refinery began processing crude in 2024, and it began exporting gasoline and jet fuel by the end of that year. In 2025, it achieved 85% capacity, with plans to reach full capacity in 2026. Nigeria’s fuel prices have gone down, its import bill has fallen, and it is earning export revenue.
Because the region remains import-dependent, and because demand is forecast to continue to grow, the
Dangote project has not derailed other refinery plans. However, it could postpone some that are not as far along as others. Nigeria is also restarting the Port Harcourt and Warri refineries, and it is adding capacity by installing smaller, modular refineries. Ghana is also using small modular refineries to decentralise refining and increase resilience. Also in Ghana, China’s Sentuo Group is building Phase 2 of the Sentuo Oil Refinery. In Angola, the China National Chemical Engineering Co. (CNCEC) is building the 200 000 bpd Lobito refinery. Uganda’s long-awaited 60 000 bpd Hoima refinery is now moving forward after recently signing an implementation agreement an investment company in the UAE.
Pragmatism today, flexibility tomorrow
Africa is such a vast and diverse continent that summarising its petroleum sector is challenging. There are major oil producers and OPEC members with decades of experience in global markets. There are potential producers hoping to find partners to develop resources. There are countries without commercial reserves. There are major refiners, there are countries with modest, antiquated refineries, and there are countries wholly reliant on fuel imports. There are major coastal installations with extensive petroleum infrastructure, contrasting with landlocked areas receiving fuel by truck.
While many African governments hope to expand their upstream and downstream oil industries, most have grown more pragmatic and flexible in their strategies. 21 of the 54 countries produce oil. 33 do not, but many hope to change this. 15 have refineries, though some process crude sporadically if at all. There are continual plans to upgrade, modernise, or build grassroots refineries, but few move forward unless they satisfy multiple objectives, and all must look to the competitive horizon. In recent years, social and environmental goals have been intertwined with energy policies. International agencies favour clean and renewable energy investments rather than fossil energy. However, some African companies believe that natural gas development should be favoured as a medium-term option if it is less costly than renewables.
So much of Africa’s future depends on its young, vibrant population. It is difficult to overstate the importance of protecting public health, education and welfare, fostering innovation, and satisfying domestic demand. The global environment has changed also, and African countries will need to depend more on their own people and their neighbours. Pragmatic, cost-conscious strategies today can ensure flexibility tomorrow.
References
1. hts.usitc.gov
2. www.census.gov
3. https://www.energyinst.org › statistical-review
4. energychamber.org
Figure 1. Africa’s rising product imports, 2015 - 2023 (million t).
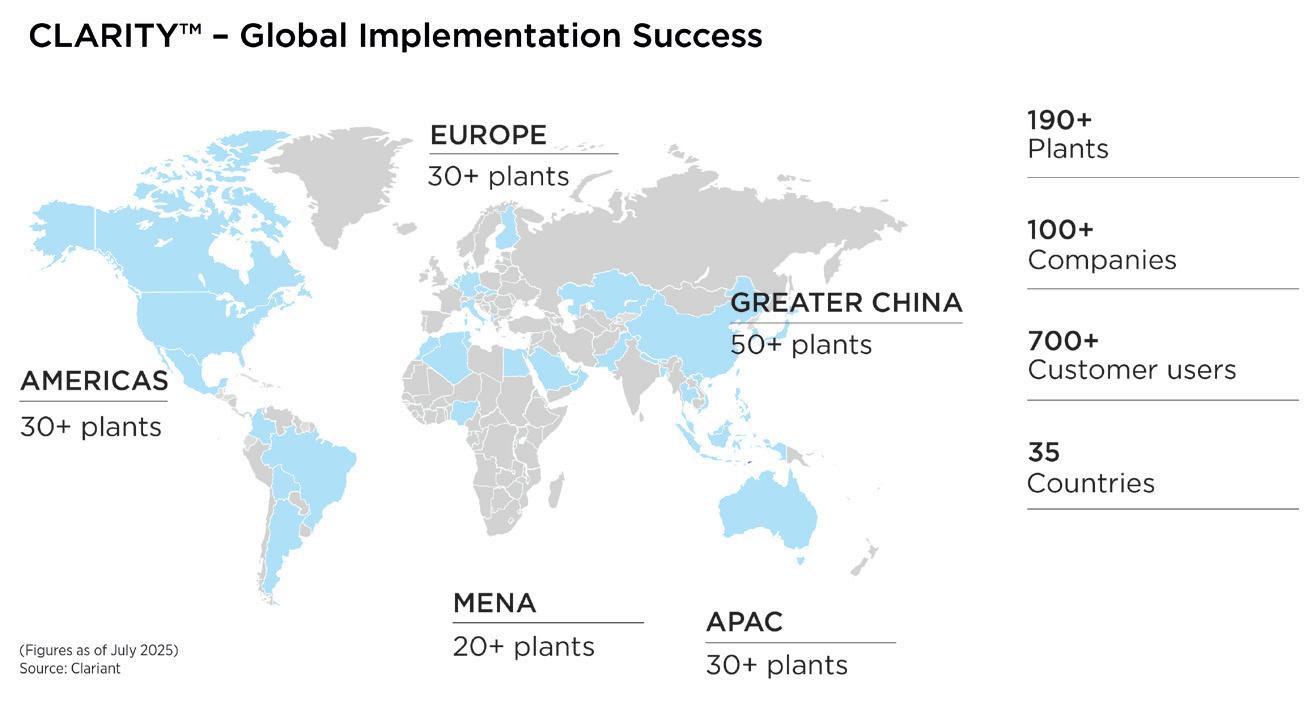
The CLARITY platform, developed by Navigance, emerged from this initiative and now supports over 190 plants globally (Figure 1). This widespread adoption demonstrates the value of automating data sharing, eliminating manual processes prone to human error, and enabling evidence-based, collaborative decision-making.
From data visualisation to operational intelligence
With this robust data foundation established, the focus has shifted toward extracting deeper insights and value from the accumulated information. The initial phase of digitalisation provides secure, customisable dashboards for real-time performance monitoring, creating the necessary infrastructure for more advanced applications. This progression represents a natural evolution from basic data visualisation to operational intelligence.
The next frontier leverages sophisticated AI systems and ML tools to translate raw operational data into actionable insights. These technologies enable automated pattern recognition for catalyst health monitoring,
predictive analytics for performance forecasting, and anomaly detection for risk mitigation. By building upon the standardised data architecture already in place, these advanced capabilities can be deployed more efficiently and effectively, accelerating the path toward fully optimised catalyst operations.
Augmented catalyst monitoring, operation, and optimisation
Building on these foundations, catalyst management has become a primary focus for digital innovation, given its critical role in chemical production. As one of the most influential factors affecting plant efficiency, safety, and sustainability, catalysts present a high-value opportunity for advanced analytics applications.
Clariant’s CLARITY Prime represents this new generation of AI-powered systems, employing sophisticated learning technologies that enable predictive maintenance, enhanced performance insights, and advanced technical support. The platform uses ML to project catalyst performance throughout its lifecycle, allowing production plants to adjust operating parameters proactively, schedule maintenance more effectively, and optimise processes based on data-driven forecasts. This approach represents a significant advancement from traditional monitoring methods, transforming how catalyst performance is managed in chemical operations.
Figure 1. CLARITY’s global implementation as of May 2025 demonstrates widespread adoption across 190+ plants in 35 countries, with strong presence in Greater China (50+ plants) and balanced distribution across other regions. (Source: © Clariant).
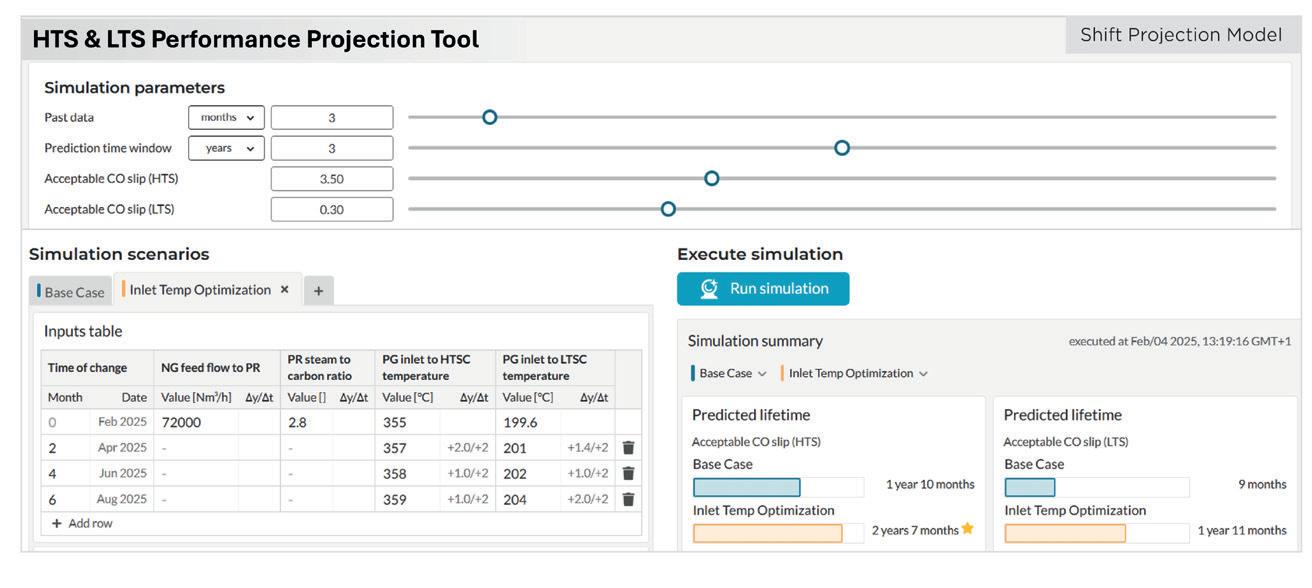
Figure 2. CLARITY Prime dashboard showing the high temperature shift (HTS) & low temperature shift (LTS) catalyst performance projection tool used at Indorama’s ammonia plant. The modelling interface enables data-driven decision-making for catalyst lifecycle management and maintenance planning. (Source: © Clariant and CLARITY).
Case studies: ammonia production
Indorama: enhanced stability and efficiency
CLARITY Prime was first adopted at Indorama in one of its ammonia trains at its world scale fertilizer manufacturing facility in Port Harcourt, Nigeria. The implementation of the technology involved close collaboration with Indorama, whose extensive operational experience and process expertise helped shape it into a user-focused solution tailored to real-world operational needs. The result is an AI-powered service that provides the plant with advanced catalyst monitoring, including automated health alerts based on real-time performance indicators. These alerts enable proactive measures to maintain production stability, while ML-based projections help optimise catalyst performance throughout its lifecycle. Additionally, the service provides direct access to catalyst experts, ensuring immediate guidance and troubleshooting support when needed.
The implementation of the system at the plant has demonstrated tangible benefits across multiple operational areas. In one instance, automated alerts helped Indorama’s team collaborate with technical experts to optimise the high temperature shift (HTS) reactor’s inlet temperature, thus improving carbon monoxide (CO) slip performance. During plant load changes, digital monitoring has enabled precise adjustment of the primary reformer firing to maintain optimal operation. Furthermore, catalyst performance projection has significantly enhanced decision-making for turnaround planning based on economic considerations, allowing for more strategic resource allocation. (Figure 2).
Yara: interactive optimisation raises production
Yara has adopted CLARITY across its worldwide network of ammonia production facilities. One of its plants has transitioned to implement CLARITY Prime, enabling advanced capabilities, including innovative soft sensors for critical measurements, a catalyst lifetime projection tool, and an interactive shift optimiser.
Soft sensors use mathematical models, existing sensor signals, and process knowledge to estimate critical variables when physical instruments encounter errors. Their integration proved particularly valuable at one of Yara’s ammonia plants when a gas chromatograph (GC) experienced technical issues. Due to reliable CO concentration estimates at the low temperature shift (LTS) reactor outlet, GC failure was quickly identified, allowing reliable maintenance of shift reactor performance.
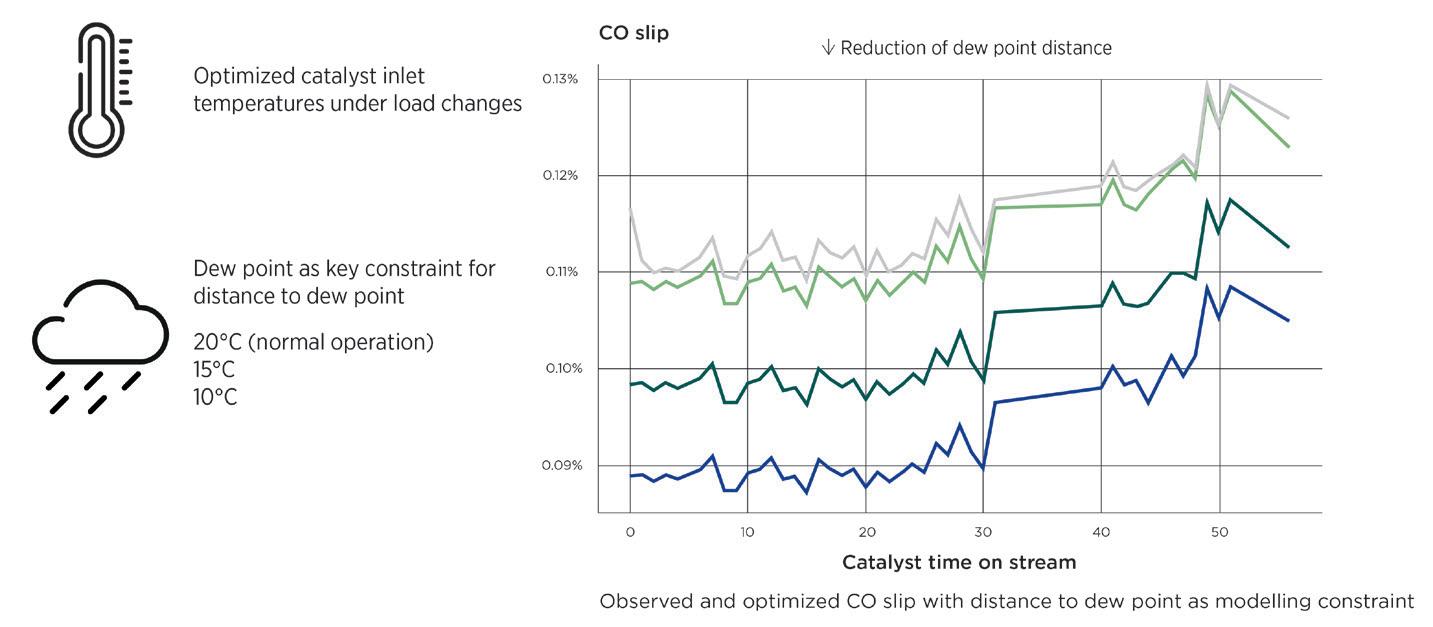
The interactive shift optimiser combines first-principle models with plant-specific ML to enable independent optimisation of shift section performance. For Yara, this has allowed quick optimisation of setpoints after load changes to minimise CO slip and maximise production. Retrospective analysis of operating data has uncovered daily energy savings potential of 20 - 40 GJ at a single plant, which translates to annual cost reductions of €100 000 - 200 000 (Figure 3). Overall, the enhanced availability and accuracy of
measurements have allowed Yara’s plants to safely operate closer to design limits.
Expanding augmented services across chemical processes
Propylene production: advanced monitoring and troubleshooting
Typical challenges in propylene production include detecting feed contamination, optimising catalyst performance, and maintaining high selectivity. These issues often cause production disruptions and require extensive troubleshooting. CLARITY Prime’s AI-powered digital monitoring can now address these issues through advanced data analysis.
Plants using CATOFINTM technology benefit from continuous catalyst health assessment through pattern recognition algorithms that detect subtle performance shifts before they impact production. Predictive analytics forecast catalyst behaviour and recommend timely
Figure 3. Retrospective analysis showing optimisation potential in Yara’s ammonia plant through intelligent dew point constraint management illustrates how CLARITY Prime’s predictive analytics can optimise carbon monoxide (CO) slip while maintaining safe operating parameters. (Source: © Clariant and CLARITY).
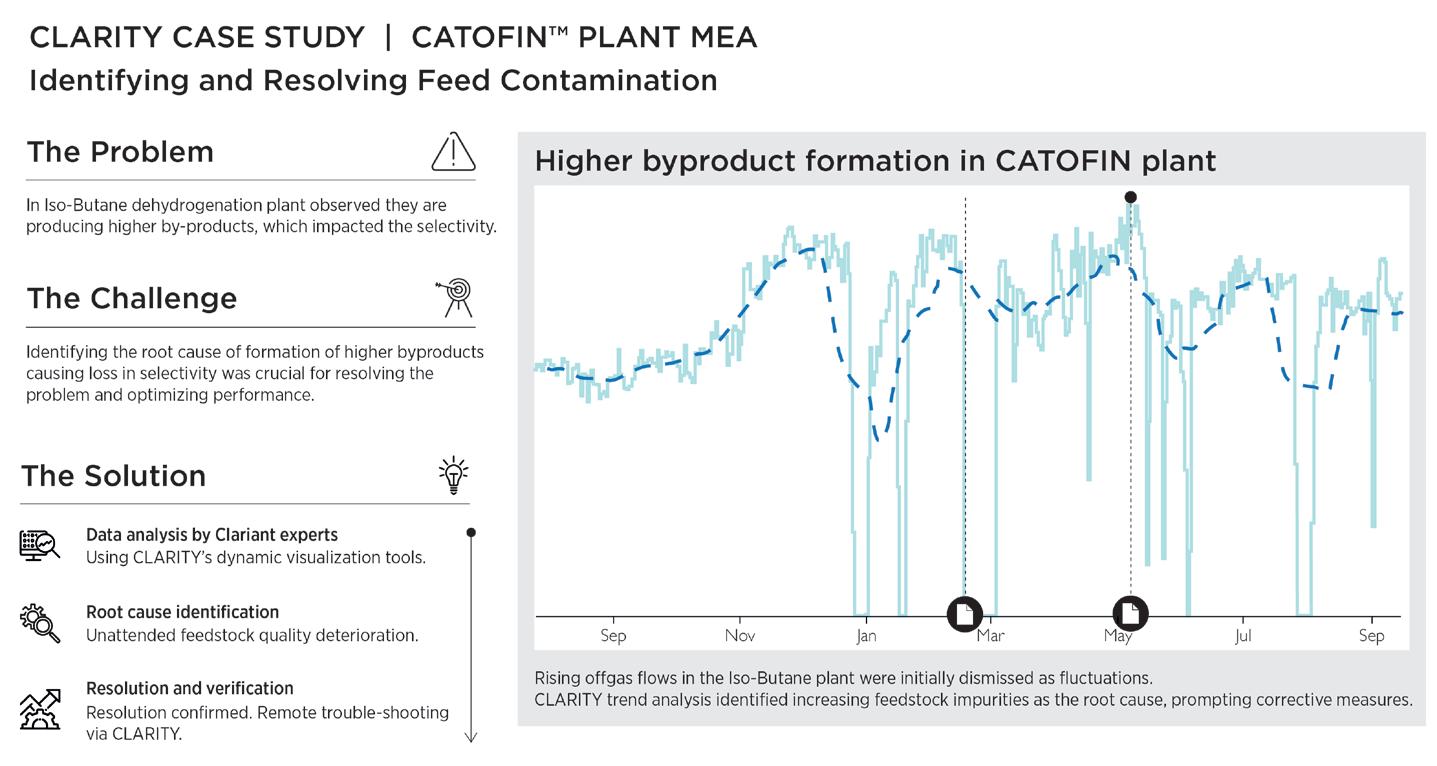
Figure 4. Case study of a CATOFIN plant where CLARITY Prime identified feedstock quality deterioration causing higher by-product formation, enabling remote troubleshooting and resolution through advanced data visualisation and expert analysis. (Source: © Clariant and CLARITY).
interventions, while anomaly detection helps to identify deviations from optimal operating parameters.
A recent case at a CATOFIN dehydrogenation plant demonstrated the value of digital analytics when operators faced increasing by-product formation affecting selectivity (Figure 4). Through sophisticated data analysis and correlation tools, experts remotely identified the root cause as increasing feed contaminants (propene). The platform revealed an 81% correlation between feed impurity levels and increased off-gas flow – an insight conventional monitoring would have missed.
This remote troubleshooting capability enabled a targeted calibration check, confirming no catalyst performance issues and providing a clear path to resolution. The digital approach improved selectivity while eliminating costly on-site investigations and preventing unnecessary catalyst replacement.
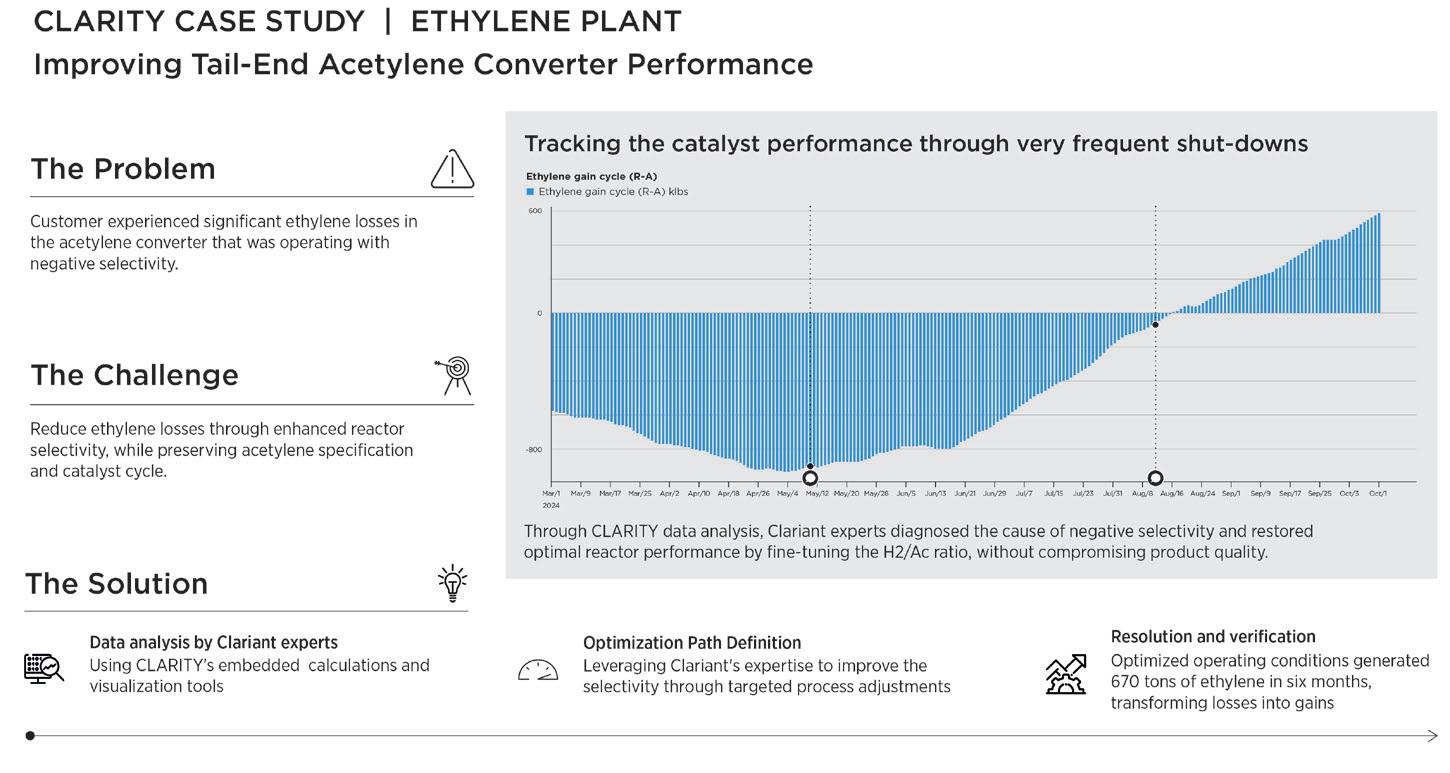
Ethylene production: streamlined steam cracker operation
Managing multiple C2 tail-end selective hydrogenation reactors presents significant challenges for petrochemical engineers due to the complexity of processes. CLARITY Prime addresses these issues through a variety of digital technologies, including upset prediction, operation conditions simulation, virtual hydrogen analysis, performance tracking, and automated alerts.
Upset prediction tools are particularly valuable as they address the persistent challenge of maintaining on-spec performance during feed rate fluctuations, acetylene concentration shifts, or CO instabilities. Using proprietary, reactor-specific modelling, these predictive systems deliver early warnings of potential acetylene leaks and reactor disruptions before they escalate into costly off-spec events.
The operations conditions simulator allows optimisation of reactor performance through scenario modelling. By simulating the effects of inlet temperature fluctuations, hydrogen-to-acetylene ratio changes, and acetylene feed variations on the weighted-average bed temperature,
operators can precisely adjust parameters to ensure consistent acetylene conversion (Figure 5).
Together, these tools help to streamline monitoring, optimise performance, detect potential upsets, and model operational changes prior to implementation. This comprehensive approach supports maximum unit efficiency while maintaining strict quality standards in today’s demanding petrochemical environment.
Conclusion
As the chemical industry continues its digital evolution, AI will play an increasingly central role in catalyst management – one of the most critical levers for plant performance, efficiency, and sustainability. The current implementations already demonstrate how ML can transform plant data into actionable intelligence – from detecting catalyst degradation patterns early to projecting performance under varying operational conditions. This enables a shift from reactive troubleshooting to predictive and prescriptive support.
Looking ahead, the focus will be on continuously evolving these tools based on operational data, learned insights, and direct feedback from users. This iterative development approach ensures that digital solutions remain relevant, practical, and closely aligned with the real needs of plant teams. At the same time, the scope of advanced digital services will expand to additional catalyst applications, broadening the value of these tools across technologies and industries.
As more data becomes standardised and accessible through digital platforms, the potential for cross-plant benchmarking, global performance optimisation, and even generative AI interaction models becomes tangible. Catalyst management will continue to evolve with AI-assisted tools, where engineers can simulate scenarios, receive intelligent recommendations, and make data-backed decisions quickly and with confidence.
By 2030, Clariant aims to provide technical support to customers fully digitally, enabling faster, more targeted collaboration and maximising the benefits of data-driven decision-making. This represents an ongoing transformation in how expertise is delivered, shared, and scaled globally.
Figure 5. Performance improvement case study at an ethylene plant where CLARITY’s embedded calculations and visualisation tools helped optimise the acetylene converter operation, resulting in 670 t of additional ethylene production over six months. (Source: © Clariant and CLARITY).
The vision is clear: AI will not replace human expertise, but it will amplify it, empowering plant teams to navigate complexity with greater precision, reduce operational losses, and extend catalyst lifetimes. This future is already being crafted, driven by the belief that smarter operations lead to greater efficiency and sustainability – benefitting both people and planet.
Acknowledgements
Clariant gratefully acknowledges Indorama and Yara for their close collaboration during the implementation of CLARITY Prime.
Cindy Crow, AVEVA, USA, considers the opportunities and challenges that new technologies, such as artificial intelligence (AI) and generative AI (Gen AI), could have for digital hydrocarbon processing.
The hydrocarbon processing industry has been undergoing significant transformations due to the rapid advancements in digital technologies. Among these advancements, artificial intelligence (AI) and generative AI (Gen AI) have emerged as powerful tools that promise to enhance operational efficiencies, improve decision-making, and drive innovation across the hydrocarbon value chain. While there is considerable optimism regarding the potential of these technologies, many hydrocarbon processing companies struggle to realise sustainable business value. This article explores the dichotomy between the excitement surrounding digital technologies in the
hydrocarbon processing industry and the actual opportunities they present. Furthermore, it highlights five critical elements that must be implemented to effectively harness the full potential of advanced analytics, AI, and Gen AI.
The promise of digital technologies in the hydrocarbon processing industry
The hydrocarbon processing value chain is complex, involving multiple stages across refining, petrochemicals, transportation, storage, and distribution. Each of these stages generates vast amounts of data that, when leveraged effectively, can lead to significant improvements in efficiency, safety, and profitability. The integration of
digital technologies, particularly advanced analytics and AI, holds promise for transforming this data into actionable insights and business value. These are the key areas of opportunity:
n Optimising operations: AI can analyse historical data to predict equipment failures, optimise maintenance schedules, and enhance operational efficiency. For instance, predictive maintenance models can help anticipate equipment failures before they occur, thereby reducing downtime and maintenance costs.
n Improving decision-making: advanced analytics enables real-time monitoring of operations, providing decision-makers with critical insights to make informed choices. This capability is essential in a volatile market where rapid adjustments are necessary to maintain competitiveness.
n Enhancing safety and compliance: AI-driven solutions can identify potential safety hazards and compliance risks by analysing operational data and environmental conditions. This proactive approach helps in mitigating risks and ensures regulatory compliance.
n Driving innovation: Gen AI offers the ability to simulate various scenarios and outcomes, allowing hydrocarbon processing companies to explore innovative solutions for complex challenges. This can lead to new business models, enhanced product offerings, and improved customer experience.
Despite these promising applications, the reality for many hydrocarbon processing companies is that the transition to a digital-first approach has not been as seamless as anticipated. The struggle to translate technological advancements into tangible business value raises questions about the feasibility and implementation of these digital initiatives.
The challenge of delivering sustainable business value
The hydrocarbon processing industry is characterised by its capital-intensive nature and the long-term investments required for infrastructure development. While there is enthusiasm for digital technologies, many companies face
significant challenges in integrating these solutions into their existing operations. Some of the key hurdles include:
n Data silos: many companies operate with disparate systems that create data silos, making it difficult to access and analyse data comprehensively. This fragmentation hampers the ability to derive actionable insights and limits the effectiveness of AI applications.
n Lack of data governance: without proper data governance, organisations struggle to maintain data quality and consistency. Poor data quality can lead to inaccurate insights and undermine the credibility of AI-driven decisions.
n Resistance to change: the adoption of advanced analytics and AI often requires a cultural shift within organisations. Employees may resist changes to established processes, leading to slow adoption and underutilisation of new technologies.
n Skill gaps: the successful implementation of AI and advanced analytics requires a skilled workforce capable of interpreting data and leveraging these technologies effectively. Many hydrocarbon processing companies face challenges in attracting and retaining talent with the necessary expertise.
n Short-term focus: in a sector where short-term profitability is often prioritised, there may be reluctance to invest in long-term digital transformation initiatives. This short-sightedness can hinder the exploration of innovative solutions that could yield significant returns in the future.
Given these challenges, it is essential for hydrocarbon processing companies to adopt a strategic approach to digital transformation that focuses on foundational elements that can enable the effective use of advanced analytics, AI, and Gen AI.
Five critical elements for successful advanced analytics, AI, and Gen AI
To bridge the gap between this excitement and opportunity, hydrocarbon processing companies must implement the following five critical elements to harness the full potential of digital technologies:
Data management framework
A robust data management framework is critical for enabling effective advanced analytics and AI. This encompasses both unstructured and operational data. Hydrocarbon processing companies should establish a centralised data repository that integrates data from various sources, ensuring that it is accessible for analysis. The quality of the data must be a primary focus.
Figure 1. Strategic alignment and operational excellence.
Key considerations:
n Implement data integration tools that can consolidate data from different systems.
n Establish data standards and protocols to ensure consistency in data collection and storage.
n Create a data architecture that supports scalability and adaptability as new data sources emerge.
Governance and leadership with subject matter expert (SME) system of record ownership
Effective governance and leadership are essential for ensuring accountability and ownership of data systems. Companies must implement systems of record that are asset-based and encompass operational data, maintenance data, engineering data, geospatial data, and financial data.
Key considerations:
n Define clear roles and responsibilities for data ownership at various organisational levels. It is best to have a SME provide the leadership for their respective areas of domain expertise.
n Establish a governance framework that promotes accountability and continuous improvement in data management practices.
n Ensure alignment between systems of record and business objectives to enhance decision-making.
Layers of bidirectional integrated analytics and visualisation
Developing a comprehensive analytics framework is crucial for leveraging operational data quality. This framework should include the following components:
n Basic object model: tags and associated metadata should be linked to an asset using asset class templates, providing a structured approach to data organisation.
n Descriptive analytics: assets and their associated attributes should describe the asset characteristics, enabling deeper insights into performance and behaviour.
n Diagnostic analytics: this layer involves adding calculations, event frames, and notifications to facilitate proactive, exception-based operations. Key features should include the ability to investigate events, develop expressions, create event triggers, and back cast through high-fidelity historical data to find events and determine causality.
n Simple predictive analytics: through utilising formulaic, first-principal, or rule-based expressions, organisations should be able to predict future performance while comparing planned vs actual outcomes with notifications.
n Prescriptive analytics: more advanced analytics leveraging AI and machine learning (ML) should be employed to provide guidance, effectively replicating the insights of SMEs.
n AI and learning: AI and Gen AI, along with advanced large learning models (LLMs), should be utilised to predict and respond accordingly to optimise hydrocarbon processing operations.
Redefinition of the partnership between OT and IT
An effective digital transformation requires a redefined partnership between operational technology (OT) and information technology (IT). This partnership should clarify roles and responsibilities, ensuring that both domains collaborate effectively.
Key considerations:
n Foster a collaborative environment where IT and OT teams work together to leverage the strengths of both disciplines.
n Enable SMEs to actively participate in the development and implementation of AI and Gen AI solutions.
n Align the goals of IT and OT with the overall business strategy to ensure that digital initiatives support operational excellence.
Alignment between business strategy, operational excellence, and digital strategy
Successful digital transformation hinges on the alignment of business strategy, operational excellence, and digital strategy. Hydrocarbon processing companies must define clear objectives and metrics to measure the success of their digital initiatives. This key concept is illustrated in Figure 1.
Key considerations:
n Develop a digital transformation roadmap that outlines the steps needed to achieve desired outcomes.
n Regularly assess and adjust strategies based on evolving market conditions and technological advancements.
n Engage stakeholders at all levels to ensure alignment and buy-in for digital initiatives, fostering a culture of collaboration and continuous improvement.
Conclusion
The hydrocarbon processing industry stands at a crossroads, with the potential to leverage digital technologies like AI and Gen AI for transformative growth. While there is significant excitement and optimism surrounding these advancements, the reality is that many companies face challenges in delivering sustainable business value. By focusing on foundational elements such as strategic data management, governance, integrated analytics, collaboration between OT and IT, and alignment with business objectives, companies can effectively harness the opportunities presented by digital technologies. Ultimately, the success of the hydrocarbon processing sector in the digital age will depend on its ability to embrace these changes and adapt to the evolving landscape of energy production and consumption.
Note
• This article is published with contributions from Craig Harclerode while at AVEVA.
Shane Harvey, Justin Iwinski, and Mario Valdivieso, Ebara Elliott Energy, USA, discuss important considerations in making the switch to electric compressor drivers in ethylene cracker applications.
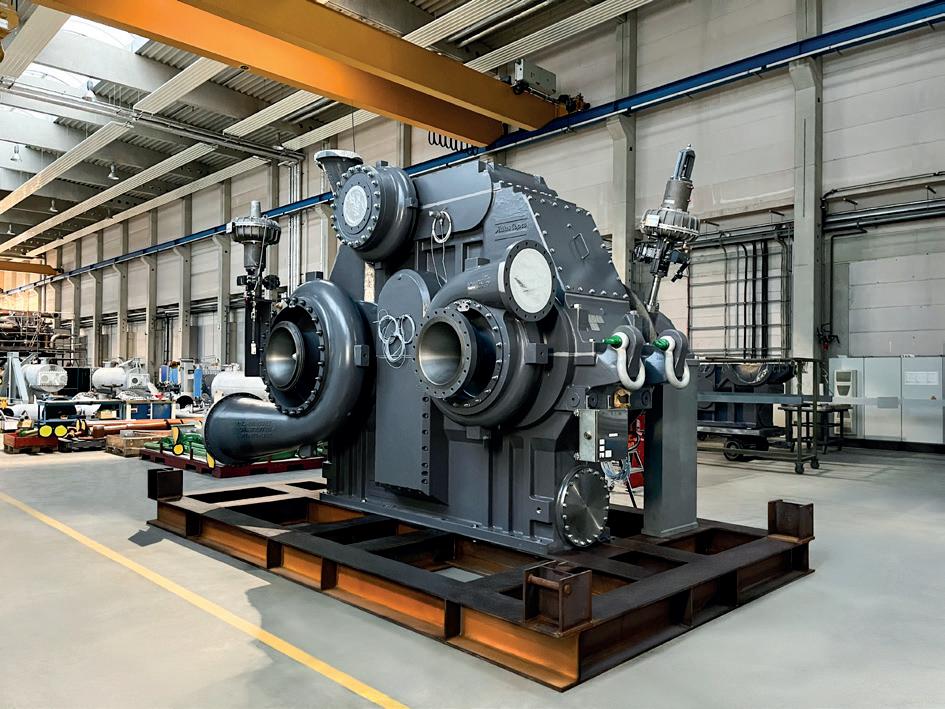
Ethylene compression trains (Figure 1) have traditionally been steam-turbine driven because of high power demand and the availability of steam generated from the cracking process. Global trends to curtail emissions and increase efficiency have highlighted additional benefits of electrification (motorisation) of critical processes, including ease of maintenance and the ability to recover power from the generated steam. But reaping the benefits is not as simple as dropping an electric motor into a functional process. Selecting the best driver configuration requires careful evaluation of the process requirements, often necessitating significant changes to the train startup and operating philosophy.
Typical compression services in ethylene production include multistage iso-cooled arrangements for charge gas and cracked gas, and sideload refrigeration arrangements for ethylene, propylene, and propane, each with unique process characteristics. Simulation tools can be used to ensure that a motor is sized properly for process conditions and operational expectations, and to evaluate the torque requirements during acceleration for various electrical configurations. These configurations include direct-on-line (DOL), variable frequency drive (VFD), or soft-start current limiting devices. A major hurdle for effective analysis is understanding how certain parameters affect the starting load torque of a compressor. This article will identify the critical parameters, and demonstrate the sensitivity of each parameter on the simulation output.
Critical startup simulation parameters
The two categories of parameters needed to accurately determine the compressor gas load and required acceleration torque are compressor design details and loop configuration details. Compressor design details are available from the original equipment manufacturer (OEM), and the loop configuration details can be obtained from the site and/or operations.
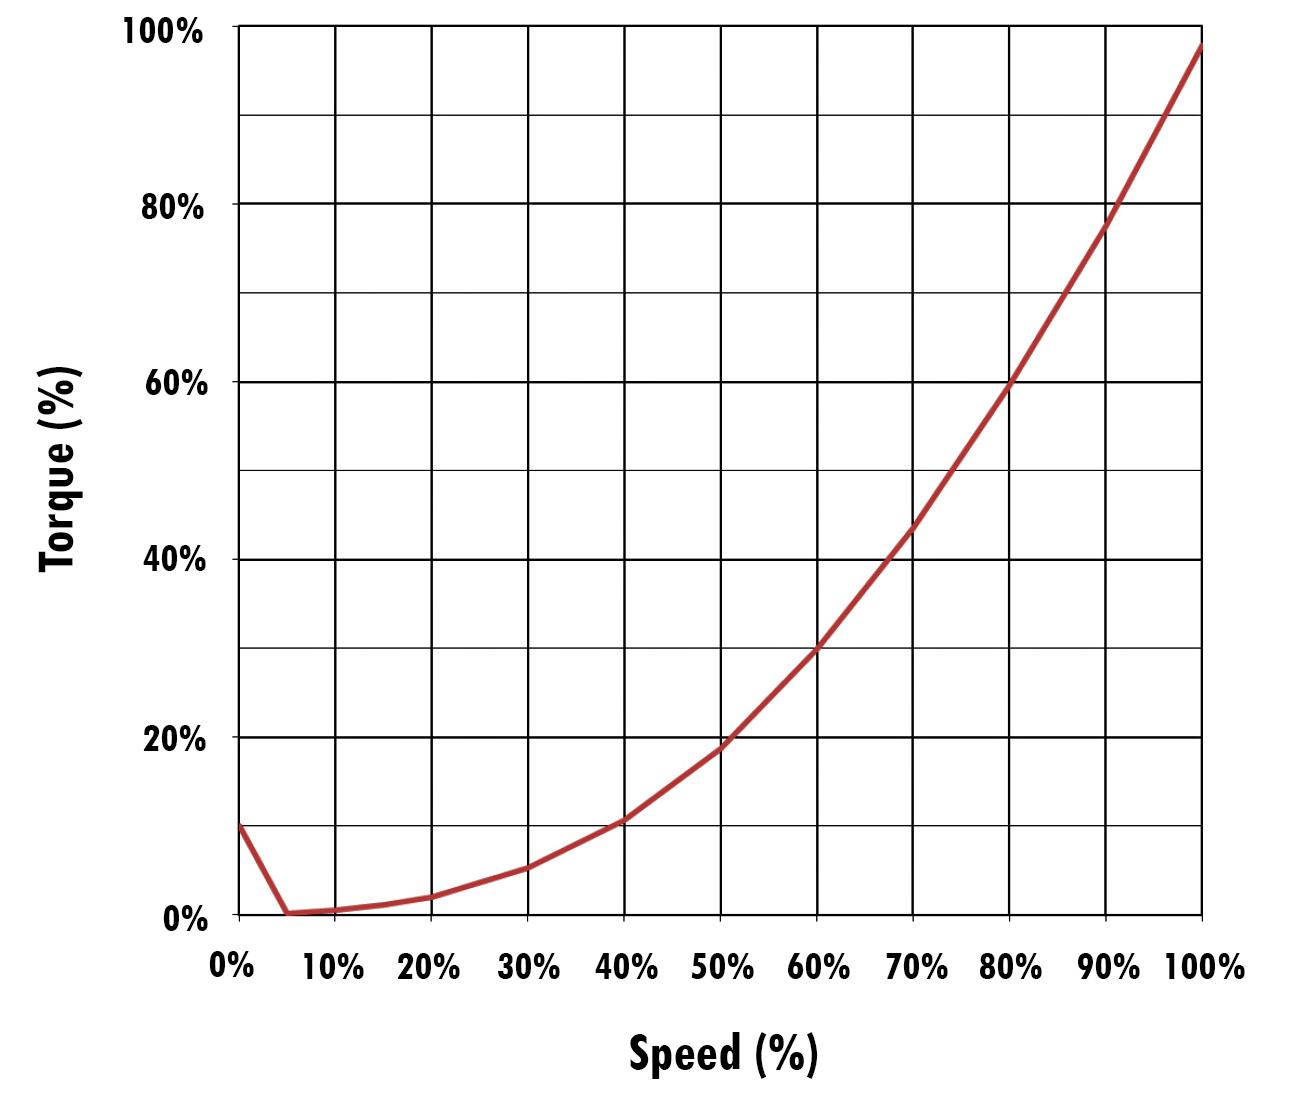
The parameters are used with simulation tools to develop a compressor load curve, also known as a speed vs torque curve, which illustrates the torque required from the motor to accelerate the compressor through the speed range to a point where performance control can be enabled (Figure 2). This speed may be the low end of the continuous operation speed range for a variable speed drive, or it may be motor rated speed in the case of a fixed speed drive. The relationship of torque and speed is a primary gauge for evaluating parameter sensitivity.
Compressor design details
Compressor design details include performance information, which maps the gas conditions at the inlet to the expected discharge conditions, given the head/efficiency curves at a given speed. The power absorbed by the compressor is also derived from the performance information.
Loop configuration details
Loop configuration details relate to parameters external to the compressor, such as auxiliary equipment datasheets, piping and instrumentation diagrams (P&IDs), process licensor documentation, or operator experience/site trend data. Assumptions related to the motor operation, such as acceleration time/schedule and available torque, are included in
the configuration details. When switching from a steam turbine to an electric motor driver, these assumptions will be entirely new. Skillful application of the starting assumptions can result in efficient torque utilisation from the motor.
Parameter startup torque sensitivity
The advantages of each motor type can be quantified in a startup simulation where the relevant parameters may be amplified or muted by the drive type selection. The primary value used to compare torque between cases is the torque margin (TM), defined as the difference between available torque from the motor and compressor load torque, expressed as a percentage of the available motor torque.
TM (%) = ττmotor - ττ load) / ττmotor
In accordance with American Petroleum Institute (API) specifications, conventional sizing of an electric driver is based on 110% of the highest power required for any of the
specified operating conditions. API further specifies that a 10% torque margin must be maintained between the driven equipment load torque and the motor developed torque during acceleration. Evaluation of this margin is especially critical on DOL configurations where the motor torque capability, already limited in the mid-speed range, must consider a potential voltage drop to 80% rated voltage. Soft-start capability must consider a current-limited motor torque curve. Despite these limitations, the TM during startup should not be permitted to influence the motor rating because of the potential for a negative impact to operating efficiency. Therefore, it is optimal to find a starting sequence that fits within the power constraints of a conventionally sized motor.
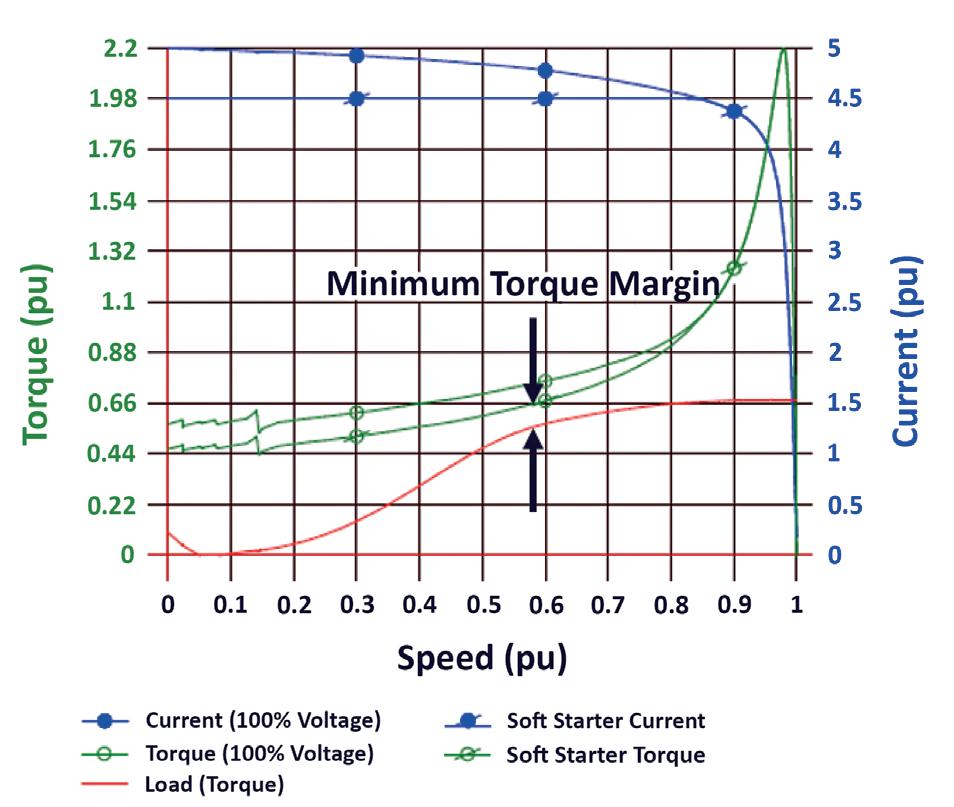
Figure 3 illustrates a soft-start motor capability curve and simulated compressor load curve, with torque availability reduced through a current-limiting soft-start device. Despite lowering motor torque availability, limiting current may also benefit the starting load torque profile by enabling a longer acceleration time, thus minimising the acceleration torque required.
Speed and acceleration schedule
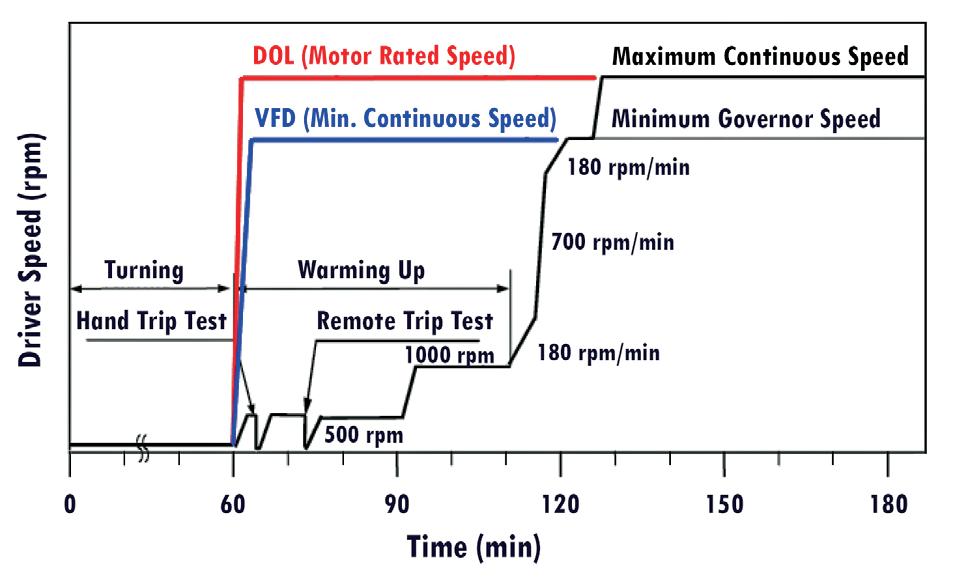
A steam turbine acceleration schedule may exceed an hour in duration. VFD acceleration time is adjustable, generally several minutes in duration. DOL acceleration must be very fast due to the heating associated with the large current draw; overheating risk can manifest in less than 30 seconds. A notational overlay on the steam turbine acceleration schedule highlights the time scale differences (Figure 4).
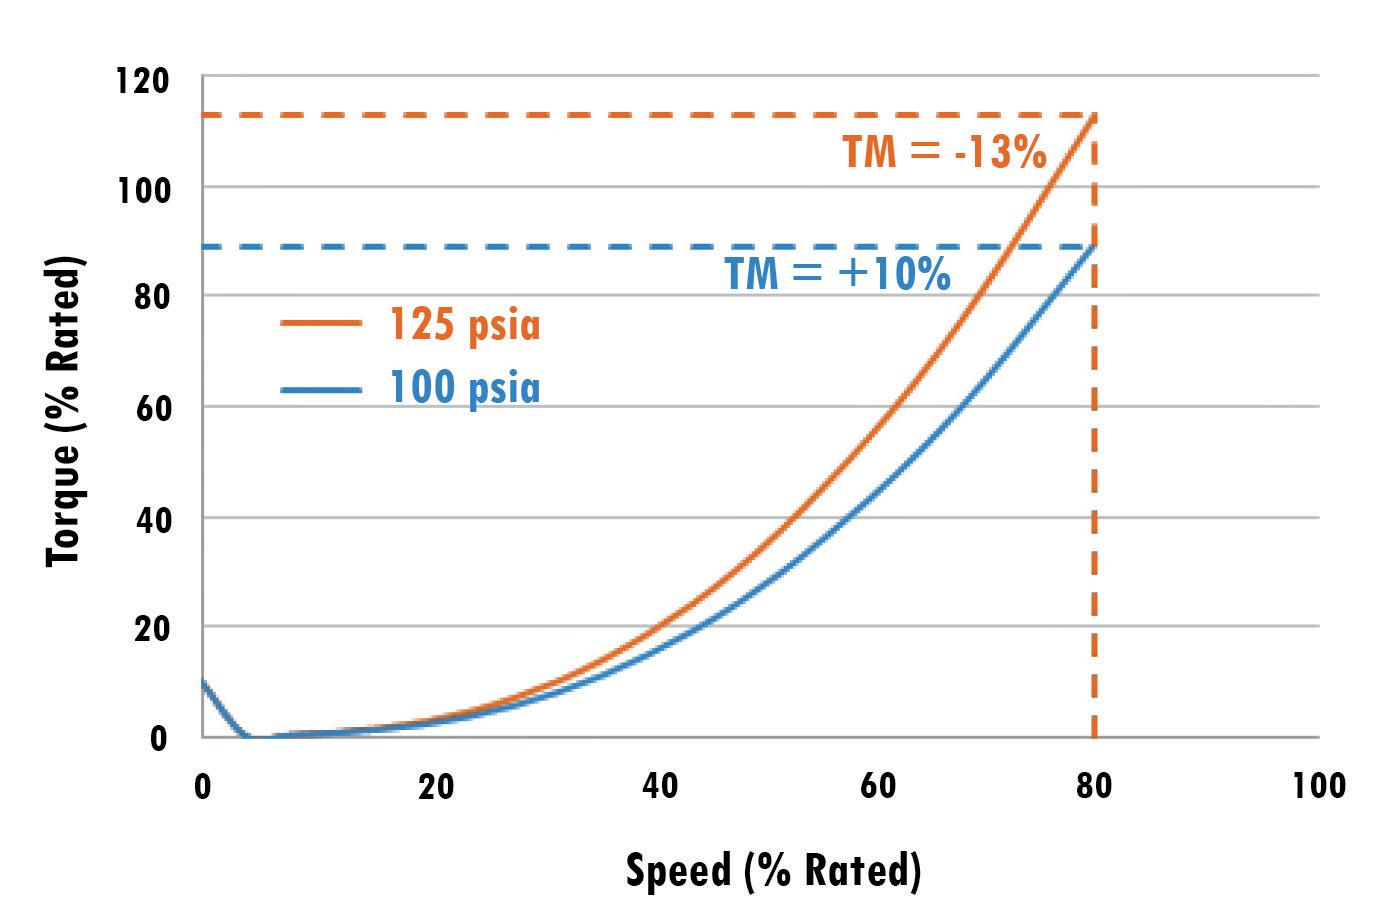
In terms of torque, the slower acceleration of a VFD and the ability to limit the acceleration to the minimum continuous speed of the compressor is a distinct advantage over DOL. When developing the electric motor startup sequence for the compressor, the final speed and ramp rate can be manipulated to minimise the torque demands of the motor. Figure 5 illustrates a comparison of a VFD acceleration for a single-section mixed refrigerant compressor, assuming a 120-second linear ramp with equivalent starting conditions. The only difference is the final speed: 80% and 100% rated speed.
Initial starting conditions (pressure/temperature)
Because compressor load is proportional to inlet pressure, initial conditions can be a major contributor to startup load torque for ethylene production services, especially in refrigeration loops that can see vapour pressures much higher than compressor design. Using the example from Figure 5 and assuming a fixed-speed application, it is not practical to size the motor to 165% of the conventional rating to accommodate acceleration to 100% speed. Instead, the starting conditions can be manipulated to manage torque.
Figure 6 illustrates a comparison of a VFD acceleration for a single-section mixed refrigerant compressor, assuming a 120-second linear ramp to 80% rated speed with different starting loop pressures. This parameter may be difficult to change because it is largely based on gas inventory, loop volumes, and process/ambient temperatures. In any case,
Figure 1. Electric drive double-flow large frame compressor typical for stage 1 crack gas service.
Figure 2. Sample speed vs torque curve.
the startup conditions must be specified for accurate torque modelling.
Throttle valve effects (process control method)
A VFD configuration can mimic the speed variation of a turbine driver, but a DOL fixed-speed configuration may need some other type of process control. A suction throttling valve (STV) can provide a means of process control while also providing a mechanism to reduce the
compressor inlet pressure during startup. This method can be employed on VFD configurations specifically for the purpose of reducing starting torque when accelerating with very high system loop pressures.
Downstream pressure
The system resistance downstream of the compressor is another factor when evaluating startup load torque. If the compressor must be started against a closed discharge block valve, there will be no opportunity for mass to leave the loop during acceleration. However, if the conditions downstream support mass flow out of the compression loop to a downstream condenser/accumulator; for example, a slow acceleration via VFD can move mass out of the compressor loop, ultimately reducing the inlet pressure when the compressor reaches higher speed ranges.
System volumes (suction/sideload/discharge)
System volumes directly influence the pressure rate of change around the compressor loop. A large suction volume will resist changes in pressure, resulting in higher load torque for a given initial vapour pressure. Likewise, a larger discharge volume may allow a more torque-friendly redistribution of mass throughout the system, enabling an effective pressure drop at the compressor inlet.
This volume effect is why locating an STV near to the compressor inlet results in a more favourable pressure drop and reduced torque load. If an STV is placed upstream of the suction drum/recycle tie-in, it will be ineffective at reducing the pressure at the inlet due to the large trapped volume. Recovering the torque caused by a poorly placed STV may take a significant pressure reduction via flare or other means.
System inertia (gear ratio effects)
Electrification efforts may have a significant impact on compressor train inertia due to the relative increase in rotating mass of a motor rotor over a turbine. The system inertia contributes to the acceleration component of the load torque profile. A motor vendor will consider the compressor gas load plus the inertia of all rotating components (motor, couplings, gear, compressor) when evaluating if the system will reach the desired speed before motor thermal limitations come into play.
Another important concept to consider when switching from a direct coupled steam turbine to a motor-gear drive is the effect of a speed increasing gear on the train inertia. Reflecting the inertia of high-speed components to the low-speed shaft introduces a multiplier equal to the gear ratio squared, effectively increasing the total string inertia at the motor shaft. Preserving torque margin by other means discussed in this article will ensure that there is adequate acceleration torque available for the increased inertia, a concern that is nearly negligible in steam turbine drives.
Other considerations
Beyond the increased starting torque associated with faster acceleration schedules, other torque related effects can lead to compressor design implications. For example, the criteria for shaft end sizing are very different between
Figure 4. Steam turbine acceleration schedule with VFD motor and DOL motor overlay.
Figure 5. Torque comparison, varied final speed (VFD).
Figure 3. Induction motor capability curve (soft-starter) and compressor load curve.
Trust Ebara Elliott Energy for prompt, professional single-source on-site turbomachinery services.
Ebara Elliott Energy’s (EEE) field service organization offers trustworthy, on-site turbomachinery services no matter where equipment and operations are located. Our turnkey approach includes experienced personnel, complete tooling, and project planning and scheduling regardless of system size, process application, or equipment manufacturer. EEE field service crews are supported by our worldwide network of service centers.
Learn more about our range of service capabilities at elliott-turbo.com.
Trusted Solutions for a Sustainable Future
steam turbine and motor drive applications. Analysis for motor drives must consider steady-state and transient torsional excitations, as well as short circuit air gap torque on the order of 3 to 15 times the full motor rated torque. When switching from a steam turbine to an electric motor driver, it is likely that a larger compressor shaft end will be required.
Increasing the compressor shaft end size can force an increase in the size of the journal bearings, which are limited to the size of the bearing housing. Once the largest shaft end/bearing journal combination is exceeded, the only option on the compressor design is to go to the next compressor frame size. Larger shaft end sizes add to the overhung weight of the compressor, which can result in
rotordynamic complications. Changes to the compressor frame size can also affect the design head, efficiency, and overall performance of the compressor.
Various types of shutdown/startup scenarios that may be encountered should be shared with the simulation vendor. Air run dry out or nitrogen purge operations can see molecular weights that are different from design, resulting in varying flow rates and load torques. Condition variations with respect to cold/hot restarts, seasonal process gas changes, or seasonal ambient temperatures can also influence the speed vs torque curve. A comprehensive startup analysis should include these effects so that the highest load torque case is captured.
Summary
Dynamic simulation tools provide a method to evaluate the configuration and conditions surrounding a centrifugal compressor in order to optimise the startup sequence for efficient motor sizing. The optimisation process can include adjustments to a variety of configuration parameters that play a role in the dynamic behaviour of the system.
Simulations also provide the flexibility to experiment with alternate configurations/sequences in order to meet the existing plant electrical conditions, or to identify the scope of utility upgrades that may be necessary to support an electrification initiative. Understanding which parameters are fixed and which may be varied will help identify where a successful startup configuration can be engineered.
Figure 6. Torque comparison, varied initial pressure.
Oskar Schnabel and Markus Sauerborn, Atlas Copco Energas GmbH, Gas and Process Division, demonstrate how petrochemical companies can maximise gas process efficiency with compander technology.
The chemical and petrochemical industries are major sources of industrial CO2 emissions, which makes reaching carbon neutrality a major challenge for the sector. Nevertheless, almost all of the world’s leading chemical and petrochemical companies have committed to achieving net zero by 2050 and have developed their own decarbonisation roadmaps to achieve this goal.
Among the many different approaches formulated in these roadmaps, some key technologies and strategies
have become apparent; which include the use of green or blue hydrogen, carbon capture, utilisation, and storage (CCUS), the electrification of operations, the use of renewable energy, and improving energy efficiency. Recovering and converting all sources of waste energy into useful outputs significantly improves the energy efficiency of many operations. The advantage of this approach is that companies can reduce their energy consumption without the need to change core processes but rather tap into existing energy streams and reuse them.
A major focus in this regard is the recovery of waste heat, which is typically the largest form of energy lost in chemical and petrochemical plants. Key to recovering and reusing waste heat is compressor and expander technology,
key components of not only industrial heat pumps and mechanical vapour recompression (MVR), but also in the creation of liquid hydrogen, and in CCUS projects.
Recovering waste heat
The method of recovering waste heat depends on its temperature level. In many gas processes, waste energy is contained in a pressurised, hot waste gas stream. In this case, waste heat and also the pressure energy can be recovered by the application of an expander that has been used in the industry for a long time.
Recovery can be broadly categorised under two concepts:
n Converting the mechanical energy of the expander to pressure energy, where the expander is connected to a compressor stage.
n The expander is connected to a generator and the mechanical energy is converted to electricity.
Alternatively, a combination of the two can also be deployed. The expander is connected to a motor-generator compressor train, and either the expander reduces the load on the motor, or it runs the entire train, generating electricity and driving the compressor at the same time.
Gas expansion in radial inflow turboexpanders
Radial inflow turboexpander technology refers to the flow direction through the impeller/wheel, with capacity control via adjustable inlet guide vanes (IGVs) as seen in Figure 1. IGVs ensure efficiency remains stable at a high level over the turndown range. After entering the turbine housing, the gas flow is accelerated through the IGVs with Mach numbers of up to 1.4 before the impeller inlet. During acceleration through the IGVs, the static pressure decreases, resulting in a static enthalpy drop of around 50%.
The accelerated gas then flows through the impeller, where energy and momentum are transferred from the gas to the impeller and thus to the turbine shaft. The advantage of the radial inflow is its compact and robust structure at high-stage efficiency. The maximum possible enthalpy drop per expansion stage can be up to 220 kJ/kg. The minimum pressure ratio should be equivalent to an enthalpy drop no smaller than 30 kJ/kg. It is important to note that there does not have to be a high-pressure ratio: in many cases, most of the energy comes from the temperature and not from the pressure, and increasing the temperature has quite a large impact on the recoverable energy.
Typical applications of separate turboexpanderscompressor trains are hydrogen and natural gas liquefaction, cryogenic hydrocarbon separation in ethylene or propylene production, or air separation processes. Expanders are also employed in pressure let-down applications, where the gas pressure from a pipeline needs to be reduced, and the energy recovered and converted to electrical energy.
Compander technology
Derived from the words ‘compressor’ and ‘expander’, companders integrate both technologies in the same unit.
Figure 1. Expansion in expander stage.
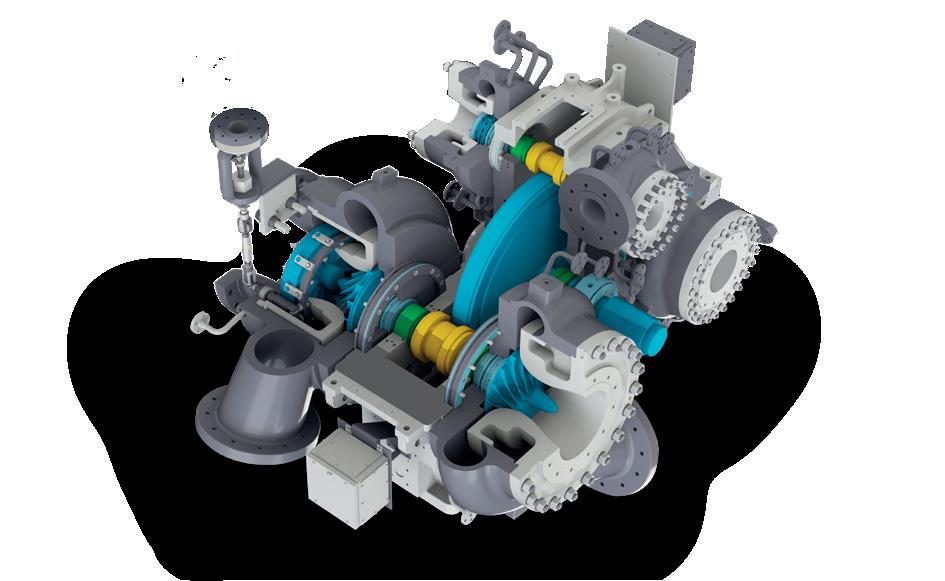
Figure 2. Compander.
Figure 3. 6 Stage GT-Series compressor.
This integration relies on integrally geared centrifugal compressor technology, which provides the design flexibility to realise the integration of the turboexpander into a centrifugal compressor (see Figure 2).
Characteristic of integrally geared design is the overhung impellers on the pinion shaft ends, which means each pinion can bear one or two opposing compressor or one or two opposing expander stages or the combination of both. Each pinion is connected to the bull gear via a dedicated gear toothing, so that the speed and power can be different for each rotor (a rotor consists of the pinion and impeller) as shown in Figure 3.
The power recovered from the expander stages is mechanically delivered to the compressor stages or – in the case of two expanders running back-to-back on the same pinion – diverted to the bull gear. In this case the expander pinion is an actual driver. The main driver just supplies the balancing power which cannot be covered by the expanders. With direct mechanical transmission, companders efficiently use the energy recovered on the turboexpander side to power the compressor’s energy cycle, which provides major savings in compressor energy consumption.
With both compressor and expander stages on a single gearbox, companders feature just one oil system, one control system, and one seal-gas panel – enabling a faster installation time and a smaller footprint. After all, when it comes to the decision on whether or not to utilise an expander for energy recovery purposes, it is all about investment and operating costs vs energy recovered. With the reduced installation of the compander solution compared to a free-standing expander generator train, this ratio is tipped to the positive side.
Case studies
Hydrogen peroxide to propylene oxide (HPPO) plant
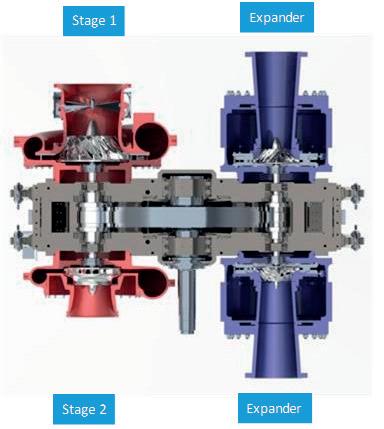
Hydrogen peroxide is required as an oxidation agent to produce propylene oxide in an HPPO plant. The hydrogen peroxide is created from hydrogen and atmospheric oxygen in the same plant. Ambient air is compressed in four stages to around 10 bars and then feeds to the oxidiser column where the hydrogenated hydrogen oxidises to hydrogen peroxide. After the reaction, the spent air is routed to the expander where the energy contained in the spent air stream is recovered and then passed on to the solvent recovery unit. The spent air enters the expander at 150˚C and 8 bara and leaves at around 10˚C and 1.35 bara. Due to the high-volume flow, the flow is split and expanded into two expander stages running in parallel. The expander stages run on the same pinion back-to-back, so the pinion is actually a driver of the bull gear. The compressor
stage 1 and 2 and stages 3 and 4 run back-to-back on two separate pinions driven by the bull gear (see Figure 4).
The enthalpy of the spent gas leaving the oxidation column is increased by the spent gas pre-heater using the hot discharge air stream of the compressor. A spent gas heater is installed to ensure the temperature of the spent gas entering the expander is sufficient to maintain the expander discharge temperature above 0°C to avoid freezing of constituents.
As a result of the expander integration in this particular case, the air compressor stages consume around 12.5 MW, compressing a volume flow of around 142 000 m3/h, and the two turbines combined recover around 4.5 MW, which is approximately 35% of the compressor power.
Figure 4. Compander in HPPO.
Figure 5. Compander on a phenol process.
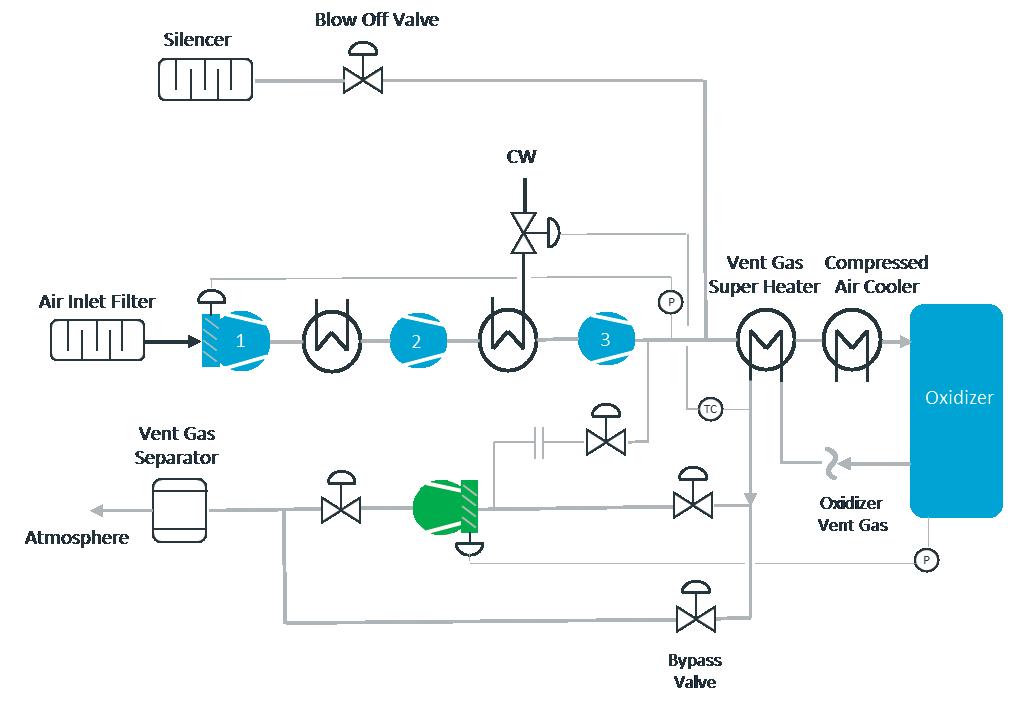
Compander in a phenol process
Phenol is produced by the oxidisation of cumene, using ambient air as a source of oxide. The compander feeds ambient air compressed in three stages to approximately 8 bar into an oxidiser. After the reaction, the spent air (now 96% nitrogen) leaves the oxidiser column and is routed to the expander stage before it is sent to a vent gas separator and eventually to atmosphere. Before entering the expander, the enthalpy of the spent air is increased by the super heater, which transfers enthalpy from the compressor discharge air flow to the spent air flow. The energy recovered by the turbines would otherwise be lost in the after cooler since the compressed air going into the oxidiser needs to be cooled down (see Figure 5). The inlet temperature of the expander is around 90˚C at approximately 4 bar and expands to spent air stream down to 1.5 bar.
The main driver is an electric motor. The expander stage runs together with the first compressor stage on the same pinion. Compressor stage 2 and 3 run back-to-back on a separate pinion. To ensure that the discharge temperature of the expander remains above 0˚C to avoid freezing of constituents in the spent gas, the inlet temperature to the expander needs to be controlled. This is realised by controlling the discharge temperature of the air compressor by regulating the intercooler duty between stage two and stage three. The reduced cooling duty increases the compressor power consumption, but the additional power is offset by the energy recovered by the turbine.
The compressor requires around 6.2 MW for the compression and the expander recovers around 1.1 MW, which means the integration of the expanders leads to energy savings of around 18%.
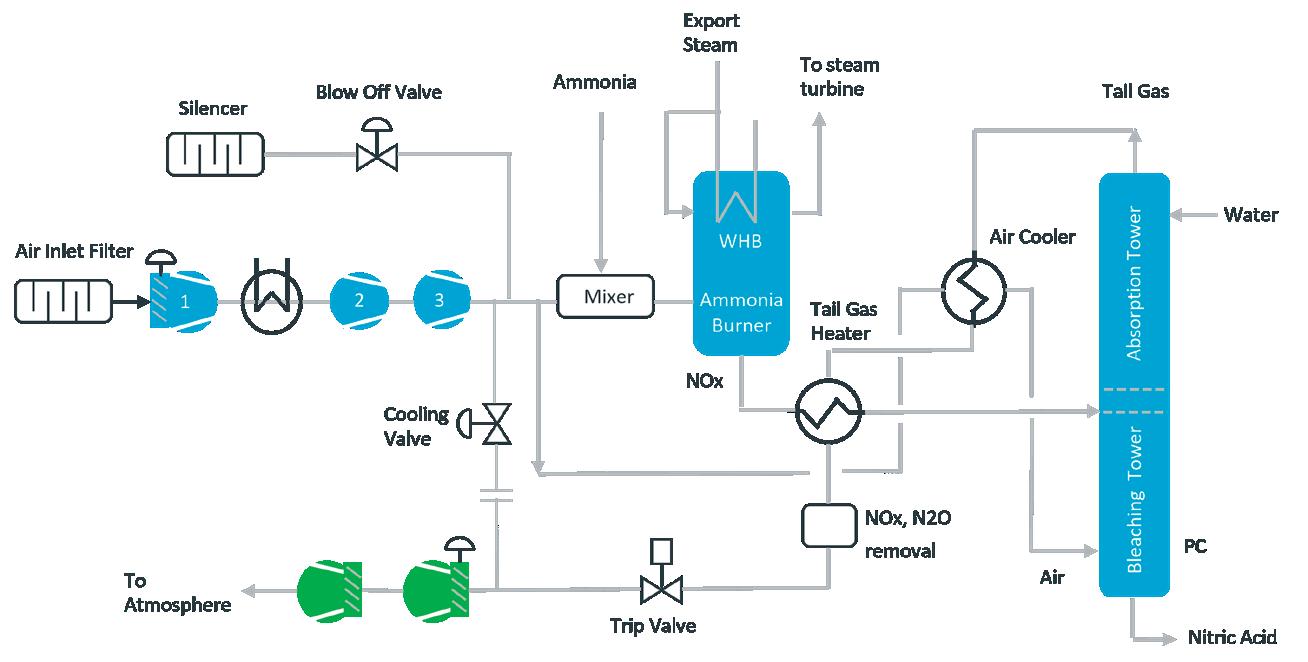
Nitric acid
In the catalytic oxidation of ammonia, nitrogen monoxide is generated and further oxidised to nitrogen dioxide, which is then absorbed in water, forming nitric acid. During this process, the oxide for the reaction comes from ambient air.
The compressor compresses the air from ambient to 10.3 bar and leaves the compressor at 206˚C. The inlet temperature to the first expander stage is 375˚C at a
pressure of 6.3 bar and expanding to ambient pressure. There are two expander stages which run together with the compressor stages on separate pinions.
The enthalpy of the tail gas to the expander is increased by the air cooler and the tail gas heater, recovering waste heat from two sources: the compression process and the NOX stream from the ammonia burner (see Figure 6).
The high temperature of the tail gas has several implications: an expansion in one stage is not possible since the enthalpy drop is directly proportional to the required speed of the impeller, which would exceed the mechanical limits in this case. Because of the high enthalpy drop, the expansion must be done in series in two stages. In addition, the expander stages need to be separated from the gearbox to avoid excessive heat input into the gearbox. This means that the expander housings have their own suspension and insulating plates, separate from the expander housings from the gearbox.
Further design elements include a special design for the impeller shaft connection in order to withstand the high temperatures, while the turbine casings are made from chromium-nickle (CrNi) stainless steel due to the possible formation of acid in condensate.
In this case study, the compressor consumes 4.7 MW and the two turbines together deliver 2.7 MW, resulting in 57% of the compressor power being recovered.
Conclusion
Integrally geared compander technology provides great flexibility in design and in the operation of gas compression and expander processes in one unit. As the three case studies highlight, integrating expander stages into the compressor unit allows the direct and efficient energy recovery of waste heat and pressure energy from expendable gas streams. This improves overall gas efficiency in the compression-expansion process.
With industrial CO2 emissions high on the agenda across the chemical and petrochemical industry, reaching carbon neutrality is an ongoing challenge. Maximising gas compression process efficiency, with the utilisation of companders, helps improve overall plant efficiency and reduce CO2 emissions.
Figure 6. Compander in nitric acid.
Joe Salinas, Global Compression Services, USA, highlights how a customised approach to piston service and upgrades can provide refineries with time-saving solutions, improved value, and greater convenience.
Packing cases play a critical role in compressor operation, sealing the compressor cylinder that carries gas through the system. However, many original equipment manufacturer (OEM) packing case designs are 40 - 50 years old, which may limit their efficiency and environmental compliance. To address this, Global Compression Services (GCS) is involved in the manufacturing and supply of both OEM and aftermarket parts, components, and engine accessories for reciprocating compressors and ignition and control systems, and is developing a zero emission packing case, designed to help refineries meet modern environmental regulations. When a packing case vents to the atmosphere, upgrading to a steel packing case and installing a specialised zero emission packing to prevent any gas leakage is preferable.
Traditionally, packing cases are made from cast iron, a porous material that allows process gases like hydrogen and methane to permeate the packing case, complicating reconditioning efforts.
Replacing cast iron packing cases with cases made from 1045 or 4140 steel, which are machine-lapped to a precise 7 - 8 RMS finish, creates a highly smooth, sealed surface that effectively prevents gas leakage.
Unlike cast iron, which can ‘sweat’ or release retained gas due to its porosity, steel cases with a perfect RMS finish provide a robust barrier, preventing gas from escaping into the atmosphere. This not only enhances the packing case’s durability but also contributes to zero emission standards, supporting refineries in achieving stricter environmental compliance.
Unique piston design
In January 2023, two custom-designed 27.75 in. pistons were delivered to a refinery’s reciprocating compressor in Corpus Christi, Texas, US. These featured a unique three-piece configuration with two aluminium halves and a steel centre section. Custom-built for the refinery’s specific operational requirements, each piston took approximately six to eight weeks to manufacture. Produced on CNC machines, the pistons achieved high precision and efficiency, allowing for reduced labour and quicker turnaround times.
Originally, the compressor had hollow cast pistons, which were prone to failure under the extreme temperatures (200 - 500˚F) encountered in refinery operations. A solid piston design with a steel core and aluminium ends can withstand such temperature fluctuations without failure. This solid design provides greater durability and reduces the risk of compressor shutdowns at high temperatures, addressing a major limitation of the OEM’s original cast pistons.
Designed specifically for oilfield and refinery environments, pistons are also built to resist sour gas, which can severely corrode pistons and valves. In the custom design, anodised aluminium is used to prevent gas penetration, offering an ideal solution for South Texas operations where sour gas is prevalent.
Utilising steel vs cast iron
On a new project, GCS first retrieves a gas analysis from the refinery. The gas analysis reveals the composition of the gas that the piston is going to be pumping. Based on the gas analysis, engineers will recommend the material for that piston in that operation. If the wrong material is used in combination with an abrasive and/or corrosive gas, the metal will degrade over time
and the piston will fail. Using the proper material with the right gas ensures a long run time.
The design process begins with obtaining a piston sample or print, which is carefully measured and assessed by engineers. Based on these measurements, they either refine the existing design or create a new one. In many cases, the piston requires aluminium, for which GCS uses aircraft-grade 6061 T6 aluminium for optimal durability. For the centre section, cast iron or steel is selected according to the application’s specific requirements, with a three-piece piston design being the most common. In some situations, a solid cast iron piston is required, which limits upgrade options.
While high-grade aluminium is resistant to corrosive gases, it will eventually degrade over time. To address this, pistons are designed with a modular structure: a durable steel or cast-iron centre section flanked by aluminium ends. This design enables efficient recycling and repair. If the aluminium ends become unusable, they can be replaced while reusing the centre section, or vice versa. The worn part can be swapped out without needing to replace the entire piston, as would be required with an OEM piston. This modular approach supports both sustainability and cost-efficiency in piston maintenance and replacement.
Case studies
Hydrogen non-lube system
A refiner operating a pure hydrogen non-lube system with specific cylinder frames was experiencing significant wear issues with piston ring and rider bands, which required replacement every two months. GCS recommended a specialised polymer material for the rings and rider bands, custom-engineered for durability in non-lube systems. They overhauled and upgraded the entire piston assembly, implementing a tailored Teflon-based design that could withstand the demands of hydrogen service without lubrication. Since the upgrade, the refiner has achieved a runtime of over two years, surpassing previous performance.
Valve upgrade
Another refiner required a valve upgrade for compressors handling gas with high liquid content. Originally using steel rings, the compressors were updated by GCS with high-performance peak rings and entirely new valve assemblies. To reduce liquid presence in the compressors, the refiner also implemented separators and dryers in the system. GCS recommended switching from cast iron to steel valves, which improved durability and performance. This upgrade extended the valve lifespan to over a year initially, and the design was subsequently standardised across all the client’s compressors. The new valves now operate for up to two years without issues, offering robust leak protection even in liquid-rich environments.
Refineries often purchase frame packages from OEMs and then turn to companies like GCS for maintenance and repair services. Valves can be reverse-engineered and repaired to meet specific operational needs, providing an alternative to OEM replacements. Computer numerical control machines are used for precise repairs, with programming tailored to each valve’s specifications to ensure accuracy.
Figure 1. Piston steel centre section.
Figure 2. Two aluminium piston halves.
Quarter turn valves strike a difficult balance between sealing, cost, longevity, and process control performance. Wade Helfer and Bryan Leger, Emerson, USA, explore how integrating the supplier’s understanding of the required trade-offs with an end user’s expertise can help identify the correct valve construction for each application.
Soft seals
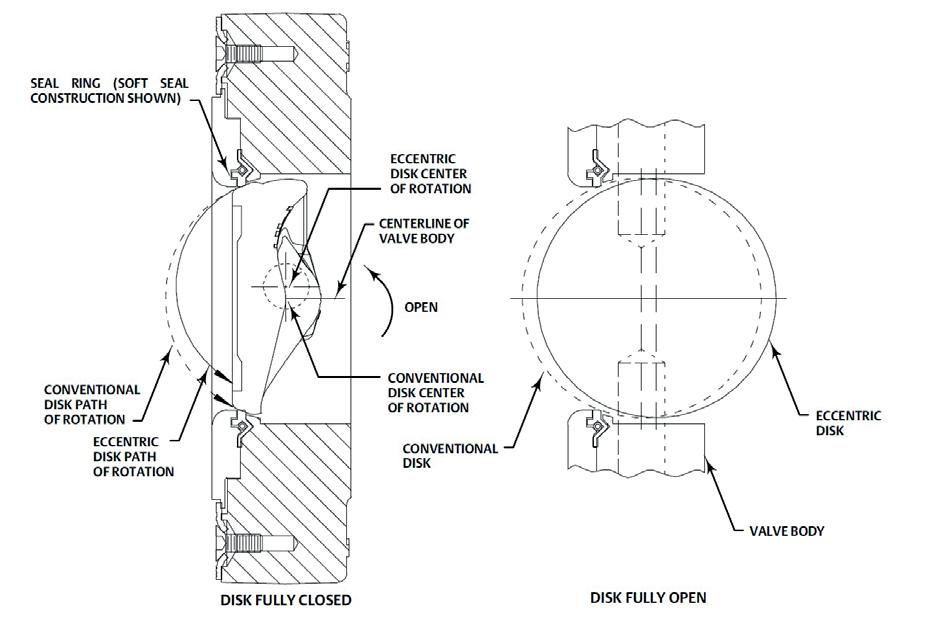
With the disc in the ‘fully closed’ position, a quarter turn valve relies on the seal to provide tight shutoff (Figure 1). As the valve closes the last few degrees, the disc presses against the seal to arrest flow. A soft seal utilises
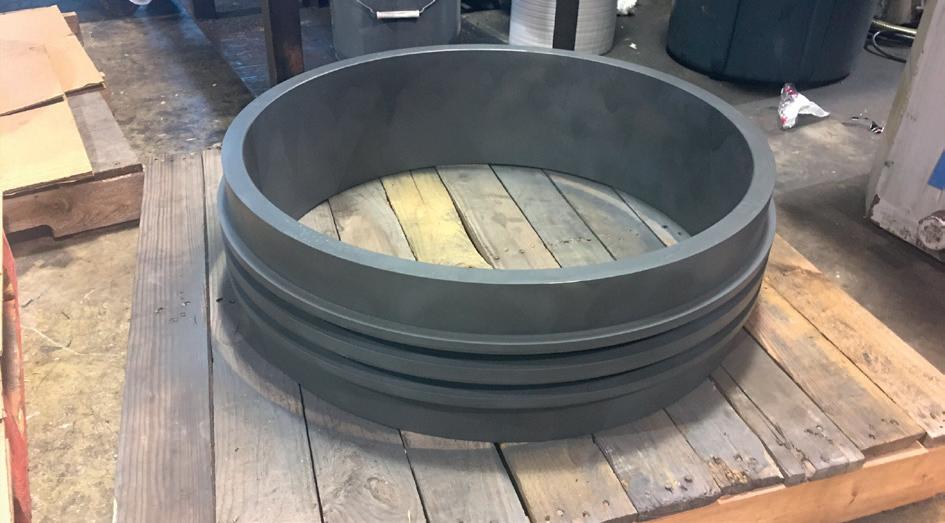
2. These before (left) and after (right) photos show how the surface texture of a chrome plated disc changes after being tested in a manner that approximates field conditions. The surface damage results in striations that make sealing difficult as the valve closes.
polymeric materials to provide a malleable surface for the disc to press against. As the actuator drives the disc into the soft seal, it moulds itself to the surface of the disc to fill any voids, creating a leakproof seal.
Valves with soft seals can achieve extremely low leakage rates regardless of pressure drop and, in most applications, provide extended service life. They also achieve this tight shutoff without using a great deal of actuator torque, and the required torque remains fairly constant over the life of the seal. There are a wide range of polymer options – so different sealing materials can be selected to handle difficult process fluids. As a result, valves with soft seals are the first choice for most applications as they perform well, last a long time, and require relatively small actuators for operation.
Unfortunately, a limitation of soft seals is temperature. When process temperatures approach 400°F, these seals begin to break down. Some special materials can exceed this threshold by a limited amount, but beyond that, they should not be used. Fluids with abrasives can also erode soft seals quickly, causing a loss of material each time the valve closes, and eventually premature failure.
Metal seal challenges
Valves with a metal seal are better suited to handle elevated temperatures and slurry type fluids. However, metal seals have their own set of constraints.
Unlike soft seals, which easily conform to the shape of the disc’s surface, a metal seal relies on a precision fit to achieve tight shutoff. Higher seat loads may also be required to minimise the remaining micro-sized gaps that reside between the disc and seal to meet certain leakage standards, such as FCI 70-2 Class VI and ISO 5208 Rate AA.
Valves with metal seals can also experience surface damage on the mating regions of the seal and disc as the valve is cycled. This abrasive type of wear (Figure 2) causes an increase in leakage over time.
With continued use, the abrasive wear produced by components in contact will also increase the load requirement to initiate rotation. Figure 3 displays a torque vs pressure drop comparison for soft and metal seals. Valves with soft seals generally require a fixed amount of torque for a given pressure differential, regardless of the parts’ condition. However, the required torque for a valve with a metal seal at that same differential pressure is higher and increases as the mating parts wear.
3. This chart shows the actuator torque required to unseat a valve with soft and metal seals. Note how a worn metal seal requires far more torque, especially at high differential pressures.
This increase in torque is indicative of increasing system friction within the valve assembly. Friction has a detrimental effect on the valve’s ability to properly control a process loop, leading to erratic performance and higher process variability.
Metal seal design options
End user requirements for metal seated valves should include obtaining the overall performance and longevity associated with
Figure 1. This diagram shows how a disc from an eccentric butterfly valve wedges against the soft seal to achieve tight shutoff.
Figure
Figure
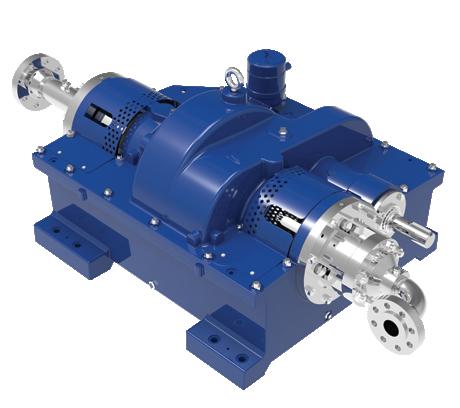
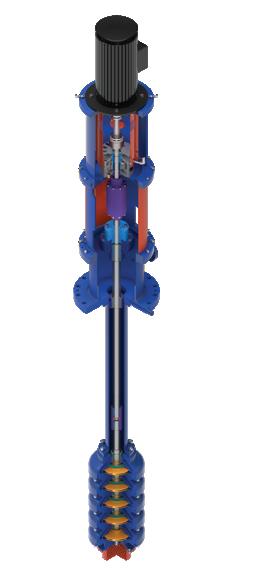
API 617 Centrifugal Designs to 100MW, 40MPa
API 618 Reciprocating Designs to 20MW, 60MPa
API 617 Centrifugal Designs to 100MW, 40MPa
API 618 Reciprocating Designs to 20MW, 60MPa
ASME PTC10 type 2 testing capacity to 30MW (gas turbine), 50MW (motor)
For more information, visit our website: www.sbw-intl.com
Scan QR for brochure, or Contact:
ASME PTC10 type 2 testing capacity to 30MW (gas turbine), 50MW (motor) For more information, visit our website: www.sbw-intl.com
Head office & Manufacturing: Shenyang, China info@sbw-intl.com
Global Sales Director: chenqiming@sbw-intl.com Middle East & North Africa: yangyang@sbw-intl.com
Scan QR for brochure, or Contact: Head office & Manufacturing: Shenyang, China info@sbw-intl.com
xianganding@sbw-intl.com
Director: chenqiming@sbw-intl.com
xianganding@sbw-intl.com
liusong@sbw-intl.com
soft seals, while minimising the cost impact. An efficient way to achieve this goal is to delay the onset of abrasive wear and slow down its rate of damage accumulation.
Offsetting the shaft from the centreline of the flow path allows the disc to follow an eccentric disc path of rotation (Figure 1). As a result, the seal quickly loses contact with the disc as it rotates out of the fully closed position, and parts that do not touch while in motion cannot wear down.
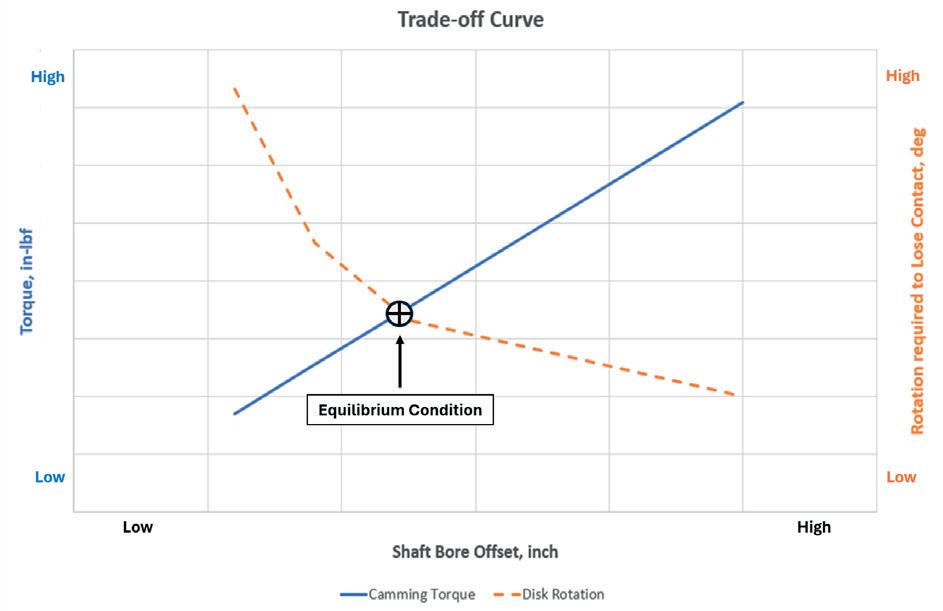
However, offsetting the shaft exacts a price in the form of camming torque, one of the four torque components (packing, bearing, sealing, and camming) used to size actuators. Figure 4 provides a trade-off curve to help identify an optimum shaft offset that minimises camming torque, and to minimise the amount of rotation required for the seal and disc to lose contact.
Hardening the surface of critical components by using special coatings or penetrating treatments is an effective way to preserve the surface finish and maintain its coefficient of friction. Penetrating treatments, such as nitriding, are tunable processes that allow adjustment of the hardness profile for the associated part. This allows the valve manufacturer to influence the rate of wear tied to the mating parts, and to bias the hardness levels such that the surface damage occurs on the component of choice (e.g., the seal instead of the disc as shown in Figure 2).
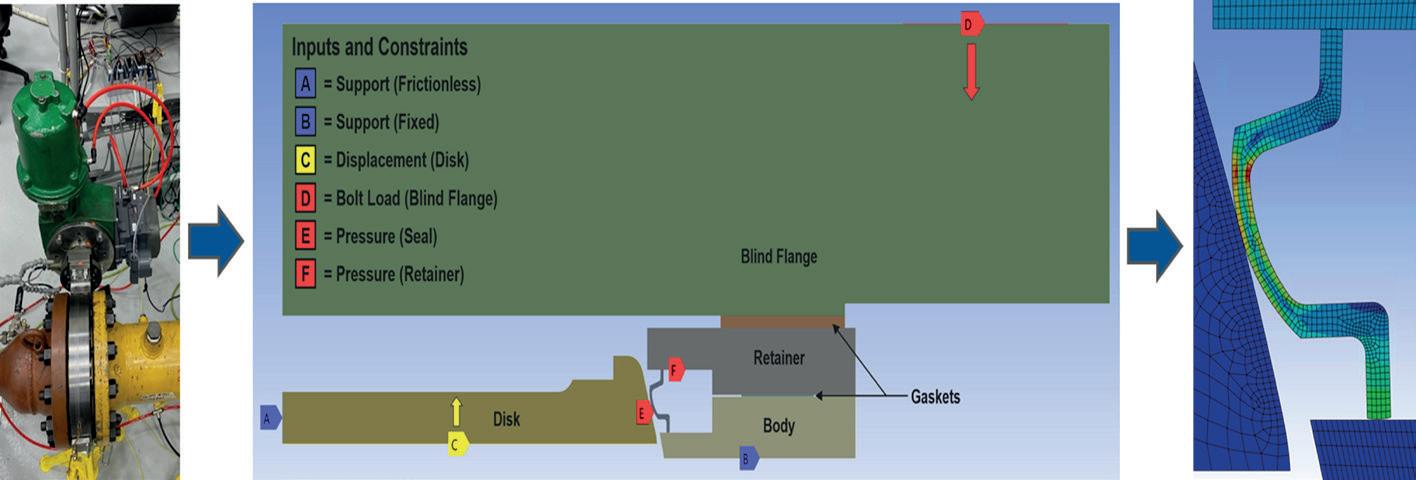
Adjusting the seat load is another tool for extending the longevity and performance of the seal. It needs to be high enough to pass the factory acceptance leakage test, but not so high as it will accelerate abrasive wear. Due to the complex nature of metal sealing systems, identifying the correct seat load has been one of the more daunting aspects of design, but simulation software has simplified the process.
With a properly constructed and characterised model, one can predict the load reaction between the seal and disc (Figure 5). This load reaction value will be indicative of the expected sealing torque and leakage rate.
Elevated temperature cycle testing provides an opportunity to observe the impact of the design decisions and trade-offs made during the design development cycle. It also allows one to leverage experimental data to set an appropriate safety factor for actuator sizing (Figure 3). This margin is a fail-safe to eliminate drivetrain binding, a potential mode of failure for high temperature or slurry type applications.
End user influence
End users play a vital role in determining the makeup of the valve construction because a successful valve installation starts with an accurate description of the process conditions. The valve sizing documents provided to the supplier typically include two conditions: operating and design.
It is common for the maximum design conditions to cover extreme situations that deviate significantly from the expected operating range. Because the specified valve will be constructed to handle the design conditions, end users should exercise caution when specifying the maximum design temperature as it needs to be accurate, but not needlessly overstated. Undue conservatism in this area can unnecessarily push the valve into metal seated constructions.
Overstating the requirements typically raises the cost of the valve construction, and in some cases, it hinders the valve’s ability to provide optimal process control, creating higher process variability.
Conclusion
Selecting an appropriate control valve for an application starts with an accurate and complete description of the process conditions, and end users can help by confirming these conditions are not overly conservative. If the conditions exclude the use of soft, non-metallic components, then valves with metal trim are a natural candidate. Metal seated valves can provide reliable performance over an extended service life, but they must be chosen thoughtfully. Consulting a knowledgeable supplier is a good first step to making the correct design choice.
Figure 4. Trade-off curve that characterises this example relationship between shaft bore offset with camming torque, along with the disc rotation required for losing contact with the seal.
Figure 5. Model of the valve assembly for predicting the load reaction between the seal and disc.
Brian Callahan, Kerry Drake, Le Song, Dan King, and Tyler Monzel, Greene Tweed, USA, consider how new advances in crosslinked PEEK expand the performance capabilities of polymers in a wide range of applications and environments.
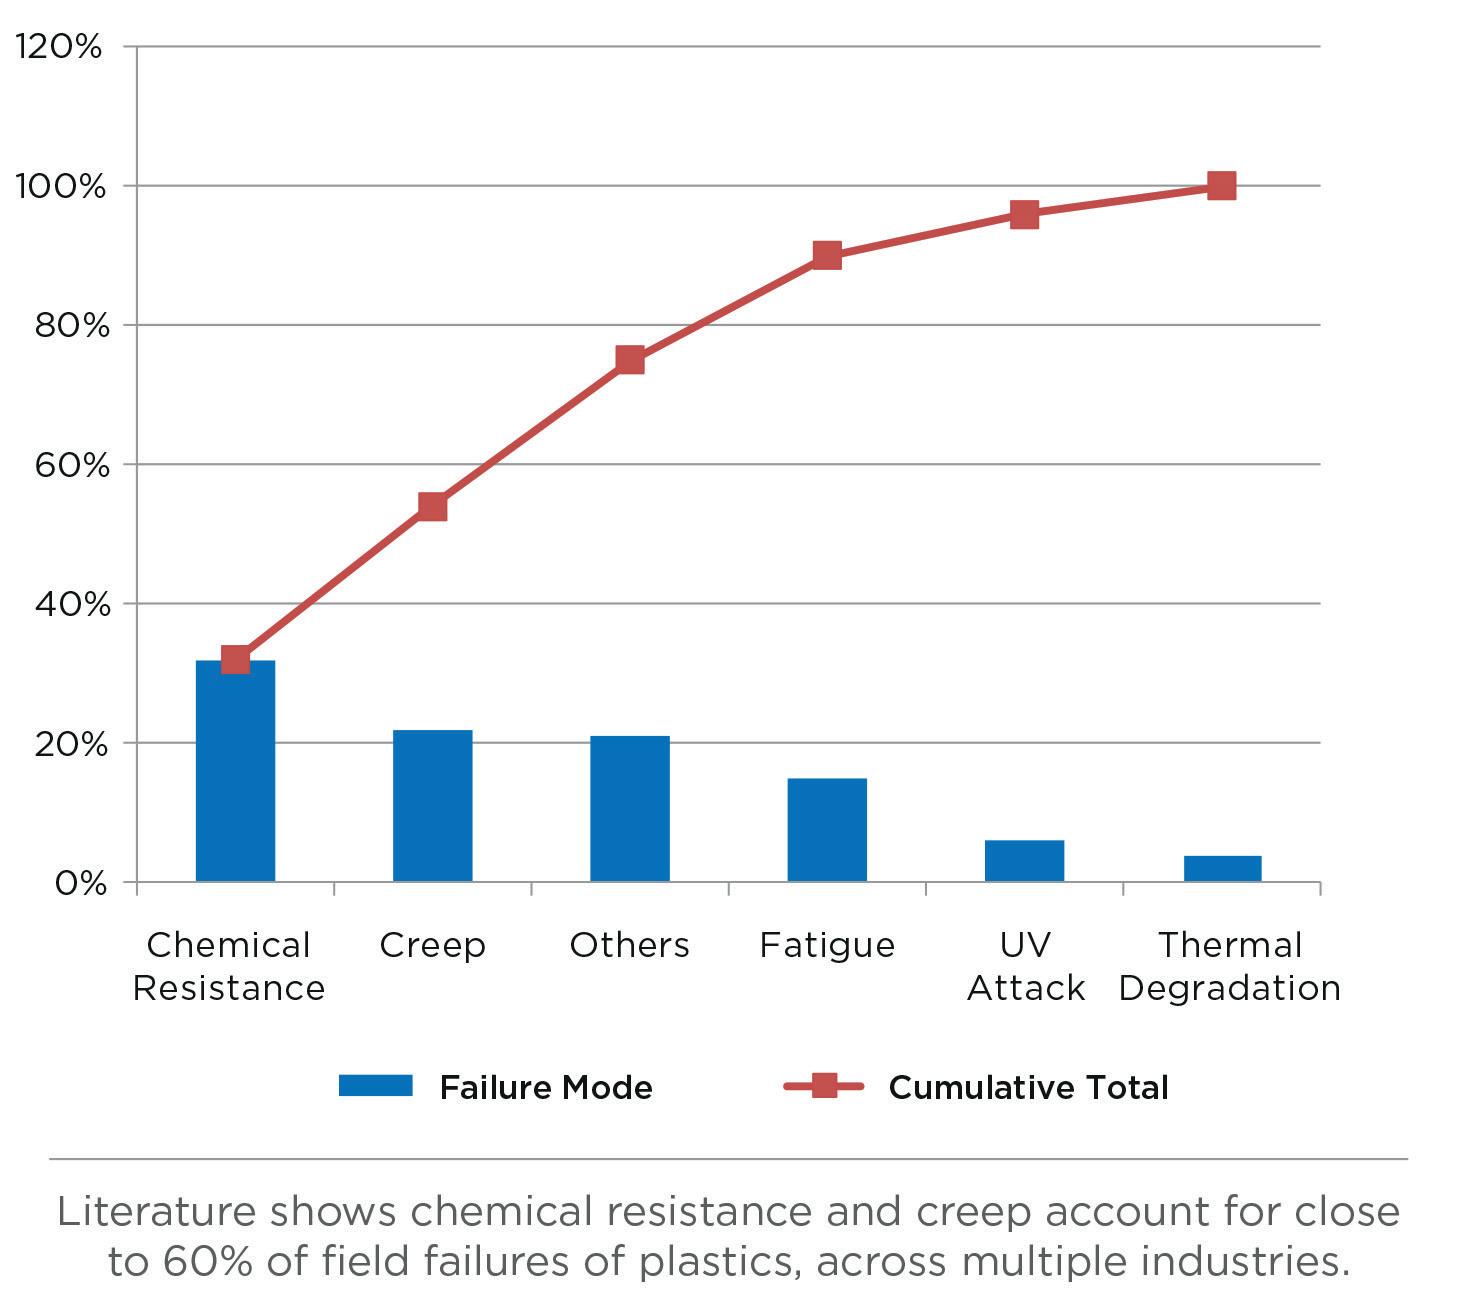
As applications become more demanding with increased expectations for long service life, they require improved reliability and durability while operating conditions and media exposure chemistries become more severe. More corrosion inhibitors, completion fluids, well fluids, and other high and low pH environments or other severe fluids can push polymeric components (such as backup rings, seal assemblies, v-rings, end adapters, bushings, bearings, valve seats, connectors, and structural components) to their limits because their strength and
durability decrease with increasing temperatures and more aggressive chemistries. However, advances in polymer chemistry are enabling new materials that can solve these challenges and usher in new options for material selection to improve performance, expanding the limits beyond what was previously available.
Overcoming polymer limitations in extreme environments
Polymers have properties that vary depending on the temperature of the application and the inherent
thermal response properties of that polymer. Understanding polymer class and properties can help more accurately predict application performance. Using data collected at 73°F (23°C) for design and safety factor calculations may lead to invalid estimation of properties and failure in the field, particularly when used in demanding environments such as high temperatures, or high pressures, or when exposed to aggressive chemicals if material properties are not properly accounted for under these conditions.
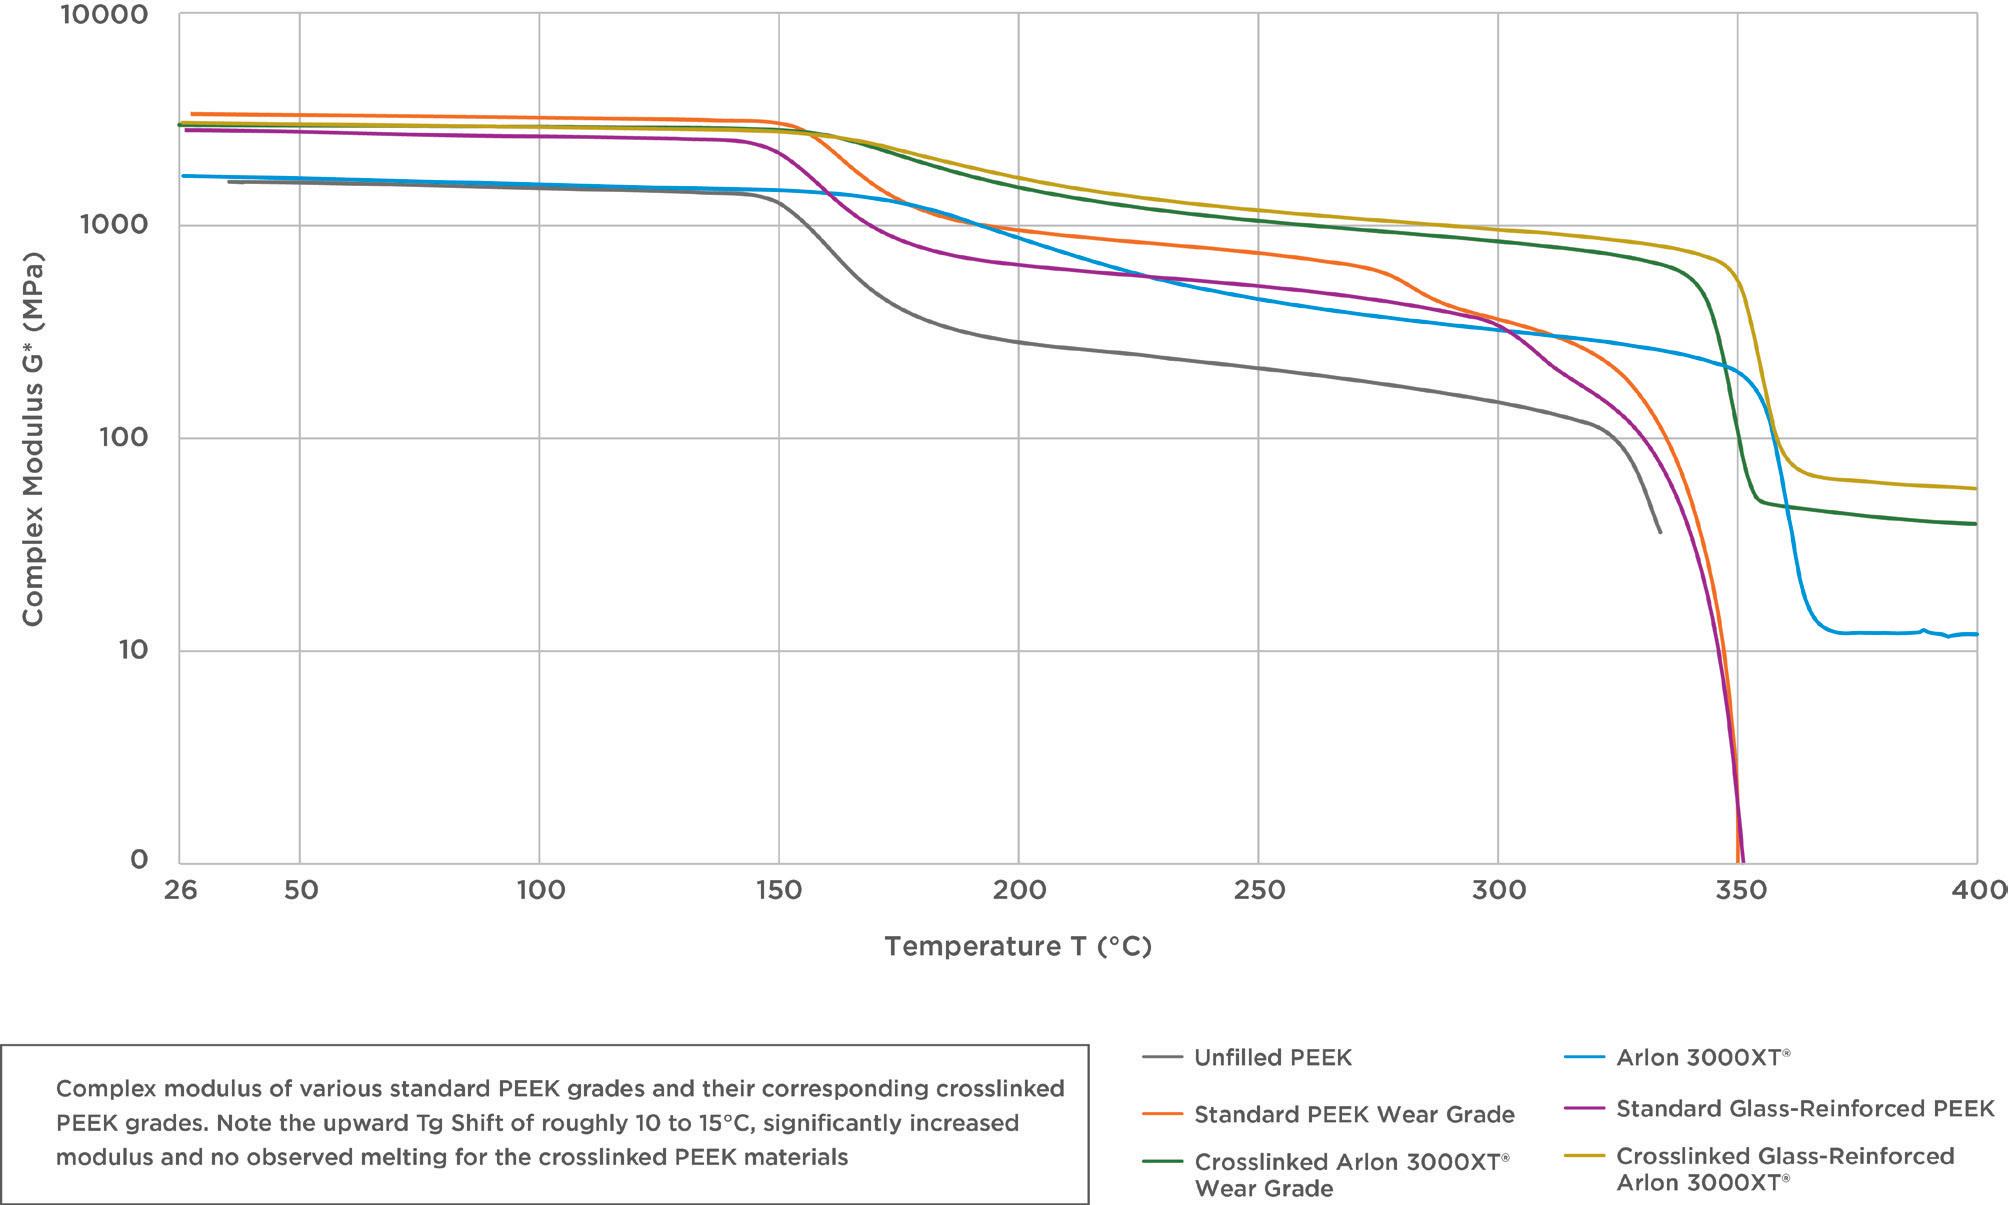
Seals, seats, bushings, and bearings are often made of filled or unfilled polytetrafluroethylene (PTFE) for its excellent friction properties and nearly universal chemical resistance, or from polyetheretherketone (PEEK) for its high durability, high strength, creep/extrusion resistance, and chemical resistance. These materials are excellent up to their limits, but the physical properties of PEEK begin to decline above 300°F (149°C), its glass transition temperature (Tg) where the strength and stiffness drop-off, and a maximum continuous service temperature around 500°F (260°C) in severe applications, with maximum excursions to roughly 600°F (316°C). PTFE’s mechanical performance limit starts significantly lower than PEEK and tends to decrease with increased pressure or temperature, with a maximum service temperature around 500°F (260°C). As pressures and temperatures increase, the addition of reinforcing fillers such as glass and carbon fibres can extend this range by increasing stiffness, which has a particularly big impact at temperatures above the glass transition temperature. The limitations of these materials drive the switch to metal components at
extremely high temperatures, but this sacrifices the improved sealing, reduced friction, weight reduction, and improved chemical resistance properties of these polymers.
A breakthrough
Greene Tweed commercialised the first crosslinked PEEK, Arlon 3000XT®. This patented material platform was developed to withstand more extreme conditions, retaining the mechanical properties associated with PEEK up to 650°F (343°C), often paired with aggressive chemical environments. This is in contrast to some crosslinking systems found in the literature or patent applications which utilise different chemistries that are typically less robust.
The crosslinked polymer maintains excellent physical properties well above the glass transition temperatures of conventional PEEK materials (~150 ° C/300 ° F), greatly exceeding conventional PEEK compounds’ performance at those temperatures. It delivers enhanced mechanical performance that is particularly well suited for high-pressure and/or high-temperature conditions, along with improved chemical resistance in aggressive media, yielding longer service life with increased reliability.
The dynamic mechanical analysis (DMA) curves graph (Figure 1) depicts the complex modulus to show the relative stiffness from around 79°F (26°C) to 752°F (400°C) of unfilled PEEK, 30% glass filled PEEK, a leading wear grade of PEEK, and their corresponding Arlon 3000XT crosslinked PEEK versions. Note that the upward Tg shift of roughly 35°F (19.5°C) significantly increased modulus with no observed melting for the
Figure 1. DMA Curves Complex Modulus.
crosslinked PEEK materials. Through increased capability, reliability, and extended service life, the Arlon 3000XT crosslinked PEEK expands design headroom in extreme environments, expanding the capabilities of high-performance polymers while avoiding many of the compromises of imidized plastics which have been used along with PEEK in demanding applications, such as the greatly reduced steam resistance, reduced ductility, and lower toughness of imidized plastics compared to PEEK. Using a crosslinked PEEK improves performance at higher temperatures with substantially improved creep, extrusion, and wear resistance at temperatures up to 650°F (343°C), as the crosslinks retain material strength and stiffness well above the glass transition and melt temperatures (Tm) of conventional semicrystalline PEEK. Creep is the second leading cause of failure in plastics, behind chemical resistance. The Pareto chart (Figure 2) shows the relative percentage of failures of plastic materials caused by common failure modes and the radar chart (Figure 3) compares the general performance of crosslinked PEEK with traditional unfilled PEEK, fibre reinforced PEEK, and polyimides for these and a few other properties.
Higher temperatures and higher pressures or corresponding higher loads increase the degree of creep/extrusion/ deformation in applications, so this difference is compounded in severe service applications. This is especially true in backup rings, bearings, pressure relief valve seats, and other applications that remain under high pressure at high temperature for long durations. An advantage in the performance of the crosslinked PEEK is seen in the comparison of the extrusion tail of discs subjected to 35 000 psi (241 MPa) at 550°F (288°C) (Figure 4), where the Arlon 3000XT showed further reduced extrusion flow under load from the carbon filled PEEK. Additionally, a similar advantage was seen in the back-up ring test at 350°F (177°C) and 25 000 psi (172 MPa). This shows the improvement in creep resistance compared to even 30% carbon-fibre reinforced grades of standard PEEK under extreme temperature and pressure conditions.
This data can be further compared against application needs to predict service lifetime of the backup ring, sealing component, bearing, bushing, valve seat, etc. using time-temperature
equivalency calculations by comparing compressive modulus retention, creep/stress relaxation.
This clearly shows that crosslinking significantly improves high temperature creep/extrusion resistance of PEEK. In DMA testing, the crosslinked PEEK had a Tg of 35°F (19.5°C) higher than PEEK, and provides superior mechanical property retention from 300°F (149°C) to 650°F (343°C). In extrusion testing at 35 ksi and 550°F (288°C), it outperformed both virgin and filled grades of
Figure 3. Comparative properties HP polymers-chart.
Figure 2. Common failure modes of plastic.
PEEK and PEKEKK. Crosslinking PEEK offers improvement in tensile strength and modulus having comparable high temperature properties to common fibre filled grades of uncrosslinked PEEK, such as conventional glass or carbon fibre filled PEEK.
It is common to modify PEEK to optimise the desired physical properties for application needs. For example, PTFE or graphite can be added to PEEK or another high strength plastic to improve friction properties or wear rate and/or glass or carbon fibre can be added to improve creep resistance, wear rate, increase tensile modulus, flexural modulus, heat deflection temperature (HDT), tensile strength, flexural strength, and compressive strength. The same fillers can be added to the crosslinked PEEK to design a material that offers the same general benefits with a similar relative performance shift to be used under more severe service conditions, than the corresponding version using conventional PEEK. This expands the material and product performance for a broad range of applications needing improved properties, longer life, and better chemical resistance, as the crosslinked PEEK tested 99 days in 40% aqueous sulfuric acid at 70°F (21°C) and
experienced negligible swell and fluid absorbtion, while standard PEEK experiences significant degradation.
Conclusion
In summary, polymer seals, backup rings, valve seats, bushings, bearings, and other components offer many performance benefits over metal components. However, in severe environments the polymer components have traditionally been limited to temperatures below 550°F (288°C). New advances in crosslinked PEEK enable polymers to be used in continuous service, in a wide range of applications and environments up to 650°F (343°C), with improved performance and a longer service life, while offering reduced risk of chemical attack or brittle failure from impact. Even beyond 650°F (343°C), the crosslinked PEEK will perform like an ultra-high temperature elastomer. This is a feature which can be very useful for certain applications or high temperature excursions after validation testing confirms suitability for application needs.
Using the latest materials solutions can greatly improve safety, reliability, capability limits, and service life for severe service.
Figure 4. Creep resistance.
Sridhar Srinivasan and Jeremy Staats, Becht Inc., USA, discuss how to enable enhanced refinery reliability and economics through optimised blending and corrosion management.
Refinery crude unit operations, characterised by significant process complexities and crude blend/fraction assay properties, have traditionally remained an area where accurate asset integrity and life prediction have been difficult to achieve. Such difficulty stems from the need to characterise and correlate corrosion across widely varying unit operating scenarios and process conditions. Quantifying corrosion has thus become a key factor in ensuring asset integrity, and the absence of appropriate corrosion management strategies has often been the cause of some of the most destructive and expensive corrosion failures.
Changing feedstock and process chemistry, coupled with the need to constantly meet demanding production targets, exacerbates the challenges associated with understanding and managing corrosion, a phenomenon defined at the intersection of process phase behaviour and thermodynamics, multiphase fluid dynamics, and metallurgy. One of the primary impediments to overcoming this complexity has been the absence of quantified corrosion data that can be correlated to unit operating/process conditions.
Naphthenic acid and sulfidic corrosion in refinery crude unit operations have often led to conservative decision making

in terms of crude selection, crude processing, and unit metallurgy specifications. Additionally, the refining industry has constantly sought, for reasons of improved economics and return on investment, to move in the direction of processing heavier, high-sulfur, high-acid opportunity crudes. Such a directional shift has been a consequence of depleting reserves and declining sweet crudes. Processing low-cost opportunity crudes available in the market has become imperative to improving refining margin. Sulfur and acidic impurities in crude oils pose serious hot oil corrosion problems in crude distillation units (CDU) and associated vacuum distillation units (VDU), especially with the increase in processing of low-quality opportunity crudes.1-4 In the range of 200 - 400˚C, reactive sulfur compounds cause sulfidation corrosion of ferritic carbon and chrome steels in CDU, VDU, and front ends of downstream units operating at hot oil temperatures.5-7 Over the same temperature range, naturally occurring carboxylic acids in crudes can be so aggressive that higher-alloy, austenitic stainless steels containing >2.5% Mo are required for processing high-acid oils.8-11 Although sulfidation and acid corrosion occur over the same temperature range, they differ in two significant ways. Sulfidation forms an iron sulfide nano layer that is
semi-resistant to further corrosion and relatively insensitive to flow velocity. Naphthenic acids form oil-soluble naphthenates that are quickly removed from the corroding surface due to fluid flow.12-14
Refiners have traditionally relied on industry surveys to develop rough, rule-of-thumb guidelines for safe operations and material selection.15-17 Oils with S >0.5% are considered ‘sour’ and potential sources of sulfidation. Oils with acid concentrations >0.50 TAN (TAN = mg KOH/g, measured by titration) are considered corrosive. Because sulfidation yields a barrier FeS layer inhibiting acid corrosion, one rule-of-thumb suggests that acid and sour crudes could be blended to some %S/TAN to minimise the effect of acids, but the optimum value for such a ratio varies among refiners.17
As the world’s supply of crude oils has become more diverse, the number of sour and acid offerings (opportunity crudes) has been increasing.3,18,19 Several industry programmes have developed empirical S/TAN corrosion models based on statistical correlations of large lab databases.11,14,20,21 Most of these engineering models are based on parallel independent acid and sulfidation reactions that are combined with refinery fluid dynamics based on either mass transport or wall shear stress. While the proprietary engineering models have been applied somewhat successfully, their predictive capabilities are limited because they lack a fundamental description and understanding of the underlying reaction chemistry at the molecular level. This Simultaneous Nap Acid Sulfidation (SNAPS) corrosion model is based on reaction fundamentals representing naphthenic acid and reactive sulfur interactions.
In addition to the critical factors of Arrhenius temperature and kinetic dependence of duration (time), other parametric aspects of the model are schematically shown in Figure 1.22
The SNAPS model calculates the instantaneous and average corrosion rates for simultaneous molecular reactions of acids and reactive sulfur compounds based on surface coverage; hence, duration of exposure has a key role in computation of both cumulative corrosion and average corrosion rates. Cumulative thickness of iron (Fe) removed from carbon steel surfaces is determined and divided by exposure duration to obtain corrosion rates. Alloy factors reduce calculated Fe thickness loss on the basis of Fe surface availability. A turbulent acceleration coefficient (TAC), determined by fluid and operation conditions, is applied for increased mass transport at refinery flow rates.
Hot oil corrosion is a chemical process. Molecular reactions between iron atoms and corrosive molecules occur at 10-10 m in 10-10 sec. timescales while refinery flows occur in pipes with about 10-1 - 100 m dia. over periods of days (8.6 x 10⁴ sec.) or longer. Historically, the effects of corrosive impurities have been followed down corrosion in terms of mils per year on refinery scale pipes through autoclave testing on coupons followed by inspection with sophisticated surface characterisation methods that reach down into the nanometer (10-9). These surface techniques, however, are applied to ‘frozen samples’. Hot oil chemistry occurs within 10-12 to 10-5 sec. at elevated temperatures while the SEM and TEM images are recorded after hours of preparation at room temperature.21 On the other hand, on-line monitoring can follow the reduction in wall thickness at temperature but lacks instantaneous compositional data on the corrosives.23
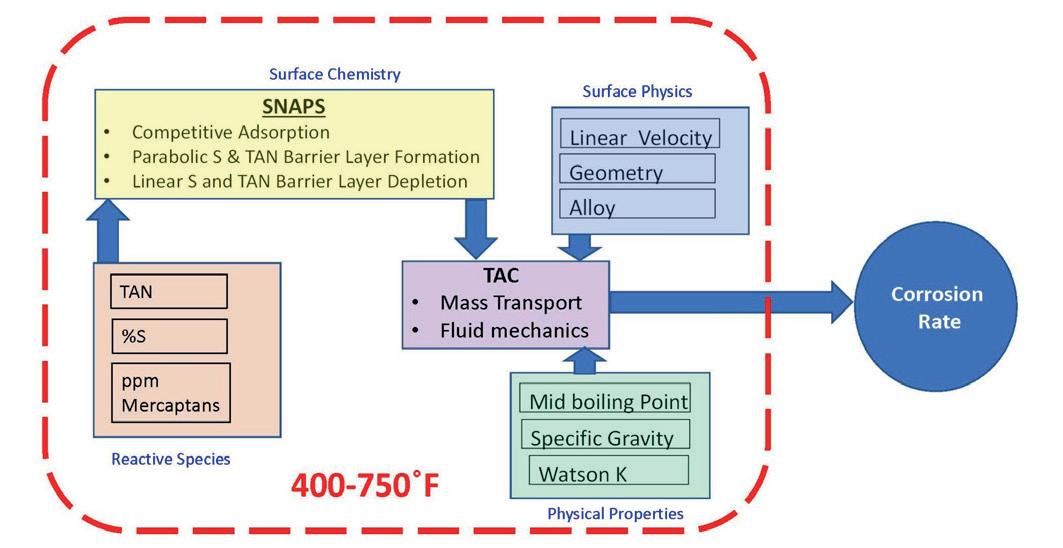
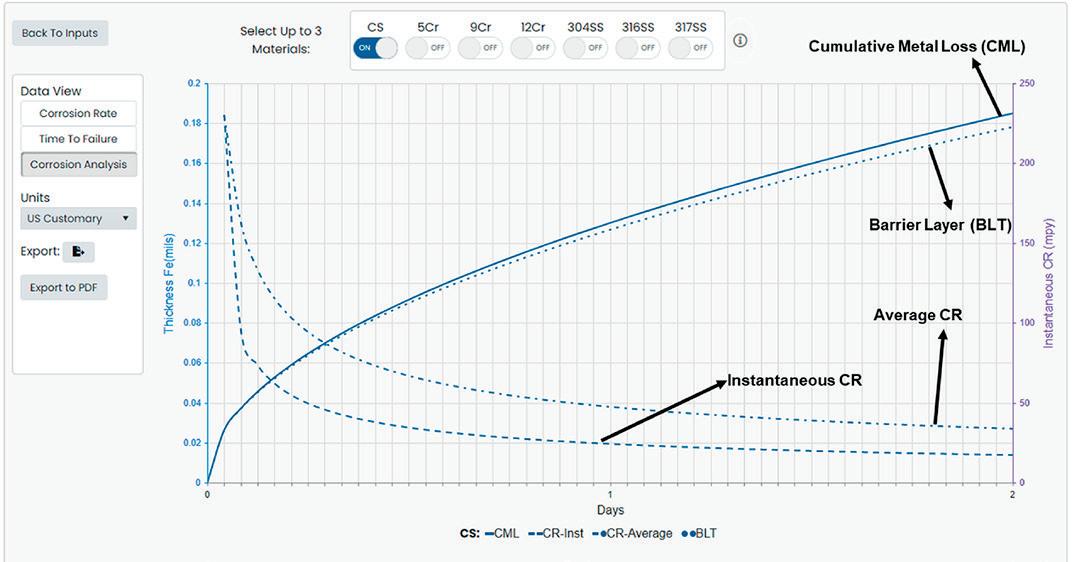
for cumulative metal loss over time (CML), barrier layer thickness (BLT), instantaneous, and average corrosion rates (CR).
The SNAPS model takes a radically different view of hot oil corrosion and begins by examining corrosion reactions at molecular time and distance scales. Thus, the motion of molecules toward a reactive surface is coupled with the reactions at that surface, a combination of mass transport and reaction kinetics that was called at one point ‘chemo-mechanical erosion corrosion’.24 This approach draws from a wide range of chemistry and physics, building from a theoretical basis of corrosion chemical reactions that involve quantum electron transfers. This molecular approach has evolved from extensive analytical and corrosion testing in the past 25 years.14,25-28
Reactive species: understanding the molecules
One of the hot oil corrosion mechanisms of greatest concern to refineries is that due to simultaneous sulfidation and naphthenic acid thinning. Hot oil chemistry is often discussed in refineries in terms of TAN and H2S because their measurement is associated with naphthenic acids (NAP) and sulfidation corrosion respectively. However, in many models these values fail to adequately predict corrosion behaviour and alternate analytical methods have been explored.18,29,30
Total acid number
Total acid number (TAN = mg KOH/g oil) is a measure of all the acids in a petroleum sample as determined by titration
Figure 1. Corrosion prediction model functional overview.
Figure 2. Model results
of an oil sample.31 Many alternative acid measurements in crudes and distillates have been proposed due to poor correlation with corrosion rates.32 Generally, correlations with TAN are adequate for sulfur-free systems. At very low levels or no sulfur, corrosion rates remain constant with time, follow Arrhenius behaviour, and increase linearly with TAN up to about TAN of 10.14 The model attributes the historically poor correlations for crude oil TAN to an under-appreciation of the effects of concurrent NAP volatilisation, thermal decomposition, and competitive concurrent sulfidation.33-35 The historically poor TAN/corrosion correlations led to the development of many alternative methods for measuring, isolating, and characterising naphthenic acids.25
Collectively, petroleum carboxylic acids are called NAP after the first type of carboxylic acid isolated.36 The acid functionality carried on some type of ring or branched hydrocarbon skeleton is >85% -CH2-COOH.37 NAP in crude have been extensively characterised with >3000 individual species detected in a single crude.38 Although NAP with different molecular weights or structures differ in boiling point, there is no evidence of a difference in the reactivity of the -CH2COOH functional group as measured by TAN. For the purposes of the model, NAP will mean all carboxylic acids in a petroleum sample. Although much has been learned about the origin and complexity of nap acid mixtures in crude, currently no acid measure has been found to correlate better with corrosion rates than TAN, though there is evidence to show that NAP molecular structure complexity and acid boiling point have a role. Therefore, TAN is used as the acid concentration in the model.
OSC, sulfur, and thiols (R-SH)
Unlike NAP, there are several reactive organic sulfur functional groups within the organic sulfur compounds (OSC) along with some unreactive sulfur compounds in crude oils.39 Much of the difficulty in using total %S for corrosion prediction arises from this multiplicity of S functional groups. Industry-wide API projects developed methods for predicting corrosivity. McConomy curves, which use S/temperature correlations with an S modifier, were one of the results of this effort.15 Later, recommended practices for thinning included tables for combinations of TAN and total S, but these very conservative estimates were for setting inspection priorities and not true predictions of thinning rates.17 Another early method that showed promise was H2S evolution.40,41 Geo-chemical and hydroprocessing studies generated a rule-of-thumb that two-thirds of the S in crude oil is thiophenic, the dominant form of ‘non-reactive S’, consisting of multi-ring compounds with the S incorporated into aromatic rings.42-44 The model uses the total S value and applies a ‘one-third rule’, meaning one-third of total S is assumed to be reactive OSC. Since 2000, extensive characterisation studies of crude oils have demonstrated that prevalent reactive S OSC are aliphatic mercaptans and alicyclic S compounds. As in the case of NAP, crude oils contain a plethora of closely related OSC species; characteristic of reactive OSC is a single C-S bond and H2S is a by-product of OSC thermal dissociation. For the model, %S and mercaptan concentrations are used as inputs.
Surface coverage
On a molecular scale, all corrosion is local. That is, NAP or OSC must contact the reactive surface. When both are present, the surface concentration of the corrosion-driving species is determined by competitive adsorption. Because the reactions are a function of the relative number of each type of molecule, concentrations are converted to molar units: TAN and % S are significantly different units of concentration. When converted to moles, a 1:1 ratio of %S/TAN means that there are 17.5 moles of total S or 8.5 moles of reactive S molecules for each acid molecule competing for each Fe atom on a metal surface.
Reaction kinetics
In the model algorithms, cumulative Fe thickness loss from carbon steel is calculated as a function of kinetic rate constants, NAP and OSC concentrations, and duration. It is the sum of parabolic generation and linear depletion reactions forming the barrier layer, i.e., the sum of the thickness of Fe lost to and through the barrier layer.
Although the depletion reactions do not directly remove Fe from the metal, they do reduce the thickness of the barrier layer to enable higher rates of convective diffusion, increasing the total rate above pure parabolic. Over time, the parabolic generation rate is asymptotic with respect to the linear depletion rate so that rates become linear. Hence, the kinetics are para-linear (Figure 2).
Figure 3. Using a SNAPS-type model to optimise crude blend sequencing.
Figure 4. Framework for correlating crude fraction data from blends.
The model calculates combined NAP and OSC para-linear corrosion rates for carbon steel instantaneously and reports the results as the cumulative Fe thickness loss. Using, for convenience, the cumulative Fe loss thickness = CML and barrier layer thickness = BLT, cumulative results can be used to calculate CR for different time intervals, i.e., both instantaneous and average corrosion rates can be calculated for blocks of any duration. The calculation assumes a short duration of oil but long duration of metal at temperature, i.e., in metal that is constantly exposed to steady-state reactive concentrations. The initial parabolic rate approaches linearity with the first day (1440 min). The para-linear kinetics connects short-term (<2 days) lab autoclave corrosion rates with long-term refinery operating (>2 days) experience. However, lab testing includes any loss of TAN or H2S generation during the 2-day exposure of an oil to temperature. That is, oil time at temperature is one key to understanding hot oil corrosion.
For the example with refinery block operations shown in Figure 3, a change in feed starts with the pre-existing barrier layer, and the TAN and %S for the new NAP and OSC drive the kinetics toward a new steady-state corrosion rate, i.e., the barrier layer is consumed in the second blend due to a highly naphthenic, low S blend but does not result in a high corrosion rate due to the presence of the barrier layer from the first MVGO blend. This shows how the model can be used to sequence ‘opportunity’ crudes to benefit from the presence of a previously built up FeS layer.
Optimised crude blending and optionality
One of the key enhancements to using a SNAPS-type model is facilitation of a time-based prediction of both instantaneous and cumulative corrosion to help manage opportunity crude blends, thereby enabling optimised blend identification and processing. Through linkage of crude assay data and blend properties available through assay applications, the model provides an easy framework to integrate data from assay libraries as well as a process historian to enable identification and selection of appropriate, profitable crude blends for processing.
A schematic showing the interaction between a SNAPS corrosion model and other cloud applications is shown in Figure 4.
Key benefits of the model include:
n Optimise blend management (through appropriate integration with assay data and fraction properties).
n Use as a rolling TAN solution (mix and match high-corrosivity opportunity crudes with low-corrosivity crudes from inventory).
n Process on-the-fly selected blends.
n Create linkage to KPI dashboard to showcase economic value.
n Gain predictive insights to drive proactive safety and reliability.
n Gain real-time insights to support corrosion and maintenance management (when linked to historian).
Through linkage of crude assay data and blend properties available from other assay applications, the model provides an easy framework to integrate data from assay libraries as well as a process historian to enable identification and selection of appropriate, profitable crude blends for processing. A schematic showing the integration of the Haverly® H/COMET application with CorrExpert-Crude is shown in Figure 5 and demonstrates the workflow of how data between CorrExpert-Crude and other cloud applications may be shared and analysed.45
Summary
A mechanistic corrosion prediction model for refinery hot oil corrosion has been developed. The framework of the model has been described in terms of molecular functional groups. All carboxylic acids measured by TAN are treated as naphthenic acids. Corrosive, reactive sulfur compounds, approximated as one-third total %S and mercaptans, are treated as organic sulfur compounds. NAP and OSC react directly with the metal by quantum electron transfer with solid state and molecular diffusion. Linear and parabolic kinetic parameters have been determined for independent NAP and OSC reactions, reactions of the corrosion products, and secondary reactions. Using a cloud-based predictive application enables realisation of the business need to work with opportunity crudes while minimising damage to CDU/VDU equipment. Integrating crude assay data and information available through crude assay libraries and a cloud-based process historian, the framework facilitates enforcement of appropriate integrity operating windows (IOW) through utilisation of corrosion rate as a dynamic IOW parameter alongside other key operating variables such as TAN, sulfur, fluid turbulence, and temperature. The system’s ability to seamlessly collaborate with other platforms, including crude blending and supply chain planning applications, has real-time benefits in providing a digitalised solution integrating crude assay with automated predictive analytics to achieve crude processing flexibility and enhanced unit economics.
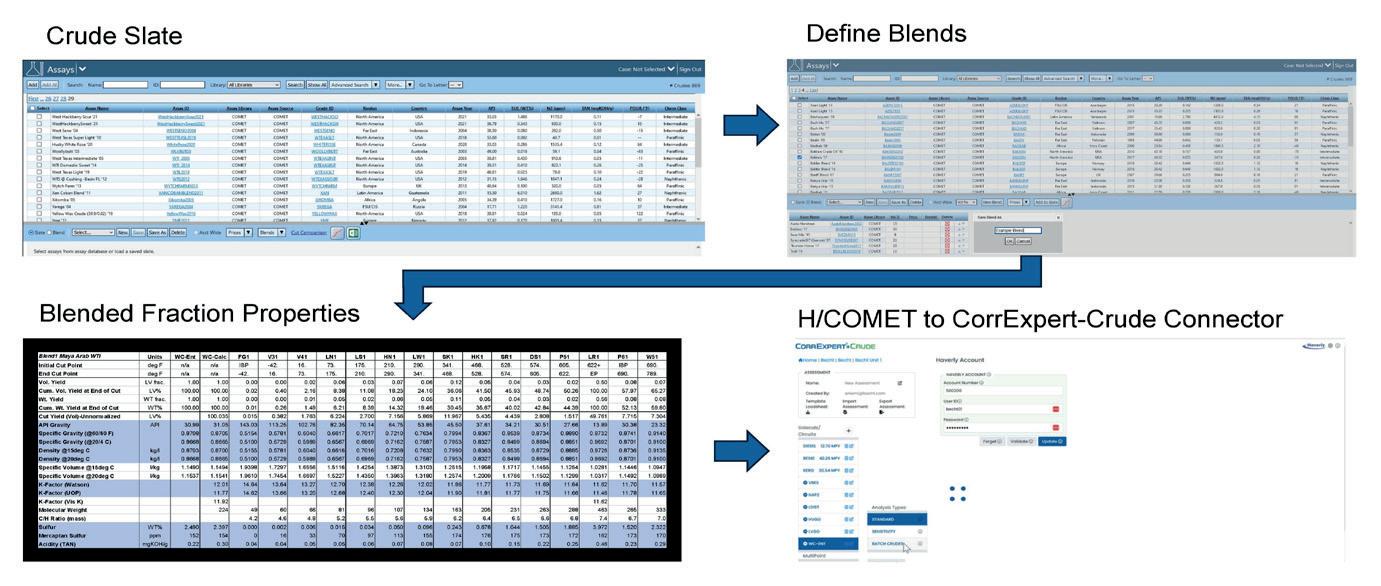
References
For a full list of references, please visit: https://www. hydrocarbonengineering.com/ refining/01072025/pacifyingpotential-corrosion--references/
Figure 5. Enabling on-the-fly blend analyses through integration with other cloud applications.
Larry Emch, Integrated Global Services (IGS), USA, highlights advancements in maintenance methodologies that minimise system downtime and maximise efficiency.
Fired heaters provide the thermal energy required for distillation, cracking, and reforming processes. However, their continuous operation under harsh conditions makes them susceptible to various problems, including internal tube fouling (coking), refractory degradation leading to hot spots, tube overheating and mechanical failures, and combustion inefficiencies. These issues directly translate into reduced thermal efficiency, higher fuel consumption, increased emissions, compromised safety, and, most critically, the potential for costly forced shutdowns.
Recent advancements in maintenance methodologies have enabled sophisticated repairs while units remain in operation, significantly reducing the risk of unplanned shutdowns and extending run lengths between scheduled turnarounds.
Quantifying the impact of fired heater failures
Fired heaters/furnaces operate under extreme conditions with internal temperatures reaching up to 2200°F (1200°C); these units are subject to multiple degradation mechanisms that compromise performance, efficiency, and mechanical integrity.
Fouling and scaling
Deposits accumulate on heat transfer surfaces, creating insulating layers that reduce thermal efficiency, requiring higher firing rates and increased fuel consumption.
Refractory degradation
Failure of the internal refractory lining due to anchor support failure, incompatible materials, or excessive exposure to reducing gases like hydrogen, leading to localised overheating of the external shell.
Tube integrity issues
Support failures, flame impingement, and thermal stresses can cause tube bowing, sagging, and misalignment, potentially resulting in catastrophic tube rupture and process fluid release.
Combustion inefficiencies
Sub-stoichiometric operation, excessive excess air, and improper flame characteristics can cause lost energy, equipment damage, and increased NOX emissions.
With typical 2 - 5 year run cycles, documented cases show unplanned outages costing upwards of US$1 million/d for critical units such as ammonia reformers, with production losses at some facilities exceeding US$400 000/d when operating at reduced rates.
Online intervention technology development
Conventional maintenance strategy has centred on scheduled turnarounds for comprehensive assessment and repair. However, extended operating cycles combined with the prohibitive cost
Production impact Minimal to zero; performed during operation
Cost structure
Higher service cost; significant savings from downtime avoidance
Response timing Immediate intervention for emergent issues
Data availability Continuous real-time monitoring data
Maintenance approach
Condition-based, predictive; targeted interventions
Total production loss; requires shutdown (planned or unplanned)
Lower direct service cost; potential high losses from unplanned production interruption
Repairs deferred to next scheduled turnaround
Periodic inspection snapshots
Time-based preventive; scheduled overhauls
of unexpected failures have driven the development of advanced in-service maintenance techniques.
Online maintenance refers to the execution of inspection, cleaning, and repair activities while equipment remains operational under normal or near-normal process conditions. This approach is closely integrated with condition monitoring systems that provide real-time operational data, enabling immediate detection of anomalies and precise intervention timing. A comparison of online and offline maintenance approaches can be seen in Table 1.
Specialised services for in-service heater maintenance
Recent developments in in-service maintenance technology have led to several specialised techniques for addressing fired heater issues without shutdown.
Refractory hot spot repair
This addresses refractory failure causing shell hot spots using engineered access methods. The technique involves creating controlled penetrations in the heater shell, inserting appropriate support structures and refractory materials to restore insulation, and completing shell repair – all while maintaining operation. Field applications have demonstrated temperature reductions from extreme levels (>536°F/280°C or 830°F) to safe operating conditions (<100°F/37°C or 130°F).
Online convection section cleaning
This implements controlled projection of consumable media through lances to remove external fouling deposits from convection section tubes. The process effectively dislodges deposits without causing thermal shock or mechanical damage to tube surfaces or fins. Case studies have shown efficiency improvements of 1.75%, translating to 2.46 million Btu/h recovered furnace duty in specific applications.
Radiant tube descaling
This applies similar principles to radiant sections, using lances projecting abrasive media directly onto scaled tube surfaces. This technique removes the loosely adhered oxides from external tube surfaces while maintaining emissions compliance. Typical bridgewall temperature reductions of 50 - 100°F (10 - 38°C) have been documented in field applications, enabling restored production rates in units constrained by temperature limitations.
High-temperature video inspection
This style of inspection utilises water-cooled digital camera systems capable of visualising internal components at temperatures up to 3000°F (1650°C). These advanced systems can be inserted through minimal access ports (as small as 2.75 in./7 cm) and reach distances up to 30 ft (10 m). For applications below 1000°F (540°C), integrated high-temperature light sources provide illumination. Complementary diagnostic techniques include infrared thermography, direct temperature measurement, and emissivity assessment.
In-service tube stabilisation
This system addresses tube support failures through controlled penetration of the heater shell and installation of engineered stabilisers. Components (typically fabricated from
Figure 1. Maintenance methodologies enable repairs while units remain in operation.
Table 1. A comparative analysis between online and offline maintenance approaches
high-temperature alloys such as 310 stainless steel) are inserted, positioned, and welded in place to secure compromised tubes in their current position. This semi-permanent repair prevents potential tube rupture while allowing continued operation until comprehensive support replacement during the next turnaround.
Online debris removal
Employs vacuum systems with specialised lances and non-damaging tips inserted through access ports to remove accumulated debris from components such as selective catalytic reduction (SCR) catalyst panels. The technique restores flow paths, reduces differential pressure across system components, improves emissions control efficiency, and reduces induced draft (ID) fan energy consumption without process interruption.
Technical case studies and performance metrics
Multiple documented case studies demonstrate the technical and financial efficacy of online intervention methodologies.
Case study 1: ammonia plant refractory repair
A severe refractory failure at a former manway location caused a critical hot spot exceeding 536°F (280°C) with visible shell distortion. An online repair was completed in three days, reducing temperatures to below 100°F (37°C) and maintaining full production. Analysis indicated shutdown costs estimated at greater than US$1 million/d were avoided.
Case study 2: refinery shell temperature management
A large refractory breach (approximately 20 in. x 5 in.) resulted in shell temperatures of 830°F (443°C). An online repair was completed in nine days, avoiding a projected six-day shutdown
Figure 2. Example of refractory failure.
with associated costs of US$2.4 million. The intervention reduced shell temperatures to 130°F (54°C) and maintained operational integrity.
Case study 3: convection section performance recovery
Pre-turnaround online cleaning of a refinery heater convection section delivered quantifiable performance improvements. Furnace thermal efficiency increased from 87.55% to a documented 89.30% (1.75% improvement). This translated to 2.46 million Btu/h recovered furnace duty, benefitting downstream reboilers and steam generation systems.
Case study 4: platformer transition duct repair
Refractory failure in a CCR Platformer transition duct roof exposed the shell to flue gas temperatures exceeding 560°C (1040°F), forcing reduced production rates with consequent revenue losses of over US$400 000/d. An online engineered repair enabled continued operation until the next scheduled maintenance window.
Safety systems and risk management protocols
The execution of high-temperature in-service maintenance requires comprehensive safety protocols and specialised expertise. Industry best practices include the following:
Engineered risk controls
Advanced technologies and procedures specifically addressing the unique challenges of performing maintenance on live, high-temperature equipment. These methods include specialised tooling for controlled penetration of pressure-containing components, water-cooled systems for thermal management, and engineered processes for welding on operational assets.
Project-specific safety engineering
Detailed evaluation and engineering phases to develop custom operational parameters appropriate for the specific heater configuration. This includes comprehensive risk assessment and the formulation of specific mitigation plans tailored to the unique challenges of each repair scenario.
Technical personnel qualifications
Field personnel executing online services require documented experience in specialised high-temperature applications. Technical competencies include refractory installation, high-temperature welding, thermal imaging, and controlled access creation.
Quality and safety management systems
The implementation of formal management systems meeting international standards such as ISO 45001:2018 for Occupational Health and Safety and ISO 9001:2015 for Quality Management provides a framework for consistent, safe execution of high-risk maintenance activities.
Global deployment infrastructure
Responding rapidly to emergent fired heater issues is critical to preventing escalation and minimising production impacts.
Figure 5. Operational and technical excellence is key to success.
Figure 6. Shell hot-spot.
Figure 4. Ammonia plant refractory repair: before (left) and after (right).
Figure 3. Hot access creation.
Successful implementation of online maintenance programmes requires several key factors. First, maintenance providers must be able to deploy personnel and equipment globally to address emergent issues, with operational presence across major industrial regions. Strategic positioning of specialised tools and materials minimises response time for time-critical repairs.
Standardised procedures and training ensure uniform quality regardless of facility location, while adherence to varied regional safety and environmental regulations maintains compliance across different jurisdictions. Effective communication and coordination with local facility personnel enable the smooth execution of complex interventions.
These distributed technical resources, with consistent training and execution standards, enable rapid mobilisation for both scheduled projects and emergency interventions. This ultimately minimises equipment exposure to compromised operating conditions and mitigates risks of catastrophic failure.
Engineering economics and asset management strategy
The demonstrated technical capabilities of online fired heater maintenance have significant implications for refinery and petrochemical facility asset management. Integration of these methodologies into comprehensive maintenance strategies provides multiple operational advantages.
Condition-based intervention
Online inspection technologies enable non-intrusive assessment of internal components, allowing maintenance
planning based on actual degradation rather than fixed time intervals.
Intermediate remediation
In-service repairs provide engineered solutions that bridge the gap between scheduled turnarounds, effectively extending the reliable operating life of equipment without production interruption.
Efficiency optimisation
Online cleaning services restore heat transfer effectiveness, reducing fuel consumption and associated emissions while potentially increasing throughput capacity.
Risk mitigation
The ability to address structural integrity issues (refractory failure, tube support degradation) during operation significantly reduces the probability of catastrophic failure and forced shutdown.
Turnaround planning enhancement
Data gathered through online inspection enables more targeted and efficient turnaround scope development, potentially reducing overall downtime requirements.
For facilities seeking to maximise asset utilisation while managing operational risk, integration of online maintenance capabilities represents a technically sound approach to optimising the reliability, efficiency, and service life of critical fired heater assets.
PJulian Yeo, United Electric Controls, and Renato Visentin, Proxess s.r.l., discuss the benefits of instrumentation diversity for emergency shutdown solutions in the gas processing industry.
ersonnel safety and asset reliability are top-of-mind concerns for gas processing operators. The ubiquity of complex processes, combustible gases, and high pressure applications in the gas processing industry demand an adequate level of emergency shutdown (ESD) safeguards in facilities. Creating safe operating environments, ensuring compliance to stringent safety standards, and optimising plant productivity are paramount objectives for every operator. Deploying a variety of instrumentation technologies on these ESD systems creates the necessary system redundancies to ensure that common-cause failure modes do not overlap.
Benefits of instrumentation diversity
Instrumentation diversity refers to the deployment of various technologies, brands, and types of instruments to achieve the same control, measurement, or emergency shutdown
objective. Asset failures, such as pump malfunctions, can lead to hazardous situations, such as overpressure or overheating. By employing diverse instrumentation, the risk of a common mode failure is minimised. Common mode of failure is defined by the American Institute of Chemical Engineers (AIChE) as “Concurrent failures of different devices characterised by the same failure mode (i.e., identical faults)”.1
While older assets are generally installed with mechanical ESD instrumentation, newer assets are installed with electronic instrumentation that provide the users with highly accurate process data for better decision-making. Each instrumentation technology has its own advantages and disadvantages. Significant operational, maintenance, and cost efficiencies for the facility can be achieved if the operator knows how to skillfully leverage the advantages of each instrumentation technology. The following section shows how these efficiencies are demonstrated.
Increased reliability and system redundancy
Relying on a single instrumentation technology can expose operators to significant risk, especially if the technology is susceptible to fail under similar application conditions. Diversification introduces redundancy and ensures continuous production even if one system encounters issues. Downtime can be minimised and operational disruptions prevented.
Improved data accuracy and faster control
While electronic instrumentation technologies can be more accurate and facilitate the capture of specific process data, mechanical-based instrumentation still offers unparalleled speed of response, which is critical in emergency shutdown applications. By integrating a diverse range of technologies, the operator can obtain data for precise process control while ensuring split-second emergency shutdown action, optimising the facility’s performance, safely.
Greater flexibility and future-proofing
As industrial processes evolve, a diverse instrumentation portfolio allows the user to adapt quickly to new challenges and requirements. Facilities that rely on a single technology may face costly upgrades to stay current. Diversification allows for smoother integration of new technologies, alongside easier scalability and compliance with evolving industry standards without extensive system overhauls.
Types of instrumentation technology
There are several types of mechanical and electronic instrumentation technologies that are deployed for emergency shutdown.
Mechanical switch
These devices provide the fastest emergency shutdown response (~5 milliseconds) to a process change, because a control action (i.e. turn on or off) can be executed to the final element directly. Switches have been proven-in-use for decades and they are easy to install and operate. However, switches can be harder to maintain due to processes like manual calibration of switch
settings. Mechanical switches do not require any power to operate and are often considered to be a final line of instrumentation defence in many gas processing plants, particularly during power outages.
Electronic switch
These are viewed as upgraded versions of the mechanical switch. While a little more costly than a mechanical switch, they offer expanded functionality such as programmable set points and deadbands across the entire range, and possess better repeatability compared to a mechanical switch (up to 4 times). They have very fast response times at <100 milliseconds and have the capability to provide a basic level of diagnostics about device health. Less time is required to maintain (i.e. uninstall, calibrate, set, reinstall) these electronic switches compared with traditional mechanical ones, thereby improving maintenance efficiency.
Transmitter
Transmitters are ubiquitous devices in industrial plants. They are able to transmit data from the field to the control system through standardised output signals like 4 - 20 mA, 0 - 10 V, or a digital signal. However, transmitters can only affect a shutdown via a programmable logic controller (PLC). This increases the shutdown response time (at ~250 milliseconds), making it slower compared to mechanical switches. Transmitters are costly but they are highly accurate and possess advanced device diagnostics.
Hybrid switch and transmitter
This proven-in-use novel technology represents a combination of the functions of a transmitter and a mechanical switch. There are very few instrumentation manufacturers who offer such hybrid technology in the market today. These devices are meant to provide a cost-effective solution for users that desire the advantages of a transmitter (availability of data) as well as the benefits of an electronic switch (ease of operation and maintenance). For instance, United Electric Controls’ (UE) hybrid ONE Series switch and transmitter has a 4 - 20 mA output
Table 1. Comparison of instrumentation technologies
that can trend process data, but it also comes with a built-in relay that can be easily programmed to initiate a direct emergency shutdown at the final element.
Various instrumentation technologies can work on most applications, but the primary differentiators are speed of response, electrical ratings, and price.
Case study 1: electronic switches to improve operational and maintenance efficiency
Natural gas storage is a process in which natural gas is injected into pre-existing depleted reservoirs and pumped out when there is a demand for it, as seen in Figure 1. Withdrawing the gas involves suction from the pipeline, discharging it, treating it in dehydration columns, and finally sending it to delivery collectors.
Mechanical pressure switches are typically deployed as ESD safeguards at each stage, for instance at the compressor’s suction and discharge, the collector columns, the treatment columns, and the delivery collectors. One of Europe’s largest natural gas storage companies was using mechanical switches for its ESD applications but was facing several instrumentation challenges: n Mechanical switches have lower set point stability over wide-ranging temperatures. This resulted in numerous false trips.
n Mechanical switches do not display the process or switch status, making it difficult for maintenance workers to monitor the process and verify the settings.
The company decided to diversify its instrumentation technology by upgrading many of its mechanical switches to electronic ones. It arranged three electronic switches in a 2 out of 3 (2oo3) voting logic scheme to serve as emergency shutdown devices for the compressor station’s gas delivery collector. This scheme ensured safety and minimised nuisance trips. The customer was able to realise the following benefits: n Frequency of false trips was reduced, which increased operational uptime and efficiency. The electronic switches improved set point stability over wide-ranging temperatures. n The digital display on the electronic switches made it easy for operators to verify process and switch status during maintenance rounds.
Figure 1. Natural gas storage system.
n With the electronic switches, operators could extract diagnostic information to quickly identify the root cause if a switch malfunctions, thereby improving maintenance efficiency.
n With a diversification of instrumentation technology, the operator reduced its risk of a common mode of instrumentation failure while improving operational uptime.
Case study 2: mechanical switches as a final line of defence
Design consideration
A global pump manufacturer, or original equipment manufacturer (OEM), supplies pumps to the hydrocarbon industry. Many of its systems already have electronic instrumentation like transmitters installed to accurately convey process data and turn off pumps via the PLC when needed. However, when it came to emergency shutdown of the pumps, where response time is critical, the OEM design team still relied on conventional pressure and temperature mechanical switches to perform a reliable emergency shutdown function for its dry screw pumps. The risk of an improper pump shutdown leading to pump failure could mean high repair costs, up to tens of thousands dollars per pump.
Implementation
The pump OEM evaluated several vendors on the end user’s approved vendors list (AVL) and decided to install
safety integrity level (SIL) certified temperature and pressure switches from UE. Temperature switches were installed on the water jackets as well as pump exhaust to prevent pump overheating. In addition, pressure switches were installed on the pump exhaust and set to 5 psi to prevent overpressure. SIL-certified mechanical switches were selected as they had proven-in-use reliability, minimising the possibility of instrumentation failure. The mechanical switches became a necessary complement to the overall pump instrumentation architecture by serving as a last line of defence to prevent pump damage. The combination of electronic transmitters and mechanical switches was an integral part of the instrumentation schematic for each pump system. Diversification of instrumentation technology was a critical design consideration to eliminate common mode of failure.
Conclusion
Every instrumentation technology has its advantages and disadvantages. The limitations of each instrumentation technology accentuates the importance of instrumentation diversity. Operators who know how and when to leverage these advantages for their instrumentation application, or even deploy multiple technologies to create layers of necessary redundancy, are able to build a robust, sustainable instrumentation architecture for plant safety.
Reference
1. ‘Common Mode Failure’, Center for Chemical Process Safety https://www.aiche.org/ccps/resources/glossary/process-safetyglossary/common-mode-failure
A podcast series for professionals in the downstream refining, petrochemical, and gas processing industries