04 Decarbonising the downstream – opportunity or threat?
Alan Gelder, Wood Mackenzie, surveys the current attempts to decarbonise the refining and petrochemical sectors, alongside considering the challenges operators are facing in these undertakings.
11 A whole systems challenge
James Jenkins, DNV, UK, considers the different strategies used in the decarbonisation of midstream oil and gas and thermal power generation in support of electricity grid resilience.
15 Refinery revolution
Phil Ingram, Johnson Matthey, UK, considers how the energy transition poses both a challenge and an opportunity for refineries, as operators seek to decarbonise processes while maintaining economic viability.
19 A pathway to carbon reduction
Howard Siew, BASF, USA, discusses how co-processing renewable and recyclable feedstocks can help to reduce the carbon footprint in FCC units.
23 Scaling the plastics value chain
Milica Folić, Topsoe, considers how to enable scalable chemical recycling of plastic waste to create drop-in naphtha.
27 What to do with waste
José Miguel González, Tecam, examines the role of chemical recycling in creating a circular economy.
30 Carbon capture sets sail
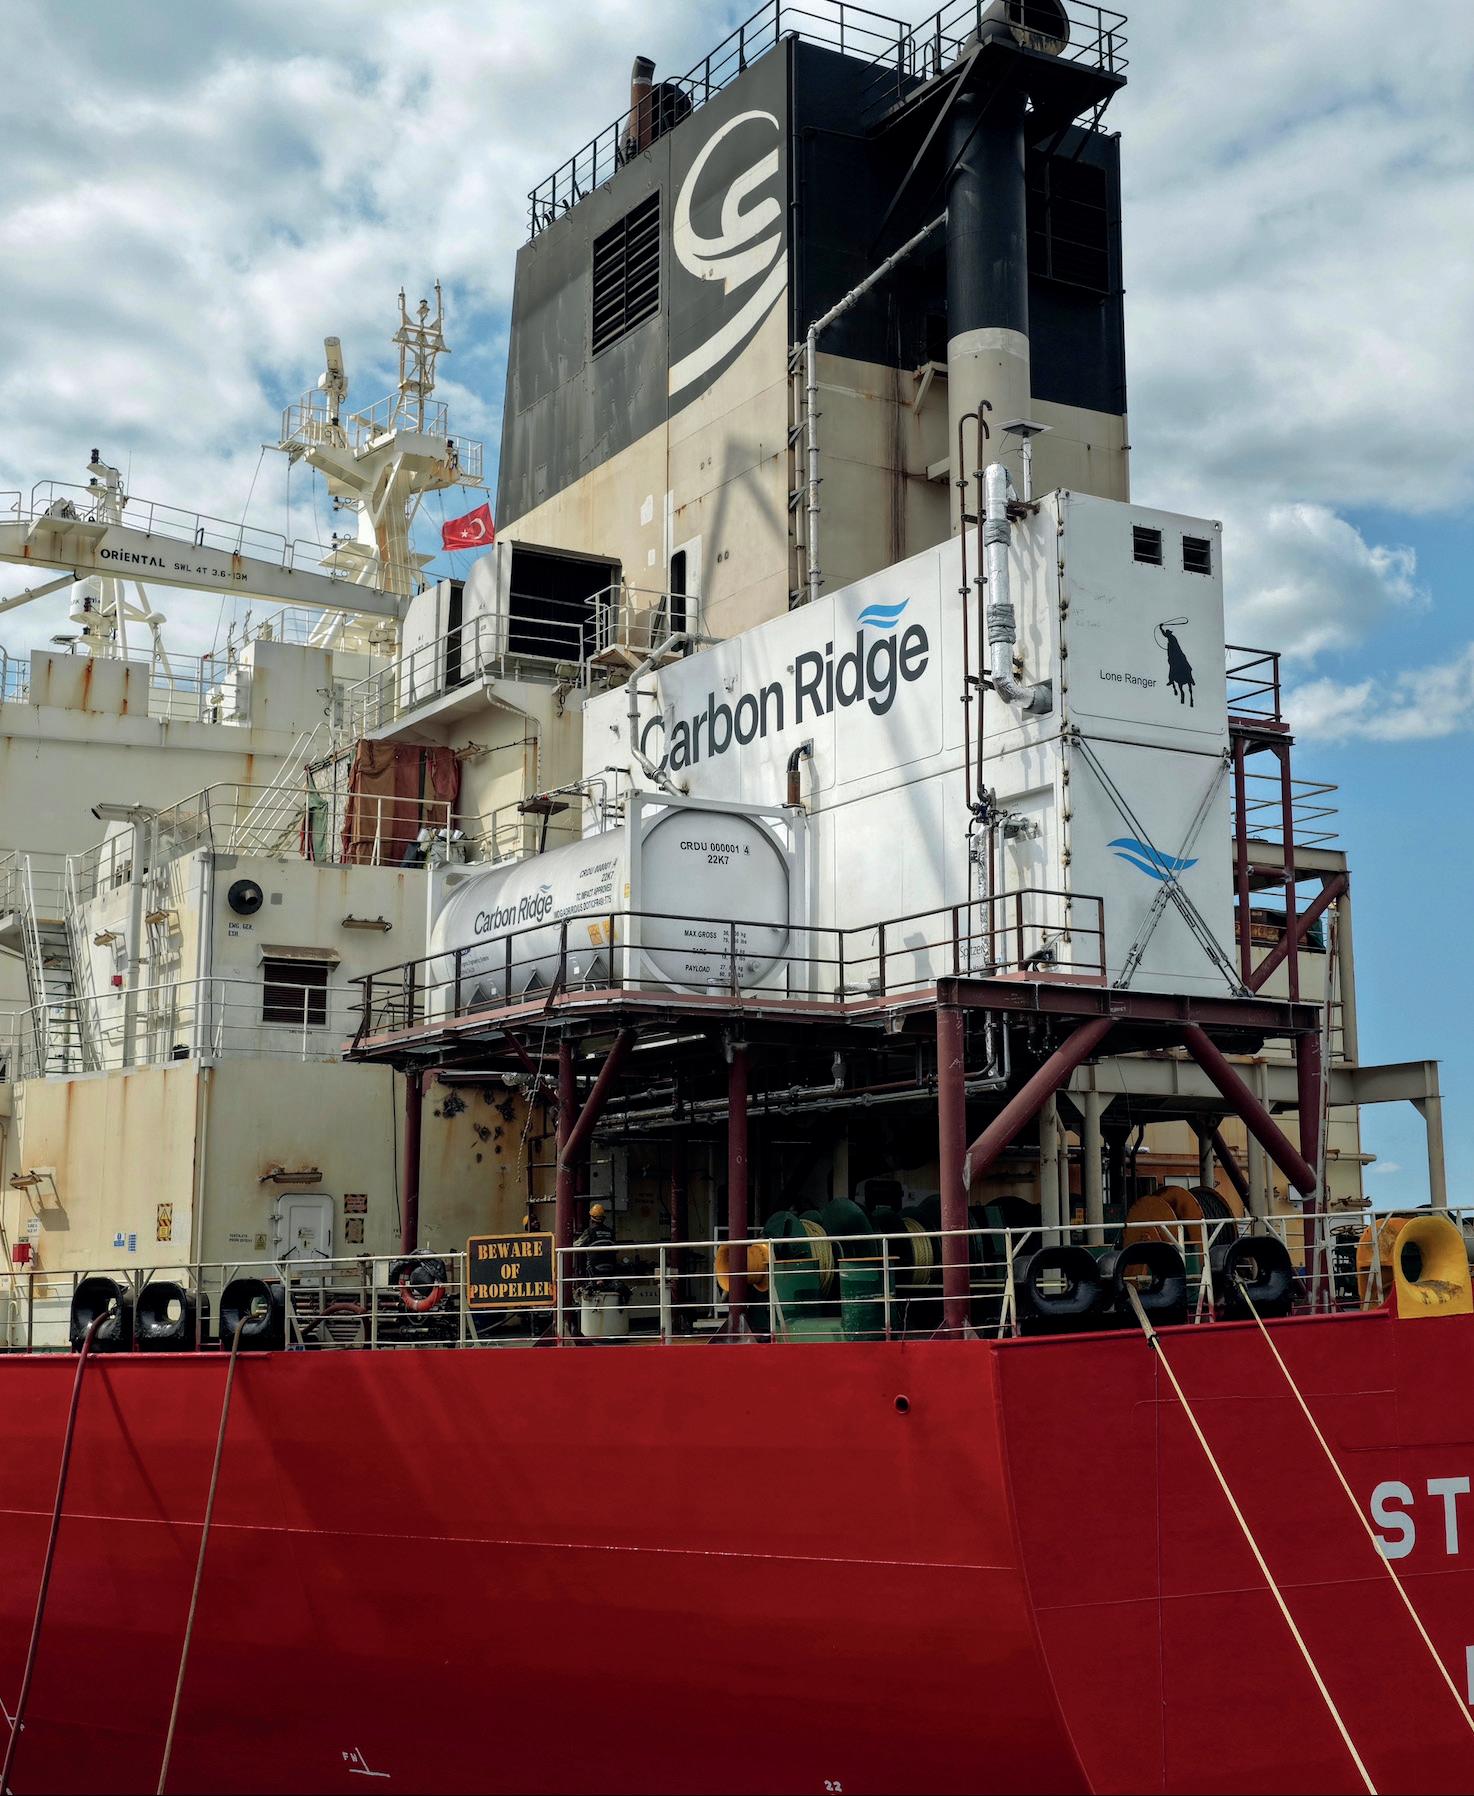
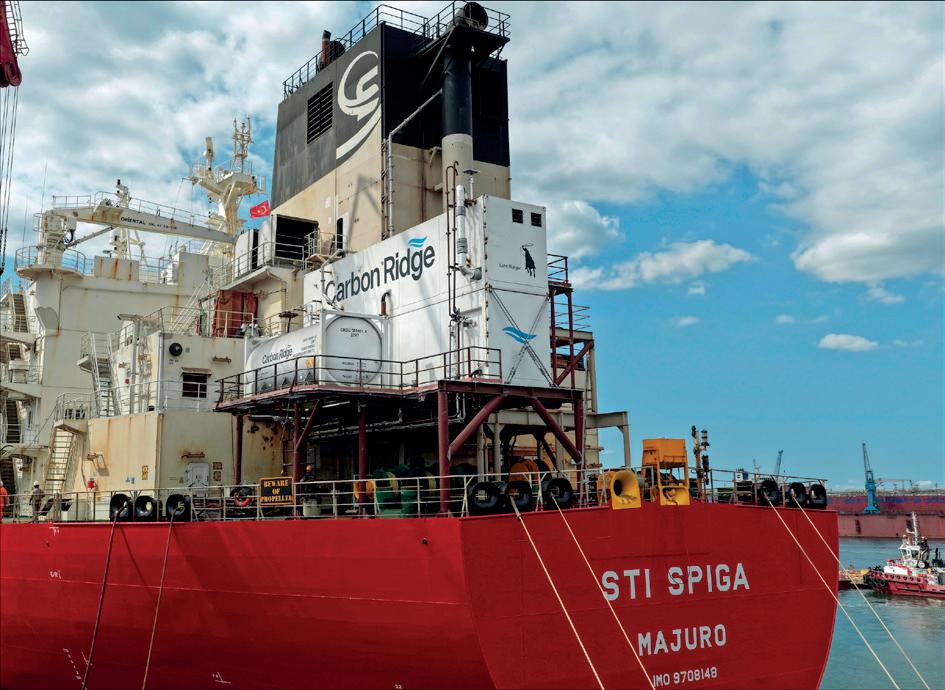
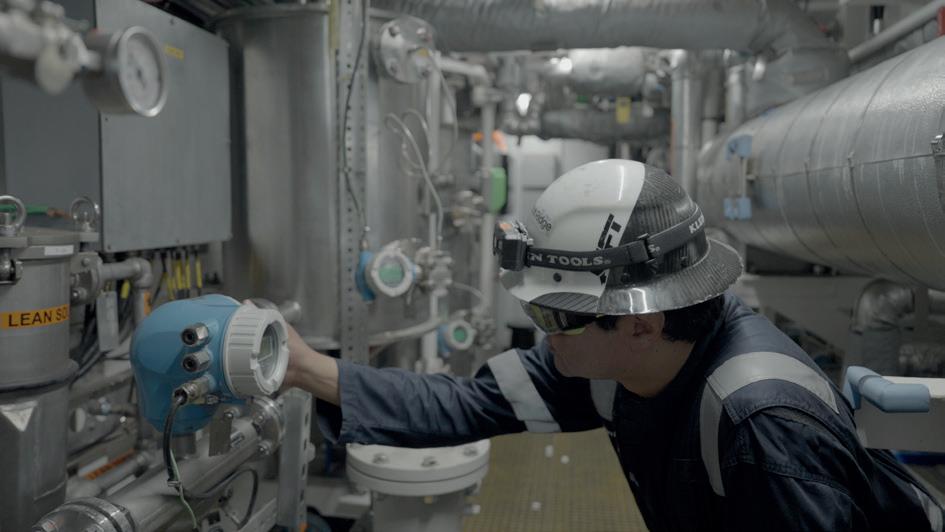
Sophia Asal, Endress+Hauser, Switzerland, and Anastasija Kuprijanova, Carbon Ridge, USA, outline how carbon capture can be used to decarbonise the hard-to-abate sectors of global trade and infrastructure.
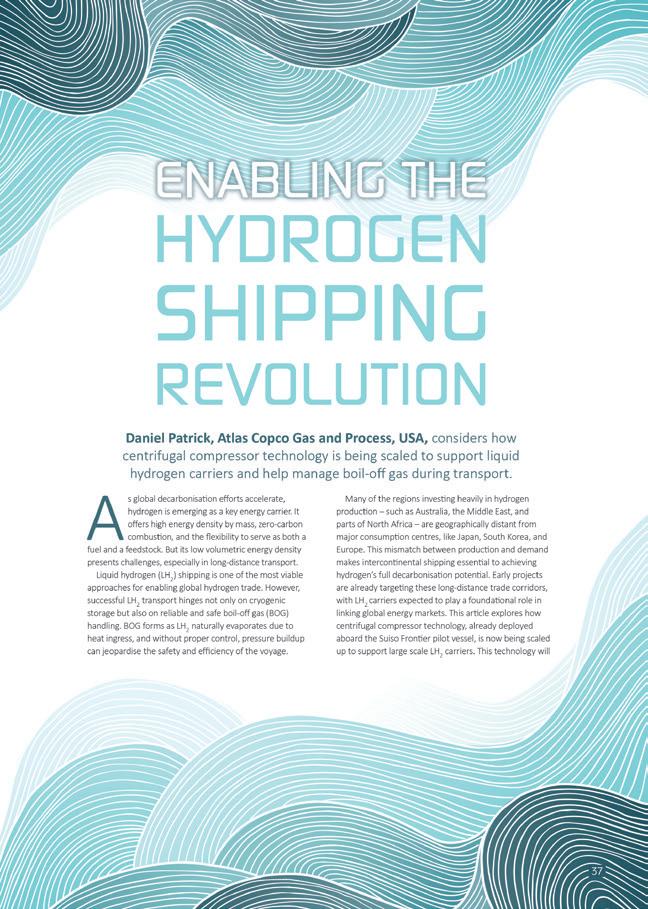
Jeroen Huizinga, John Crane, explores sustainable fuels in the marine transportation industry, charting the development of LNG as a bridge fuel, alongside considering the future role that ammonia, hydrogen, and methanol could play.
39 Carbon oxidation monitoring in blue hydrogen production
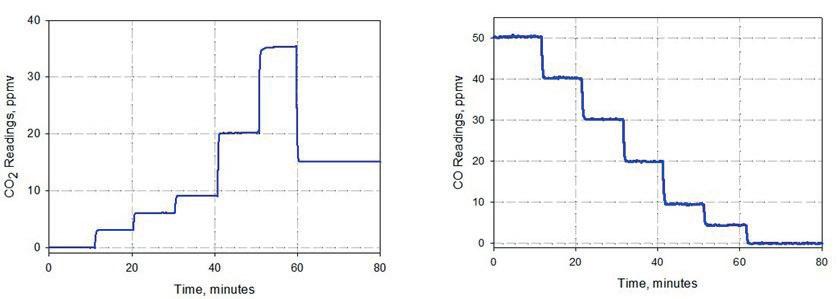
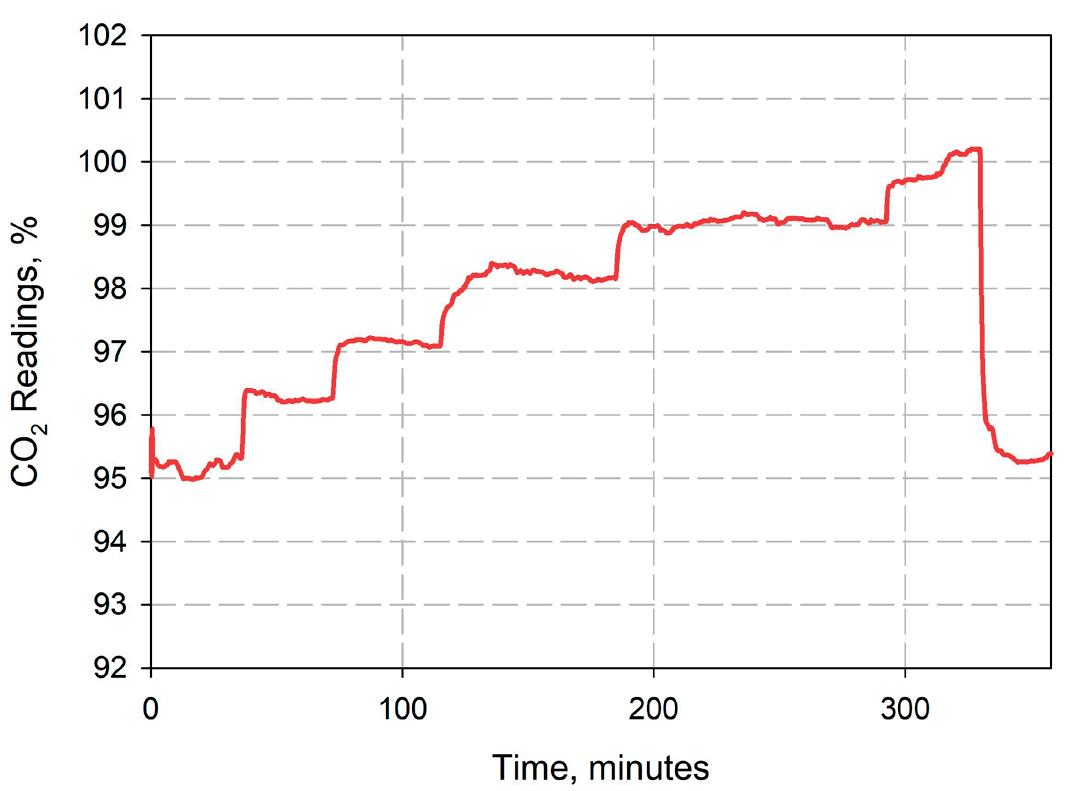
Airat Amerov and Michael Gaura, AMETEK Process Instruments, USA, evaluate the use of tunable diode laser absorption spectroscopy to measure carbon dioxide and monoxide levels in carbon capture and storage.
43 Green hydrogen at scale
Nicolas Carrara, Juan Ruiz, and Carlos Ruiz, KBC (A Yokogawa Company), explore the challenges of industrial scale deployment of green hydrogen and how advanced technologies can help operators to cross the chasm.
49 Keeping it close to home
Andrew Symes, OXCCU, UK, explains why Europe should prioritise producing sustainable aviation fuel locally rather than depending on imported methanol.
51 Sulfur, safety, and sustainability
Juan J. Gonzalez, Merichem Technologies, considers how refineries and petrochemical operations can reduce sulfur emissions for increased safety and sustainability.
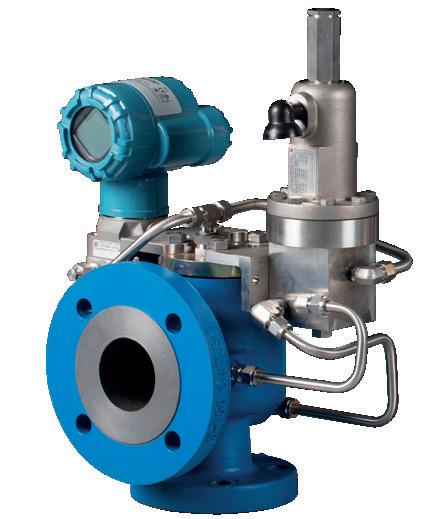
55 Emission reduction solutions
Frank Campagna and Alice Shao, Emerson, USA, discuss how technological improvements in design, valve packing, and relief valves address a host of emission and maintenance problems in downstream oil and gas facilities.
59 Energy efficiency: the ‘first fuel’ of decarbonisation
Dr Ankush Gulati, ABB Motion Services, Singapore, outlines why energy intensive industries should prioritise energy efficiency in order to reach their climate goals.
Carbon Ridge is advancing maritime decarbonisation with its compact, modular onboard carbon capture system – engineered for retrofits or newbuilds. The system delivers high capture efficiency with reduced footprint and low operational costs. Supported by precision instrumentation from Endress+Hauser, the technology enables shipowners to meet emission targets while maintaining fleet value.
ET Black™ Technology
Cut your CO2 emissions by 50% with the future of carbon black production
Compliant and innovative
Meets stringent environmental regulations, keeping your business future-ready
Unparalleled flexibility
Produce all ASTM grades and specialty grades seamlessly in a single plant
Sustainable Uses thermal decomposition of aromatic oils for cleaner production
CONTACT INFO
MANAGING EDITOR James Little james.little@palladianpublications.com
ADMIN MANAGER Laura White laura.white@palladianpublications.com
SUBSCRIPTION RATES
Annual subscription £110 UK including postage /£125 overseas (postage airmail). Two year discounted rate £176 UK including postage/£200 overseas (postage airmail).
SUBSCRIPTION CLAIMS
Claims for non receipt of issues must be made within 3 months of publication of the issue or they will not be honoured without charge.
APPLICABLE ONLY TO USA & CANADA
Hydrocarbon Engineering (ISSN No: 1468-9340, USPS No: 020-998) is published monthly by Palladian Publications Ltd GBR and distributed in the USA by Asendia USA, 701C Ashland Avenue, Folcroft, PA 19032.
Periodicals postage paid at Philadelphia, PA & additional mailing offices.
POSTMASTER: send address changes to HYDROCARBON ENGINEERING, 701C Ashland Ave, Folcroft PA 19032.
15 South Street, Farnham, Surrey
GU9 7QU, UK
Tel: +44 (0) 1252 718 999
COM MENT
CALLUM O'REILLY SENIOR EDITOR
Much has changed in the energy sector since we published the inaugural issue of this EnviroTech supplement last year. Perhaps most notably: the return of President Donald Trump to office, signalling a seismic shift in US energy policy with worldwide implications.
The President has pushed forward with his ‘America first’ energy policy, quickly withdrawing the US from the Paris Agreement (again), reversing clean energy support policies, and promoting the use of fossil fuels to ‘unleash American energy’.
In its latest ‘Energy Transition Outlook’, DNV notes that recent changes in US energy policy – combined with the fact that only six countries have reduced their emissions in line with the Paris Agreement, a decade on from its adoption – have led to broad recognition that the world is unlikely to achieve net zero emissions by 2050. Indeed, DNV’s flagship report now forecasts all the way out to 2060 for the first time, recognising that the transition will by no means be complete a decade earlier. “Faced with these developments, a casual observer might conclude that the energy transition is stalled or in reverse. That is most definitely not the case. The energy transition is rolling on,” reassures Remi Eriksen, DNV’s Group President and CEO, in the foreword to the Outlook.
The report begins with a series of ‘highlights’ for those looking to extract the key findings. Pointedly, highlight number one reads: “Policy reversals in the US will have only a marginal impact on the global energy transition.” DNV estimates that emission decline in North America has slowed down by around 5 years, and projects only a marginally slower energy transition than it forecast last year. However, although current US energy policy may not have a long-term impact on decarbonisation efforts, DNV doesn’t expect to see net zero CO 2 emissions until 2090.
The report reiterates that urgent action is required to limit global warming to well below 2°C.
As we all know, the energy evolution is here, and our sector has a vital role to play. As energy demand continues to grow, fossil fuels will remain a significant part of the energy mix for the foreseeable future. But it is essential that the downstream sector continues to decarbonise its operations and invest in its future.
This issue of EnviroTech is packed with technical articles and case studies exploring how the sector can grasp the opportunities presented by the energy transition and thrive in the new energy reality.
As Alan Gelder, Vice President of Refining, Chemicals and Oil Markets at Wood Mackenzie, explains in his keynote article starting on the next page of this issue, “Industry players must balance immediate operational pressures with long-term positioning for the energy transition.”
Of course, this is an extremely difficult balancing act, but the rewards could be transformative – delivering lasting value for both companies and the planet.
Alan Gelder, Wood Mackenzie, surveys the current attempts to decarbonise the refining and petrochemical sectors, alongside considering the challenges operators are facing in these undertakings.
Fossil fuels remain the backbone of modern life.
But while these low cost, energy dense feedstocks power our economy, a stark paradox emerges. Despite record renewable energy deployment and surging electric vehicle (EV) adoption, global emissions continue rising. In 3Q25, global oil demand is set to breach over 105 million bpd, almost 10 million bpd higher than a decade after the world leaders signed the Paris Agreement. Despite a decade of climate commitments, the energy transition faces mounting headwinds as emissions climb despite unprecedented clean energy investment. The need to decarbonise the oil value chain will remain critical. Decarbonisation requires investment at facilities that must
remain commercially viable for years to come. This presents both opportunities and threats for the downstream sector.
Oil value chain emissions
This emissions challenge becomes clearer when examining where they originate. In 2024, global primary energy demand was 636 exajoules, with over 80% supplied by fossil fuels (Figure 1). Oil’s share has been in slow decline from over 35% in 2000 to just under 30% in 2024. Global CO2 emissions were over 37 billion t in 2024, dominated by the power and industrial sectors. The combined emissions from transportation were just under 22% of the total, mostly from oil. The sheer scale of these emissions and the breadth of
sources across the global economy show the challenge to achieving net zero.
Wind and solar are decarbonising the power sector. Growing electrification is primarily decarbonising the transport sector, with EV penetration moving at pace in China and Europe. EV penetration in the US proceeds at a much slower pace than elsewhere and faces reduced government support. Global oil demand is to continue to grow in the medium-term and remain resilient over the coming decades. Growing adoption of EVs and improving energy efficiency will drive global oil demand into decline. However, the refining sector has a long future ahead of it, supporting sustained petrochemical demand growth either
from integrated refinery and petrochemical sites or by supplying its feedstocks.
Refining is an energy intensive part of the oil value chain, with its emissions often exceeding those from the upstream sector (Figure 2).
Refining process emissions are primarily from combustion (fuel for process heaters and fluid catalytic cracking catalyst regeneration), on purpose hydrogen production, and electricity consumption. Refinery emissions are closely related to asset complexity, given the larger energy requirements from the greater conversion to high value refined products associated with more sophisticated configurations.
Decarbonising the downstream sector is multi-faceted (Figure 3), involving both a reduction of the emissions from refinery operations alongside the carbon intensity of its products, all of which require investment.
Decarbonising operations
There is a clear commercial incentive to lower carbon emissions at sites exposed to emission charges. Good practice is to focus on overall energy efficiency and process optimisation. There are multiple technologies for emissions reductions, pre or post-combustion, but the primary focus is on displacing fossil fuels by low-carbon options, such as low-carbon hydrogen, and capturing emissions using carbon capture and storage (CCS).
CCS is currently capturing over 80 million tpy of carbon dioxide, but the downstream sector accounts for less than 5%. A key challenge to deploying CCS technologies in the downstream sector is that low levels of carbon dioxide in post combustion gases are spread across disparate point sources, resulting in costs that are often higher than the savings from lower emissions. There is significant CCS capacity under active development, but most of the capacity is being developed for the fossil power sector and upstream oil and gas production. CCS deployment will also receive help from recent US legislative developments that has standardised available tax credits. As with any large capital
project, economies of scale prevail for CCS. Refiners located in industrial clusters will have the opportunity to partner with adjacent industries to jointly decarbonise their combined operations.
Low-carbon hydrogen is an interesting example of an opportunity supported by the refining sector in Europe. Like CCS, the economics of emissions reduction are challenging. Displacing hydrogen produced from natural gas with that produced by electrolysis using renewable power typically incurs high power costs. Several green hydrogen projects have targeted the sector, with European refineries already committing more than US$5 billion of capital. This is due to the decarbonisation of refined products adding value to the cost savings benefits.
Decarbonising products
Decarbonising the energy sector is a key European aspiration. This is being achieved by growing biofuel penetration into transport fuels, along with circularity requirements for plastics to reduce demand for virgin material. There are opportunities for liquid biofuels in both the aviation and marine sectors. The current Renewable Energy Directive legislation (RED III) introduces a requirement for renewable fuels of non-biological origin (RFNBO), including multipliers for RFNBOs in the marine and aviation sector to support their commercialisation. Green hydrogen is RFNBO compliant and can be deployed in the refining sector to deliver the 2030 targets.
Decarbonising the maritime sector
The International Maritime Organization (IMO) has introduced a net-zero framework to cover the emissions from virtually all vessels. The greenhouse gas fuel intensity for each vessel is to be reported and improved over time, with a market compliance mechanism introduced to support zero or near zero (ZNZ) fuels.
Marine biofuels are expected to increase steadily over the next decade, also driven by the introduction of the
Source: Wood Mackenzie
Source: Wood Mackenzie
Figure 1. Global primary energy consumption and carbon dioxide emissions (2024).
Reliable Technologies for H2S, Mercaptan & COS Treatment or Removal
Turn yellow into green using our low OPEX, proven sulfur treatment technologies.
Merichem Technologies is a leader in sulfur treatment technologies, providing safe and eco-friendly solutions to remove H2S, mercaptans and COS from both liquid and gas streams. Whether it’s customized or standard, adsorbents or chemical processes, our robust technologies allow you to maximize profitability while meeting your specifications at any scale.
With over 50 years of experience delivering innovative solutions and excellence in service, you can trust we will do the same for you.
Let’s discuss your specific requirements and how we can help.
EU Emissions Trading Scheme (ETS) and Fuel EU Maritime regulations (Figure 4). There are a range of biofuel blends now proven in the marine fuel market, based on fatty acid methyl esters (FAME) or used cooking oil, typically blended in with very-low sulfur fuel oil (VLSFO). Wood Mackenzie expects marine biofuel volumes to increase over the next decade, but long-term growth is restricted by the lack of supply availability and increasing feedstock competition from the aviation sector. Furthermore, liquid biofuels do not achieve the emissions requirements for ZNZ fuels. Over the longer term, e-fuels, such as e-methanol and e-ammonia, will be needed, particularly in Europe. E-diesel could appear as a shipping industry fuel during the 2040s given its drop-in nature.
Europe has also carved out €800 million from its latest Hydrogen Bank auction to support maritime supply projects. However, under the current IMO pricing mechanism, it will take time for hydrogen-based fuels to be competitive with incumbent fuels.
Sustainable aviation fuel (SAF)
International bodies and governments are committed to reducing aviation carbon emissions, with the EU leading the charge. Improvements in aircraft efficiency, infrastructure, and other operational improvements are minor compared with
the opportunity to deploy SAF that is either bio-based or synthetic (e-SAF).
The ReFuelEU Aviation regulatory framework requires SAF to power 6% of the jet pool by 2030, of which an average of 1.2% is to be e-SAF, produced from RFNBO-compliant green hydrogen. By 2050, the SAF blending mandate is 70%, of which half must be e-SAF.
SAF is largely produced from hydroprocessed esters and fatty acids (HEFA) feedstocks, using waste oils and alcohol-to-jet (ATJ) facilities. Biomass to liquids is a potential future route offering a wider feedstock pool but is challenged by high capital costs.
Figure 5 highlights the potential opportunity for significant future growth of SAF supplies. Feedstock, technology, and cost constraints must be overcome if the ambitious long-term net zero targets for aviation are to be met.
Petrochemical circularity
The production of plastics is a major contributor to global carbon emissions, with the long lifetime of plastics presenting a challenge to the broader natural environment. The concept of the circular economy was born out of this dilemma. The circularity of polyolefins requires a vertical sectoral view, as equipment must be dismantled and waste sorted as essential pre-requisites. The promotion of plastics recycling, both mechanical and chemical, requires diversion away from landfills as a start, supported by the development of the sustainable use of materials – rigid materials are far easier to mechanically recycle. Today, 70% of polyolefins are in applications that are hard to recycle. Pyrolysis (chemical recycling) is off to a slow start as an industry. Value chain integration incorporating waste collection and processing will be essential for its success and sustained growth. This will overcome sensitivity to feedstock quality along with a material improvement in selectivity, as the operational yields are currently low. Pyrolysis oils vary in quality and the EU exempting fuels from its mass balance determination of recycled content. In Europe, pyrolysis oils need to be pre-treated to remove contaminants and upgraded to a naphtha boiling range to fully capitalise on EU regulatory support.
Downstream commercial performance will drive choices
Margin pressures across refining and petrochemicals will dictate which facilities can afford decarbonisation investments. The refining system has a diverse asset base of 700 facilities, making any investment case site-specific.
Figure 4. Outlook for marine biofuels by region and e-fuel demand. Source: Wood Mackenzie Product Markets Service.
POWERFUL CHEMISTRY, UNPARALLELED EXPERTISE
KETJEN’S INDUSTRY LEADING CATALYSTS UNLEASH THE POWER OF ADVANCED CHEMISTRY THROUGH:
INVESTMENTS to meet future production supply demands.
INNOVATIONS that expand profitability and efficiency, while lowering costs.
INSIGHTS, based on customer interactions and market factors, allowing for rapid response to industry needs.
Learn more at KETJEN.COM
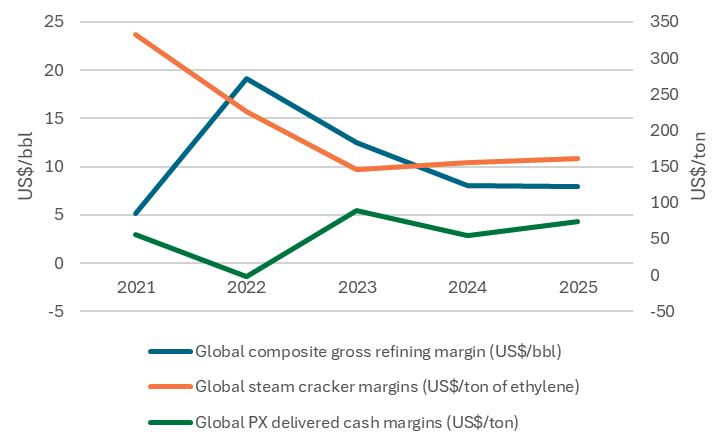
However, the broader market context cannot be ignored, as shown in Figure 6.
Global refining margin performance for 2025 is expected to be broadly flat on 2024, both lower than the highs of 2022. Global ethylene margins are weak, with capacity rationalisation in Europe and other high-cost locations ongoing. The surplus of global steam cracker capacity stems from significant over-build in China. Global paraxylene (PX) margins have been in the doldrums for a while, with signals of recovery in 2025.
The near-term outlook for the sector is still challenged, as global composite refining margins are projected to be at their low point in 2026 before recovering, after which the rising tide of demand lifts global utilisation. For chemicals, particularly the olefins chain, recovery is not projected to happen until the late 2020s, such is the scale of the overbuild in China. The PX recovery is projected to be sooner than olefins, given the shift of olefins to lighter feedstocks. The near-term outlook for the downstream sector is complicated by US trade tariff policy, which could slow economic activity further and lower demand growth for refined products and petrochemicals.
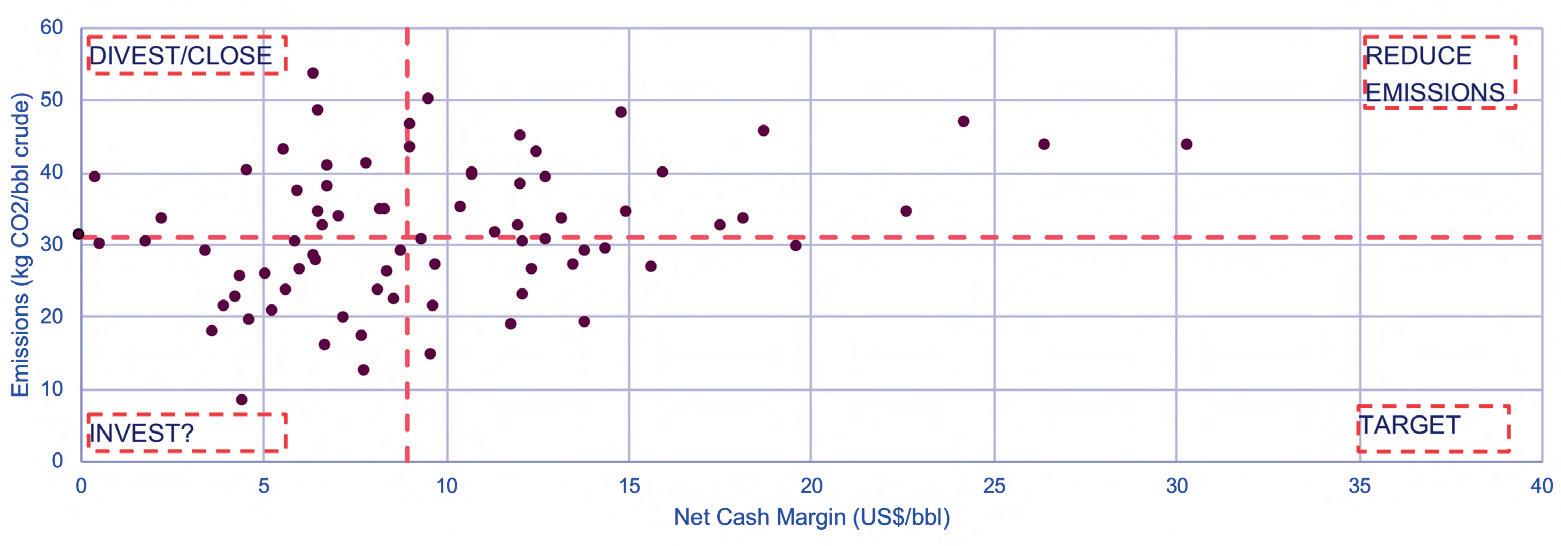
Tight cost management is the order of the day. The market fundamentals of refining and commodity chemicals require sustained focus on reliable operations, value maximisation, and frugal investments. This means that decarbonisation investments will not occur at all sites. Owners of a portfolio of sites need to focus on sites in the ‘target quadrant’ of the matrix of competitive position and emissions (Figure 7). These will be the sites that are well positioned to adapt to decarbonisation, as they deliver higher earnings with low emission intensities.
These sites can benefit from the shift to liquid biofuels and development of RFNBOs, providing they focus on the critical success factors for each specific opportunity, notably securing feedstock supply for liquid biofuels and low-cost renewable power and economies of scale for RFNBOs.
For those sites well positioned for a lower carbon future, in a global environment full of uncertainty, a key challenge will be timing of their transition. Owners need to regularly review market developments and investment metrics to identify when to trigger a material transformation.
Conclusions
Decarbonising the downstream sector is both an opportunity and threat. The threat stems from declining demand for fossil fuels and rising cost of emissions, both driving capacity rationalisation. The opportunity lies in growing demand for liquid renewables, both bio-based and synthetic, along with petrochemical circularity. The transition between the two will not be smooth, requiring each site to focus on their competitive advantage now and in a future lower carbon environment.
Success will depend on timing, feedstock security, and the ability to navigate an increasingly complex regulatory landscape whilst maintaining commercial viability. Industry players must balance immediate operational pressures with long-term positioning for the energy transition. Those who master this balance will emerge as winners in the evolving downstream landscape.
Figure 5. Global SAF demand forecast by fuel type. Source: Wood Mackenzie Liquid Renewable Fuels Service.
Figure 6. Downstream sector commercial performance. Source: Wood Mackenzie offerings on product markets, olefins, and PX.
Figure 7. Europe downstream earnings vs emission matrix (2023). Source: Wood Mackenzie Refinery Evaluation Model.
James Jenkins, DNV, UK, considers the different strategies used in the decarbonisation of midstream oil and gas and thermal power generation in support of electricity grid resilience.
Progress towards net zero is slowing in key geographical regions, increasing pressure on emissions-intensive sectors, particularly fossil fuel thermal power generation and midstream oil and gas. Decarbonising these sectors is critical as they sit at the intersection of two essential, mutually dependent infrastructures: the gas network and the electricity grid. The UK electrical grid relies on natural gas for flexible thermal power and stability, while the gas network
increasingly depends on the grid for its operational control systems.
In the UK, transforming these sectors is essential to meeting legally binding climate targets:
n 2032: 58% reduction in greenhouse gas emissions vs 1990.
n 2037: 68% reduction vs 1990.
n 2050: net zero.
According to DNV’s ‘UK Energy Transition Outlook (ETO) 2025’, emissions could fall to around 145 million t of CO 2 by 2050 – an 82% cut from 1990 levels – yet still miss the net zero goal. The pace must accelerate, and it cannot do so in silos. Decarbonising one backbone of the energy system without the other risks reliability shortfalls, higher costs, and public resistance.
These sectors are both a major industrial emitter and a strategic backbone of the UK’s energy system. Its transformation is a climate imperative and a driver of a more secure, resilient electricity grid. Wide scale electrification and additional grid infrastructure are needed to meet UK decarbonisation targets. The UK’s electrical grid boasts exceptional reliability >99% in 2023/24 – enabled in part by the gas grid, which provides consistent energy to dispatchable power generators, helping to balance fluctuations.
Grid operators are investing in stability solutions like synchronous condensers, batteries, and power electronics. However, these alternatives can be costly or remain at low technological readiness levels. As such, a decarbonised midstream oil and gas sector can play a vital role in ensuring the UK’s expanding electrical grid retains resilience and energy security over both the near and long-term.
This ‘whole systems thinking’ approach is not new –National Energy System Operator (NESO) already models gas-electric interactions in winter planning.
The 2024/25 winter period highlighted the stakes: with peak gas demand for electric generation at 27.9 GW and a couple of days prior a 17 GW increase over a period of 5 hours. Also over the 2024/25 winter period there were 54 days where at least 40% of electricity was generated from gas. Without a gas network ready to deliver, blackouts would have been a real risk.
Whole systems thinking means recognising that one network’s decarbonisation must reinforce – not undermine – the other’s resilience. It also requires considering gas network decommissioning, which will not align neatly with the last customer switching to electricity. Planning is essential to ensure industrial users and thermal power generators are supported throughout the transition.
Decarbonisation levers in a whole system
Three parallel main strategies dominate the decarbonisation toolkit:
n Electrification and fuel switching – removing fossil fuel combustion and replacing it with low-carbon electricity.
n Carbon capture and storage (CCS) – capturing unavoidable CO 2 emissions from industry (e.g. refining, power, cement, and energy from waste).
n Low-carbon hydrogen and derivatives – substituting grey hydrogen in refining, providing hydrogen for high-heat industrial processes, and enabling energy storage with dispatchable power.
Each lever contributes differently to decarbonisation and grid resilience, making integration essential. They are most effective not as isolated measures, but as mutually reinforcing parts of an integrated system.
Electrification
Electrification, particularly replacing fossil fuel combustion with electric heat and power, is one of the most direct ways to cut operational emissions. For example, in refineries, electric boilers, heaters, and motors can displace gas-fired units in process heating, distillation, pumping, and other thermal applications.
The benefits are two-fold:
n Immediate Scope 1 and 2 emissions reductions, especially as the UK grid continues to decarbonise.
n Air quality improvements by eliminating on-site hydrocarbon combustion, reducing NO X and particulate emissions.
From a whole systems perspective, industrial electrification brings both opportunity and challenge. Replacing on-site fossil fuel combustion with cleaner power also increases electricity demand. Meeting that demand reliably requires coordination with the gas network, which can supply dispatchable generation during low renewable output. Thus, electrifying one sector reinforces the need for a clean, flexible gas system to backstop the grid.
Electrification also shifts emissions upstream, making it essential that the additional power demand is met by low-carbon generation and supported by gas system flexibility and storage. Electrifying industry does not mean abandoning the gas network; rather, it means reconfiguring the gas network through repurposing the gas infrastructure with low carbon solutions (e.g. hydrogen, biomethane) to complement a renewables-led grid.
A DNV case study for a European refinery illustrates the impact: replacing two large gas-fired boilers with electric units cut direct CO 2 emissions by over 100 000 tpy but increased site electricity demand by 90 MW – equivalent to around 800 000 MWh yearly, or enough to power approximately 135 000 homes. Such shifts need integrated grid-gas network to ensure stability and resilience.
In the UK, many industrial clusters are in coastal areas with high-voltage connections that may need reinforcement for substantial new loads and renewable supplies. In some regions, grid capacity may already be under pressure from other major projects, including offshore wind landfall points, data centres, and gigafactories. For instance, rapidly growing data centre
demand has prompted recent inquiries for up to 2.5 GW of on-site gas generation due to grid connection delays, underscoring pressure on local capacity.
CCS
CCS is essential for tackling emissions that electrification cannot address – making it indispensable for deep decarbonisation in refining, heavy manufacturing (cement and steel), and energy from waste, where some emissions are inherent to the process. For example, capturing CO 2 from steam methane reformers (SMRs) in hydrogen production or catalyst regeneration units can eliminate large volumes of emissions that switching to electricity alone cannot.
Global CO 2 capture capacity is forecast to reach around 270 million tpy by 2030 and 1300 million tpy by 2050, still far below the net zero requirement. Achieving the needed scale will depend on sustained cost reductions – projected to average about 40% by 2050 –alongside supportive policies and investment frameworks.
In the UK, CCS dovetails with the government’s cluster sequencing programme, advancing industrial carbon capture in North West England, Teesside, Humber, and Scotland – all home to significant downstream oil and gas assets and heavy industry. Linking industrial emissions into these CCS clusters allows captured CO 2 to be transported via shared pipelines to offshore Irish Sea or North Sea storage sites. This ‘cluster’ approach reduces costs and accelerates deployment by aggregating demand for transport and storage infrastructure.
The UK’s CO 2 storage potential is vast – estimated at over 78 Gt in saline aquifers and depleted hydrocarbon fields – enough to support CCS for decades if developed alongside emissions sources.
From a whole system perspective, CCS also bolsters energy security. It enables low-carbon hydrogen and
power generation from domestic natural gas to continue within stringent carbon limits, reducing import reliance during supply disruptions and safeguarding UK energy system resilience.
Low-carbon hydrogen and derivatives
Hydrogen is a crucial energy carrier for a decarbonised system, particularly in hard-to-abate sectors like aviation, shipping, and high-heat industry, as well as an energy storage vector. By 2050 – when much of the world targets net zero – DNV predicts hydrogen and its derivatives will account for over 4% of final energy demand (188 million tpy of H 2). However, to meet the Paris Agreement’s goals, they would need to supply about 15% of global energy demand by 2050.
In the UK, DNV projects hydrogen production will reach 1 million tpy by 2030, with 60% being low-carbon. By 2050, UK production is expected to rise to 5 million tpy, with 23% used for dispatchable low-carbon power and industrial processes.
Low-carbon hydrogen will replace grey hydrogen (hydrogen produced from natural gas through steam methane reforming [SMR], which results in significant CO 2 emissions that are released into the atmosphere) in refining and serve as a dispatchable low-carbon fuel for power. Internationally, projects like the Netherlands’ HyStock and Japan’s Chiyoda SPERA hydrogen chain demonstrate how large scale hydrogen storage can integrate with grid services. The UK could adopt similar models – using curtailed offshore wind to produce hydrogen, storing it in geological structures (e.g. salt caverns), and reconverting it to power when needed.
Hydrogen derivatives (ammonia, e-methanol, and synthetic e-fuels) extend this potential as drop-in fuels or more easily transportable, storable forms of low-carbon energy. Ammonia’s higher energy density and
Figure 1. Illustration of National Gas Network Innovation Competition NIC FutureGrid Phase 1 Project where DNV is the primary partner responsible for design, building and operating the test facility for the research project at Spadeadam, UK.
easier liquefaction make it a candidate for maritime fuel and power station co-firing, although its toxicity does remain a concern for many sectors. E-methanol could find use in shipping and chemicals. However, their deployment depends on overcoming safety and handling challenges.
Closing safety and knowledge gaps
Large scale adoption of hydrogen, CCS, and ammonia demands not only engineering solutions but also robust safety science to manage new hazards. DNV supports the energy transition through research at its Spadeadam facility in the UK and other global testing sites to demonstrate the safe use of low-carbon energy vectors. Some examples of ongoing or future work include the following:
CO2 pipeline transport safety
CCS networks will involve hundreds of km of new and repurposed pipelines. The Skylark Joint Industry Project (JIP), led by DNV with the UK Health and Safety Executive Science Division (HSE SD) and partners, aims to address safety challenges in transporting dense phase CO 2 . It involves large scale rupture, dispersion, and venting scenarios to understand terrain effects, venting operations, emergency planning, and validate consequence models.
CryoCO2 JIP
Two knowledge gaps are identified: the heat transfer and erosion characteristics of impinging CO 2 jets, including protective materials’ performance; and valve and system performance under high-flow, dense-phase CO 2 conditions. The JIP intends to close these gaps through full scale testing to improve understanding and manage risks from high-flow, high-pressure CO 2 releases.
Self-ignition of hydrogen
National Gas FutureGrid – Phase 1 results, including testing at DNV Spadeadam, highlighted that key areas of uncertainty are associated with the generation of damaging overpressures following early ignition from a hydrogen pipeline rupture. These uncertainties can have a strong influence on the calculated risks. Work is ongoing on transient experiments to focus on the probability and timing of self-ignition from a buried hydrogen transmission pipeline rupture.
Hydrogen jet fire erosion
The external flame characteristics of hydrogen and natural gas are not significantly different. Internally, hydrogen jet flame temperatures and convective thermal flux are greater. Hydrogen jet fires may erode reactive passive fire protection (PFP) systems like intumescent coatings more than hydrocarbon jet fires. Gaps relate to properties within large scale hydrogen jet fires, particularly flame temperature and heat flux. Large scale experimental data is needed to confirm equivalence to natural gas jet fires and their relation to propane jet fires used to test PFP systems.
Resolving these technical gaps now ensure safety considerations will not bottleneck the energy vector’s deployment.
Benefits for grid resilience and energy security
Hydrogen-ready gas networks with sufficient storage, like salt caverns, can serve as large scale, distributed storage – converting surplus renewable electricity into hydrogen during excess generation and supplying it back for power during low-renewable periods. This intra-day, week, month, or seasonal balancing role is valuable in the UK, where surplus renewables can be stored for times of low supply and/or high demand.
The benefits of integration are tangible: modelling shows that coordinated gas and electricity system operation can reduce total system costs by billions yearly, avoid unnecessary capacity build-out, and strengthen resilience to extreme events. These synergies exemplify whole systems thinking – the electrical grid and natural gas, CCS, and H 2 networks working in harmony, supporting each other on the energy transition journey.
The road ahead
Momentum is building – electricity supply sector emissions fell 15% in 2024, whilst UK fuel supply sector emissions fell 6% and industry 9% – but the pace must increase to meet net zero milestones. Incremental change is no longer enough: high-emission sectors, like thermal power generation alongside midstream and downstream oil and gas sectors, must scale up hydrogen, CCS, and electrification in a coordinated, safe way.
A whole systems approach is vital to achieving net zero targets without compromising operational continuity or public trust. The downstream oil and gas sector plays a pivotal role in the UK’s energy transition. Decarbonisation efforts, through electrification of industrial processes, CCS, and low-carbon hydrogen, must be integrated with the electricity grid and gas network to ensure reliability and energy security. Industrial clusters in which the downstream sector are located, are central to this transformation, leveraging shared infrastructure and coordinated planning. Research and development with technical advisory and assurance are essential to scaling these solutions, with DNV leading efforts to close knowledge gaps.
DNV’s independent technical advisory and assurance expertise – from hydrogen pipeline testing to CCS dispersion modelling – provides the evidence base for investment, regulation, and safe deployment.
Whole systems thinking, such as planning industrial decarbonisation in lockstep with grid reinforcement and gas network transition, is the route to achieving climate targets without compromising energy security or grid reliability.
For refineries, this is both a challenge and an opportunity. Legacy infrastructure and carbon-intensive processes pose significant hurdles, but the emergence of low-carbon hydrogen, synthetic fuels, and carbon capture technologies provide a clear pathway to a more sustainable future. Governments, investors, and consumers are pushing for change, while policy mechanisms such as carbon pricing and emissions regulations are accelerating the shift. The risk of inaction is growing and refineries that fail to adapt could face increased operating costs, regulatory penalties, and declining competitiveness in a carbon-conscious market.
Advanced technology providers with expertise in catalysis and process technology are delivering innovative solutions to help refineries decarbonise, transition to alternative feedstocks, and produce low-carbon fuels at scale.
The need for energy transition in refining
Refineries play a critical role in the global economy, supplying fuels, chemicals, and materials that power industries and transport networks. However, they are also among the largest industrial sources of GHG emissions. The petrochemical sector alone is the third largest industrial emitter of carbon dioxide (CO 2 ), largely due to its reliance on fossil-based feedstocks such as crude oil, natural gas, and coal. Governments worldwide are introducing stringent emissions regulations, carbon taxes, and incentives to drive the adoption of cleaner technologies. The EU’s Fit for 55 package and China’s 2060 carbon neutrality targets all signal an era of heightened regulatory scrutiny and financial incentives for decarbonisation. Yet beyond regulation, market forces are shifting as
consumers and businesses favour sustainable products. To remain competitive, refineries must take proactive steps, integrating alternative feedstocks such as biomass and captured CO 2 , deploying carbon capture and storage (CCS) technology, and investing in low-carbon hydrogen production.
However, the transition is not without challenges. Unlike the power sector, which can directly adopt renewable energy sources, refineries require solutions that maintain process efficiency, ensure energy security, and allow for gradual infrastructure adaptation. This is where innovation becomes critical.
Innovation in refinery decarbonisation
Proven at scale advanced reforming technologies and future technological innovations are central to the decarbonisation of the refining sector. There are already mature reforming technologies and providers are investing in further improvements and innovations that are delivering solutions to reduce emissions, improve efficiency, and enable the shift to cleaner feedstocks.
Advanced reforming technologies, such as JM’s LCH TM technology, which combines gas-heated reforming and auto-thermal reforming, can achieve up to 99% carbon capture efficiency and offers >15% feedstock efficiency compared to steam methane reforming. 1 This represents a significant advancement over conventional hydrogen production, offering a scalable and cost-effective way to support emission reductions in refining, industry, and hard-to-abate sectors.
Retrofit options are also gaining traction. Catalysts and modular systems that enhance heat transfer or reduce pressure drops are helping refineries to cut emissions without major capital investment. These technologies, such as JM’s CLEANPACE TM technology, allow facilities to modernise incrementally, while maintaining performance and reliability. Beyond hydrogen, the demand for sustainable fuels is also rising. Sustainable aviation fuel (SAF), known in the US as synthetic aviation fuel, is expected to meet 50% of aviation fuel demand by 2050, according to the International Energy Agency (IEA).
Technologies that produce syngas from captured CO 2 and green hydrogen, such as JM’s HyCOgen TM technology, are providing new pathways for low-carbon fuel synthesis. Using processes such as Fischer-Tropsch, this syngas can be converted into synthetic crude oil, and
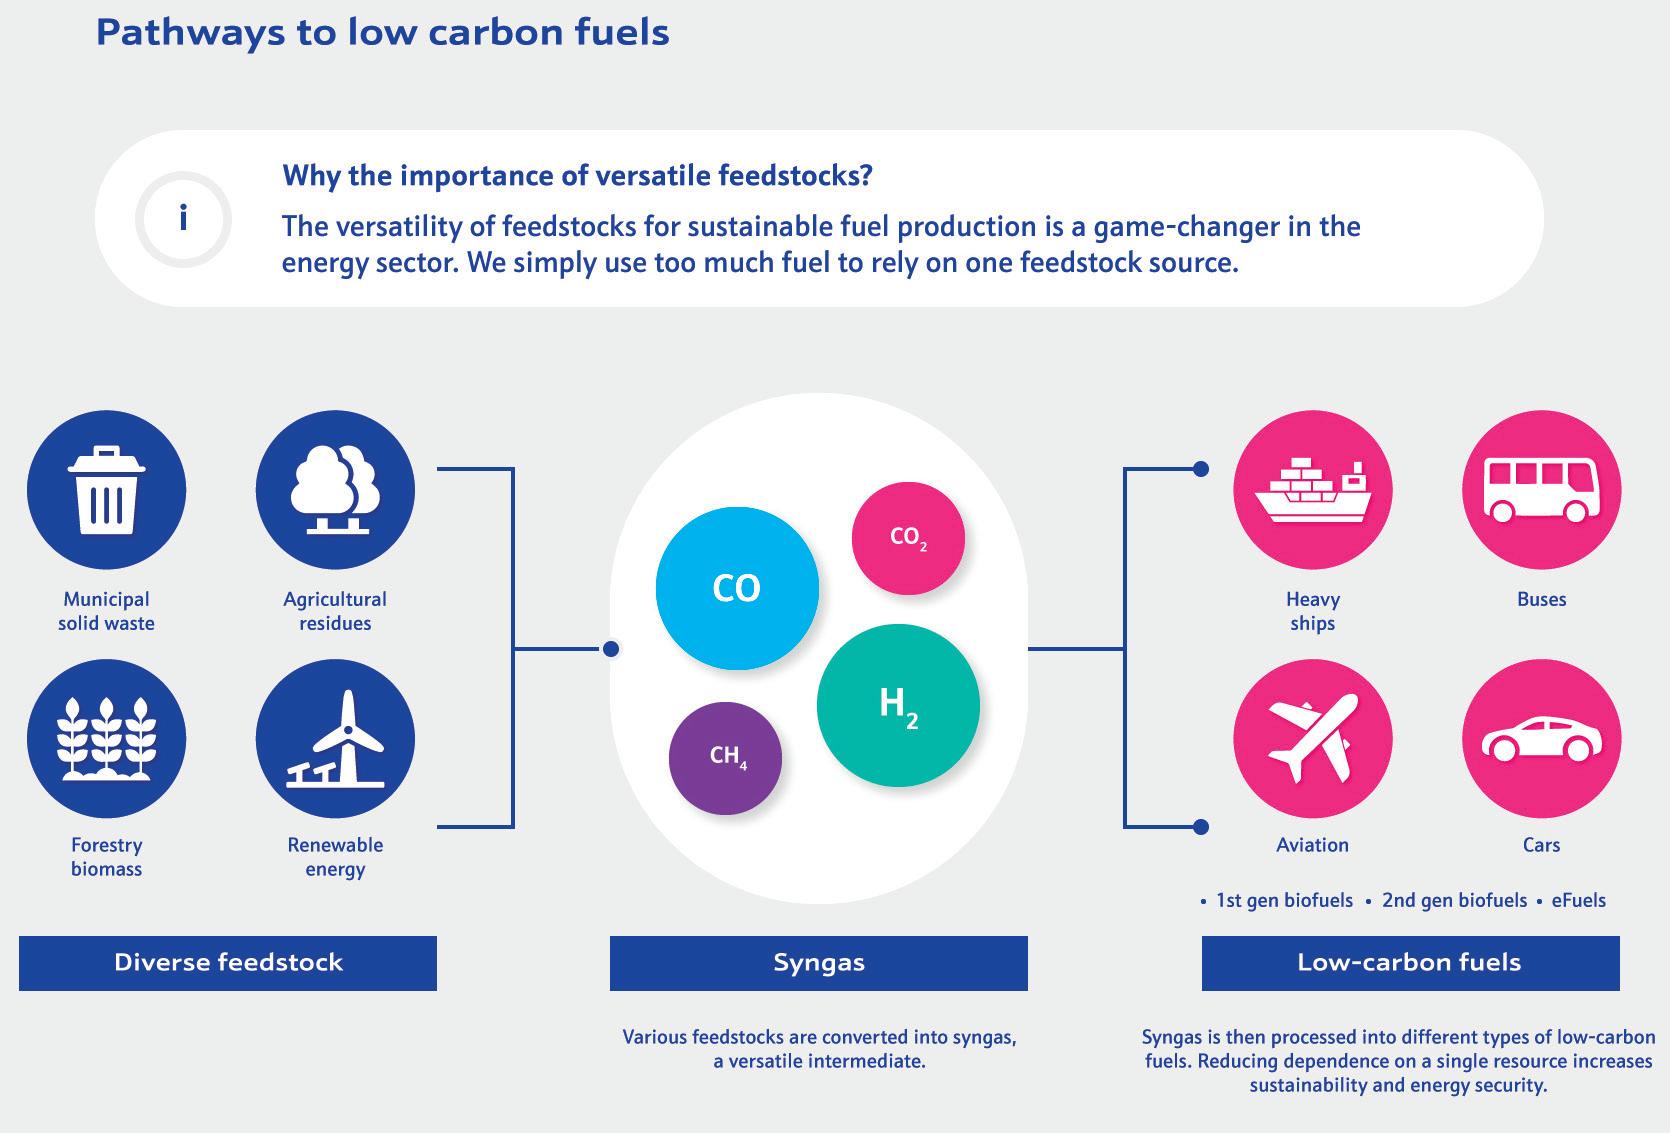
Figure 1. Feedstock versatility is critical to scaling sustainable fuel production.
subsequently into SAF and synthetic diesel: a particularly important step in decarbonising the transport sector.
Similarly, the production of e-methanol from CO 2 and green hydrogen is offering a viable alternative to fossil-based methanol in shipping and chemical applications. As the momentum behind power-to-liquid and e-fuel solutions grows, the availability of commercially deployable systems will be critical to enabling broad adoption.
Real-world applications: decarbonising refineries and beyond
These technologies are already being deployed in large scale decarbonisation projects worldwide. In the UK, the H2Teesside project is set to produce 700 MW of low-carbon hydrogen with 97% CO 2 capture, supporting industrial users in cutting emissions. Led by BP, this project is part of the UK’s broader net zero strategy.
In Spain, Repsol and Aramco are constructing one of the world’s first facilities to produce SAF using electrolytic hydrogen and captured CO 2 . This plant will begin with a production capacity of 2100 tpy of SAF, reducing emissions by 70% compared to conventional jet fuel.
Chile’s Haru Oni facility, developed by HIF Global, with Johnson Matthey and Siemens Energy as technology partners, is another milestone in scaling up e-fuels as an alternative to fossil-based transport fuels. By leveraging captured CO 2 and green hydrogen, the project demonstrates how synthetic fuels can complement the energy transition.
The economics of refinery decarbonisation
One of the biggest challenges facing refineries is ensuring the financial viability of transitioning to low-carbon solutions. While the environmental imperative is clear, business sustainability requires that decarbonisation efforts deliver long-term economic returns.
The initial capital outlay can be substantial, particularly for technologies like hydrogen production,
carbon capture, and synthetic fuel synthesis. However, this investment is increasingly offset by emerging financial incentives. Carbon pricing mechanisms, such as the EU Emissions Trading System, are making it more expensive to emit CO 2 , creating strong economic drivers for change. Meanwhile, governments across the globe are offering tax credits, subsidies, and concessional financing to support industrial decarbonisation.
Adding to these pressures are global policy developments that shape investment strategies. For example, recent US tariffs on Chinese clean energy technologies highlight growing geopolitical concerns over supply chain security and underscore the importance of developing domestic capabilities. These dynamics are reshaping how and where companies invest, particularly in strategic sectors such as hydrogen and synthetic fuels.
Within this context, low-carbon hydrogen emerges not only as a climate solution, but also as a significant economic opportunity. Forecasts suggest the global hydrogen market could reach US$1.4 trillion by 2050 2 , with industrial users driving much of the demand. Refineries that invest early in scalable hydrogen technologies will be well-positioned to meet both policy mandates and market expectations.
The future of refinery decarbonisation
The transformation of refineries is being driven by proven, at scale technologies together with continuous improvement and technological innovation, regulatory policies, and market dynamics. In the coming years, refineries have the option to increasingly integrate low-carbon and clean feedstocks such as biomass and CO 2 , expand their use of power-to-X technologies, and adopt modern catalyst solutions to improve efficiency.
Policymakers will also play a crucial role. Carbon border adjustment mechanisms, tax incentives, and government-backed hydrogen projects will influence the pace of refinery decarbonisation. Companies that act early will gain a competitive advantage, securing market share in the emerging low-carbon economy.
Ultimately, the refining industry is at a pivotal moment. Through advanced process technologies, strategic partnerships, and innovative catalysts, refineries can decarbonise their operations while maintaining economic viability.
Early adopters of low-carbon hydrogen, SAF, and other synthetic fuels will define the future of refining in a decarbonising world.
References
1. Based on a 355MW HHV Hydrogen capacity plant with amine carbon capture technology. SMR data source is IEAGHG Technical Report 2017-02. SMR & Carbon Capture data source is NETL Technical Assessment 2023-12.
2. ‘Green hydrogen: energizing the path to net zero’, Deloitte, (19 June 2023) https://www.deloitte.com/global/en/issues/ climate/green-hydrogen.html
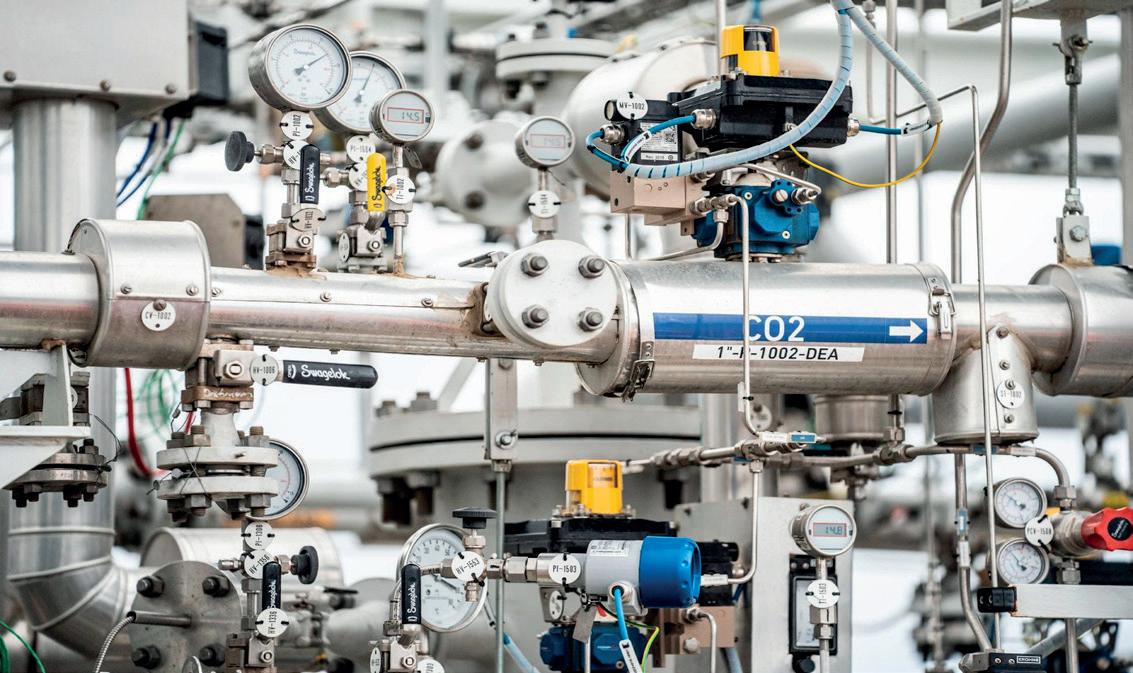
Figure 2. Adapting to low-carbon pathways.
Howard Siew, BASF, USA, discusses how co-processing renewable and recyclable feedstocks can help to reduce the carbon footprint in FCC units.
As the global energy landscape shifts towards sustainability, the refining industry faces increasing regulatory and social pressure to lower its carbon footprint. Refiners become part of the process to balance supply of cost-effective energy, ensuring security of supply and improving the sustainability of its energy products. Fluid catalytic cracking (FCC), a key part of modern refining, is now at the forefront of this change. With rising regulatory demands, regional policy differences, and market incentives, refiners are looking into co-processing renewable and recyclable feedstocks in FCC units to cut greenhouse gas (GHG) emissions and support circular economy goals.
Market trends and regulatory drivers
The effort to reduce carbon footprints is driven by a convergence of global climate agreements, national policies,
and corporate sustainability goals. The Paris Agreements, the EU’s Renewable Directive (RED III)1, US Renewable Fuel Standard (RFS)2, California’s Low Carbon Fuel Standard (LCFS)3, and Canada’s Clean Fuel Regulations4 are among the primary frameworks encouraging refiners to implement low-carbon practices.
In Europe, RED III requires Member States to achieve either a 14.5% reduction in the greenhouse gas intensity of transport fuels or ensure that at least 29% of the energy used in transport comes from renewable sources by 2030.1 In the US, the RFS requires blending renewable fuels, and the LCFS promotes renewable fuel production and carbon intensity reduction, similar to Brazil’s RenovaBio programme, which is accelerating the adoption of renewable feedstocks and circular economy practices.
Together, these regulatory drivers are reshaping the refining industry, creating strong incentives for the integration of renewable and recycled carbon into existing infrastructure. Co-processing in FCC units provides a flexible and cost-effective pathway to meet these evolving requirements while maintaining operational continuity and product quality.
FCC units: role and carbon challenge
The FCC unit is a catalytic process that converts heavy hydrocarbons into lighter, high-value products like gasoline, diesel, and olefins. It typically processes vacuum gas oil (VGO), atmospheric residue, and other heavy fractions. However, FCC units are also major carbon emitters, contributing up to 30% of a refinery’s direct CO2 emissions, according to EPA.5 This is mainly because of carbon rejection, where the process inherently rejects carbon as coke, which is burned to regenerate the catalyst and provide necessary heat to the process, releasing CO2. This makes FCC one of the most carbon-intensive units in a refinery. Traditional fossil-based feeds are high in carbon and lack hydrogen, making it hard to reduce the carbon footprint without changing the feed or the process.
Making FCC more sustainable
Carbon capture at the regenerator stack
Technologies like BASF’s OASE® gas treatment system can capture CO2 from FCC flue gases. These captured emissions can be sequestered underground (CCS), used in chemical production (CCU), or converted into synthetic fuels or building blocks. While promising and proven, these solutions require significant capital investment and infrastructure.
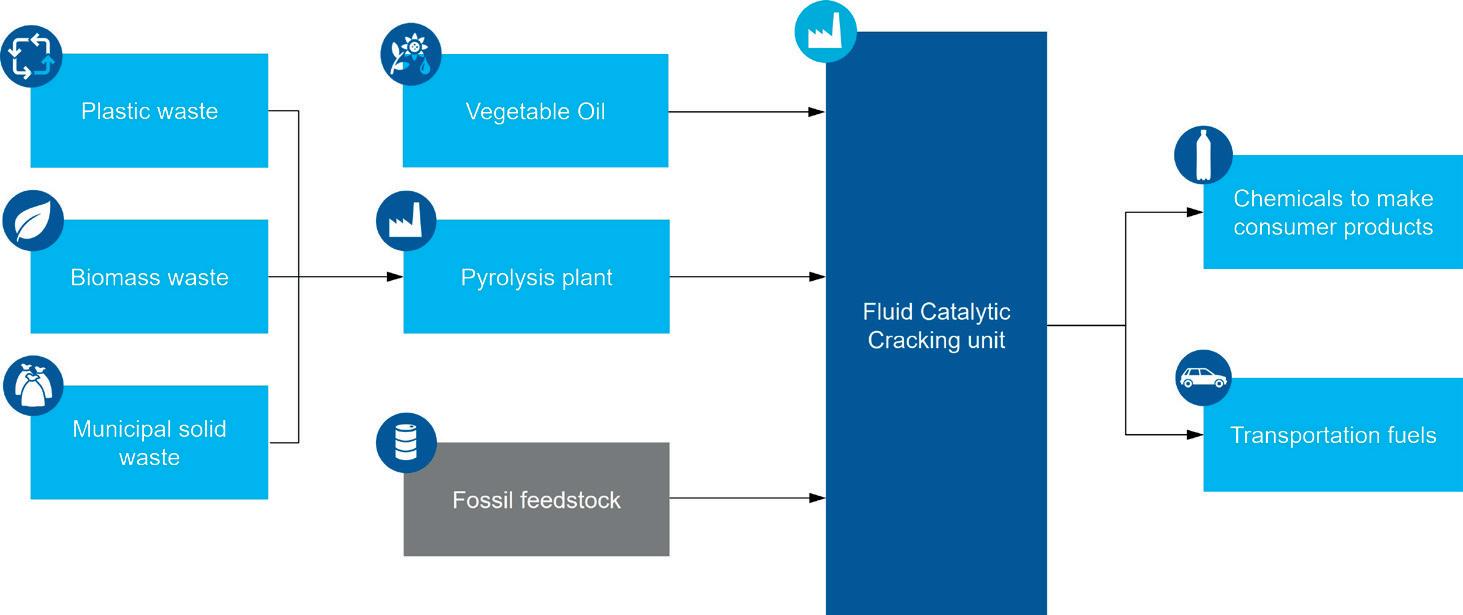
Feedstock changes: co-processing renewables and recyclables
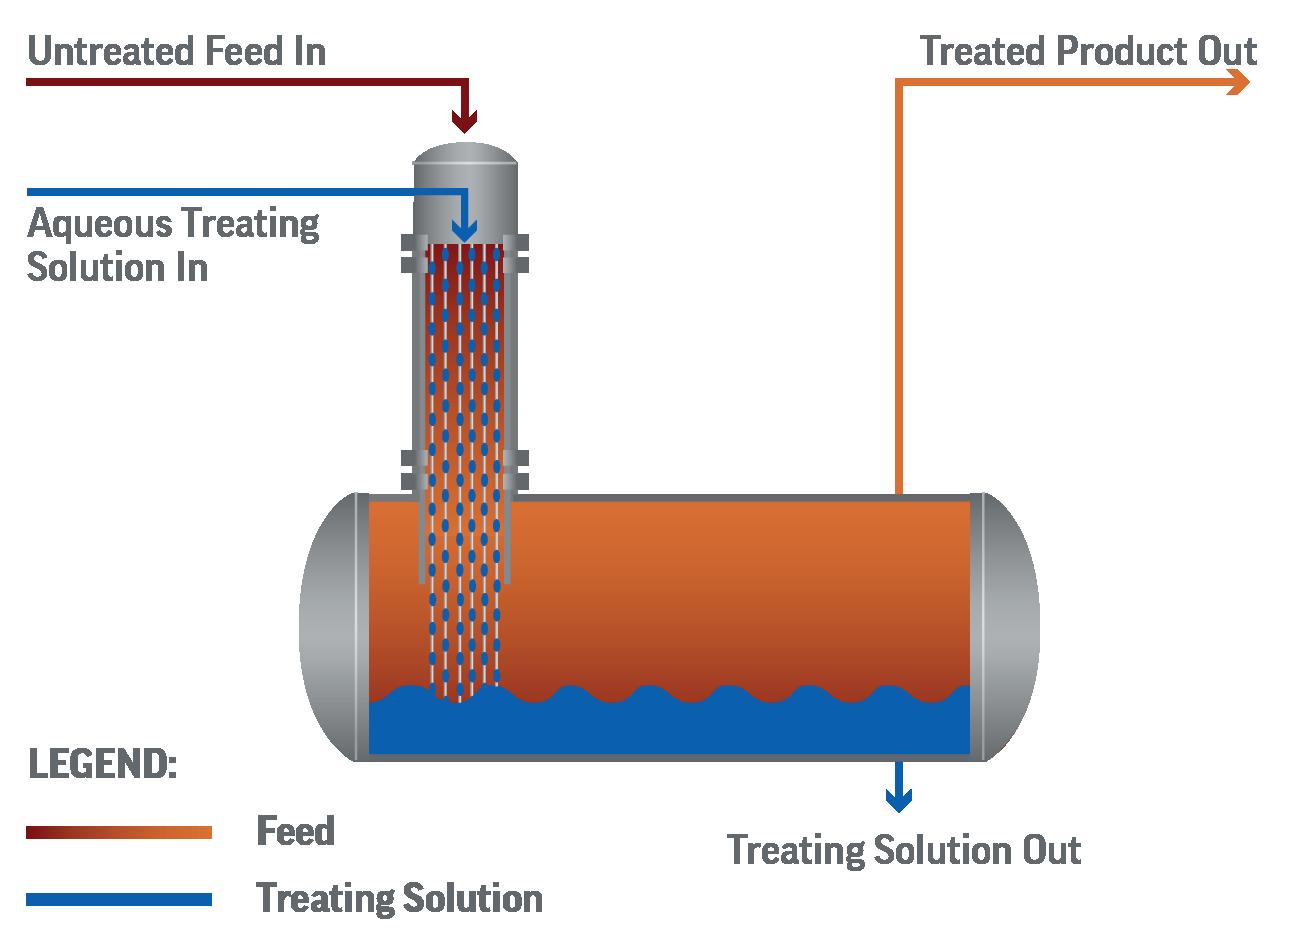
A more immediate and flexible approach to reducing refinery carbon intensity is the co-processing of renewable and recyclable carbon oils (RCOs) in the FCC unit (Figure 1). These RCOs include renewable feedstocks such as vegetable oils, used cooking oil, and animal fats, as well as recyclable streams like pyrolysis oils derived from waste plastics, biomass waste, and municipal solid waste (MSW). This strategy enables refiners to leverage existing FCC infrastructure while integrating circular and renewable carbon into fuel and chemical production.
Understanding renewable and recyclable feedstocks
Renewables
Renewable feedstocks are derived from biological sources and can be broadly categorised into two types:
n Plant and animal-based oils: these include different types of vegetable oil (soybean, rapeseed, corn oils etc.), used cooking oil, and animal fats. They are rich in triglycerides and typically contain moderate levels of oxygen (around 10 wt%) in the form of esters and carboxylic acids. While generally low in aromatics and coke precursors, they may contain alkali and earth alkaline metals such as sodium, potassium, calcium, and magnesium, which can impact catalyst performance and require pretreatment (e.g., degumming or adsorption).
n Biomass pyrolysis oils: produced from lignocellulosic materials such as wood, corn stover, and agricultural residues, these oils have a much wider and higher oxygen content (typically 40 - 45 wt%) and are chemically complex. They contain a wide range of oxygenated compounds including phenols, furans, ketones, and organic acids. These oils also tend to have high water content and may carry metal contaminants like iron, phosphorus, alkali, and earth alkaline metals, making them more challenging to process in FCC units without dilution or pre-treatment, such as mild hydrotreatment.
Recyclables
Recyclable feedstocks are primarily derived from plastic waste and vary in composition depending on the source and sorting process:
n Polyolefin-based plastics: plastics such as polyethylene (PE) and polypropylene (PP) are ideal candidates for pyrolysis due to their high hydrogen-to-carbon (H/C) ratio and low oxygen content. The resulting pyrolysis oils are predominantly aliphatic, with low levels of metals and heteroatoms, making them relatively easy to co-process in FCC units.
n Mixed plastic waste: these streams may include polyvinyl chloride (PVC), polyethylene terephthalate (PET), polystyrene (PS), and other polymers. Pyrolysis of such mixtures can introduce impurities such as chlorine (from PVC), oxygenates (from PET), and aromatics (from PS), which can lead to corrosion, catalyst deactivation, and increased coke formation. Effective sorting, pretreatment, or blending with cleaner feeds is often necessary to manage these risks.
Feedstock chemistry and crackability
The chemical composition of renewable and RCOs significantly influences their behaviour in
Figure 1. Enabling the partial replacement of fossil-based feedstocks with waste or renewable streams to ensure a sustainable future.
FCC units. The referenced study by Dorazio and Fu introduces a more FCC-relevant framework: a cross-plot (Figure 2) of effective hydrogen index (EHI) vs Conradson carbon residue (CCR).6 This approach effectively captures the upgradability of feedstocks in catalytic cracking environments.
The chemical properties of renewable and recyclable feedstocks significantly influence their behaviour in FCC units. Polyolefin-based plastics such as polyethylene and polypropylene exhibit a high EHI ~2.0 and very low CCR, making them ideal for FCC processing with high yields of LPG and naphtha and minimal coke formation. Plant-based oils like soybean or used cooking oil have a moderate EHI ~1.6 and low CCR, but their oxygen content requires deoxygenation during cracking, which produces water and carbon oxides and may necessitate pretreatment to manage metal contaminants. In contrast, biomass pyrolysis oils derived from sources like olive pits or wood have a low EHI ~0.6 (e.g., hydrogen deficiency) and extremely high CCR (up to ~20 wt%), making them the most challenging for the FCC. Their high oxygen and aromatic contents lead to increased coke formation and reduced conversion efficiency, often limiting their use to low co-processing ratios and requiring hydrotreatment or blending with conventional feeds.
These differences in feedstock chemistry directly affect how easily a material can be cracked and upgraded into fuels. Feedstocks with high EHI and low CCR are more compatible with FCC operations, offering higher yields and lower coke. In contrast, low EHI and high CCR feedstocks require careful blending, catalyst tuning, and operational adjustments to avoid performance degradation.
Operational impacts of co-processing
Contaminants
and metals
Renewable and recyclable feedstocks introduce a range of contaminants, as seen in Table 1,8 that can impact FCC catalyst performance and unit reliability. Biomass-derived oils and plant-based feedstocks often contain alkali and earth alkaline metals such as sodium (Na), potassium (K), calcium (Ca), and magnesium (Mg), which can poison active catalyst sites and reduce cracking efficiency. Similarly, plastic-derived pyrolysis oils
may carry chlorides (from PVC), heavy metals, or silicon-based compounds depending on the source and sorting quality. These impurities can lead to increased coke formation, corrosion, and fouling in downstream equipment. BASF addresses these challenges through a combination of adsorbent technologies for contaminant removal and advanced metal passivation strategies to help neutralise the effects of metals and extend catalyst life.7,8
Product yields and selectivity
The chemical nature of each feedstock influences product distribution. Pyrolysis oils from polyolefins (e.g., LDPE) are highly crackable and can yield over 90% conversion into valuable products such as gasoline, LPG, and light cycle oil (LCO) when processed with BASF’s FCC catalysts. Plant oils, while generally compatible with VGO, contain oxygen that must be removed during cracking, often resulting in increased water, CO, and CO2 formation, and potentially higher coke yields. Biomass pyrolysis oils are more complex, with high oxygen and aromatic content, requiring deeper deoxygenation and often resulting in elevated coke and gas production. BASF’s catalyst formulations are
Figure 2. Upgradability of various sustainable feedstocks defined in terms of effective hydrogen index and concarbon.
Table 1. Typical impurities and impact of sustainable feedstocks
Figure 3. BASF catalyst portfolio in FCCU co-processing.
designed to manage these trade-offs, optimising selectivity toward desired products while minimising operational penalties.7,9
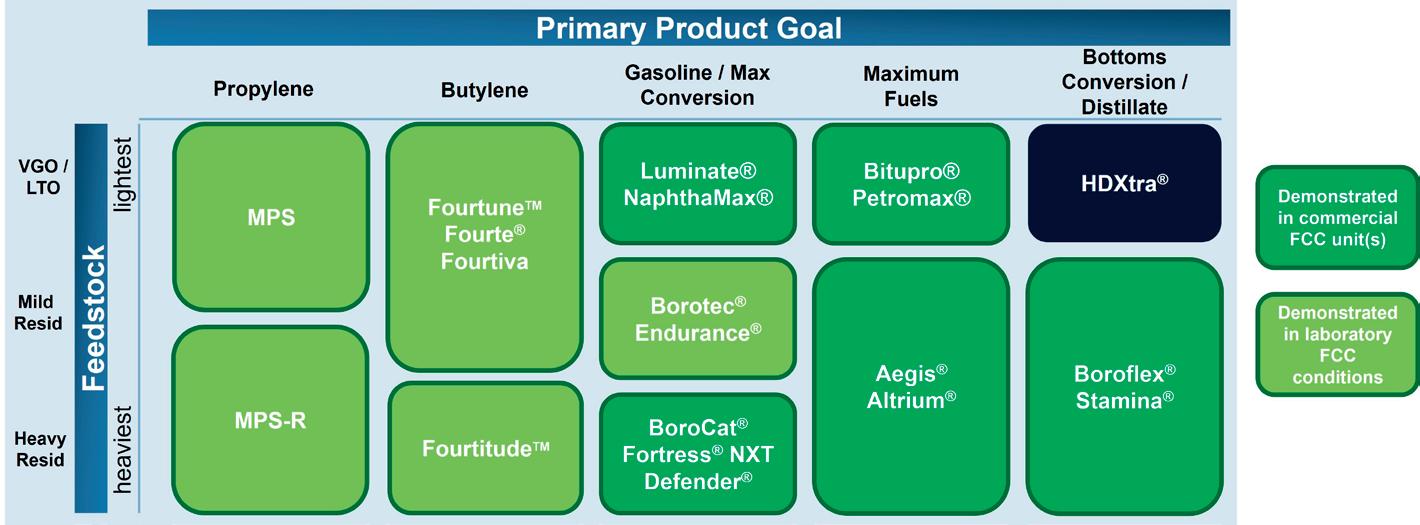
Catalyst design and flexibility
BASF’s FCC catalyst portfolio (Figure 3) is engineered to support the co-processing of a wide range of renewable and waste-based feedstocks. These catalysts are tailored to address specific challenges such as contaminant tolerance, coke suppression, and product selectivity. Whether the goal is to maximise LPG olefins, gasoline, or distillate yields, BASF offers solutions that have been validated in both commercial FCC units and laboratory scale testing. This flexibility enables refiners to adapt to evolving feedstock availability and regulatory pressures while maintaining operational efficiency and product quality.
Pyrolysis oil performance: case studies
Extensive lab-scale testing has demonstrated the strong potential of FCC units to co-process renewable and RCOs with high efficiency. In particular, pyrolysis oils derived from LDPE have shown exceptional crackability, with over 80 - 90% of the feed converted into upgradable products such as gasoline, LPG, and light cycle oil. Further, BASF’s FCC catalyst, specifically designed to maximise LPG olefins, achieved a combined 45.4 wt% yield of propylene and C4 olefins from waxy LDPE pyrolysis oil, demonstrating the ability to tailor product slates through catalyst engineering.7
In co-processing scenarios, studies have shown that blending 10% plastic-derived pyrolysis oil with conventional vacuum gas oil (VGO) had minimal impact on overall product yields and coke selectivity, indicating strong compatibility with existing FCC operations. Even more challenging feedstocks, such as biomass-derived pyrolysis oils from olive pits, were successfully processed when appropriate catalyst designs were used, and feed blending strategies were employed. An example study demonstrates the viability of co-processing biomass pyoil to produce gasoline blend stocks.10
These results underscore the FCC unit’s flexibility and robustness in handling diverse RCOs, provided that catalyst design and process conditions are carefully optimised.
Collaboration with technology licensors
Collaboration with technology licensors plays a critical role in enabling the successful integration of renewable and
waste-based feedstocks into FCC operations. By combining BASF’s catalyst innovation and operational guidance with licensors’ deep expertise in FCC process design, hardware configuration, and operational optimisation, refiners gain access to end-to-end solutions that address the unique challenges of co-processing. Such partnerships accelerate the industry goals of continuously increasing the processability of RCOs, ensuring that FCC units can operate reliably and efficiently while meeting sustainability and regulatory goals.8
Conclusion
FCC is no longer just a tool for maximising transportation fuels – it is becoming a strategic enabler of refinery carbon footprint reduction. By embracing co-processing, renewable feedstocks, and carbon capture when viable, refiners can transform FCC units into engines of sustainability, aligning profitability with planetary responsibility.
Co-processing renewable and RCOs in FCC units offers refiners a practical path to reduce carbon intensity and support circular economy goals. Regulatory frameworks like RED III, LCFS, and RenovaBio accelerate adoption, while BASF’s catalyst technologies enable efficient processing of diverse feedstocks – from polyolefin-derived pyrolysis oils to more challenging biomass oils.
Feedstock chemistry, particularly EHI and CCR, determines FCC compatibility. High-EHI, low-CCR feeds like LDPE pyrolysis oil yield high-value products with minimal coke, while biomass oils require careful blending and pretreatment.
Lab studies confirm that with the right catalyst and process design, FCC units can co-process up to 10% RCOs with minimal impact on yields or coke. Collaborations among refiners, licensors, and catalyst providers can further support industry goals with integrated solutions for reliable and sustainable FCC operations.
References
1. Directive - EU - 2023/2413 - EN - Renewable Energy Directive - EURLex, https://eur-lex.europa.eu/eli/dir/2023/2413/oj/eng
2. US EPA Reformulated Fuel Standards, https://www.epa.gov/ renewable-fuel-standard
3. California Renewable Standard Eligibility Guidebook, Ninth Edition (Revised), https://efiling.energy.ca.gov/getdocument. aspx?tn=217317.
6. DORAZIO, L., and FU, J., ‘Transforming refineries’ opportunities through FCC’, Digital Refining, (2023).
7. MASTRY, M.C., DORAZIO, L., FU, J., GÓMEZ, J.P., SEDANO, S., AIL, S.S., CASTALDI, M.J., and YILMAZ, B., ‘Processing renewable and wastebased feedstocks with fluid catalytic cracking: Impact on catalytic performance and considerations for improved catalyst design’, frontiers, (2023).
8. VINCENT, G., RIVA, S., BARRIOS, F., DUBOIS, F., and GOLCZYNSKI, S. ‘Tackle operational challenges with FCC coprocessing applications’, Hydrocarbon Processing, (2024).
9. VINCENT, G., and KHAZRAIE, T., ‘Chemical recycling of waste plastics: The role of catalysts’, decarbonisation technology, (2024).
10. LUTZ, H., BÜCHELE, M., FLORIAN, K., REICHHOLD, A., VOLLENHOFER, W., and VENDERBOSCH, R., ‘Wood Derived Fast Pyrolysis Bio-liquids as Co-feed in a Fluid Catalytic Cracking Pilot Plant’, ACF, (2022).
Milica Folić, Topsoe, considers how to enable scalable chemical recycling of plastic waste to create drop-in naphtha.
The shift towards a circular plastic economy has underscored the need for chemical recycling of mixed plastic waste so it can be turned into high-quality, contact-sensitive, and other plastic products. However, the diverse composition of plastic waste and variability of liquefaction methods makes upgrading essential to ensure not only drop-in naphtha quality for steam crackers but to also absorb all the fluctuations in the feedstock quality.
This article will consider these challenges and introduce a technology – developed through over 60 pilot tests on various plastic pyrolysis oils – that delivers on-spec naphtha and heavier steam cracker feedstocks. PureStepTM combines in-depth analysis, decades of hydroprocessing expertise, and tailored solutions for handling specific contaminants like silicon and others. Topsoe’s analytical techniques revealed that major
impurities are not confined to certain boiling fractions, guiding targeted catalyst and process design.
PureStep adapts to different liquefaction technologies and oil qualities, offering the flexibility and robustness needed in chemical recycling. By 2025, the technology had entered commercial operation at two plants. Early insights from these deployments highlight its potential to transform mixed plastic waste into high-value feedstocks, supporting a sounder plastics value chain.
The three Rs
The linear plastic economy, particularly the rise in single-use plastics, has led to rapidly growing plastic waste streams across the globe. The average global recycling rate was just 9.5% in 2020 and according to OECD numbers, global production and use of
plastics will hit 736 million t by 2040, up a massive 70% from 435 million t in 2020.1 The OECD goes on to note that without major change “recycled plastics will continue to make up a mere 6% of all plastics produced in 2040.”
The current landscape and outlook for plastics reveals damaged ecosystems but they also represent a massive missed economic opportunity.
Addressing plastic waste requires a range of solutions that target the problem from multiple angles. These can be broadly grouped into the three Rs: reduce, reuse, and recycle. Reducing involves cutting down on plastic use and minimising how much plastic is used in products from the outset. Reuse focuses on extending the life of products and preventing them from becoming waste prematurely. Recycling, the focus of this article, aims to recover used plastics and convert them into new materials, closing the loop and reducing reliance on virgin plastics.
Mechanical and chemical plastic recycling
Plastic recycling follows two complementary paths: mechanical and chemical. Mechanical recycling works best with clean, sorted, single-polymer waste, such as PET bottles. While this method can produce high-quality products like new bottles and typically has low energy consumption, it has limitations. Each recycling cycle typically lowers material quality, over time leading to downcycling – turning food packaging into lower-value items like textiles or garden furniture.
Chemical recycling, on the other hand, is better suited for mixed and contaminated plastic waste, such as household packaging. It breaks down polymers and removes impurities, producing feedstocks that can be used to make new, virgin-quality plastics – including food – and pharma-grade plastic materials.
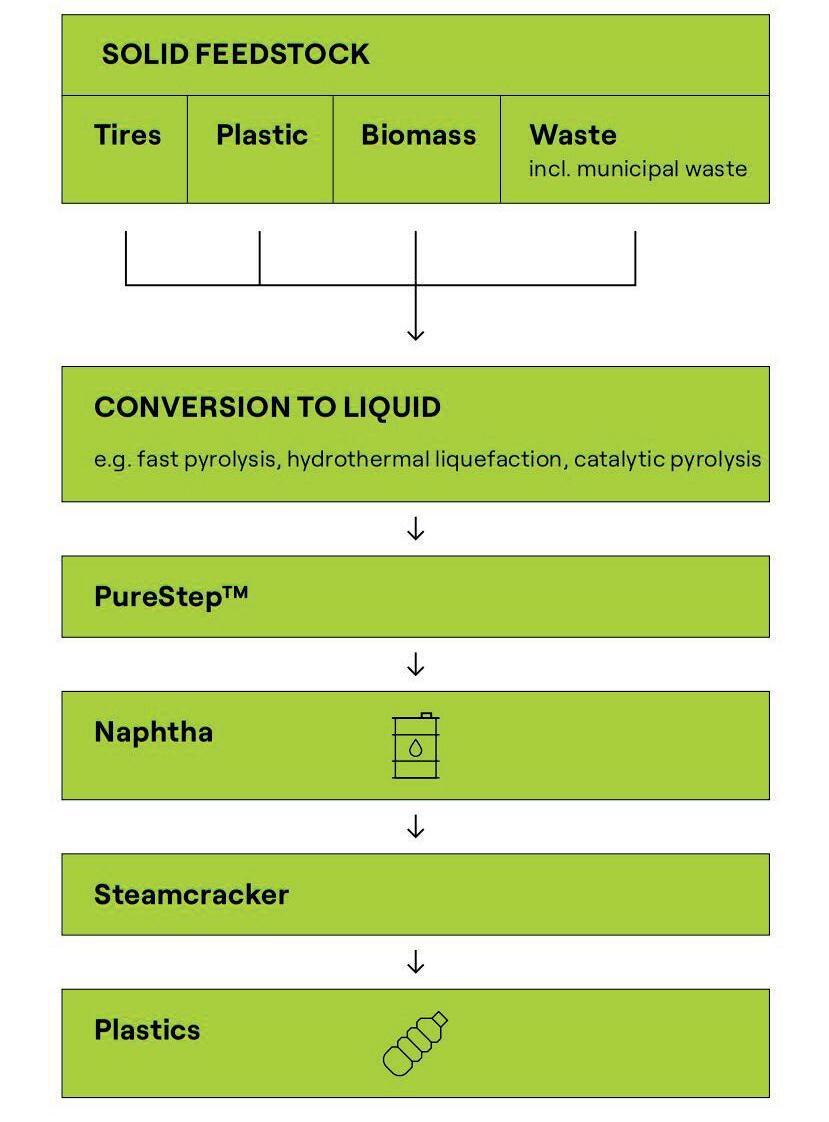
Thermochemical liquefaction processes like pyrolysis and hydrothermal liquefaction (HTL) convert solid waste into plastic pyrolysis oil (PPO), a liquid somewhat similar to fossil feedstocks. However, raw PPO contains high levels of contaminants such as metals, halogens, and heteroatoms, which prevent its direct use in steam crackers without extreme dilution and fluid catalytic cracking (FCCs) without dilution.
To enable larger scale recycling and reduce reliance on virgin fossil carbon, PPO needs to be upgraded. That is where Topsoe’s PureStep technology comes in. This hydroprocessing solution removes contaminants and adjusts key properties, transforming raw PPO into high-quality feedstock for steam crackers. It closes the quality gap, unlocking higher recycling rates and supporting a circular, recycled-carbon plastics economy.
PPO: a new opportunity
PPOs are emerging as a viable feedstock for the refining and petrochemical industries. Topsoe began working with PPOs in 2014, leveraging decades of hydroprocessing experience to meet growing demand for sustainable feedstock solutions. Upgrading PPOs into drop-in naphtha aligned with the company’s expertise in developing tailored technologies for lower environmental impact.
PPOs share some characteristics with traditional fossil and non-fossil feedstocks, but they also differ in key ways. For instance, they have similar hydrogen content to straight-run diesel but significantly more nitrogen and less sulfur. Compared to tyre-derived oil (TDO), PPOs are less aromatic and contain fewer impurities, resulting in lower hydrogen consumption during processing – both an economic and environmental benefit.
While PPOs are not identical to other feedstocks, their manageable impurity levels make them a strong candidate for hydroprocessing. They offer a promising starting point for customised upgrading solutions that align with circular economy goals and reduce carbon intensity.
Understanding variability
PPOs contain contaminants also found in fossil feedstocks –such as silicon, phosphorus, nitrogen, sulfur, oxygen, and halogens – but in different molecular structures and concentrations. This is due to the very different origin of contaminants, which in plastics is related to their content of
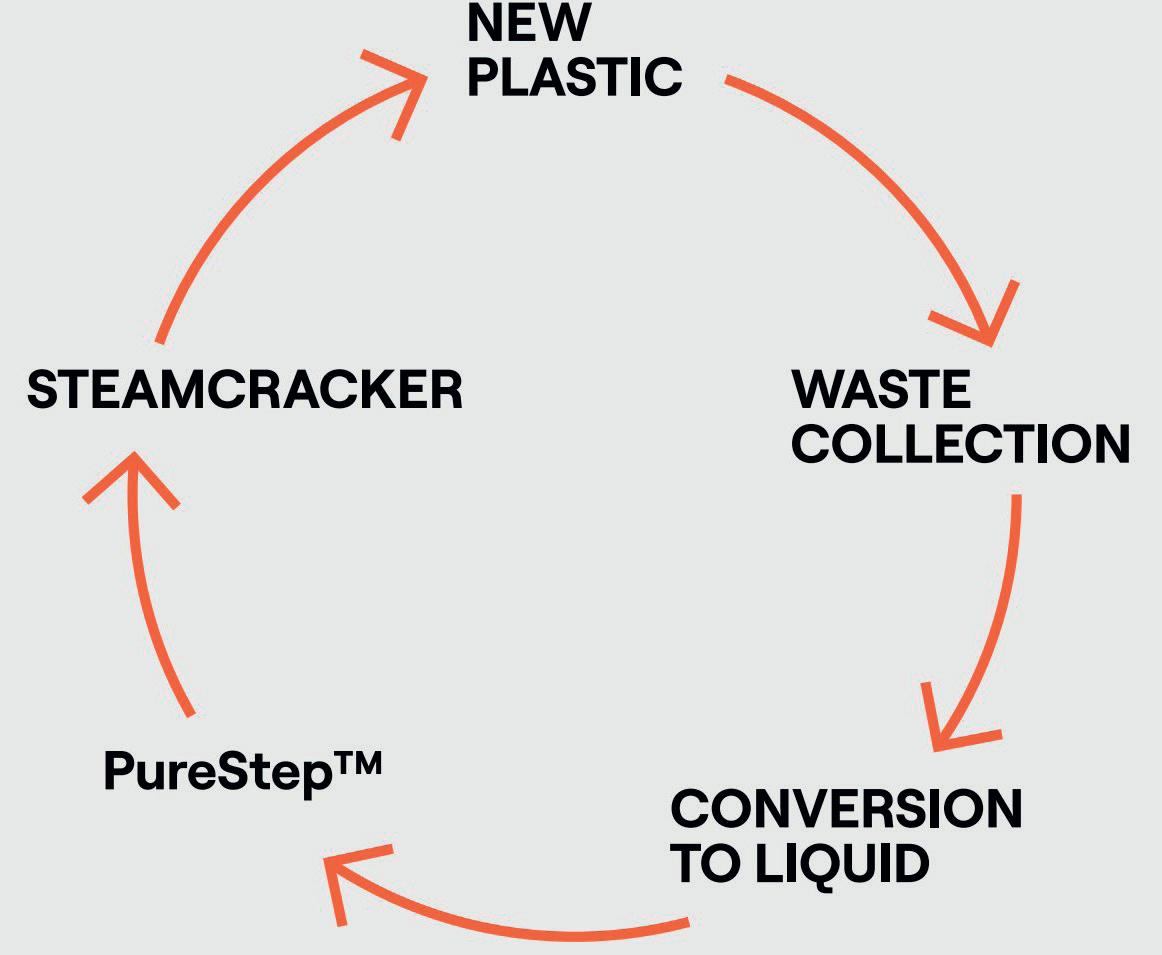
Figure 1. Circular plastic economy with Topsoe’s PureStep technology.
Figure 2. PureStep recycling.
Table 1. Comparison of raw PPO properties with naphtha specification desired for steam crackers: upgrading is needed to close the gap
Property Unit Mixed waste PPO
Final boiling point (FBP)
°C (°F)
400 - 500 (752 - 1022)
Typical naphtha steam cracker feedstock
150 - 250 (302 - 482)
Olefins wt% 40 - 70 <1
Aromatics wt% <20 <10
Sulfur wt ppm <200 <500
Nitrogen wt ppm <2000 <5
Oxygen wt ppm <5000 <25
Halogens wt ppm <700 <3
Total metals wt ppm <200 <1
additives and residues, including stabilisers, flame retardants, adhesives, and post-consumer waste.
Because of this, conventional hydroprocessing must be adapted and optimised. Tailored catalyst development plays a key role, especially for targeting specific contaminants. Some PPOs are also prone to polymerisation and require early stabilisation before hydrotreating (something that can be established via analysis).
To effectively process PPOs, a broad understanding of their variability is essential. This includes sourcing samples from various liquefaction technologies and suppliers and going beyond bulk analysis to identify specific contaminant species.
Successful technology development relies on integrating deep analysis with catalyst design and pilot testing. Building a comprehensive database of results enables faster identification of known patterns and focuses efforts on new challenges –laying a strong foundation for reliable, scalable PPO upgrading solutions.
Targeting naphtha from PPOs
PPOs differ significantly from standard naphtha feedstocks used in steam crackers. A key challenge is that more than 50% of PPO content typically boils above 200°C – well outside the acceptable range for naphtha. For instance, a typical PPO may contain 60% heavy fractions. To meet steam cracker boiling specifications, hydrocracking can be added to Topsoe’s PureStep process to reduce the final boiling point.
Another critical issue is contaminant distribution. A fractionation study on full-range PPOs revealed that contaminants like silicon and chlorine are not isolated in heavy fractions but are spread throughout the boiling range – from light naphtha to vacuum gas oil (VGO).
Some have suggested fractionation alone could remove silicon or chlorine. However, results show that even individual cuts contained 30 - 60% of the total silicon and varying chlorine concentrations, making simple separation ineffective. Combined with the ability to correct the boiling point, the deep contaminant removal allows the whole PPO fraction to be converted into the steam cracker feedstock. These are key elements built into the PureStep approach, enabling the processing of the whole range.
Catalyst development for pyrolysis oils
While fossil-based catalysts can be used for circular feedstocks like PPOs, tailored catalyst development delivers significantly better performance. Contaminants such as silicon and phosphorus originate differently in PPOs than in fossil or bio-derived oils, requiring custom solutions.
Advanced analysis, including SEM imaging, shows that standard fossil catalysts only absorb contaminants near the surface, underutilising the catalyst volume. In contrast, Topsoe’s next-generation guard catalyst, optimised specifically for PPOs, enables full cross-sectional uptake of silicon and phosphorus, significantly increasing capacity.
This tailored catalyst also offers moderate hydrotreating activity – helpful for removing nitrogen and chlorine and reducing coke formation, which can deactivate the catalyst. By combining deep feedstock understanding with targeted formulation, Topsoe maximises catalyst efficiency and reactor utilisation in PPO upgrading.
A flexible solution for upgrading PPOs
Topsoe’s PureStep hydroprocessing technology offers flexible, tailored solutions for upgrading PPOs to steam cracker-ready feedstock. It combines key ‘building blocks’ – optional stabilisation, guard beds with customised catalysts, hydrotreating, and optional hydrocracking – based on feedstock characteristics and product goals.
Typically, at least two blocks are used to address PPO reactivity, contaminants, and boiling point. This enables high recycled content in cracker feed while ensuring smooth operation of existing assets.
PureStep efficiently upgrades the full PPO range, boosting circularity and reducing environmental impact.
Scaling recycling with hydroprocessing
Topsoe has nearly 30 years of experience analysing and upgrading non-fossil feedstocks, from bio-based oils to today’s PPOs. So far, efforts have focused on meeting contaminant limits for cracker feedstocks. Now, the company is expanding this scope through collaboration by studying how hydroprocessed PPOs affect steam cracker performance and yields. This feedback loop is essential for refining both catalyst and process design. PureStep has already been commercialised, with two industrial units in Europe having started up in 2024 and 2025. Operational data from these sites will guide further innovation.
Chemical recycling via pyrolysis is poised to play a key role in the circular economy by supplying recycled feedstocks to existing cracker infrastructure. Hydroprocessing is essential for scaling this value chain – offering compatibility with refinery assets, enabling revamps, and improving economics through higher PPO utilisation.
Challenges remain in scaling pyrolysis and reducing system costs, but momentum is building through industry collaboration and growing investment. As technologies mature and volumes rise, hydroprocessing is set to become a reliable, robust enabler of circular plastic production.
Reference
1. ‘Policy scenarios for eliminating plastic pollution by 2040’, OECD, (2 October 2024).
The concept of chemical recycling
Chemical recycling, also known as advanced recycling, involves transforming plastic waste into monomers, fuels, or other chemical feedstocks. This process helps overcome limitations associated with mechanical recycling, such as contamination issues and the inability to process multi-layered or complex plastics.
There are several chemical recycling techniques. Two of the most common and reliable are:
n Pyrolysis: thermally decomposing plastic waste in the absence of oxygen to produce liquid hydrocarbons, which can be used as fuels or feedstocks for new plastics.
n Gasification: converting waste into syngas, which serves as a building block for fuels, chemicals, and even hydrogen production.
Each of these processes plays a crucial role in addressing the plastic waste crisis while contributing to the circular economy by ensuring materials remain in productive use for as long as possible.
Chemical recycling and the circular economy
The circular economy model aims to eliminate waste by keeping materials in continuous use through recycling, reuse, and remanufacturing. Chemical recycling aligns with this vision by:
n Closing the circle on plastic waste: it allows end-of-life plastics to be reintroduced into the production cycle, reducing dependence on virgin materials.
n Enhancing resource efficiency: by converting waste into valuable chemicals and fuels, chemical recycling maximises resource utilisation.
n Reducing environmental footprint: chemical recycling can help decrease carbon emissions and landfill dependency by diverting non-recyclable plastics from waste streams.
n Fostering industrial symbiosis: chemical recycling facilitates collaboration between industries, where waste from one sector can become a resource for another, thereby optimising material flows and reducing overall environmental impact.
However, the integration of chemical recycling into waste management systems requires innovative technologies, regulatory support, and industry collaboration.
A commitment to sustainable waste treatment
To be at the forefront of sustainable waste treatment, companies should offer customised solutions for industries looking to reduce emissions, optimise waste valorisation, and achieve regulatory compliance. Expertise should span across various industries, including chemical, petrochemical, pharmaceutical, and oil and gas, where waste management is a critical concern.
Approaches to chemical recycling
Companies should employ a mixed strategy to implement chemical recycling within industrial waste treatment systems:
n Customised technology integration: design and install tailored chemical recycling solutions, integrating pyrolysis, gasification, and other techniques into existing waste treatment infrastructure.
n By-product recovery and valorisation: beyond waste elimination, emphasise the recovery of valuable by-products, such as synthetic fuels, hydrogen, and chemical precursors, to enhance economic and environmental benefits.
Figure 2. Chemical recycling fosters industrial symbiosis.
Figure 1. Plastic waste can be transformed into second-generation plastics.
n Regulatory compliance and sustainability optimisation: with global regulatory frameworks tightening around waste management, it is necessary to ensure that solutions align with international environmental standards, including the European Green Deal and UN Sustainable Development Goals (SDGs).
n Collaborative industry partnerships: actively collaborate with waste management operators, project developers, project management companies, and industrial partners to develop scalable chemical recycling projects that drive systemic change towards sustainability.
Case study: chemical recycling solutions in action
A notable project, from Tecam, is a waste-to-fuel chemical recycling plant in the south of Spain where Tecam has just finished the FEL3 engineering phase. Through the implementation of an advanced pyrolysis unit, Tecam enables the conversion of plastic residues into pyrolysis oil, that can be later transformed into biofuel and other chemical by-products. This project not only eliminates plastic waste but also creates new raw materials, aligning completely with circular economy principles and constituting itself as a sustainable and economically viable solution.
The economic and environmental benefits of chemical recycling
Beyond the direct waste treatment advantages, chemical recycling brings significant economic and environmental benefits:
n Reduction of greenhouse gas emissions: by diverting waste from incineration and reducing reliance on fossil fuels, chemical recycling significantly lowers carbon footprints.
n Energy efficiency: some chemical recycling processes, such as pyrolysis and gasification, generate valuable energy outputs, which can be used to power industrial operations.
n Resource security: the recovery of valuable materials reduces dependency on virgin feedstocks, which can be subject to geopolitical risks and supply chain disruptions.
n Job creation and economic growth: establishing chemical recycling plants fosters employment in engineering, waste management, and research and development (R&D) sectors.
Overcoming challenges in chemical recycling
Despite its promise, chemical recycling faces several challenges that must be addressed to ensure widespread adoption:
n Economic viability: high operational costs and variable feedstock quality can affect the profitability of chemical recycling plants.
n Technology scalability: scaling chemical recycling technologies to accommodate large industrial waste streams remains a key difficulty.
3. It is important to count on experts for chemical recycling projects.
n Regulatory barriers: policies governing chemical recycling differ across regions, requiring businesses to work in complex compliance and regulatory realities.
n Consumer and industry awareness: public perception and industry readiness are crucial in driving demand for chemically recycled materials, making educational campaigns and incentives necessary.
Companies can overcome these challenges by continuously innovating waste treatment solutions, supporting sustainable policies, and leveraging expertise in environmental engineering.
The future of chemical recycling
As industries increasingly shift towards sustainable business models, chemical recycling will play a critical role in reshaping waste treatment practices. Companies must remain committed to advancing this technology through continuous R&D, strategic partnerships, and industry leadership.
By integrating chemical recycling into industrial operations, businesses can achieve their sustainability goals while contributing to the global circular economy. The future of waste treatment lies in innovative, high-efficiency solutions that not only eliminate waste but also create new opportunities for resource recovery and environmental leadership.
Conclusion
The role of chemical recycling in the circular economy is vital. As industries face increasing pressure to adopt sustainable practices, solutions must drive meaningful change. By combining cutting-edge technology, regulatory expertise, and a commitment to innovation, companies can continue to shape the future of sustainable waste treatment and by-product generation, ensuring that waste is not the end of a product’s lifecycle but the beginning of a new, circular journey.
With continuous advancements in chemical recycling technologies and growing industry collaborations, it will be possible to redefine the landscape of sustainable waste management for the years to come.
Figure
Sophia Asal, Endress+Hauser, Switzerland, and
Anastasija Kuprijanova, Carbon Ridge,
USA, outline how carbon capture can be used to decarbonise the hard-to-abate sectors of global trade and infrastructure.
The race to net zero is not a straight sprint – it is a course filled with complex, energy-intensive industries that are notoriously difficult to decarbonise. These ‘hard-to-abate’ sectors, including steel, power, chemicals, and shipping, are the backbone of global trade and infrastructure, but they are also responsible for a significant share of global CO2 emissions.
A practical bridge to decarbonising shipping Maritime transport, in particular, presents a unique challenge. Over 90% of global goods move by sea, and the sector’s reliance on dense, high-energy marine fuels, makes rapid fuel switching difficult. International shipping alone accounts for nearly 3% of global greenhouse gas emissions – a figure projected to rise if no decisive action is taken.
Regulatory bodies like the International Maritime Organization (IMO) are tightening emission targets, while regional frameworks are also driving change. The EU has introduced FuelEU Maritime in 2025 to enforce greenhouse gas limits on marine fuels. Similarly, California, US, has established stringent low-carbon fuel standards, and other jurisdictions, such as Japan and South Korea, are also developing national carbon pricing and clean fuel mandates. Despite this regulatory momentum, alternative fuels such as green ammonia, methanol, or hydrogen remain years away from widespread adoption and infrastructure readiness. In addition, the cost and limited supply of these fuels pose significant hurdles for shipowners, raising uncertainty over scalability and competitiveness in global markets. This technological lag underscores the need for solutions that can deliver immediate and scalable decarbonisation without major infrastructure upheaval – a challenge that onboard carbon capture systems are positioned to meet. By removing CO2 directly from exhaust gases, vessels can significantly reduce emissions while continuing to operate with existing propulsion systems. This provides a technologically proven and commercially viable pathway today, fully compatible with the longer-term shift to low or zero-carbon fuels.
COVER STORY
Compact, cost-effective carbon capture for the high seas
This is where onboard carbon capture and storage (OCCS) enters the spotlight. As a retrofit-capable, near-term solution, OCCS allows vessels to capture CO2 directly from exhaust gases, compressing and storing it onboard for later offloading at port for permanent storage or reuse. This enables fleets to significantly reduce tank-to-wake emissions while continuing operations using familiar propulsion systems.
One company at the forefront of this innovation is Carbon Ridge, a Santa Monica and Houston-based technology provider having developed the shipping industry’s first centrifugal onboard carbon capture system. The system was recently deployed aboard the LR2 product tanker STI SPIGA . Piloted in partnership with Scorpio Tankers Inc., it features several major advantages:
n Compact, modular design: up to 75% smaller footprint compared with conventional OCCS columns, adaptable for both retrofit and newbuilds, and available in multiple installation configurations.
n Straightforward integration: compatible with existing vessel operations and rapidly deployable at scale.
n Integrated processing: captures and eliminates NOX, SOX, and particulate matter alongside carbon reduction. CO2 is separated from exhaust gases, compressed, liquefied, and stored safely in cryogenic tanks until offloading.
n Fuel-agnostic compatibility: designed to work across current and future marine fuel types, extending its relevance well into the decarbonisation transition.
Carbon Ridge’s technology is built around a compact, modular design that not only reduces initial capital investment but also lowers ongoing operational costs, making large scale deployment practical for shipowners. The system delivers excellent capture efficiency with a low footprint and high energy efficiency.
By providing a cost-effective end-to-end pathway, Carbon Ridge’s OCCS enables shipowners to manage their decarbonisation strategy: capturing CO2 onboard,
compressing and storing it safely, and supporting downstream sequestration or utilisation – with opportunities for monetisation where regulations allow. By scaling OCCS technology for real-world maritime use, shipowners are able to comply with tightening international and regional regulations, safeguard the long-term value of their fleets, and take immediate action rather than wait for alternative fuels to reach full commercial maturity.
Measurement: the invisible backbone of efficient carbon capture
In any carbon capture system, accurate, reliable measurement is vital. Monitoring crucial parameters such as exhaust gas composition and solvent health, as well as process conditions like pressure, temperature, and flow rates, ensures both efficiency and compliance with evolving regulations. Maritime environments add another layer of challenge – vibration, temperature fluctuations, and exposure to corrosive atmospheres demand rugged, proven instrumentation for:
n Gas analysis to monitor CO2 concentrations before and after capture for efficiency calculation and regulatory reporting, as well as ensuring the quality of the CO2 to be stored.
n Flow measurement to accurately monitor CO2 transfer rates and solvent circulation.
n Pressure and temperature monitoring to maintain optimal operating conditions for solvent performance, CO2 compression, and liquefaction.
n Liquid analysis to assess solvent health (track solvent degradation), detect contamination, and schedule timely reclaiming or exchange.
Drawing on experience in various hard-to-abate sectors, Endress+Hauser provides high-precision instrumentation tailored to challenging conditions without sacrificing accuracy, such as:
n Coriolis flow meters for accurate gas and liquid flow measurement, even at low volumes. Its density capabilities are also useful in tracking solvent CO2 absorption rates and capacity.
n Robust pressure and temperature sensors to resist corrosion and harsh environmental conditions.
n Comprehensive liquid analysers and sensors for pH, conductivity, turbidity, and chemical composition monitoring.
Key instruments for ensuring optimum process conditions are, among others, the Promass Coriolis flow meters allowing for accurate monitoring and control of flow rates as well as the amine CO2 loading via density. The online pH sensor can be used to assess the removal of sulfur oxide from the pretreatment system. With Endress+Hauser’s technology, operators gain reliable, traceable data that ensures OCCS operates at peak performance, safeguards compliance with IMO GHG targets, and supports transparent carbon accounting. With decades of experience in precision measurement for demanding industries, the instrumentation for gas analysis,
Figure 1. First centrifugal carbon capture system installed aboard the LR2 product tanker STI SPIGA
liquid analysis, flow, level, pressure, and temperature is engineered to withstand harsh conditions while delivering the accuracy needed for carbon accounting. The devices ensure Carbon Ridge’s system can operate at peak performance, giving ship owners confidence in both their decarbonisation targets and their
Jeroen Huizinga, John Crane, explores sustainable fuels in the marine transportation industry, charting the development of LNG as a bridge fuel, alongside considering the future role that ammonia, hydrogen, and methanol could play.
With global climate deadlines looming and the marine industry aiming for net zero by 2050, shipping companies urgently need to consider lower-emission fuels to decarbonise. If no action is taken to embrace more sustainable technologies, ship owners could be locked into using carbon-intensive fuels for up to three decades – the typical lifespan of a ship’s engine.
LNG is a significant bridge fuel in the marine fuel transition, offering reductions in greenhouse gas (GHG) emissions compared to traditional heavy fuel oil (HFO) predominantly used in marine transport. This article looks at the role of LNG and its implications for future sustainability and explores low-carbon marine fuel alternatives that are currently being developed.
The predominance of HFO in shipping
HFO, or bunker fuel, is a residual product – the leftovers from crude oil refining processes. It is typically used within large shipping engines due to its low cost and high energy density. Most of the fuel used in the marine shipping industry is HFO, with the remaining share taken up by distillates like marine diesel oil and marine gas oil.
The industry’s reliance on HFO is problematic, mainly because combusting HFO is highly polluting. In 2022, international marine shipping accounted for 2% of global energy-related CO2 emissions. According to the International Energy Agency (IEA), a 15% reduction in these emissions by 2030 is necessary to stay on track with net zero.1
As part of the International Maritime Organization’s (IMO) plan to meet decarbonisation goals and reduce
Figure 1. Aerial view of a large container cargo ship.
environmental impact, using LNG will aid the transition to sustainable fuels, like methanol and ammonia.2 While the path to net zero is not straightforward, the consequences of continuing to use traditional engine fuels are considerable for both the industry and the planet.
Preparing for the energy transition with LNG
The global energy transition focuses on reducing carbon emissions while ensuring energy security. In this context, LNG is gaining attention as a long-term solution because it produces fewer emissions when burned compared to coal or oil, serving as a lever for decarbonisation as renewable fuels are developed.
Beyond LNG’s energy density and ease of transport, the marine industry has several other compelling reasons to rely on LNG.
Low carbon intensity
Relative to fossil fuels such as coal (for inland use) and HFO (for marine use), LNG combustion emits 50% less CO2 and does not generate particulates like soot, dust, or fumes.3 Factors contributing to carbon intensity include shipping distances, the use of renewable power, and emissions control. Carbon intensity also varies by region due to differences in production practices and regulatory environments.
Seaborne transportation between producers and consumers is an important link in the LNG value chain. John Crane supports the marine transportation industry with market-ready technologies, including filtration solutions for boil off gas (BOG) management and power transmission couplings, designed for LNG applications.
Ample supply
A sharp increase in the demand for LNG is inevitable as global industries adopt it as a bridge fuel. Shell expects a 50% rise in global demand by 2040,4 a prediction echoed by the IEA,5 who emphasise the need for swift capacity expansion to meet future needs.
Fortunately, LNG has suitable infrastructure and supply for the current market, and promising new offshore solutions are emerging, such as floating LNG (FLNG) facilities. FLNG plants offer mobile extraction and processing by tapping into offshore LNG reservoirs. While the rugged technology powering FLNG is costly, it also provides economic advantages. For example, it does not require operators to build and maintain expensive onshore pipeline infrastructure. The rise of FLNG facilities could catalyse the shift toward LNG-powered marine engines, driving economic and environmental benefits. With natural gas processed offshore, export ships can access the supply directly and carry it to bunkering ports worldwide.
Established global supply chain
There is an opportunity for marine transport to take advantage of LNG’s well-developed supply chain, including liquefaction plants, shipping vessels, and regasification terminals. Maersk has announced dual-fuel vessels capable of using LNG or methanol, signalling a shift towards flexible fuel solutions.
To strengthen the industry’s evolving infrastructure, John Crane offers a range of couplings designed to transmit power efficiently while accommodating the unique challenges of fuels like LNG, hydrogen, and ammonia. The company’s ancillary equipment supports new energy in the marine market with products that include electrical generators, fire water pumps, and water cannon pumps for security.
Alternative marine fuel options
Several alternative marine fuels have the potential to meet operational needs in the push for sustainable shipping. Key factors for evaluating alternative fuels include energy density, sustainability, safety, and compatibility with current infrastructure.
Bio and synthetic LNG
Bio-LNG (liquefied biomethane) has a lower carbon footprint than traditional natural gas, as it is derived from feedstocks such as agricultural manure and waste. It combines well with conventional LNG; when blended at a 20% ratio, bio-LNG could cover 16% of the total energy demand for shipping fuels by 2030 and up to 63% by 2050, according to a study by SEA-LNG.6
Synthetic LNG is a manufactured product identical to conventional LNG but carbon neutral. The first step is to produce zero-carbon hydrogen using electrolysis. The next step is to chemically combine the hydrogen with captured CO2 to produce methane, which is then liquefied. All the power sources in this process must be renewable to ensure carbon neutrality. Bio and synthetic LNG use the same infrastructure and equipment as traditional LNG, such as storage tanks, bunkering, and ships.
Methanol
Methanol represents a compelling alternative to HFO for marine engines, particularly in the context of environmental sustainability. Methanol is a clean-burning fuel that emits no sulfur oxides, minimal nitrogen oxides, and little particulate matter. Typically derived from natural gas, carbon-neutral methanol can be produced from renewables such as zero carbon hydrogen or biomass.
From a practical perspective, methanol is liquid at ambient temperature, meaning transport ships do not require cryogenic or high-pressure containment systems to use it as fuel. Methanol is an internationally traded commodity with a network of existing ports and infrastructure, and methanol ship-engine technology is relatively mature.
Methanol’s potential as a low-carbon marine fuel is not just theoretical. In February 2023, the vessel Cajun Sun completed the first net zero voyage powered by bio-methanol. This long-haul trip from the US to Belgium demonstrated the feasibility and environmental benefits of using an alternative marine fuel.
Even though methanol holds great potential, it also presents challenges, such as the risk of fuel contamination that can harm engines and other components. Filtration solutions adhering to the highest quality standards are essential for addressing this issue and supporting the transition to sustainable fuels, such as methanol as a marine fuel.
Figure 2. John Crane’s Double Block and Bleed (DBB) Fuel Filter – installed on fuel supply systems of dual fuel marine vessels. The design of the filter allows containment of harmful and toxic fuels, such as ammonia and methanol, to guarantee safety.
Hydrogen and ammonia
Hydrogen from renewable power is possibly the gold standard for clean combustion, as it is truly a zero-emissions fuel. However, hydrogen’s large-volume storage needs pose a challenge for long-haul shipping. Compressing and cryogenically cooling hydrogen to a liquid could solve this issue. A more likely avenue is using ammonia as an energy carrier for hydrogen.
Ammonia, a compound of nitrogen and hydrogen, can be combusted in engines without emitting CO2. In ambient conditions, storing and transporting ammonia is easier than gaseous or liquid hydrogen because ammonia is energy-dense, allowing more fuel to be stored in a smaller space. Additionally, ammonia remains in liquid form in ambient temperatures under moderate pressure, whereas hydrogen requires cryogenic temperatures or high-pressure containment to stay in liquid form.
When produced using renewable energy, ammonia is carbon-free. However, its high toxicity demands stringent safety controls to contain the hazards posed by leaks. The development of ammonia engines for marine shipping is currently ongoing.
Full speed ahead
With challenging new emissions reduction targets on the horizon, the maritime industry must chart a course towards leaner, greener, renewable fuel solutions. A leading Korean shipbuilder saw an opportunity for methanol to carry the load, but there were challenges involved.
With the countdown towards the IMO’s emissions reduction deadlines ticking down, the emergence of green fuels such as methanol and ammonia was well-timed. Commissioning the first container ship to be powered by a two-stroke methanol engine made sense economically, and in terms of sustainability and future compliance. According to industry estimates, switching from diesel to methanol would help reduce carbon emissions by 7%, sulfur oxide (SOX) emissions by up to 99%, and nitrous oxide (NOX) emissions by up to 60%.
The challenge
But while methanol, ammonia, and LNG offer a more environmentally friendly solution to a pressing strategic problem, methanol, specifically, presents a practical problem in the potential damage to engines and other components through fuel contamination.
Resolving the issue would not only protect the generator’s machine, fuel train, and engine systems of the world’s first methanol-powered vessel, but it would also support the future viability of methanol-fuelled vessels with implications for increased future industry adoption.
The key was to create a filtration solution for the flashpoint fuel supply system (LFSS) and fuel valve train (FVT). It would need to operate similarly to a traditional fuel oil supply system in delivering temperature-conditioned methanol at an optimal level of fuel cleanliness, and at a rate that could adjust to a fixed supply pressure and flow based on the engine’s load.
The solution
John Crane worked with the OEM and engine manufacturer to engineer a reliable Indufil filtration solution, based on double block and bleed (DBB) filter technologies. There is also a single Indufil filter for the FVT. The solution was engineered to remove harmful particles as small as 10 µm and filter the supply to protect the engine’s moving parts.
The result
On one level, the technology enhanced the ship’s fuel cleanliness, improving machine, fuel train, and engine performance while creating a technological best practices blueprint that would justify the company’s pledge to switch to greener fuel vessels.
In a broader context, the story demonstrates the viability of methanol-fuelled vessels, strengthening the renewable hydrogen value chain for an industry obliged to meet its sustainability targets within the IMO’s 2030, 2040, and 2050 GHG emissions reduction deadlines.
In short, it gives an industry accelerating its transition away from diesel and heavy-oil fuel toward zero emissions marine fuel a navigable path to sustainability success.
References
1. ‘International Shipping’, International Energy Agency (IEA), https://www.iea.org/energy-system/transport/internationalshipping
2. ‘2023 IMO Strategy on Reduction of GHG Emissions from Ships’, International Maritime Organization (IMO), https://www.imo. org/en/OurWork/Environment/Pages/2023-IMO-Strategy-onReduction-of-GHG-Emissions-from-Ships.aspx
3. ‘The Role of Gas in Today’s Energy Transitions’, IEA, https://www. iea.org/reports/the-role-of-gas-in-todays-energy-transitions
4. RASHAD, M., CHOW, E., and BOUSSO, R., ‘Shell expects 50% rise in global LNG demand by 2040’, Reuters, (14 February 2024), https://www.reuters.com/business/energy/global-lng-demandseen-rising-more-than-50-by-2040-shell-report-2024-02-14/
5. ‘Global gas demand set for stronger growth in 2024 despite heightened geopolitical uncertainty’, IEA, (26 January 2024), https://www.iea.org/news/global-gas-demand-set-for-strongergrowth-in-2024-despite-heightened-geopolitical-uncertainty
6. ‘New Study Confirms bio-LNG’s Role in Shipping’s Decarbonization’, The Maritime Executive, (5 October 2022), https://maritime-executive.com/corporate/new-study-confirmsbio-lng-s-role-in-shipping-s-decarbonization
Airat Amerov and Michael Gaura, AMETEK Process Instruments, USA, evaluate the use of tunable diode laser absorption spectroscopy to measure carbon dioxide and monoxide levels in carbon capture and storage.
The industrial use of hydrogen (H 2 ) has increased substantially during the last decades. H 2 is heavily consumed in refineries, ammonia production, the cryogenics industry, and methanol production. This increased demand has resulted in the need to increase the supply in a sustainable manner. This article looks at measuring carbon dioxide (CO 2 ) and carbon monoxide (CO) using tunable diode laser absorption
spectroscopy (TDLAS) in carbon capture and storage (CCS).
Clean hydrogen production
Steam reforming is still the dominant method for H 2 production. In steam reforming, hydrocarbons are reacting with steam to form H 2 . The hydrocarbon feed is mixed with steam at high temperatures and passed through catalyst-filled tubes in the reformer to produce synthesis gas, an
equilibrium mixture of H 2 , CO, and CO 2 . The synthesis gas exits the reformer and is cooled before entering the shift converter. More H 2 is produced over the shift catalyst by converting CO and steam to form CO 2 and H 2
It is known that to produce 1 t of H 2 , this process emits a few tons of CO 2 . However, with CCS, significant amounts of this CO 2 emission can be removed, creating ‘blue hydrogen’. In other words, H 2 can be made from natural gas while capturing and storing the resulting CO 2 to significantly lower the carbon footprint. While the possibility of CO 2 leaks is a valid concern, methods of accurately monitoring CO 2 are in place today. Carbon capture and storage locations are carefully selected to ensure CO 2 stays safely and securely underground.
Residual CO 2 and CO in the H 2 gas reduces the overall H 2 purity. To help clean up these impurities, shift converters are often used alongside CO 2 removal and methanation in traditional wet scrubbing H 2 plants.
In newer, modern H 2 facilities, wet scrubbing is replaced with pressure swing adsorption (PSA), where adsorbent beds are used to remove impurities.
The levels of CO 2 and CO coming out of the shift converter can range from around 0.5 - 4%, depending on factors like the converter temperature and the steam-to-carbon ratio at the reformer. The final purity of the hydrogen depends on the type of clean-up system in place – for example, PSA units can cut CO and CO 2 levels down to as low as 10 - 50 ppmv.
Introducing a new gas analyser
A new process gas analyser, based on infrared TDLAS, was developed for the measurement of CO 2 and CO in production environments. TDLAS as a non-contact optical technique with long-term stability, high specificity, and considerable sensitivity, has found use in many applications in industrial process plants. TDLAS has been proven for several decades, in many energy production and emissions monitoring applications. The low operating expense – no consumables, long life optical components, minimal maintenance requirements – has driven its acceptance as a preferred measurement technology.
Measurements of CO 2 and CO were made with these TDLAS gas analysers in sample matrix of H 2 . Reliable performance was demonstrated over analyte concentrations of 0 - 50 ppmv. Moreover, another TDLAS gas analyser configuration can provide monitoring of CO 2 in the capture and storage facility. Control of CO 2 in a storage reservoir requires measurements in the concentration range of 90 - 100% with accuracy better than 2% of full scale range.
The main goal of the work reported here is to evaluate new TDLAS-based extractive analysers with an all-digital protocol for controlling the laser signal and processing the detectors response. The analyser was configured for measurements in an environmental temperature range of -20°C to +50°C, and a sample cell pressure range of 10 - 25 PSIA.
Instrument design
The TDLAS instrument assessed in this work was an AMETEK 5100 HD analyser, which was modified to operate with a multi-pass sample cell, having an optical path length of 120 cm and a volume of 1 l.
A schematic representation of the instrument is shown in Figure 1. The measurement of CO and CO 2 were performed with an interband cascade laser (ICL) – the light source – in the vicinity of
Figure 1. Schematic diagram of TDLAS low CO2 and CO analyser.
Figure 2. Schematic diagram of TDLAS high CO2 analyser.
4.7 µ m and 4.2 µ m correspondingly. The ICL was placed at the focal point of the application appropriate collimating lens. A beam splitter divided the beam in two parts. One part of the beam was directed through the reference cell. The other portion was directed through the sample cell.
A multi pass of the laser light through the sample cell was achieved using a spherical mirror with a flat mirror at the focal point. The optical path of the sample cell was optimised for this application with photo voltaic detectors used for both the sample and reference channels.
The temperature of the sample cell was controlled and thermally isolated from the laser. The reference cell signal was used to ensure that the laser wavelength was locked on the selected absorption lines for CO or CO 2 . The reference cell contained CO (or CO 2 ) in a background gas with no absorption in the spectral range of interest. Additionally, nitrogen was used to purge the optical path outside of the active portion of the sample cell, to exclude atmospheric CO 2 from contributing to the sample spectra.
A schematic representation of the instrument for measurements of high CO 2 levels is shown in Figure 2.
The splitter was used to divide the optical power in a 50/50 ratio for use in the sample and reference measurements, respectively. The multi-pass sample cell was designed, assembled, and implemented for this specific application. The sample and reference cells each contained photodiode detectors, which were connected to separate input channels of the electronics unit. With this configuration, it was possible to make simultaneous measurements of unknown samples and known references, which were used to lock the output wavelengths for the laser.
1F-based spectral normalisation in TDLAS
The wavelength modulation spectroscopy (WMS) experiment was carried out using a digitally sampled sine function, summed with a staircase, and the resulting signal was used to drive the tunable laser diode. Detected signals were digitised before applying signal processing (e.g., phase-sensitive detection, smoothing, etc.). In contrast with the common practice of using second harmonic detection (2F), the detection/demodulation in this analyser was performed at the laser-modulation frequency (1F detection). Using the 1F-detection scheme enabled the
normalisation of the spectra without needing a separate measurement of the laser power. Specifically, the magnitude of the power envelope of the laser output is contained in the spectra produced by 1F demodulation. After the 1F spectra were normalised, they were differentiated; the resulting derivative spectra approximate the second derivative of the absorption spectrum of the analyte and were referenced as 2F signals in this study.
The scan parameters for the laser (e.g., injection current range, modulation depth, etc.) were set to match the desired wavelength range required to cover the width of the ro-vibrational transition. Linewidth was determined from CO and CO 2 data published in the HITRAN spectral library.
Figure 3. 2F spectra of CO2 and CO in H2
Figure 4. CO2 and CO analyser performance validation.
Table 1. Validation test summary
Results and discussion
The analyser performance was tested with samples of CO 2 and CO in H 2 . Different concentrations of CO 2 and CO were created by mixing carbon oxides with the host gas in a gas mixer. Examples of some measured 2F signals, corresponding to different CO 2 and CO concentrations, are shown in Figure 3.
In this data, the peak amplitude and area of the 2F signal were proportional to the concentration of carbon oxides in the sample cell. With increasing analyte concentration, a common peak position became more notable. Using an Inverse Least Squares regression, a calibration model was developed to accurately measure the CO 2 and CO concentrations in the presence of H 2 sample matrix.
The response variables used in the regression were the integrated values observed over three spectral bands in the 2F spectra. Specifically, a band centred at the peak in the analyte spectrum and two bands centred at each of the local minima adjacent to the peak were used. Concentration estimates were calculated as follows: Where Cj = concentration estimates for each component, a ji = calibration coefficients, and R i = integrated band intensities.
The data shown in Figure 4 are the instrument’s responses to a series of CO 2 and CO challenges over
the concentration ranges of interest. The duration for each challenge was approximately 10 minutes. The response time (T90) was measured to be 40 seconds and was limited by the propagation of the gas in the sampling cell with a flow rate of 1 l/min. A lower T90 time could theoretically be achieved by increasing the sample flow rate. The data acquisition rate was 2 seconds per measurement.
The results of the validation test are summarised in Table 1. The accuracy for CO 2 measurements in H 2 was found to be 0.3 ppmv, with repeatability of 0.1 ppmv. The CO measurements in H 2 accuracy was 0.5 ppmv and repeatability was 0.2 ppmv. Repeatability, defined as the level of agreement between repeated measurements of the same value, was expressed as the standard deviation of the measurements. The value of the accuracy was calculated as the maximum positive and negative deviation of the readings from set value observed during validation test of the analyser.
The data shown in Figure 5 represents the response of the analyser to a series of concentration challenges in the range of 95 - 100%. Several levels of CO 2 were diluted in pure H 2 , using a dedicated gas mixer. The duration of each concentration challenge was at least 30 minutes. The response time (T90) was measured to be 60 seconds and was limited by the propagation of the gas with a flow rate of 1 l/min. The data acquisition rate was 2 seconds per measurement. The results of the validation test are summarised in Table 2. The accuracy for CO 2 measurements in H 2 was evaluated as 0.3% CO 2 with repeatability of 0.2% CO 2
Conclusions
The gas analyser was built for the measurements of CO 2 and CO content to evaluate the purity of produced H 2 . The analyser employed an all-digital measurement approach which was configured to replicate a conventional wavelength modulation spectroscopy experiment.
Further, the digital signal processing methods employed in this system successfully removed minor background interferences, caused by other absorbing species in the sample matrices. Specifically, the digital signal-processing methods employed in this system were used to implement a multivariate calibration, enabling the instrument to accurately measure H 2 in the presence of the overlapped spectral responses.
The CO 2 and CO measurements yielded an accuracy of better than 2% over a concentration range of 0 - 50 ppmv. The high CO 2 measurements yielded an accuracy of better than 0.3%. With TDLAS-based analysers being widely accepted as process and emissions measuring devices, integration in H 2 production and transmission applications is a logical alternative to other measurement devices that directly expose sensors to the gas stream.
Table 2. Validation test summary for high CO2 levels
Figure 5. CO2 analyser performance validation.
Nicolas Carrara, Juan Ruiz, and Carlos Ruiz, KBC (A Yokogawa Company), explore the challenges of industrial scale deployment of green hydrogen and how advanced technologies can help operators to cross the chasm.
Refineries face growing pressure to decarbonise and reduce their carbon footprint due to both tightening environmental regulations and shifting market economics. In this sector, traditional steam methane reforming (SMR) remains the dominant method of industrial hydrogen (H 2 ) production. This process emits an estimated 9 - 12 kg of CO 2 for every kg of H 2 , which often makes it a major contributor to a facility’s overall carbon footprint. 1, 2
Regulatory frameworks are tightening worldwide. In the US, the Environmental Protection Agency’s (EPA) Greenhouse Gas Reporting Program (GHGRP) requires refineries and other large emitters to measure and disclose facility-level CO 2 emissions, raising scrutiny on H 2 produced through carbon-intensive pathways. 3 At a global level, the International Energy Agency’s (IEA) Net Zero by 2050 Roadmap sets out a blueprint with H 2 demand projected to soar. 4 Demand could increase by as much as 105 million t, with more than 200 million t forecast under the IEA’s Net-Zero Emissions (NZE) initiative. These projections highlight hydrogen’s pivotal role in the energy transition. In Europe, the Fit for 55 legislative package enshrines binding targets to cut greenhouse gas (GHG) emissions by at least 55% by 2030, compared to 1990 levels. 5
These frameworks create both regulatory pressure and market momentum, signalling that carbon-intensive H 2 is becoming a liability while green H 2 emerges as both a compliance solution and growth opportunity.
Green H 2 , produced via renewable-powered electrolysis, can dramatically reduce lifecycle GHG emissions to about 1 kg CO 2 per kg H 2 from wind and up to 2.5 kg CO 2 per kg H 2 from solar, according to recent lifecycle assessment studies. 6,7,8,9
Despite these environmental advantages, the shift from pilot scale installations to industrial scale, certifiable green H 2 production faces multiple operational challenges. Operators must contend with the variability of renewable electricity supply, integration with existing combined heat and power (CHP) and grid infrastructures, the capital intensity of electrolyser deployment, the establishment of reliable demand-side contracts, and the implementation of transparent certification and traceability frameworks. Furthermore, production optimisation under dynamic
market conditions, and ensuring interoperability across digital platforms, remain critical to achieve economic viability and regulatory compliance.
This article examines those challenges and how they can be addressed through combining digital simulation tools, real-time and multi-period optimisation, certification frameworks, and financial modelling. Together, these capabilities help bridge the gap between design and operation to ensure green H 2 plants remain efficient, flexible, and competitive in rapidly evolving energy markets.
Integrating renewables with CHP systems
Refineries and other industrial sites are increasingly integrating renewable energy sources and lower-carbon H 2 production methods to meet decarbonisation targets. In this way, the typical CHP plants must manage renewable intermittency while ensuring steady H 2 supply to downstream processes. Due to its criticality, these systems require precise energy management to optimise H 2 output while stabilising the broader utility system. Integrating variable renewable energy sources with existing CHP systems requires advanced energy management strategies to maintain process stability and avoid costly shutdowns.
By employing real-time and multi-period optimisation techniques along with appropriate forecasts, operators align CHP output with fluctuating renewable supply, using storage assets or flexible loads to buffer variability while maximising profit. This approach ensures stable production while minimising emissions across the entire energy network. 10 By mid-century almost 90% of global electricity generation will come from renewables, with wind and solar PV together accounting for nearly 70%. 11 This scale of
Figure 1. Traditional/renewables utility systems.
variable generation underscores why holistic optimisation is no longer optional but a necessity.
Real-time optimisation tools help detect inefficiencies and minimise losses, operating in advisory mode or in closed-loop linked to the control layer. Multi-period optimisation in these systems facilitates planning by incorporating price forecasts, equipment availability and maintenance, energy/H 2 demand from the process side, and weather conditions. These tools calculate the optimal operating schedules, estimate monthly natural gas and power use, and support supplier contract negotiations.
Even the best forecasts cannot fully capture market conditions, which is why multi-period planning must be paired with real-time optimisation to keep operations aligned with current market and process conditions.
Grid integration adds another layer of complexity. Renewable variability affects power factors and grid stability, requiring compatibility with power flow simulators to ensure voltage and reactive power stay within feasible limits. Only then can optimisation strategies be reliably implemented in the field.
As presented in Figure 1, CHP systems are modelled by linking renewables (wind, solar), storage assets (battery energy storage systems [BESS], H 2 tanks), and electrolysers with traditional utilities. Through this approach, operators can combine both multi-period and real-time optimisation to minimise operating costs and/or emissions. The site model must coordinate steam, fuel, and electricity flows across CHP and renewable assets, while also managing H 2 supply from multiple sources to meet process demand.
When grid prices fluctuate or renewable output varies, operators can use storage flexibility (i.e., BESS, H 2 storage tanks, and more) to shift electrolyser loads to off-peak periods. Real-time control reduces operating costs while improving responsiveness to price signals and ancillary service opportunities.
Figure 2 illustrates the optimal planning of H 2 production based on the multi-period optimisation approach. When electricity prices are low, electrolyser output is maximised and H 2 inventories are built up. When prices rise, H 2 is drawn from storage to meet process demand. In this way, optimisation not only maintains reliability but also turns market volatility into a potential source of value.
Figure 3 shows how gas turbine operations interact with solar and wind generation, and how an effective energy management system shapes outcomes. Variability in solar/wind power generation leads to a highly fluctuating break-even price for the operation of gas turbines. Under these conditions, decisions taken solely based on break-even prices, without accounting for multi-period restrictions (such as minimum down times), may lead to less efficient and more costly operations. 12
Optimal management of multi-commodity contracts
A power and fuel contracts management solution for H 2 plants should enable operators to identify the most advantageous
Figure 2. Line-bar chart of the optimal planning for H2 generation.
Figure 3. Interplay between gas turbine operation and solar/wind generation.
contracts, incorporate monthly clauses into multi-period optimisation, and test alternatives through what-if scenarios. It must account for electricity and natural gas pricing complexity (such as the split between commodity and transportation costs) and integrate these considerations into production planning. By aligning electrolyser operations with both supply contracts and H 2 offtake agreements, operators can improve cost efficiency, ensure contractual compliance, and maintain a reliable supply.
To achieve this, the system must connect market signals (electricity, natural gas, CO 2 , H 2 ) with a contract database that stores agreements for power purchase, natural gas imports, CO 2 storage, and H 2 offtake. This allows operators to evaluate the most favourable contracts, analyse key clauses such as take-or-pay or penalties, and assess scenarios under varying market conditions.
As shown in Figure 4, multi-period optimisation must cover contract terms, market conditions, and environmental restrictions all together to generate an operations plan for H 2 production. This includes scheduling electrolyser loads, managing H 2 storage and dispatch, coordinating electricity storage and imports/exports, and aligning CO 2 capture and storage activities. The result is a coordinated approach where contracts, markets, and operations are aligned to support economic performance and environmental objectives.
Certification and carbon accountability
Certification anchors the green H 2 value chain. Robust reporting and auditability tools are essential to comply with regulatory frameworks and build market trust. In Europe, the CertifHy 13 scheme provides traceability, transparency, and credibility to the entire green H 2 production chain by certifying both the production method and hydrogen’s GHG intensity. This establishes credibility across the supply chain and ensures that emissions calculations are both correct and accurate.
In addition to certification, operators also need tools to monitor performance in real time. Dashboards
with detailed analysis capabilities are key to identifying root causes and taking corrective action quickly. 14
Figure 5 shows how the site’s carbon footprint will be affected with (right chart) and without (left chart) management. CO 2 emissions are represented by pink bars, hydrogen export is represented by yellow bars, the carbon intensity of imported electricity is indicated by blue lines, and H 2 storage tank inventories are represented by green areas.
The optimiser/system uses the storage tank capacity to determine over-production of hydrogen during periods of low-carbon intensity of electrical power (i.e., accumulating excess hydrogen in the storage tank) and under-production during periods of high-carbon intensity of electrical power (exporting H 2 from the storage tank). Thus, the net carbon footprint is reduced.
Figure 5. Hourly carbon footprint in the production of H2 without and with management.
Figure 4. Contract framework and optimisation strategy for H2 plants
Ideally, an auditable emissions platform should autonomously calculate cradle-to-gate CO 2 emissions by integrating data from energy systems, electrolysers, and auxiliary units. Emissions reports generated within the system serve as the official records for regulators and certification bodies.
Simulation and training for reliability
At design stage, process simulators enable accurate sizing of electrolysers and storage (BESS, H 2 tanks) and their integration with renewable sources, thereby minimising capital costs and avoiding costly redesigns. Once in operation, advanced monitoring delivers real-time visibility into electrolyser efficiency, degradation rates, and power variability. Process simulators deepen understanding of the physics and chemistry behind H 2 production and support efficient design development.
Dynamic simulation results provide design engineers with insights to improve green H 2 plant engineering. These simulations identify and resolve key challenges to ensure the reliability and safety of the production processes.
The OTS extends this capability by integrating dynamic process models with the actual Distributed Control Systems (DCS) or Supervisory Control and Data Acquisition (SCADA) interface. They provide a safe, realistic platform for operators to practice routine production, start-ups, shutdowns, control tuning, and emergency procedures before plant commissioning. This approach reduces downtime and early operational errors. Operator training with electrolyser banks can improve operational strategies and energy efficiency. For example, including training scenarios covering both safety and optimisation actions, as well as process disturbances, is essential to prepare operators for typical day-to-day operations or to deal with abnormal events.
These tools are particularly critical because practical expertise in green H 2 still remains limited. To achieve meaningful progress toward 2030 energy transition goals, operators must commit to accelerated learning and skill development.
Conclusion
The success of green H 2 relies on more than just installing electrolysers, H 2 storage tanks, renewable sources, and BESS. It demands end-to-end operational excellence, digital integration, and adaptive control strategies. Certification frameworks, advanced optimisation, and operator training are equally critical to ensure that projects move from pilot vision to commercial-scale reality.
Key takeaways for advancing H 2 at scale include:
n Integration matters: combined energy systems must align CHP, renewables, storage, and electrolysers to balance variability while meeting required H 2 demand.
n Optimisation is essential: real-time and multi-period optimisation tools address market and process variability to increase efficiency and save costs.
n Certification builds trust: automated, transparent, auditable emissions accounting ensures compliance and strengthens credibility with regulators and investors.
n Simulation reduces risk: process models and dynamic OTS improve design reliability, operational safety, and workforce readiness.
n Adaptability drives competitiveness: plants that combine technical flexibility with digital intelligence will be best positioned to thrive in evolving energy markets.
Together, these elements support a seamless transition from vision to value.
References
1. CHO, H., STREZOV, V., and EVANS, T. J., ‘Environmental impact assessment of hydrogen production via steam methane reforming based on emissions data’, energy Reports, 8, 13585–13595, (2022). https://doi.org/10.1016/j.egyr.2022.10.053.
2. ‘Towards hydrogen definitions based on their emissions intensity’, International Energy Agency, (2021). Retrieved from the IEA website.
3. ‘EPA Adopts Amended Greenhouse Gas Reporting Regulations for the Oil and Gas Industry’, Practical Law, (2024). Westlaw.com https://content.next.westlaw.com/practical-law/ document/Ibc078df50c9b11ef8921fbef1a541940/EPA-AdoptsAmended-Greenhouse-Gas-Reporting-Regulations-for-the-Oiland-Gas-Industry
4. NNABUIFE, S. G., OKO, E., KUANG, B., BELLO, A., ONWUALU, A. P., OYAGHA, S., and WHIDBORNE, J., The prospects of hydrogen in achieving net zero emissions by 2050: A critical review’, Sustainable Chemistry for Climate Action, 2, 100024 (2023). https://doi.org/10.1016/j.scca.2023.100024
5. ‘Fit for 55 - the EU’s Plan for a Green Transition’, European Council. (2022). Consilium. https://www.consilium.europa.eu/ en/policies/fit-for-55/ .
6. CETINKAYA, E., DINCER, I., & NATERER, G. F., ‘Life cycle assessment of various hydrogen production methods’, International Journal of Hydrogen Energy, 37(3), 2071–2080, (2012). https://doi.org/10.1016/j.ijhydene.2011.10.064.
7. JI, C., and WANG, L., ‘Life cycle assessment of hydrogen production from renewable and fossil energy sources’, Energy, 219, 119556, (2021). https://doi.org/10.1016/j. energy.2020.119556.
8. AYDIN, M. I., and DINCER, I., ‘An assessment study on various clean hydrogen production methods: Life-cycle impact analysis of renewable-based hydrogen production’, Energy, 245, 123090. (2022). https://doi.org/10.1016/j.energy.2021.123090.
9. GAN, L., ZHANG, X., and ZHANG, Z., ‘Life cycle greenhouse gas emissions of hydrogen production from wind and solar energy’, Frontiers in Energy Research, 12, 1473383, (2024). https://doi. org/10.3389/fenrg.2024.1473383.
10. RUIZ, C. A., ‘Optimal energy and emissions management during energy transition’, KBC Advanced Technologies, (2021). Retrieved from https://www.kbc.global/uploads/files/ software/Optimal%20Energy%20and%20Emissions%20 Management%20During%20Energy%20Transition.pdf. https:// youtu.be/Z5flw5WfoB0?list=PLpM9uYBd1UUICsPtPAjrDJqPWzj7 57Q5b&t=1.
11. ‘Net Zero by 2050 A Roadmap for the Global Energy Sector’, International Energy Agency, (n.d.), https://www.energy.gov/ sites/default/files/2021-12/IEA%2C%20Net%20Zero%20 by%202050.pdf.
12. RUIZ, J., ‘Real-Time Scheduling System for the Optimal Operation of Utility Plants with Renewable Energy Assets’, Spring 22 + 18th GCPS, A Joint AIChE and CCPS Meeting, (San Antonio, Texas, US) (April 10 - 14).
13. https://www.certifhy.eu/
14. RUIZ, J., RUIZ, C., and WICMANDY, M., ‘Decarbonising the Energy Ecosystem’, Global Hydrogen Review, (Summer 2024), pp. 61 - 66.
Andrew Symes, OXCCU, UK, explains why Europe should prioritise producing sustainable aviation fuel locally rather than depending on imported methanol.
While the UK and EU will inevitably rely on some sustainable aviation fuel (SAF) imports, there is a strategic imperative to ensure that at least some production is anchored in Europe. To strengthen European energy security and to ensure the economic benefits of scaling clean infrastructure stay local, incentives such as additional subsidies and revenue certainty mechanisms should prioritise projects that use green energy and waste carbon sourced from within the region instead of those projects which rely on imported feedstocks, intermediates or precursors.
As Europe moves to scale up production of SAF, discussions have emerged around whether importing bio or e-methanol in particular from outside the continent could offer a viable way to meet growing demand at a reasonable cost. The argument hinges on the idea that Europe lacks sufficient feedstock, green energy, and waste carbon to produce both SAF and e-SAF at scale. By importing methanol (CH3OH), Europe could, in theory, bring in waste carbon and renewable energy in liquid form and upgrade it domestically to SAF via the methanol-to-jet (MTJ) process. This process involves converting methanol into short-chain olefins, then upgrading those to longer hydrocarbon chains suitable for jet fuel through oligomerisation.
The challenges of relying on imported methanol
However, this approach presents major challenges. First and foremost, importing methanol does not support European energy security. For Europe to retain control over any part of its aviation fuel supply, it must also retain control over a proportion of the underlying feedstocks. This means that for at least part of its SAF production, both the waste carbon and the energy required to convert it – whether in the form of green hydrogen from renewable electricity, or biohydrogen from waste-derived syngas – must originate within its own borders. Otherwise, Europe risks replicating the vulnerabilities
seen with used cooking oil (UCO), where over-reliance on imports, particularly from China, has left domestic producers exposed. If Europe becomes dependent on green methanol imports, it risks losing influence over its supply chain to external players who could upgrade the fuel themselves, restrict exports or redirect supply elsewhere.
There are also significant verification challenges. Ensuring that imported e-methanol meets European standards for green hydrogen production, including additionality, or confirming that biomethanol is genuinely waste-derived rather than fossil-based, requires rigorous monitoring. This is particularly difficult in regions such as China, where coal-based methanol is already widely produced and transparency over production methods is limited. Differentiating methanol made from green, grey, or biohydrogen at scale would be extremely difficult in practice.
Transporting methanol over long distances to upgrade it to SAF in Europe also makes little sense from an energy density perspective. Methanol has a low energy density because of its high oxygen content. For every carbon atom, there is an oxygen atom that must later be removed to produce jet fuel. This adds unnecessary mass and volume to the fuel. SAF, by contrast, is far more energy-dense and easier to transport. If methanol is the chosen feedstock, it would be more efficient to convert it at the site of production into SAF, or at least into a largely deoxygenated hydrocarbon, which could then be hydroprocessed at a European refinery.
The issue is further complicated by scale. Methanol plants can often be small and decentralised, particularly when based on local biomass or distributed renewable energy, whereas MTJ facilities are technically complex and not easily scaled down. This could mean that aggregation from smaller methanol plants might make sense within a country or region, and it certainly makes more sense than aggregating biomass, which contains even more oxygen and water. But as the distances increase, and methanol begins to move in large quantities across borders, the challenges of transporting a fuel with such poor energy density quickly mount.
It is also important to distinguish methanol from traditional fossil fuel imports. Methanol is not equivalent to crude oil, naphtha, or finished fuels like diesel or jet fuel. Oil and its derivatives are naturally deoxygenated, energy dense, and supported by well-developed global supply chains. Methanol, on the other hand, is toxic, water-soluble, and though better than hydrogen, CO2, or biomass to ship, it is still far more difficult than hydrocarbons. It requires specialised chemical tankers that are often restricted to methanol-only cargo, limiting supply chain flexibility. Methanol production also requires complex chemical processing using reactors and catalysts, unlike oil extraction, which involves simpler separation processes. Stopping at methanol only makes sense where aggregation and shipping can be done over short distances. If the objective is to produce SAF, then the methanol production facility should be co-located with an MTJ unit, or the methanol should at least be upgraded to a deoxygenated hydrocarbon before export. This would reduce lifecycle emissions and simplify logistics.
None of this is to say that methanol should never be traded. It plays an important role as a feedstock in the global production of chemicals and plastics, and is also used in gasoline blending. In these applications, methanol is used in its original form or its oxygen remains present in the final product – for example, in formaldehyde, acetic acid, or MTBE. In such cases, shipping methanol is justified. But when methanol is used as an intermediate for SAF, where the goal is to strip out the oxygen and produce a hydrocarbon fuel, it makes far less sense. If the goal is SAF, the fuel being shipped should also be deoxygenated.
The role of subsidies in shaping the debate
Given this, why is the importation of bio or e-methanol even being considered? The answer likely lies in subsidies. If bio or e-methanol is produced in a country where it benefits from government incentives, such as China, and then further subsidies are received in Europe to either build a plant to convert it into SAF, or to upgrade it to SAF, project developers can take advantage of dual subsidies to artificially lower SAF prices. This strategy, while financially opportunistic, does not serve Europe’s long-term interests. The CO2 to methanol then MTJ route is a legitimate technological pathway competing with F-T pathways, but the comparison becomes misleading if green methanol is sourced from abroad rather than produced within Europe.
Securing Europe’s aviation fuel future
Europe will inevitably import some SAF to remain cost competitive. But it cannot afford to outsource its entire fuel supply. Maintaining domestic SAF production capacity is essential not only for price stability, but for energy resilience, military preparedness, and job creation. Europe already has the potential to produce SAF from biogenic carbon derived from waste biomass, and from green hydrogen generated by its growing renewable and nuclear power sectors. It also has access to biohydrogen from syngas derived from gasification, and biomethane derived from anaerobic digestion. Investing in local production capacity also helps build and scale the underlying green infrastructure – electrolysers, gasifiers, and AD plants –which will be vital to the broader energy transition.
All European countries generate waste carbon, and all are expanding green energy. If the barriers to domestic SAF production lie in aggregating carbon, securing electrolysers, navigating planning processes, or accessing engineering skills, then these are issues that need to be addressed. Relying on imported methanol is not a long-term solution. It limits Europe’s ability to build its own supply chain, delays investment in critical infrastructure, and creates new dependencies in place of existing ones.
To properly secure its aviation fuel supply, Europe needs to retain some domestic production of SAF from local feedstocks. That means building a system where the carbon, the energy, and the processing infrastructure originate within Europe. Only then can the continent maintain control over a portion of its supply and capture the long-term industrial and economic benefit.
Juan J. Gonzalez, Merichem Technologies, considers how refineries and petrochemical operations can reduce sulfur emissions for increased safety and sustainability.
When hydrogen sulfide (H 2 S) is released into the air, it remains there for up to 42 days depending on the season, where it can oxidise to sulfur dioxide and sulfates. When released in water, it forms hydrosulfuric acid and can be oxidised to elemental sulfur;
in soil, it is consumed by bacteria and transformed into sulfur.
With H 2 S occurring in natural gas and petroleum and more than 50% of the world’s energy demand being met by oil and natural gas, removing H 2 S in the oil refining process is crucial for safety and environmental reasons. It is but one factor that motivates balancing energy security and growth with contributions to decarbonisation efforts.
From super majors to small operators, downstream producers are perpetually proactive in looking at ways
to operate their assets more efficiently, affordably, reliably, and safely, where each drop of crude oil and each group of molecules is managed, virtually eliminating any significant sulfur containing products as well as those of lower value which, in turn, helps meet environmental regulations and reduce pollution.
H2S removal for the environment
The necessary removal of H 2 S found in transportation oil and other petroleum products has always drawn attention to removal technologies. Early H 2 S removal methods involved gas stripping, where inert gases like nitrogen or steam were used to remove H 2 S from crude oil or natural gas, adsorption wherein liquids like amine solutions were used to adsorb H 2 S from gas streams, and iron oxide or activated carbon scavengers which also adsorb H 2 S.
As materials science and chemical engineering became more sophisticated, technologies and techniques became more efficient and environmentally friendly. Contemporary H 2 S removal runs the gamut from amine solutions and Claus processes to electrochemistry and membrane separation. Identifying the best removal technology for a given refinery is based on several influencing factors, including H 2 S concentration, process conditions such as temperature and pressure, the presence of other gases, safety, environmental regulations, alongside capital expenses (CAPEX) and operating expenses (OPEX).
Moving molecules to sweeten the deal
The history of mass transfer dates back to the 19 th century with the development of the diffusion theory. Distillation, a fundamental process in refining, began to be practiced in the 1920s, even though the underlying principles of mass transfer were not yet fully understood or scientifically applied. Advancements in chemical engineering enabled more scientific approaches to distillation and gas adsorption, leading to improved design and a deeper understanding of refinery processes. From the mid-1940s onwards, the development of catalytic cracking shifted refining from purely mechanical operations, such as fractional distillation, to chemical processes, further highlighting the importance of understanding mass transfer in complex reactions and separations.
Figure 1. FIBER FILM Contactor (FFC) hydrocarbon treating.
Figure 2. Aerial view of a refinery.
Caustic treatment was used for years to remove H 2 S from various refinery streams, with the industry relying heavily on dispersive mixing methods for treatment. However, these conventional techniques for dispersion and phase separation were fraught with numerous limitations. They suffered from restricted turndown capability, making it difficult to respond to varying operational demands. Furthermore, they were vulnerable to issues such as carryover, plugging, flooding, and channelling, which disrupted operations and compromised efficiency.
Inconsistent treatment outcomes are another significant drawback, as lengthy settling times can lead to unpredictable results. Additionally, the carryover of the aqueous phase, generation of dilute aqueous waste, diminished service factors, hydrocarbon losses, larger spatial requirements, product contamination risk, and the need for supplementary processing steps and equipment all contributed to operational complexity.
In traditional practices contacting two immiscible liquids, like hydrocarbons and caustic solutions or amines, involved dispersing one liquid into the other in fine droplets. While this increases surface area for mass transfer, it can also complicate the separation process. When the mixture is placed in a phase separator, the caustic droplets must settle by gravity, a process that can take several hours. In response to more demanding treatment needs, operators often increased mixing energy to maximise the interfacial surface area. However, such process intensification frequently resulted in an increased dispersion of the aqueous phase and dramatically prolonged the required separation times.
The formation of stable emulsions within the mixing device can exacerbate these challenges, resulting in significant carryover within the separator vessel. This excessive carryover necessitated the installation of costly downstream equipment, such as knockout vessels, sand filters, and water wash units, to effectively remove the dispersed aqueous phase from the treated product. Moreover, if an emulsion develops, treatment processes frequently encounter interruption, further complicating operational workflows.
Over the years, mass transfer became a crucial process in refineries, particularly in distillation processes, where streams are fractionated to separate components based on their boiling points.
In 1974, Merichem introduced FIBER FILM ® Contactor (FFC) technology to the industry as a non-dispersive phase contact device for various caustic, amine, and acid treating processes. Since then, the FFC technology has been licensed and effectively deployed across various sectors within the hydrocarbon processing industries for sulfur treatment. It is a vital process that plays an essential role in removing impurities during hydrocarbon refining. The technology facilitates non-dispersive phase contact, bypassing challenges that affect traditional dispersive mixing devices.
FIBER FILM Contactors are employed in various processes which collectively remove nearly 621 million lbs of sulfur by treating hydrocarbons containing H 2 S, COS, and mercaptans each year. Removal of the impurities eliminates the emission of over 1240 million lbs of potential SO 2 formation.
Conclusion
Refineries are mandated to evaluate and lessen their environmental impact while simultaneously being key energy providers. Remaining competitive while taking steps towards sustainability and reducing environmental impact does not have to be difficult, but each asset or complex should be treated individually. There is no silver bullet solution applicable to every facility, so all refiners and petrochemical companies that process sulfur-containing feedstock are well advised to research options to minimise the release of greenhouse gases by their operations and at the point of use. Mass transfer plays a vital role in enabling the efficient separation and purification of various hydrocarbon compounds for optimising refining operations and producing high-quality petroleum products.
Figure 3. Merichem Technologies’ FFC.
Frank Campagna and Alice Shao, Emerson, USA, discuss how technological improvements in design, valve packing, and relief valves address a host of emission and maintenance problems in downstream oil and gas facilities.
Emission reduction has become a universal goal for every company operating in the downstream oil and gas sector. Driven by tightening environmental regulations, a need to improve safety, a desire to cut greenhouse gas releases, and the obvious cost of product loss, facilities are searching for ways to reduce, if not eliminate, releases to the atmosphere.
This article discusses several avenues for emission reduction, many of which can cut operational costs. It begins by describing the various types and sources of releases, and it
1. While fugitive emissions emit from a variety of sources, a very large percentage of them emanate from valves, with nearly half coming from the
Figure 2. Modern packing designs (Emerson’s FisherTM enhanced ENVIRO-SEALTM shown) are live loaded, usually with compressed Belleville springs, to maintain constant pressure on the packing rings. Carefully engineered combinations of materials allow the packing to achieve and maintain emission rates as low as 1 ppm, even as they handle elevated process temperatures and pressures.
then describes a variety of solutions and technologies to target and reduce emissions. The article concludes with case studies showcasing the successful implementation and resulting savings from these techniques.
Understanding the problem
Before undertaking a programme to reduce emissions, it is best to fully understand the problem. There are generally two types of emissions that occur in an operating plant, vented and fugitive. Vented emissions are gases that are released, either continuously or intermittently, into the atmosphere as part of the operational design of equipment. Fugitive emissions are caused by the loss of sealing tightness in and around joints and components of equipment such as valves and flanges. This article will focus on fugitive emissions, while covering vented emissions in less detail, because the former totals more than 1 million tpy worldwide. Of that figure, approximately 12% is attributable to oil and gas production and distribution.
The cost of these fugitive emissions is significant. Given the magnitude of the problem, many governmental agencies are targeting these discharges with increasingly burdensome and expensive regulations that inflict a variety of penalties on sites that fail to address and reduce atmospheric releases. In addition to that cost, there is the obvious loss of intermediate and final products to the atmosphere, which wastes both product and energy. Lost product through fugitive emissions can cost a 250 000 bpd refinery up to US$3.2 million annually.
Fugitive emission sources
In an industrial plant, fugitive emissions typically leak from moving equipment, such as automated valves and pumps, as well as stationary connections, like flange gasket leaks. Relief valve seal leaks are another common source. These leaks can result in significant product loss since many of these valves feed into a flare header, where leaks are difficult to detect, so the leak can continue for days, weeks, and even months before being noticed. While there are many sources, most plants find that the bulk of these emissions, about 60%, come from valves, with valve stem/packing leaks the largest contributor (Figure 1).
Valve stem packing has a difficult task to perform because it must allow the valve stem to move smoothly and without restriction, yet seal that same stem tightly such that no process gases can escape. While this may be relatively easy to achieve initially, it is much more difficult to keep leaks minimised as the packing wears. Fortunately, there are solutions to address this problem.
Emission solutions: globe vs rotary valves
There are multiple methods to address valve stem emissions, with the first requiring consideration of the valve design. There are generally two types of valves: globe valves (also known as sliding stem or linear
Figure
valve stem packing.
valves), which have stems that move up and down, and rotary valves (sometimes referred to as quarter-turn valves), which rotate the valve stem. It is much more difficult to properly seal globe valves because the valve tends to wear grooves in the packing as it moves up and down, and these grooves provide a path for process gases to escape. Sealing rotary valves is generally easier since the rotary motion may create a packing groove in one area of the stem, but that groove does not create a path to the atmosphere.
Figure 3. Standard packing (left) will wear over time, requiring routine packing adjustment to reduce emissions. Advanced live-loaded environmental packing (right) maintains very low emissions and provides lower ongoing maintenance costs.
There are many good reasons to choose a globe valve over a rotary valve, so elimination of all globe valves is rarely an option. However, in cases where a plant process requires valves that are constantly stroked and must provide very tight shut off, switching from a sliding stem design to a rotary valve can be a wise choice. Applications such as molecular sieves or pressure swing adsorbers favour zero-leakage rotary valves, which provide consistent and reliable bubble tight shut off, despite constant cycles, abrasive media, and pressure from upstream and downstream process gases. Another problematic application is valves installed in an environment where the process temperatures constantly cycle, such as valves associated with heat exchanger units. In this case, different components of the valve stem expand and contract at different rates, creating emission leak paths. The solution is valves incorporating materials of construction specifically selected to respond to temperature swings.
Regardless of the valve selected, it will require packing to keep process gases from escaping. Valve packing designs have dramatically advanced and improved in recent years, and now nearly every valve can significantly benefit from an upgrade of its packing.
The maximum allowable fugitive leakage limit for valves, as defined by the US Environmental Protection Agency (EPA), is 100 ppm. Advanced environmental packing designs (Figure 2) typically incorporate Belleville springs to continuously compress the packing seals. When paired with a combination of different packing ring materials, these designs help account for packing ring wear and can provide leak rates as low as 1 ppm, while handling a wide range of process temperatures and pressures.
These new packing designs may also incorporate valve stems with special coatings and materials to
Figure 4. Relief valves can be modified to include a back pressure piston above the bellows, greatly improving operation.
extend life, while maintaining smooth and unimpeded movement.
Packing designs in older valves prioritised free movement over low emissions and did not incorporate Belleville springs, so they leaked more and typically required constant adjustment (Figure 3).
A wise first step for most sites is to evaluate the packing styles on existing valves and quantify their performance. Valves handling dangerous process media or subject to regulatory constraints regarding emissions should top that list. In many instances, a packing upgrade at the next maintenance overhaul is justified, as the emission reduction associated with a packing upgrade will quickly pay for itself.
Relief valve bellows improvement and leak monitoring
Leaking bellows on pressure relief valves (PRVs) can be another common source of fugitive emissions. Many relief valves in flare header applications require a bellows, which allows the relief valve to open at set pressure regardless of the variable backpressure present in the header. Unfortunately, these bellows tend to develop small cracks that can affect the relief valve set pressure, and vent flare header gases to the atmosphere through the PRV bonnet.
A solution to this problem is an upgrade kit that installs a piston above the bellows and beneath the bonnet (Figure 4). This piston serves two important purposes:
n It allows the PRV to operate as expected even if the bellows fails. The piston design essentially offsets the header back pressure, such that the relief valve will continue to lift at setpoint, despite backpressure from a damaged bellows.
n It can detect even microleaks in the bellows. By installing a pressure transmitter measuring the pressure in the chamber between the bellows and adapter, leaks as small as 0.0014 in 2 (0.9 mm 2 ) can be detected. This informs operations that a leak exists, enabling timely response.
There are also other technologies that can be brought to bear to reduce relief valve fugitive emissions, seat leaks, or quantify releases when a pilot operated relief valve opens. Acoustic/temperature transmitters can be mounted on the PRV discharge to detect releases and alert personnel when a PRV fails to fully seat and seal after opening (Figure 5).
Pressure transmitters can also be mounted on certain piloted operated relief valves to indicate not only when the valve lifts, but also the volumetric quantity of the release event (Figure 6).
In all these cases, the knowledge of detecting when a PRV lifts and if it is leaking allows the plant to quickly respond and correct the issue. These devices enable significant reductions in fugitive emissions and product loss since they provide real-time operational data for equipment that has historically had no visibility.
Case histories
Eleven older valves in hydrocracker high pressure hydrogen service at a refinery had endured significant packing leaks for years and required constant maintenance to minimise fugitive emissions. The plant consulted with its automation vendor and discovered that a new high pressure, low emission environmental packing design was available as a retrofit. The site upgraded all the valves with the advanced packing design during an outage, dramatically dropping emissions and product loss below 100 ppm, while significantly reducing required maintenance.
Another refinery recently installed flow meters and relief valve acoustic transmitters on its extensive flare header system. The project paid for itself in five months by providing plant personnel with the information needed to immediately detect and stop valve relief events and associated leakage. Using this data, the plant was able to understand and reduce overpressure events, which had been costing between US$2500 - 50 000 per release.
Conclusion
Emission reduction is a major goal for many facilities, with the effort justified by avoiding fines, improving safety, and minimising product loss. Since valves account for more than half of these releases, most plants should start by evaluating the types of valves they use, and the packing designs they employ. Targeting valves carrying high value products, installed in lethal service or mission-critical applications, or requiring high maintenance, is a good place to start. In many cases an environmental packing upgrade may be available, which can generate meaningful savings immediately, while improving safety.
Relief valve technology has also become available to provide real-time process data. The ability to detect leaks on valves in flare header applications and quantify release events enables plant personnel to minimise emissions and release events.
A comprehensive programme for emission reduction will often begin with a careful review of the major sources of emissions and the pain points within a facility. Once the issues are better understood, a discussion with a knowledgeable automation partner is a good next step. In many cases, the vendor can suggest equipment upgrades or new technologies to address these problems, while providing better insight into relief events and their causes.
Figure 5. This graph illustrates how an acoustic/temperature transmitter can detect a PRV release and leakage.
Figure 6. A pressure transmitter (top left) mounted on a pilot-operated PRV can detect when the PRV lifts and quantify the volume of gases emitted.
Dr Ankush Gulati, ABB Motion Services, Singapore, outlines why energy intensive industries should prioritise energy efficiency in order to reach their climate goals.
The global energy transition is often associated with high-profile technologies such as green hydrogen, large scale renewables, and carbon capture, utilisation, and storage (CCUS). While these are essential pillars of a net zero future, they remain capital intensive and require long
deployment timelines. By contrast, energy efficiency is immediate, affordable, and universally applicable. The International Energy Agency (IEA) has described efficiency as the ‘first fuel’ of the transition, capable of reducing emissions more quickly than almost any other measure.
At COP28, governments committed to doubling the rate of global energy efficiency improvements by 2030; achieving this is critical to delivering on net zero by mid-century. Building on that momentum, the IEA’s 10 th Global Conference on Energy Efficiency in Brussels, Belgium, in June 2025 “reaffirmed that energy efficiency is a top priority across all policy areas” and underlined its essential role in enhancing energy security, affordability, and competitiveness. For energy-intensive industries such as downstream oil, gas, and
petrochemicals, the imperative is paramount. These sectors consume vast amounts of energy in refining, cracking, distillation, and supporting processes; improving efficiency here offers both rapid decarbonisation and strengthened industrial resilience.
Energy demand in the downstream sector
The downstream segment of oil and gas –encompassing refining, petrochemicals, and distribution – is among the largest industrial energy consumers. As of 2023, oil and gas operations account for around 15% of total energy-related emissions globally, the equivalent of 5.1 billion t of greenhouse gas emissions. 1 Petrochemical production, particularly steam cracking, adds further pressure: producing olefins and aromatics is one of the most energy-intensive industrial activities, with global petrochemical demand forecast to grow steadily through 2050.
Energy use in downstream operations is concentrated in three areas. The first is process heat, where fired heaters, boilers, and furnaces provide the high-temperature heat required for cracking, distillation, and reforming. The second is mechanical drives: electric motor-driven systems powering pumps, compressors, and fans are ubiquitous, yet often operate inefficiently. The third is utilities and support systems such as cooling water, steam networks, and power generation, all of which consume significant energy.
Because energy is both the largest input cost and the dominant source of Scope 1 and 2 emissions, efficiency improvements deliver a triple benefit: reducing emissions, lowering costs, and improving energy security.
The technology opportunity
Over 300 million industrial motors are in use worldwide, driving nearly every major industrial process; however, only about one-quarter are paired with variable speed drives (VSDs), which allow motor output to match real-time demand. This represents one of the most accessible opportunities for efficiency in the downstream sector. Transitioning from legacy IE1/IE2 motors to modern IE4 and IE5 models can cut energy losses by up to 20%. An IE3 motor pushes the bar higher, reducing energy losses by 40% in comparison with an IE3 one. VSDs can reduce energy consumption by 20 - 25% in pumping, fan, and compression
Figure 1. Electric motor-driven systems powering pumps, compressors, and fans are ubiquitous, yet often operate inefficiently.
Figure 2. ABB’s audits have identified savings roughly equal to the annual consumption of 140 000 US households.
applications by preventing motors from running at full speed unnecessarily. The combination of efficient motors and VSDs is transformative. ABB’s audits of more than 13 000 industrial systems worldwide revealed average energy savings of 40%. Among the 8800 systems prioritised and appraised, the identified savings equated to 1500 GWh/yr – roughly the annual consumption of 140 000 US households.
Heat generation and transfer is the single largest energy sink in downstream operations. Waste heat recovery, process integration, and high-efficiency burners all have the potential to deliver meaningful savings. Capturing exhaust gases from furnaces and boilers to pre-heat feedstocks or generate steam can significantly reduce energy demand. Pinch analysis and process simulation can be used to optimise heat exchange between hot and cold streams. Modern
burners and boilers, meanwhile, can improve thermal efficiency by 5 - 10% compared to older designs.
The convergence of digital technologies with industrial equipment offers additional efficiency potential. Real-time monitoring enables operators to identify deviations, leaks, or inefficiencies as they occur. Predictive maintenance uses analytics to anticipate equipment failures, reducing downtime and unnecessary energy waste. Digital twins create virtual models of plants that can be used to optimise energy flows, simulate upgrades, and test efficiency scenarios. These solutions not only reduce energy use but also improve reliability – a crucial advantage in capital-intensive downstream operations where unplanned outages carry significant costs.
The business case
Energy efficiency projects often face scepticism because they are seen as incremental rather than transformative. However, their business case is compelling. Investments in efficiency typically deliver returns within two to five years, far faster than most decarbonisation technologies. Efficient systems run cooler, wear less, and require fewer interventions, which improves operational reliability. Reduced energy demand also insulates operators from volatile fuel and electricity prices, enhancing resilience.
For example, refineries that upgrade to high-efficiency motors and install VSDs on cooling tower fans can often reduce power consumption by doubledigit percentages while simultaneously improving process stability. Similarly, petrochemical producers implementing advanced process control in cracking furnaces can reduce energy intensity while increasing throughput.
Policy and market drivers
Governments and regulators are increasingly recognising energy efficiency as a strategic priority. In the EU, the updated Energy Efficiency Directive sets binding targets and imposes stricter requirements on large energy users. Efficiency measures are framed not only as climate action, but also as a pillar of the EU’s energy security. Across Asia-Pacific, countries including China, Japan, and South Korea are scaling industrial efficiency programmes, motivated by both climate goals and resource security. In the US, the Inflation Reduction Act was put into law to bring tax credits and funding for
Figure 3. Energy efficiency provides short-term, verifiable results.
Figure 4. Energy efficiency has too often been dismissed as incremental; in reality, it is transformative.
37% do not have structured strategic frameworks for energy efficiency to enable them to prioritise investment. Many operators also underestimate the savings potential or lack in-house technical capacity to deliver projects effectively. In some cases, split incentives mean that operators who bear the capital cost do not directly benefit from energy savings.
Enablers that can accelerate uptake include clear policy frameworks, tax incentives, and carbon pricing signals that encourage investment. Innovative financing mechanisms such as energy service companies (ESCOs) and green bonds allow efficiency projects to be funded off balance sheet. Finally, digital measurement and verification systems build confidence by proving savings in real time, unlocking further investment.
Looking ahead: scaling efficiency to net zero
According to the IEA, scaling energy efficiency could deliver more than 40% of the emissions reductions needed by 2030 to stay on a net zero trajectory. In the downstream sector, this translates into both immediate and long-term benefits. Efficiency effectively ‘buys time’ for the deployment of more complex solutions such as hydrogen and CCUS by reducing baseline demand.
It also strengthens competitiveness in a tightening regulatory environment. For downstream operators, the message is clear: efficiency is not a secondary option, but the foundation upon which credible decarbonisation strategies must be built.
Conclusion
Energy efficiency has too often been dismissed as incremental; in reality, it is transformative. For the downstream oil, gas, and petrochemical industries, it delivers rapid emissions reductions, lower operating costs, and improved resilience, all with technologies available today.
The global policy environment is aligning, the technology is mature, and the business case is proven. What is required now is decisive industry action: moving from pilots to scale, and from ambition to implementation.
By embracing energy efficiency as the first fuel, the downstream sector can contribute meaningfully to climate goals while safeguarding its own competitiveness. The path forward is clear, and the time to act is now.
Reference
1. ‘Emissions from Oil and Gas Operations in Net Zero Transitions: A World Energy Outlook Special Report on the Oil and Gas Industry and COP28’, IEA, OECD Publishing, Paris, (2023), https://doi.org/10.1787/317cbf59-en.