Exhibit P - Geology, Hydrogeology, and Preliminary Geotechnical Report
Geology, Hydrogeology, and Preliminary Geotechnical Report
Crossroads Solar Grazing Center Morrow County, OH
Prepared for:
Crossroads Solar I, LLC 1105 Navasota Street Austin, Texas 78702
Prepared by:
Verdantas LLC
6397 Emerald Parkway, Suite 200 Dublin, Ohio 43016
Verdantas Project No: 17078
May 2025
Figures
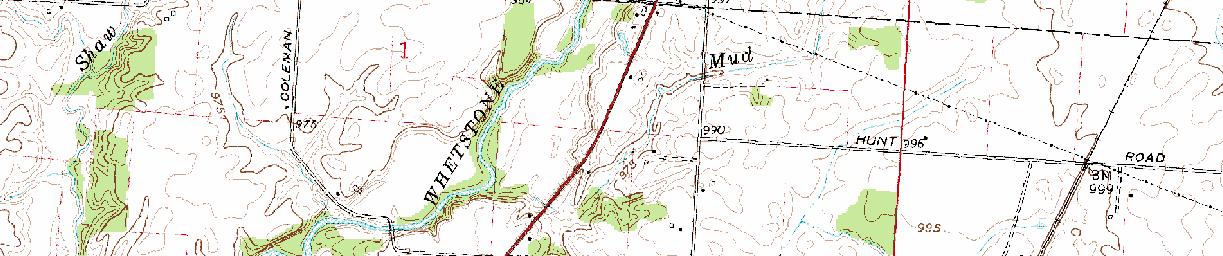
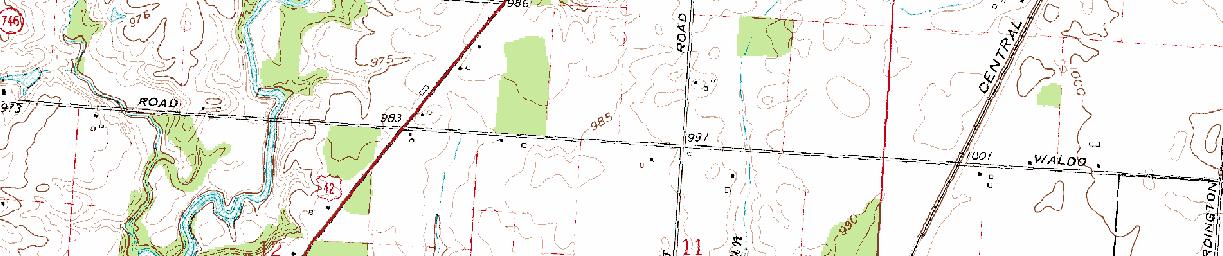
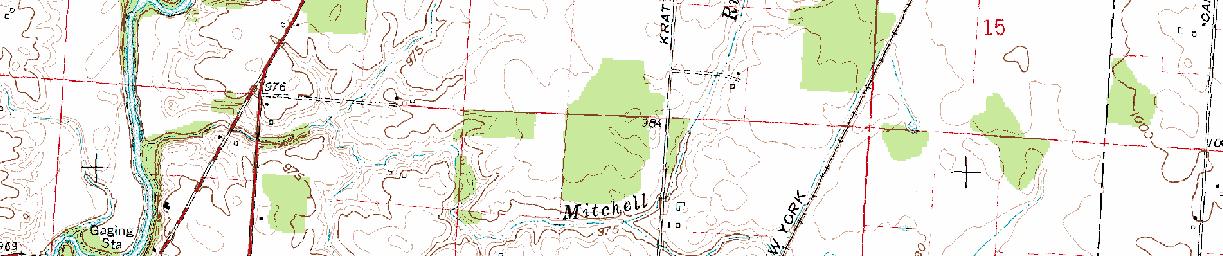
Figure 1 Project Area with Bedrock Geology and Topography
Figure 2 Structural and Seismic Features
Figure 3 Surface Water and Wetland Information
Figure 4 Floodplain
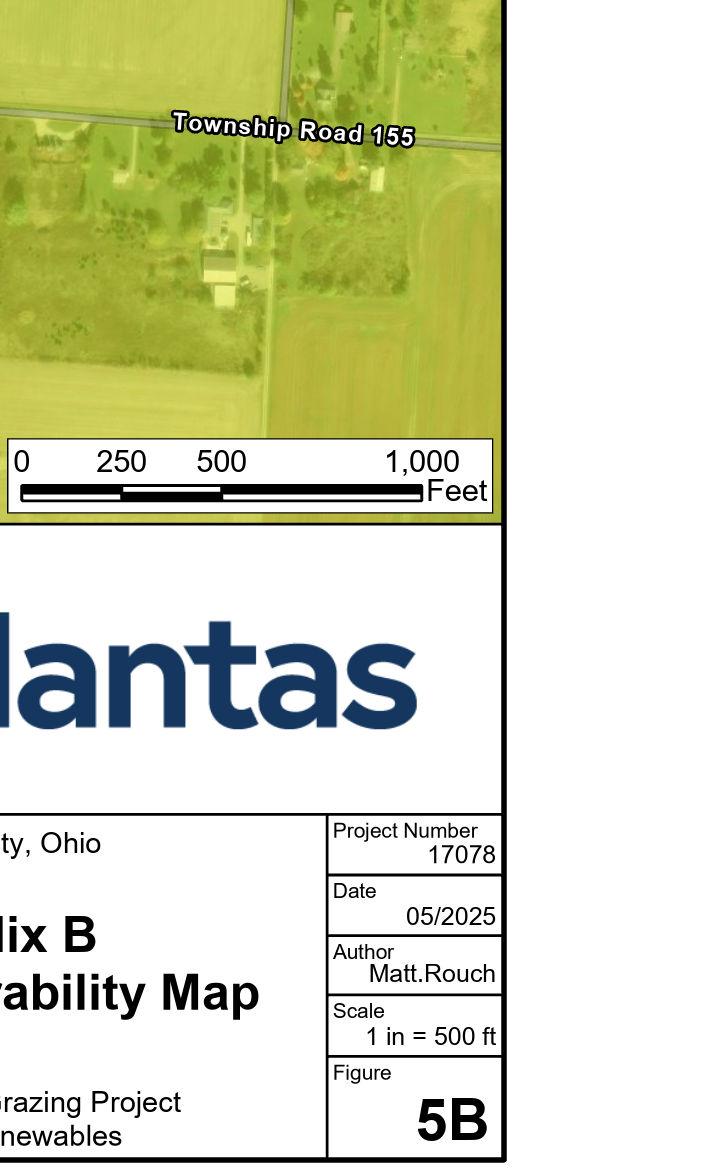
Figure 5 Aquifers and Wells
Figure 6 Soil Types
Figure 7 Underground and Surface Mines
Appendices
Appendix A Preliminary Geotechnical Investigation
Appendix B ODNR Interdepartmental Coordination Letter for the Project Area
Appendix C Water Well Log and Drilling Reports
Appendix D Ohio EPA SWPA
Appendix E Custom Soil Resource Report for Morrow County, Ohio
Appendix F Project Area Reconnaissance Photographs
1. Introduction
This report presents the results of an evaluation of publicly available geologic and hydrogeologic resources along with a preliminary geotechnical evaluation for the proposed Crossroads Solar Grazing Center located in Morrow County, Ohio. In addition, this report includes a Preliminary Geotechnical Investigation Memorandum which is included as Appendix A. This Geology, Hydrogeology, and Preliminary Geotechnical Report (“Report”) has been prepared for the Crossroads Solar Grazing Center (“Crossroads”). Crossroads is proposing to construct a combined utility-scale solar energy and sheep grazing facility in Cardington, Lincoln, and Westfield Townships in Morrow County, Ohio (the “Project” or the “Facility”). The Project will use rows of ground-mounted solar panels to supply up to 94 megawatts AC (MWac) of wholesale power to the existing electric grid while also providing pasture for livestock. All of the Project’s above-ground infrastructure will be located within agricultural-style fences, which also will confine the livestock and protect them from predators. The fenced area will be up to 559 acres (the “Solar& Grazing Area”) of an area totaling approximately 726 acres (the “Project Area”).
1.1 Purpose
The purpose of this Report is to provide the appropriate review and analysis to support the Client’s application to the Ohio Power Siting Board (OPSB) to construct, operate and decommission the Facility. Specifically, except for a preliminary grading plan, the report provides information relevant to the following provisions of Ohio Administrative Code (OAC) 4906-4, OPSB’s rules for applications for electric generation facilities:
OAC 4906-4-08(A)(4)
Water Impacts. A description of relevant information, including:
(a) An evaluation of the potential impact to public and private water supplies due to construction and operation of the proposed facility.
(b) An evaluation of the impact to public and private water supplies due to pollution control equipment failures.
(c) Existing maps of aquifers, water wells, and drinking water source protection areas that may be directly affected by the proposed facility, including, at a minimum, an additional one-mile buffer around the project area.
(d) A description of how construction and operation of the facility will comply with any drinking water source protection plans near the project area.
(e) An analysis of the prospects of floods for the area, including the probability of occurrences and likely consequences of various flood stages, and describe plans to mitigate any likely adverse consequences.
OAC 4906-4-08(A)(5)
Geological features. A map of suitable scale showing the proposed facility, geological features of the proposed facility site, topographic contours, existing oil and gas wells, injection wells, and underground abandoned mines, as well as:
a) A description of the suitability of the site geology and plans to remedy any inadequacies, including proposed mitigation.
b) A description of the suitability of soil for grading, compaction, and drainage, and describe plans to remedy any inadequacies and restore the soils during post-construction reclamation, including providing a preliminary grading plan that estimates maximum graded acreage expectations.
c) A description of the suitability of the soils for foundation construction, and areas with slopes that exceed twelve percent and/or highly erodible soils (according to both the natural resources conservation services and county soil surveys and any other available survey resources representative of the project area) that may be affected by the proposed facility.
d) The results and initial analysis of preliminary test borings and describe plans for additional test borings, including closure plans for such borings, and describe plans for the test borings that contain a timeline for providing the test boring logs and the following information to the board:
(i) Subsurface soil properties
(ii) Static water level
(iii) Rock quality description
(iv) Per cent recovery
(v) Depth and description of bedrock contact
e) A description of coordination with the Ohio department of natural resources on the geological suitability of the project within the proposed site in order to provide a response letter from the department to staff.
OAC 4906-4-09(A)(2)
b) Geological features
(i) Within the application, the applicant shall provide a preliminary geotechnical exploration and evaluation to confirm that there are no issues to preclude development of the facility, including, but not limited to: borings, test pits, and/or subsurface samples at the substation(s), overhead collection line pole locations, and representative samples of the project area.
(ii) Sixty days prior to the preconstruction conference, the applicant shall provide a fully detailed geotechnical exploration and evaluation to confirm that there are no issues to preclude development of the facility.
(iii) The applicant must fill all boreholes, and borehole abandonment must comply with state and local regulations.
For this Report, the following definitions have been used when describing the Project pursuant to the OPSB’s current rules (OAC 4906-1-01):
• Project Area: “all land that contains components of the facility, as well as any real property for which land rights are required to be secured in order to construct and operate the facility” (OAC 4906-1-01 (KK)).
• Facility: “the proposed major utility facility and all associated facilities” (OAC 4901-1-01 (Y)).
• Study Area: is defined by Verdantas to better describe the region outside of the Project Area that was included during database searches of available public information. The Study Area includes Morrow County, specifically portions of Cardington Township, Lincoln
Township, and Westfield Township so as to capture all areas whose physical characteristics could globally impact the Project Area (e.g., floodplains, faults, regional geology).
2. Study Approach
A literature review of readily available geological, hydrogeological and geotechnical documents was performed to develop a general understanding of the suitability of conditions within the Project Area for the construction of the proposed Facility. The information summarized in this report was obtained from available online databases and/or documents maintained or produced by the following federal, state, and local agencies:
1. Federal Emergency Management Agency (FEMA);
2. Ohio Department of Agriculture (ODA);
3. Ohio Department of Natural Resources (ODNR);
4. Ohio Environmental Protection Agency (Ohio EPA);
5. Ohio Department of Transportation District 7 (ODOT);
6. Office of the Logan County Engineer;
7. United States Department of Agriculture (USDA); and
8. United States Geological Survey (USGS).
This study also included a reconnaissance from the public right-of-way at select locations across the Project Area and interviews of certain government agency personnel and landowners A Preliminary Geotechnical Investigation, conducted to obtain information required by OAC 49064-08(A)(5)(d), was completed at the site and is included in Appendix A.
This report is primarily based on desktop reviews of publicly available information, no environmental studies or structural evaluations were performed as part of the scope of work for this Report, and therefore no information relative to environmental or structural considerations is included in or inferred from this Report.
3. Project Location
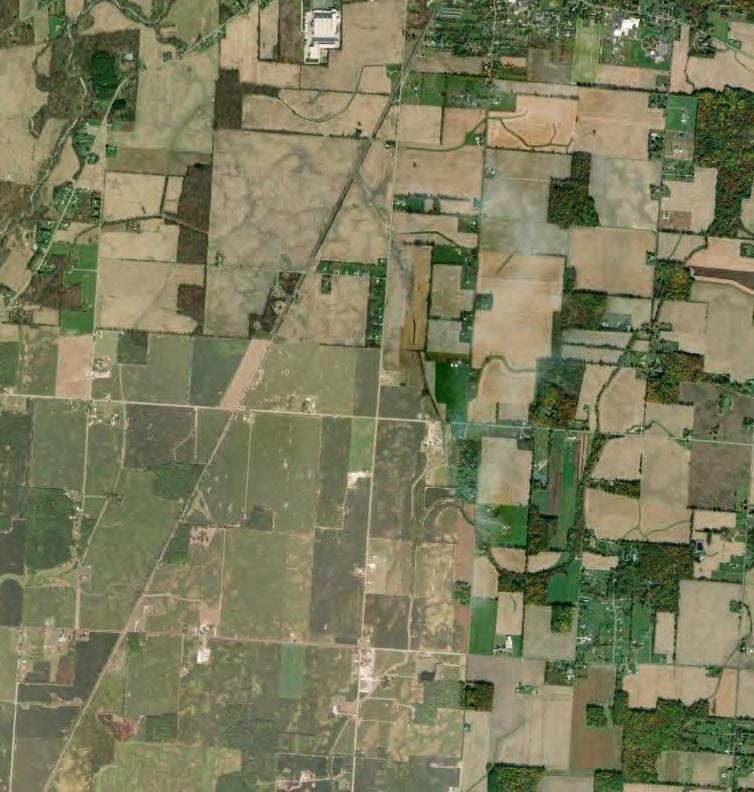
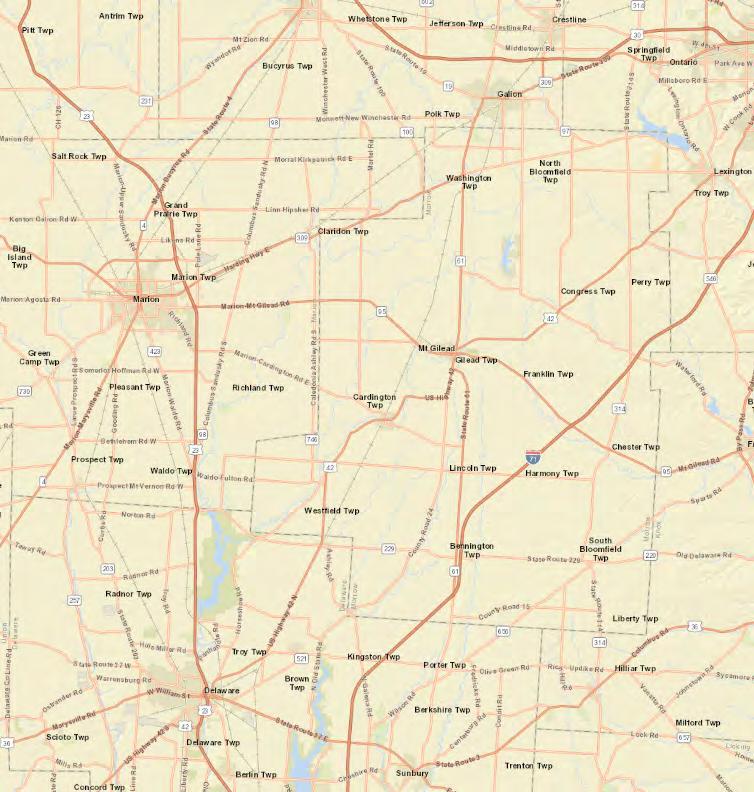
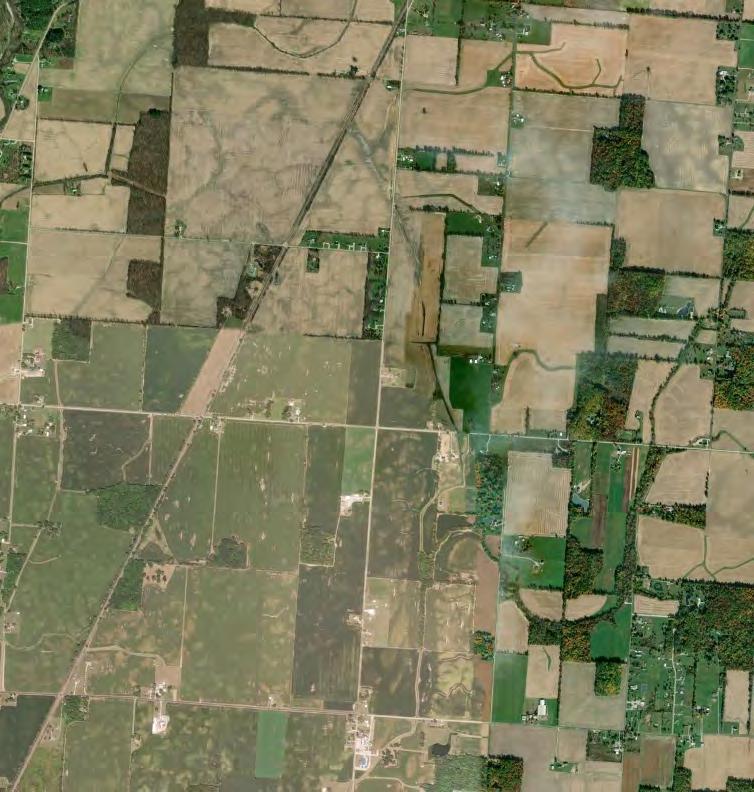
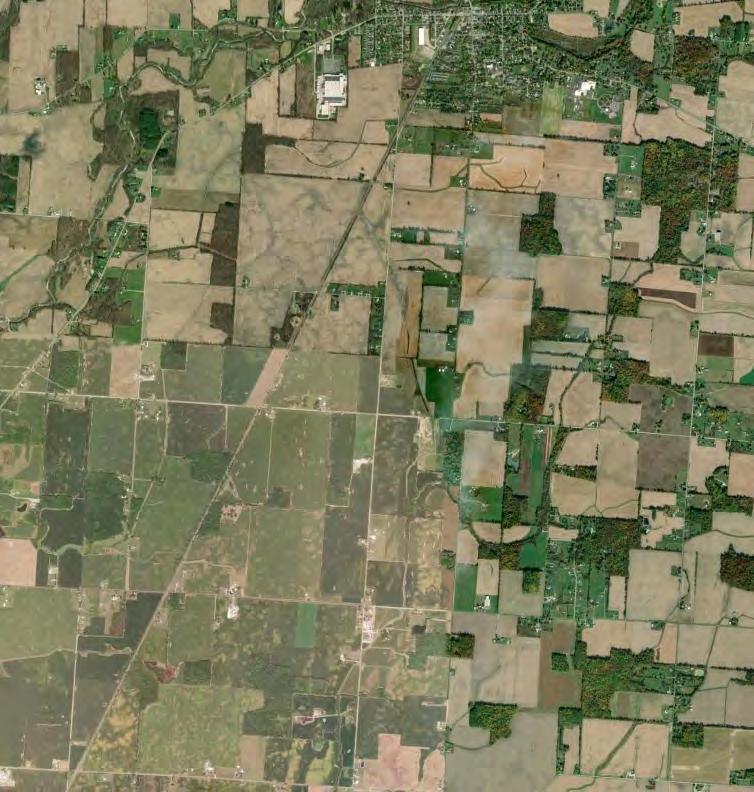
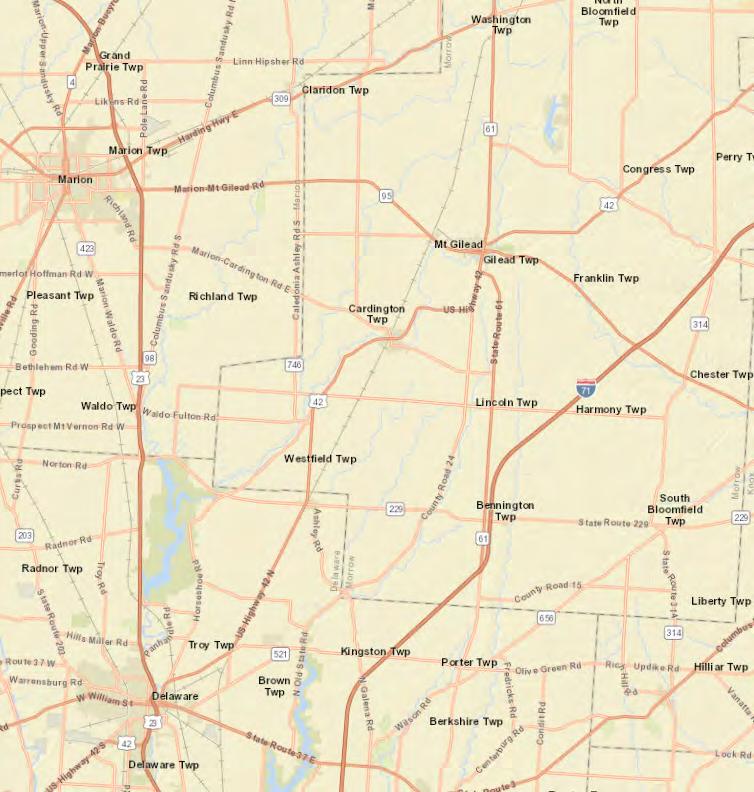
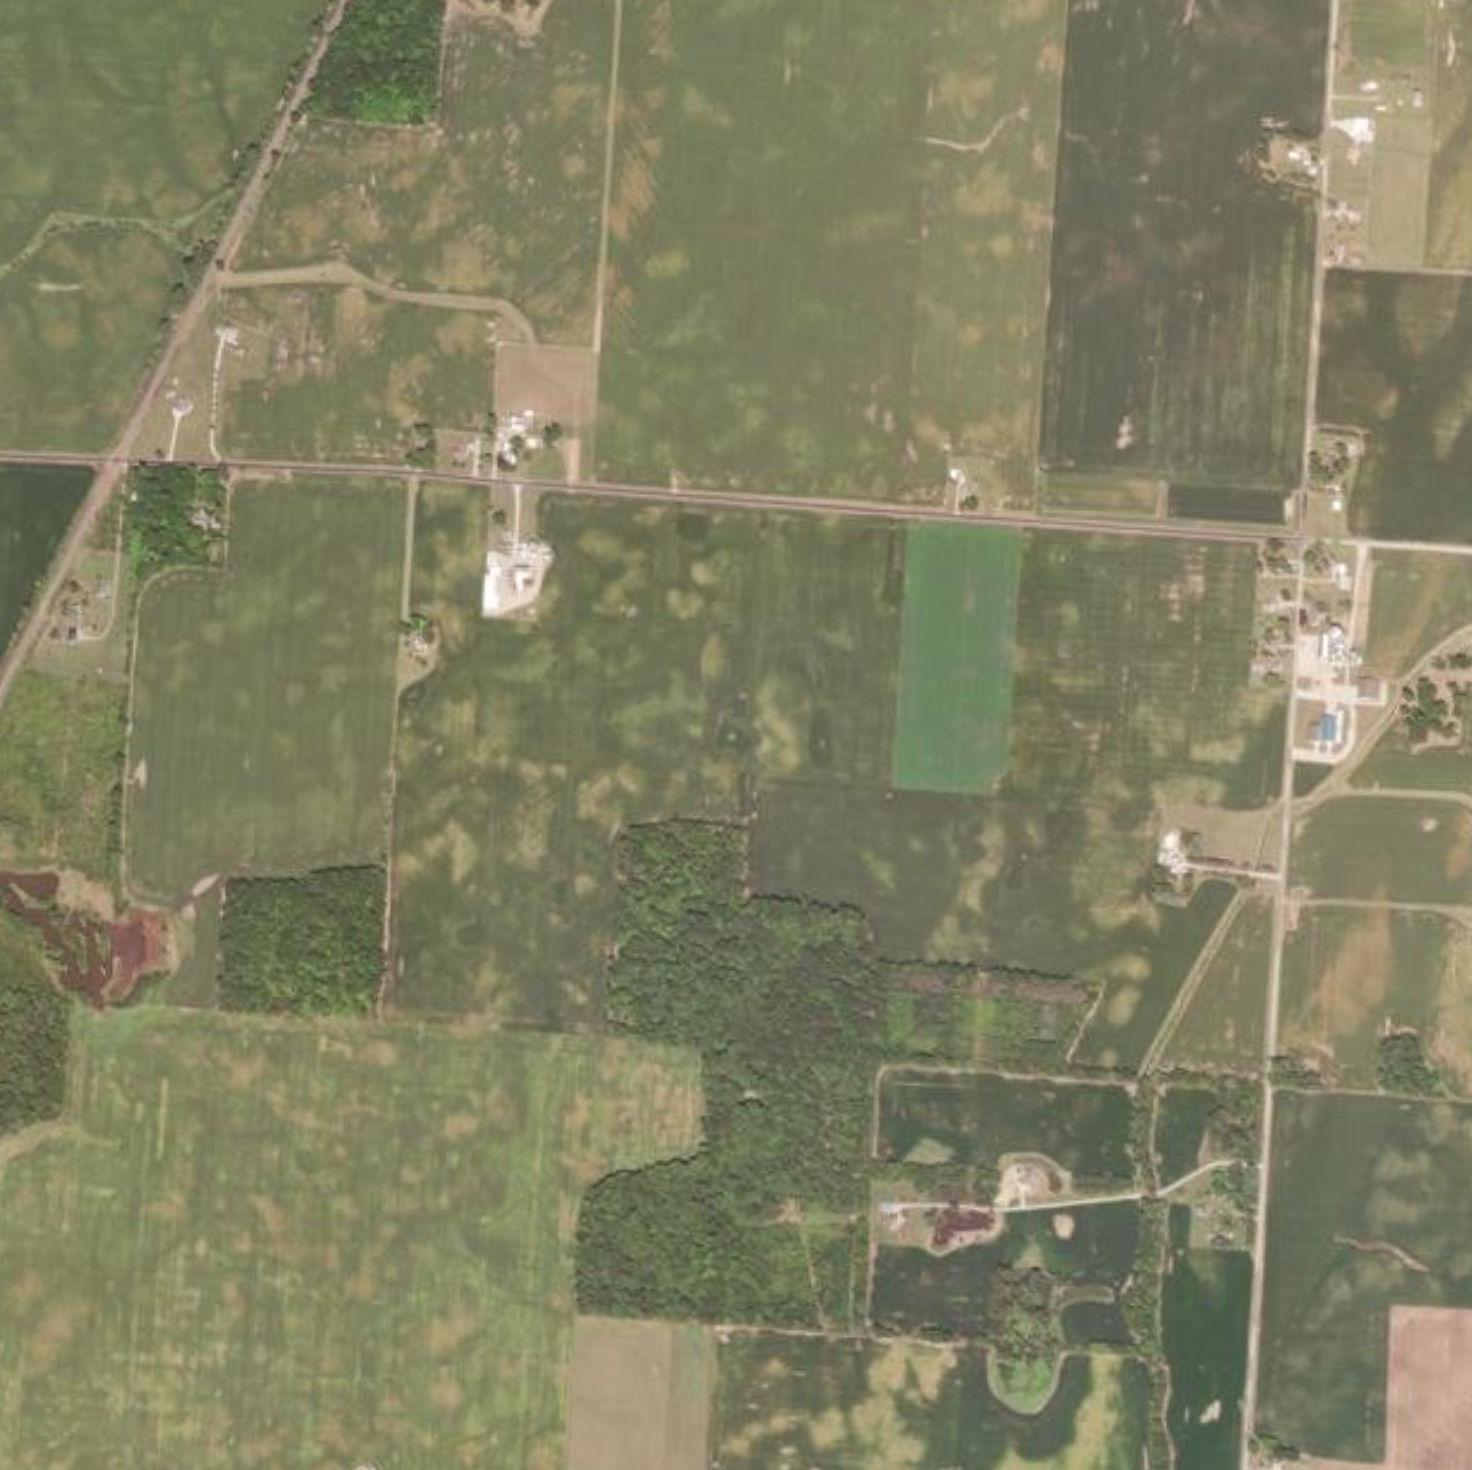
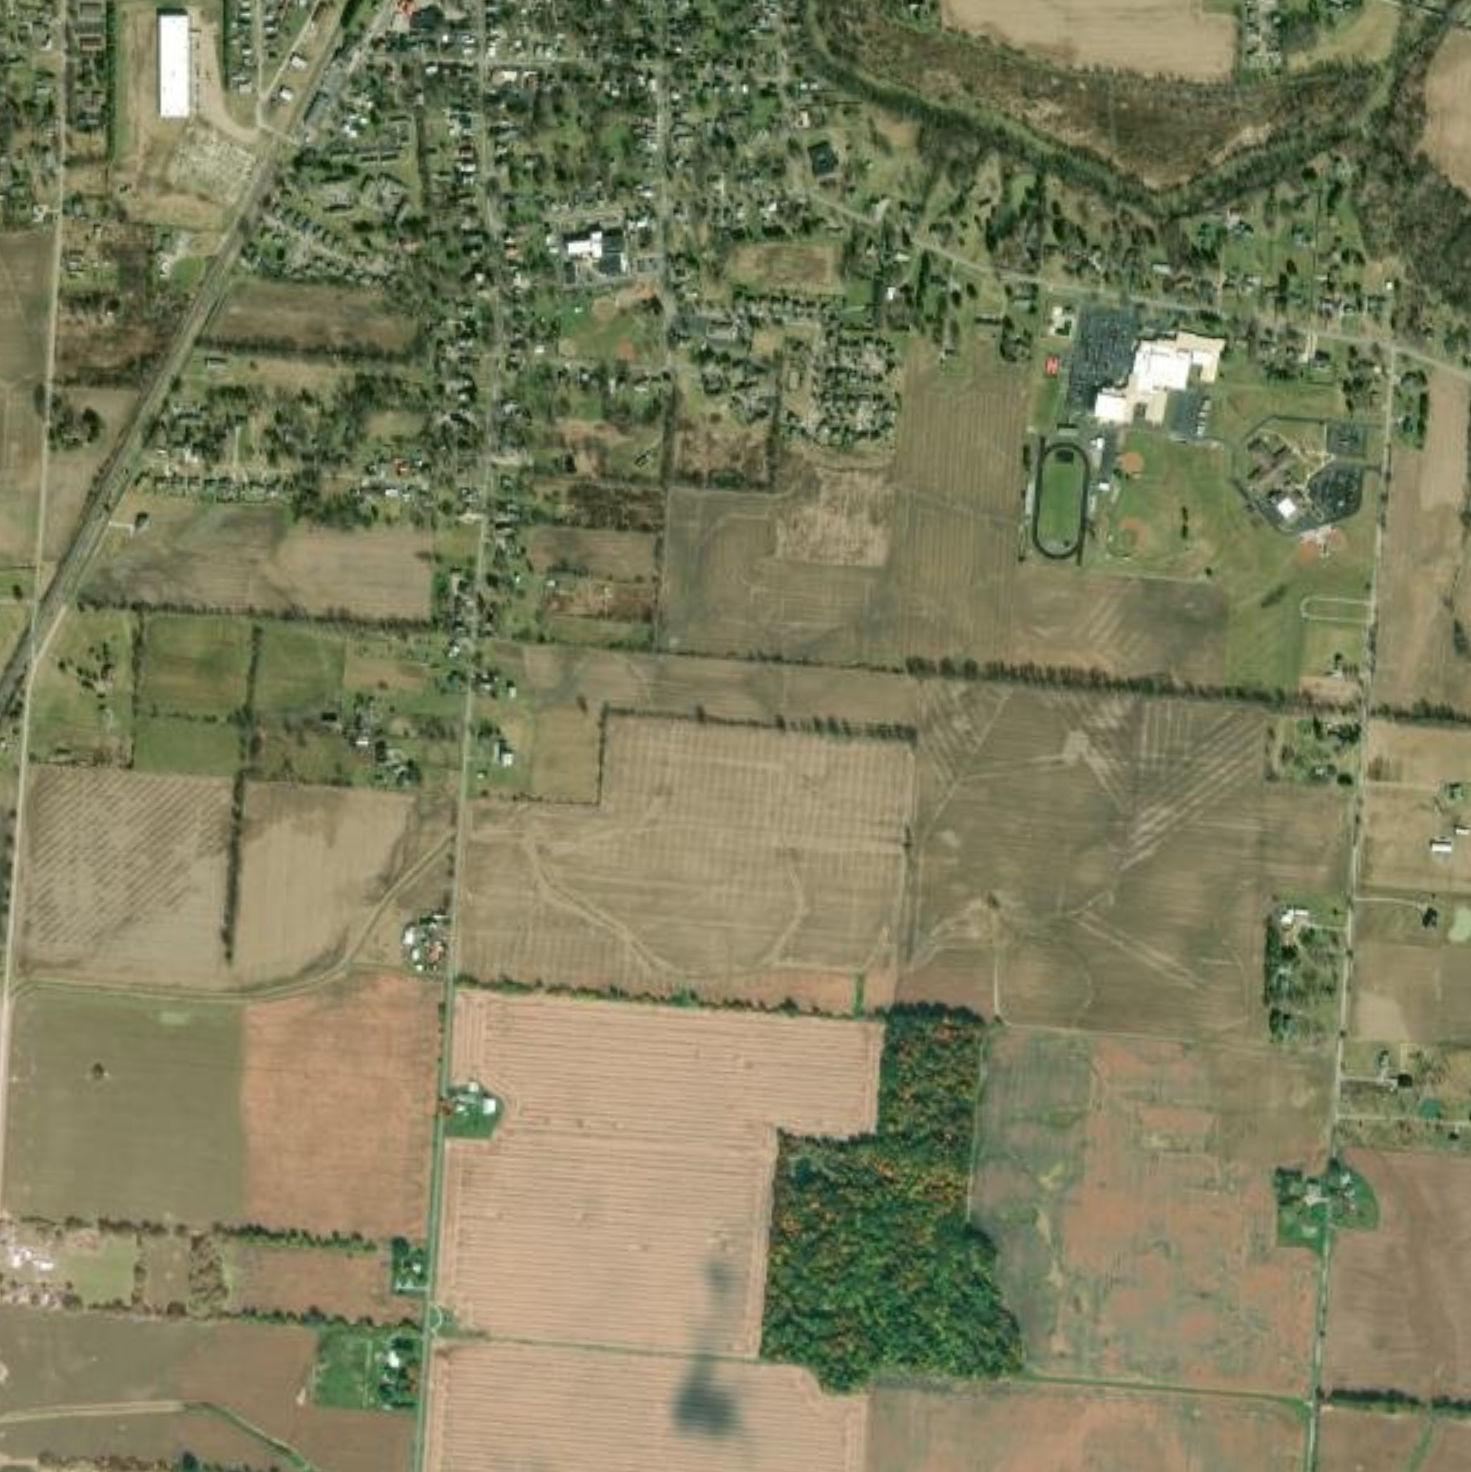
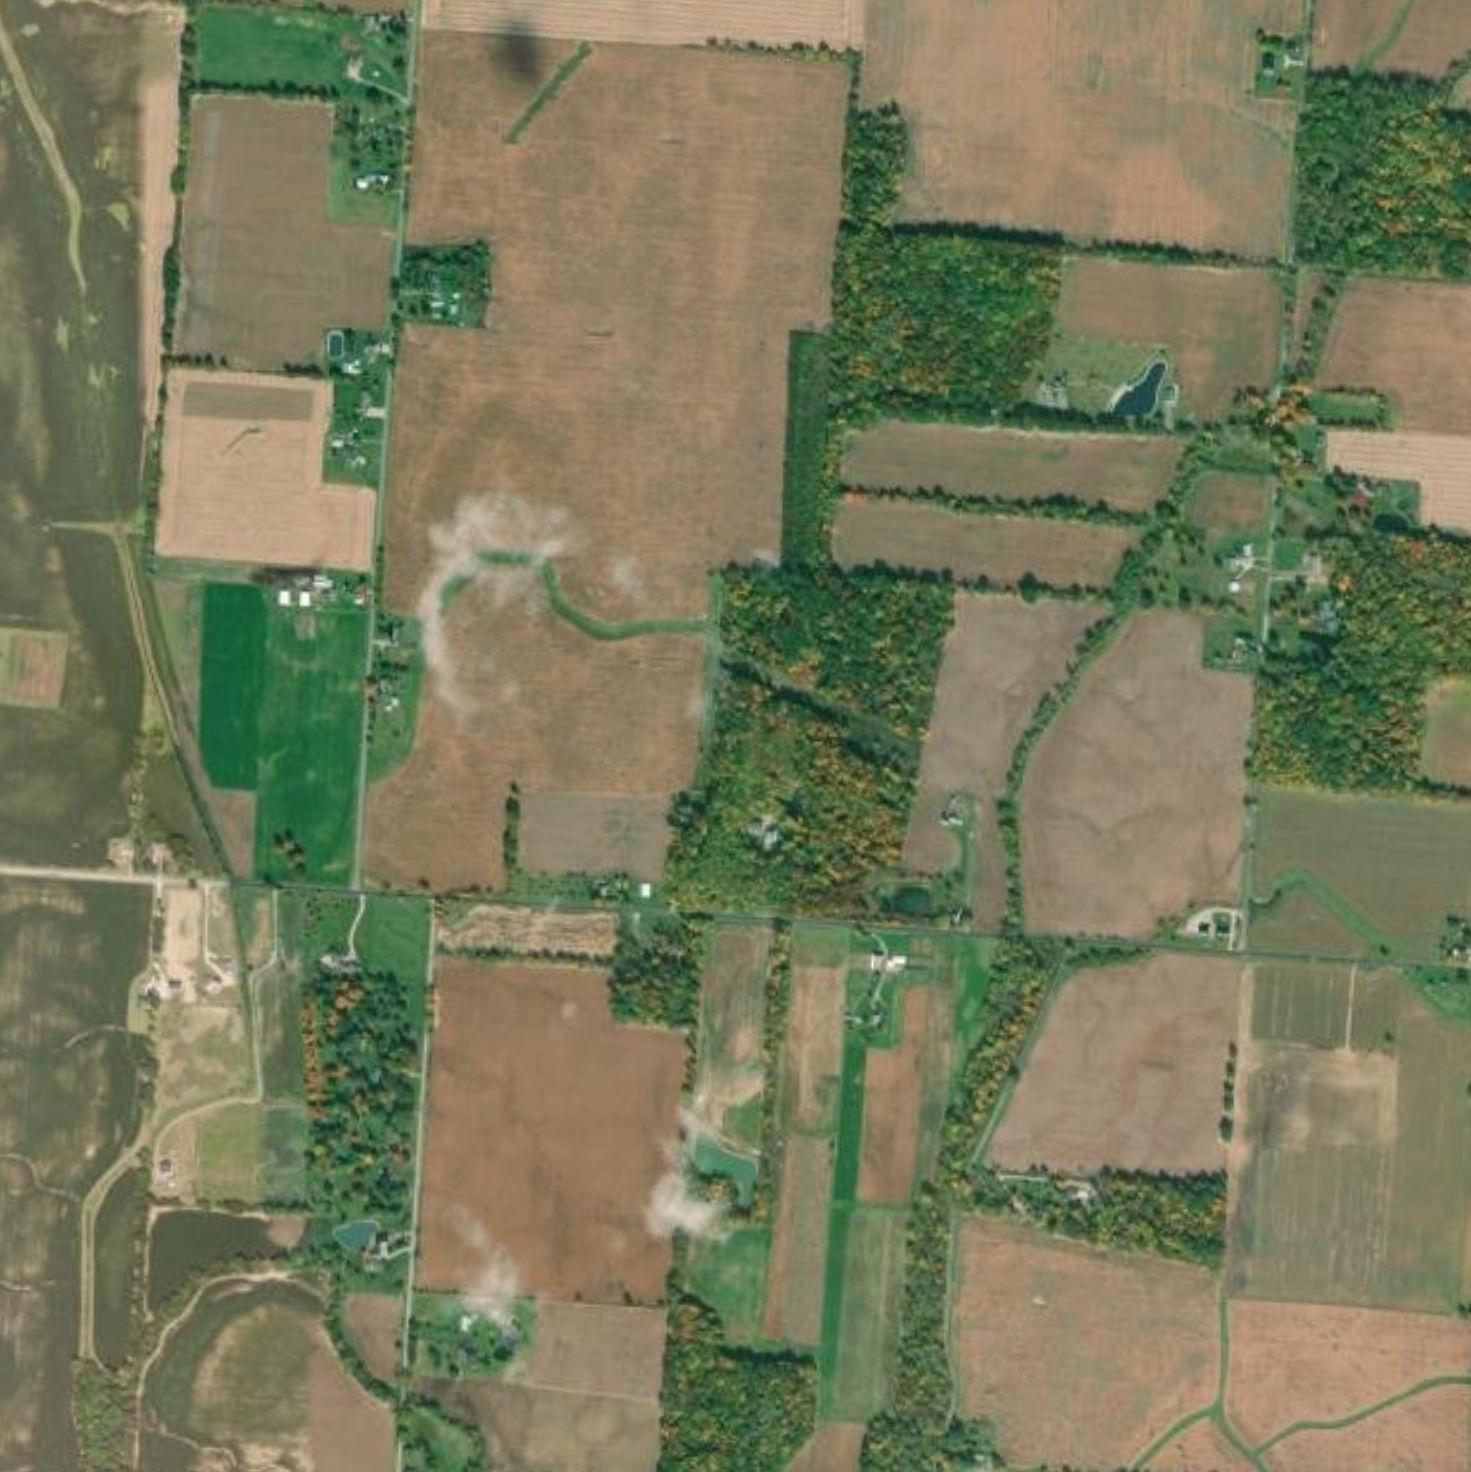
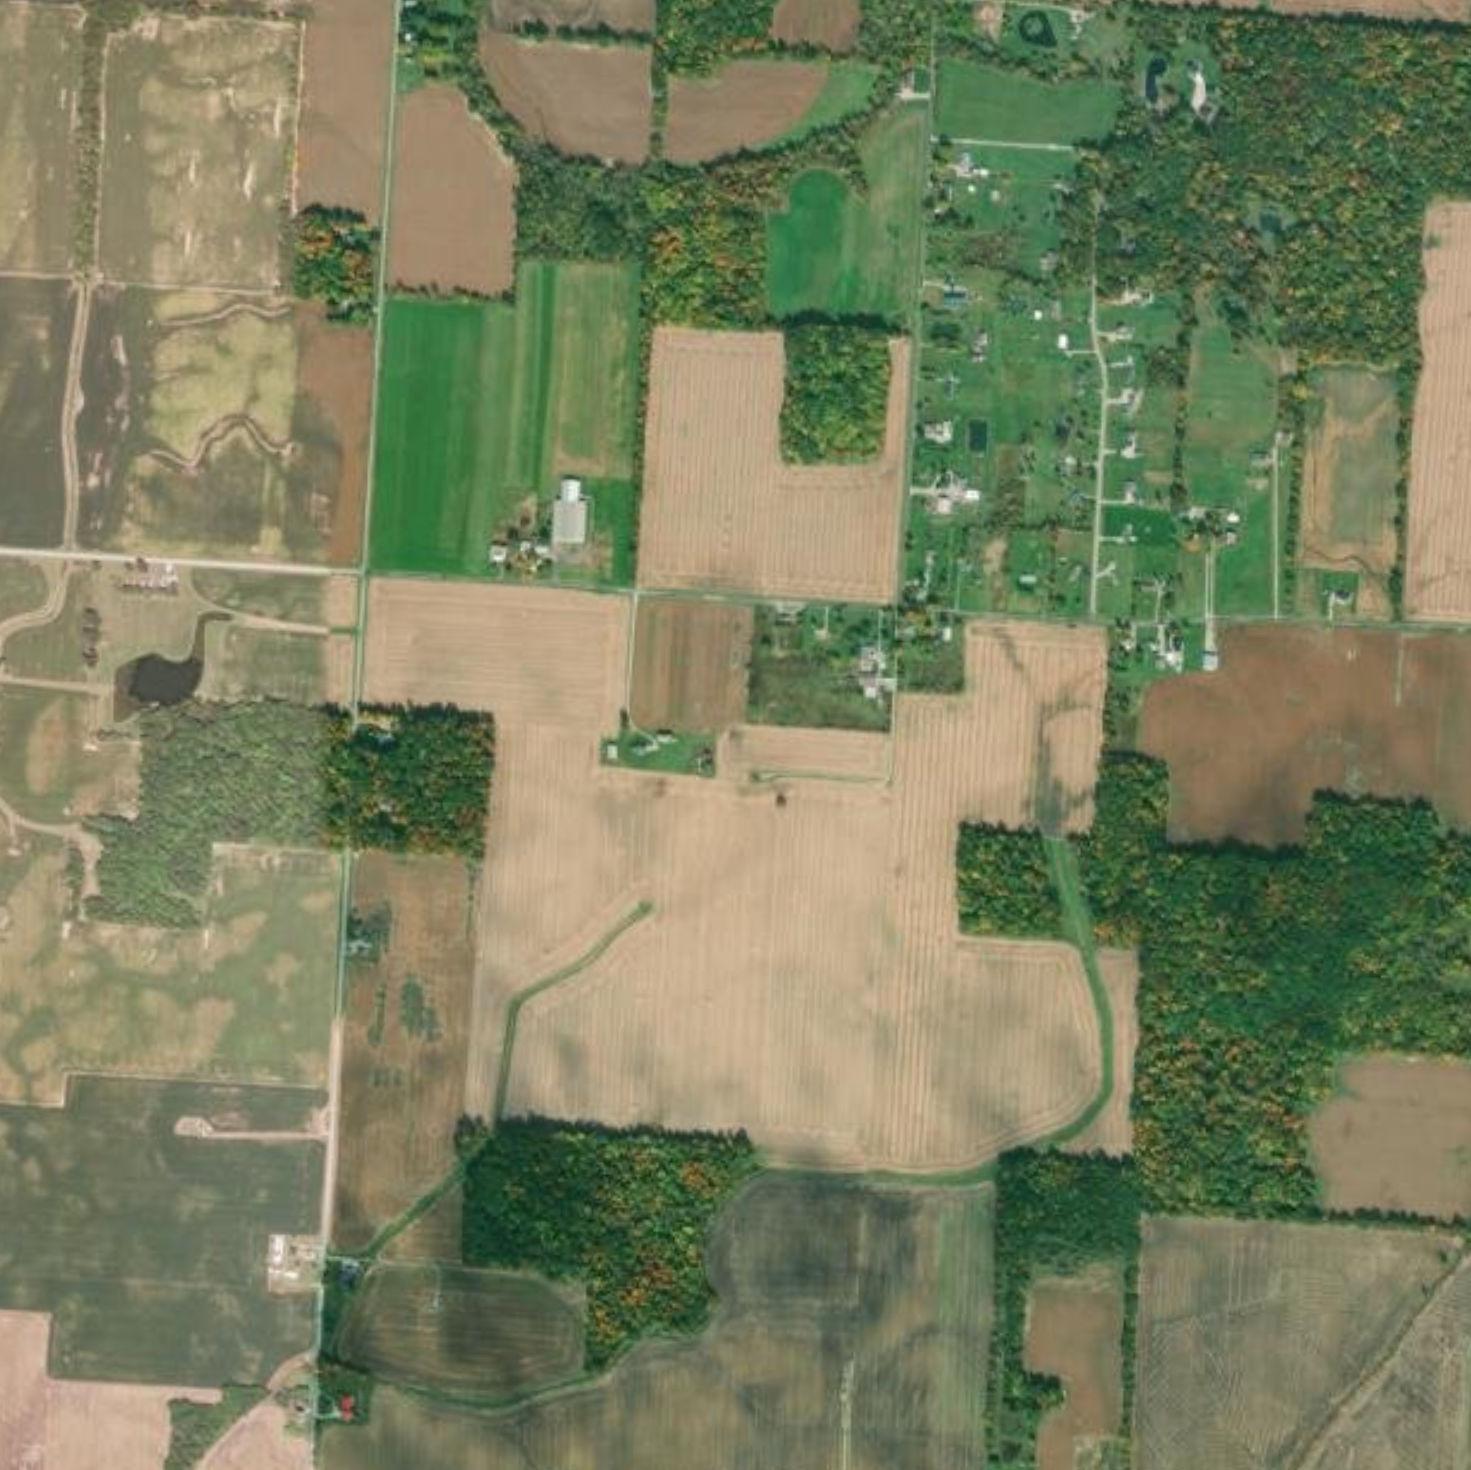
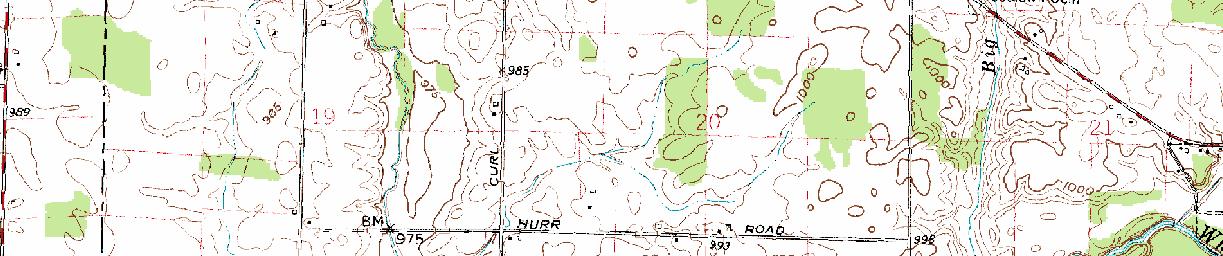
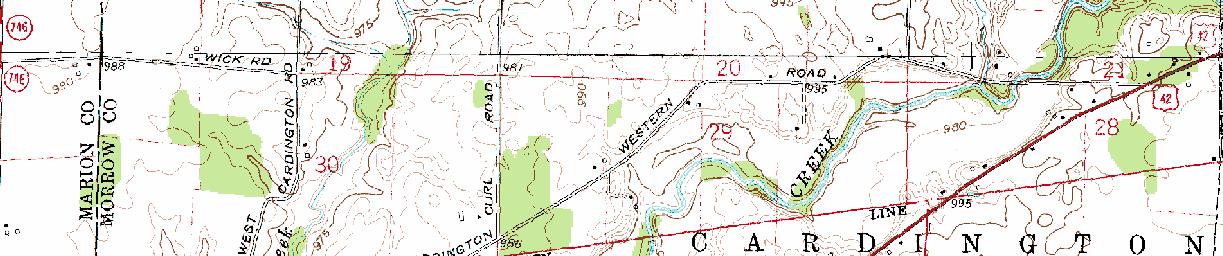
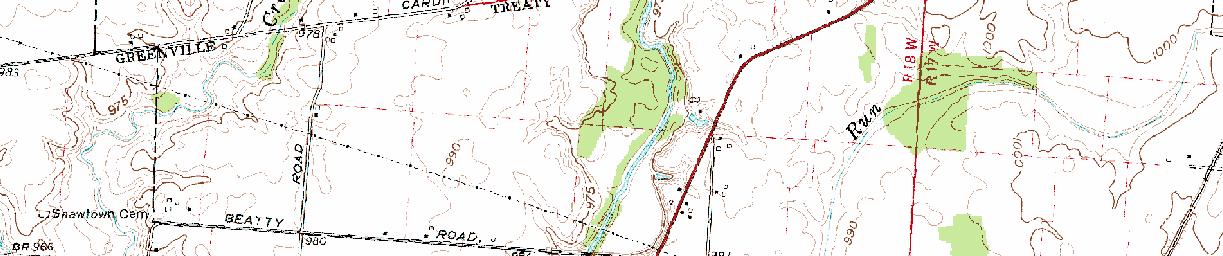
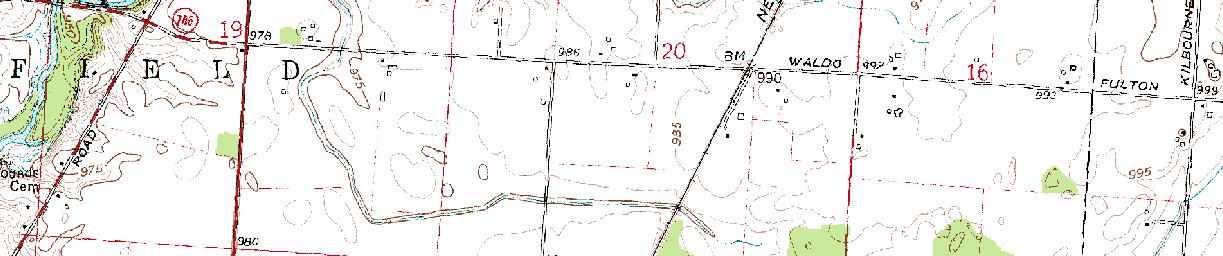
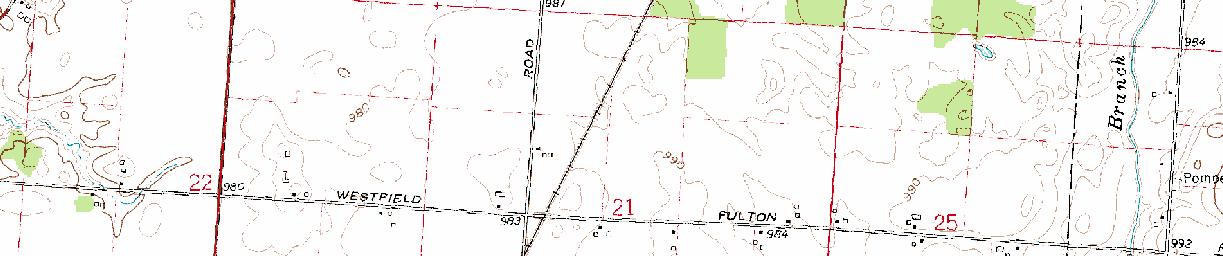
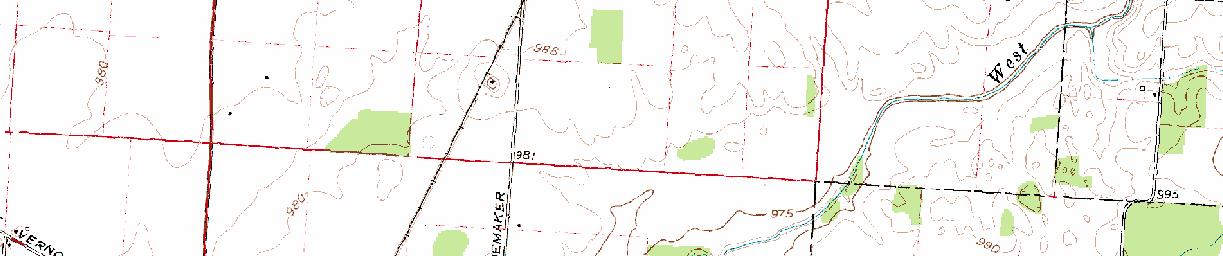
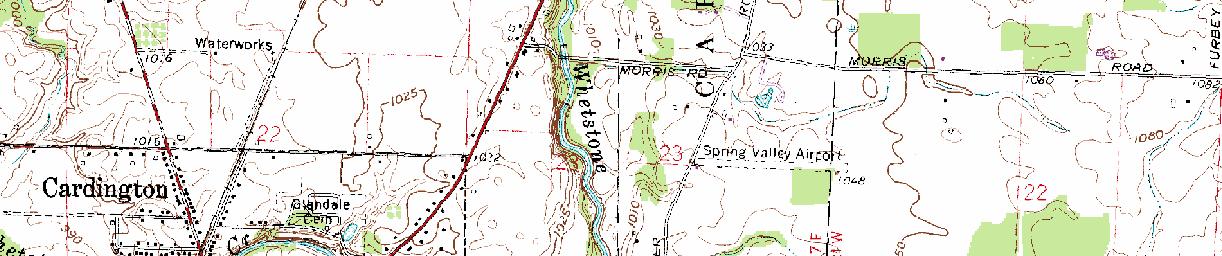
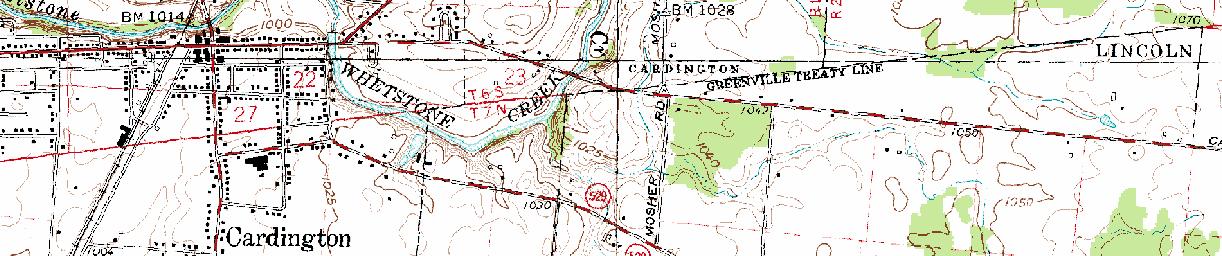
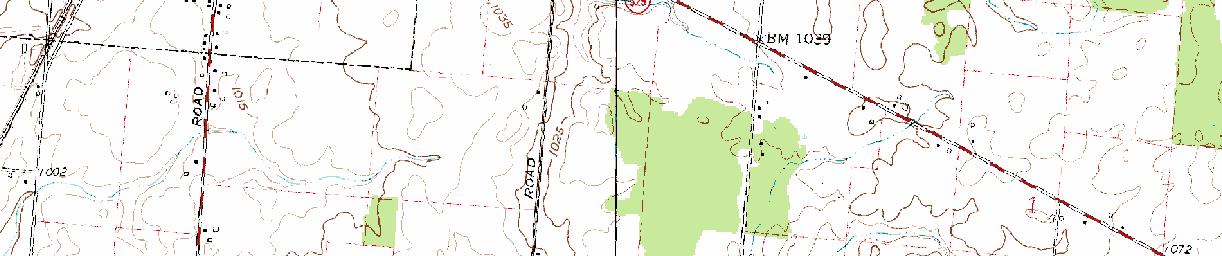
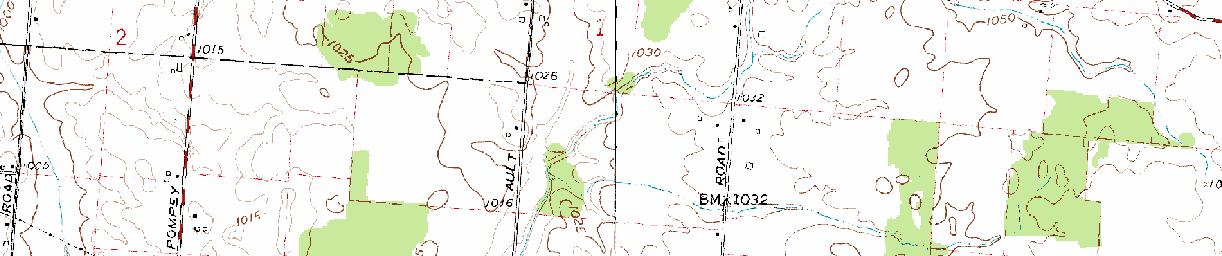
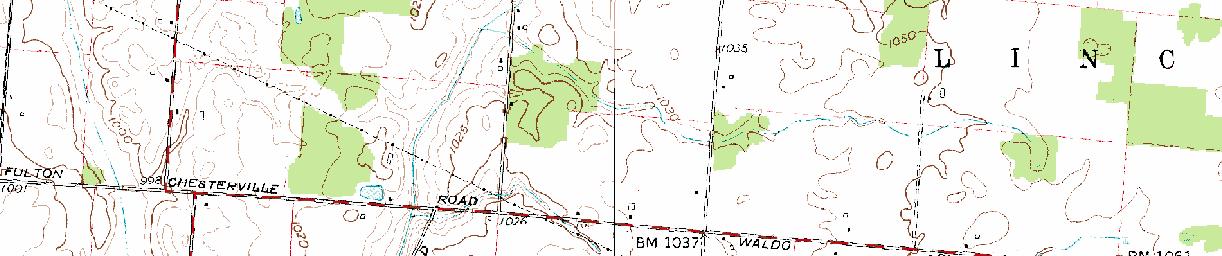
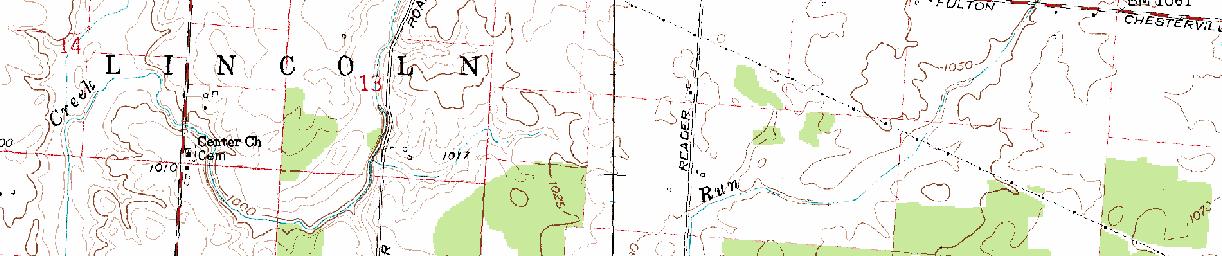
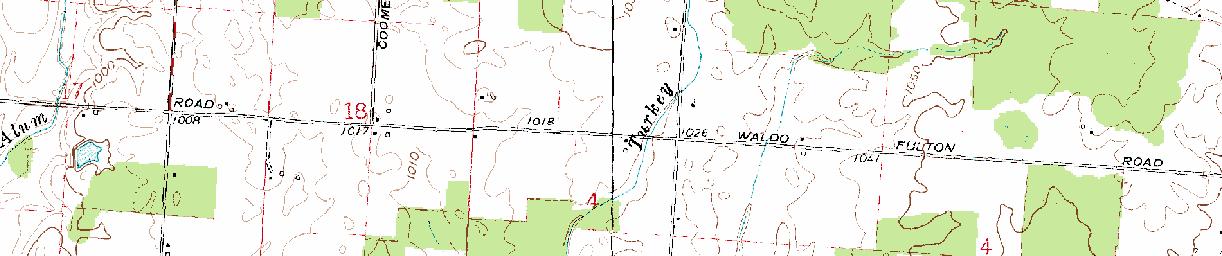
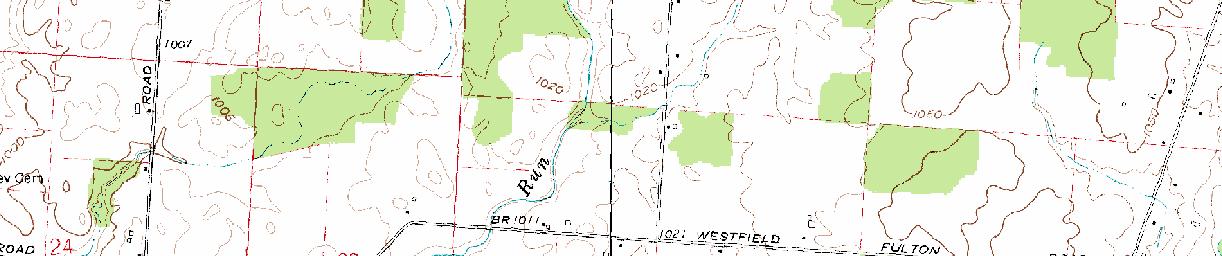
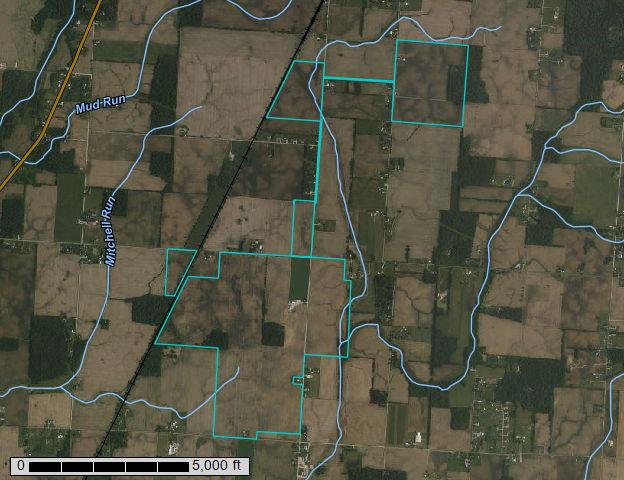
The Project Area comprises approximately 726 acres of rural property in Cardington, Lincoln, and Westfield Townships, approximately one mile south of Cardington, Ohio in the southwest portion of Morrow County, Ohio. The Project Area is shown on Figure 1 and subsequent figures presented in this Report.
4. Desktop Information Review and Analysis
The following provides a summary of the information reviewed and its applicability to the proposed Project In addition to on-line reviews of readily available information maintained by the various agencies, Verdantas obtained comments regarding the Project Area from various departments within ODNR. Comments provided by ODNR in March 2024 regarding the regional geology, groundwater resources, geologic hazards, and other pertinent information are incorporated where appropriate in the sections that follow. A copy of the comment letter from ODNR is included as Appendix B. 1
4.1 Regional Geology
The Study Area is near the mapped transition between two Physiographic Provinces of Ohio; the Central Ohio Clayey Till Plain in the west and the Galion Glaciated Low Plateau to the east (Ohio Division of Geologic Survey, 1998). The Study Area lies within the Central Ohio Clayey Till Plain. The distinguishing characteristics of the Central Ohio Clayey Till Plain include a surface of highlime Wisconsinan age clayey till with well-defined moraines with intervening flat-lying ground moraine and intermorainal lake basins. There are no mapped boulder belts There are also about a dozen silt-, clay- and till-filled lake basins with few large streams and limited sand and gravel outwash. Elevations within the Central Ohio Clayey Till Plain range from approximately 700 to 1150 feet above mean seal level (msl) with moderate relief of 100 feet (Ohio Division of Geological Survey, 1998).
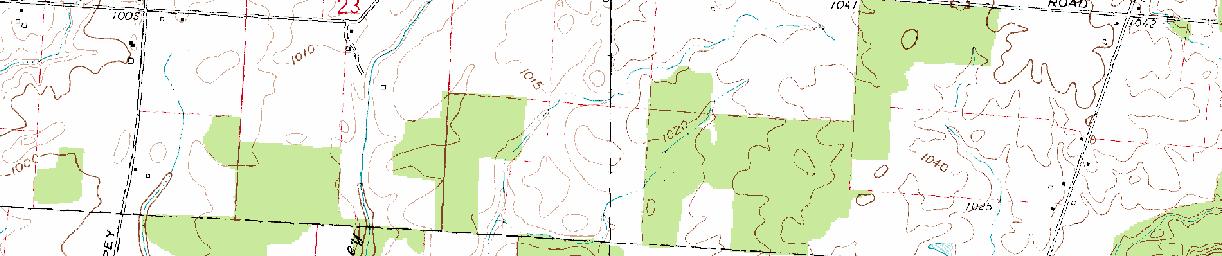
The surface topography within the Project Area is largely the result of the Wisconsinan-age icedeposited ground moraine and hummocky moraine. The moraines were deposited when the entire ice sheet receded and much of the ground-up rock material still held in the melting ice was deposited on the surface (Ohio Division of Geological Survey, 2005). The narrow linear patterns of thick drift in western and central Ohio, are the result of deep incisions in the underlying limestone and dolomite bedrock by a large northwest-flowing drainage system (Ohio Division of Geological Survey, Shaded Drift-Thickness Map, Revised 2017). Surface elevations within the Project Area, as shown on Figure 1, are approximately 990 to 1,025 feet above msl with an average elevation of 1,008 feet above msl (ODNR Web, 2024a).
The predominant uppermost bedrock unit within the Project Area, as shown on Figure 1, consists of the Devonian-age Ohio Shale (map unit Doh). The unit consists of shale, siltstone, and some sandstone. These bedrock units are mainly shades of brownish black to greenish gray, and weather to brown (Ohio Division of Geological Survey, 2006).
1 It should be noted that the comments provided by ODNR were based on the Project Area footprint at the time of the request. Due to the reduced acreage in the Project Area since the time of the original request, the references to well numbers, both oil and gas or water, within the ODNR comment letter may not precisely match those provided within the following sections. A summary of the survey counts for private water supply wells and oil and gas wells are included in Table B1 in Appendix B. The discrepancies are not considered to be substantial and do not negatively impact the ability to determine that the Facility can be developed while protecting local resources and the environment.
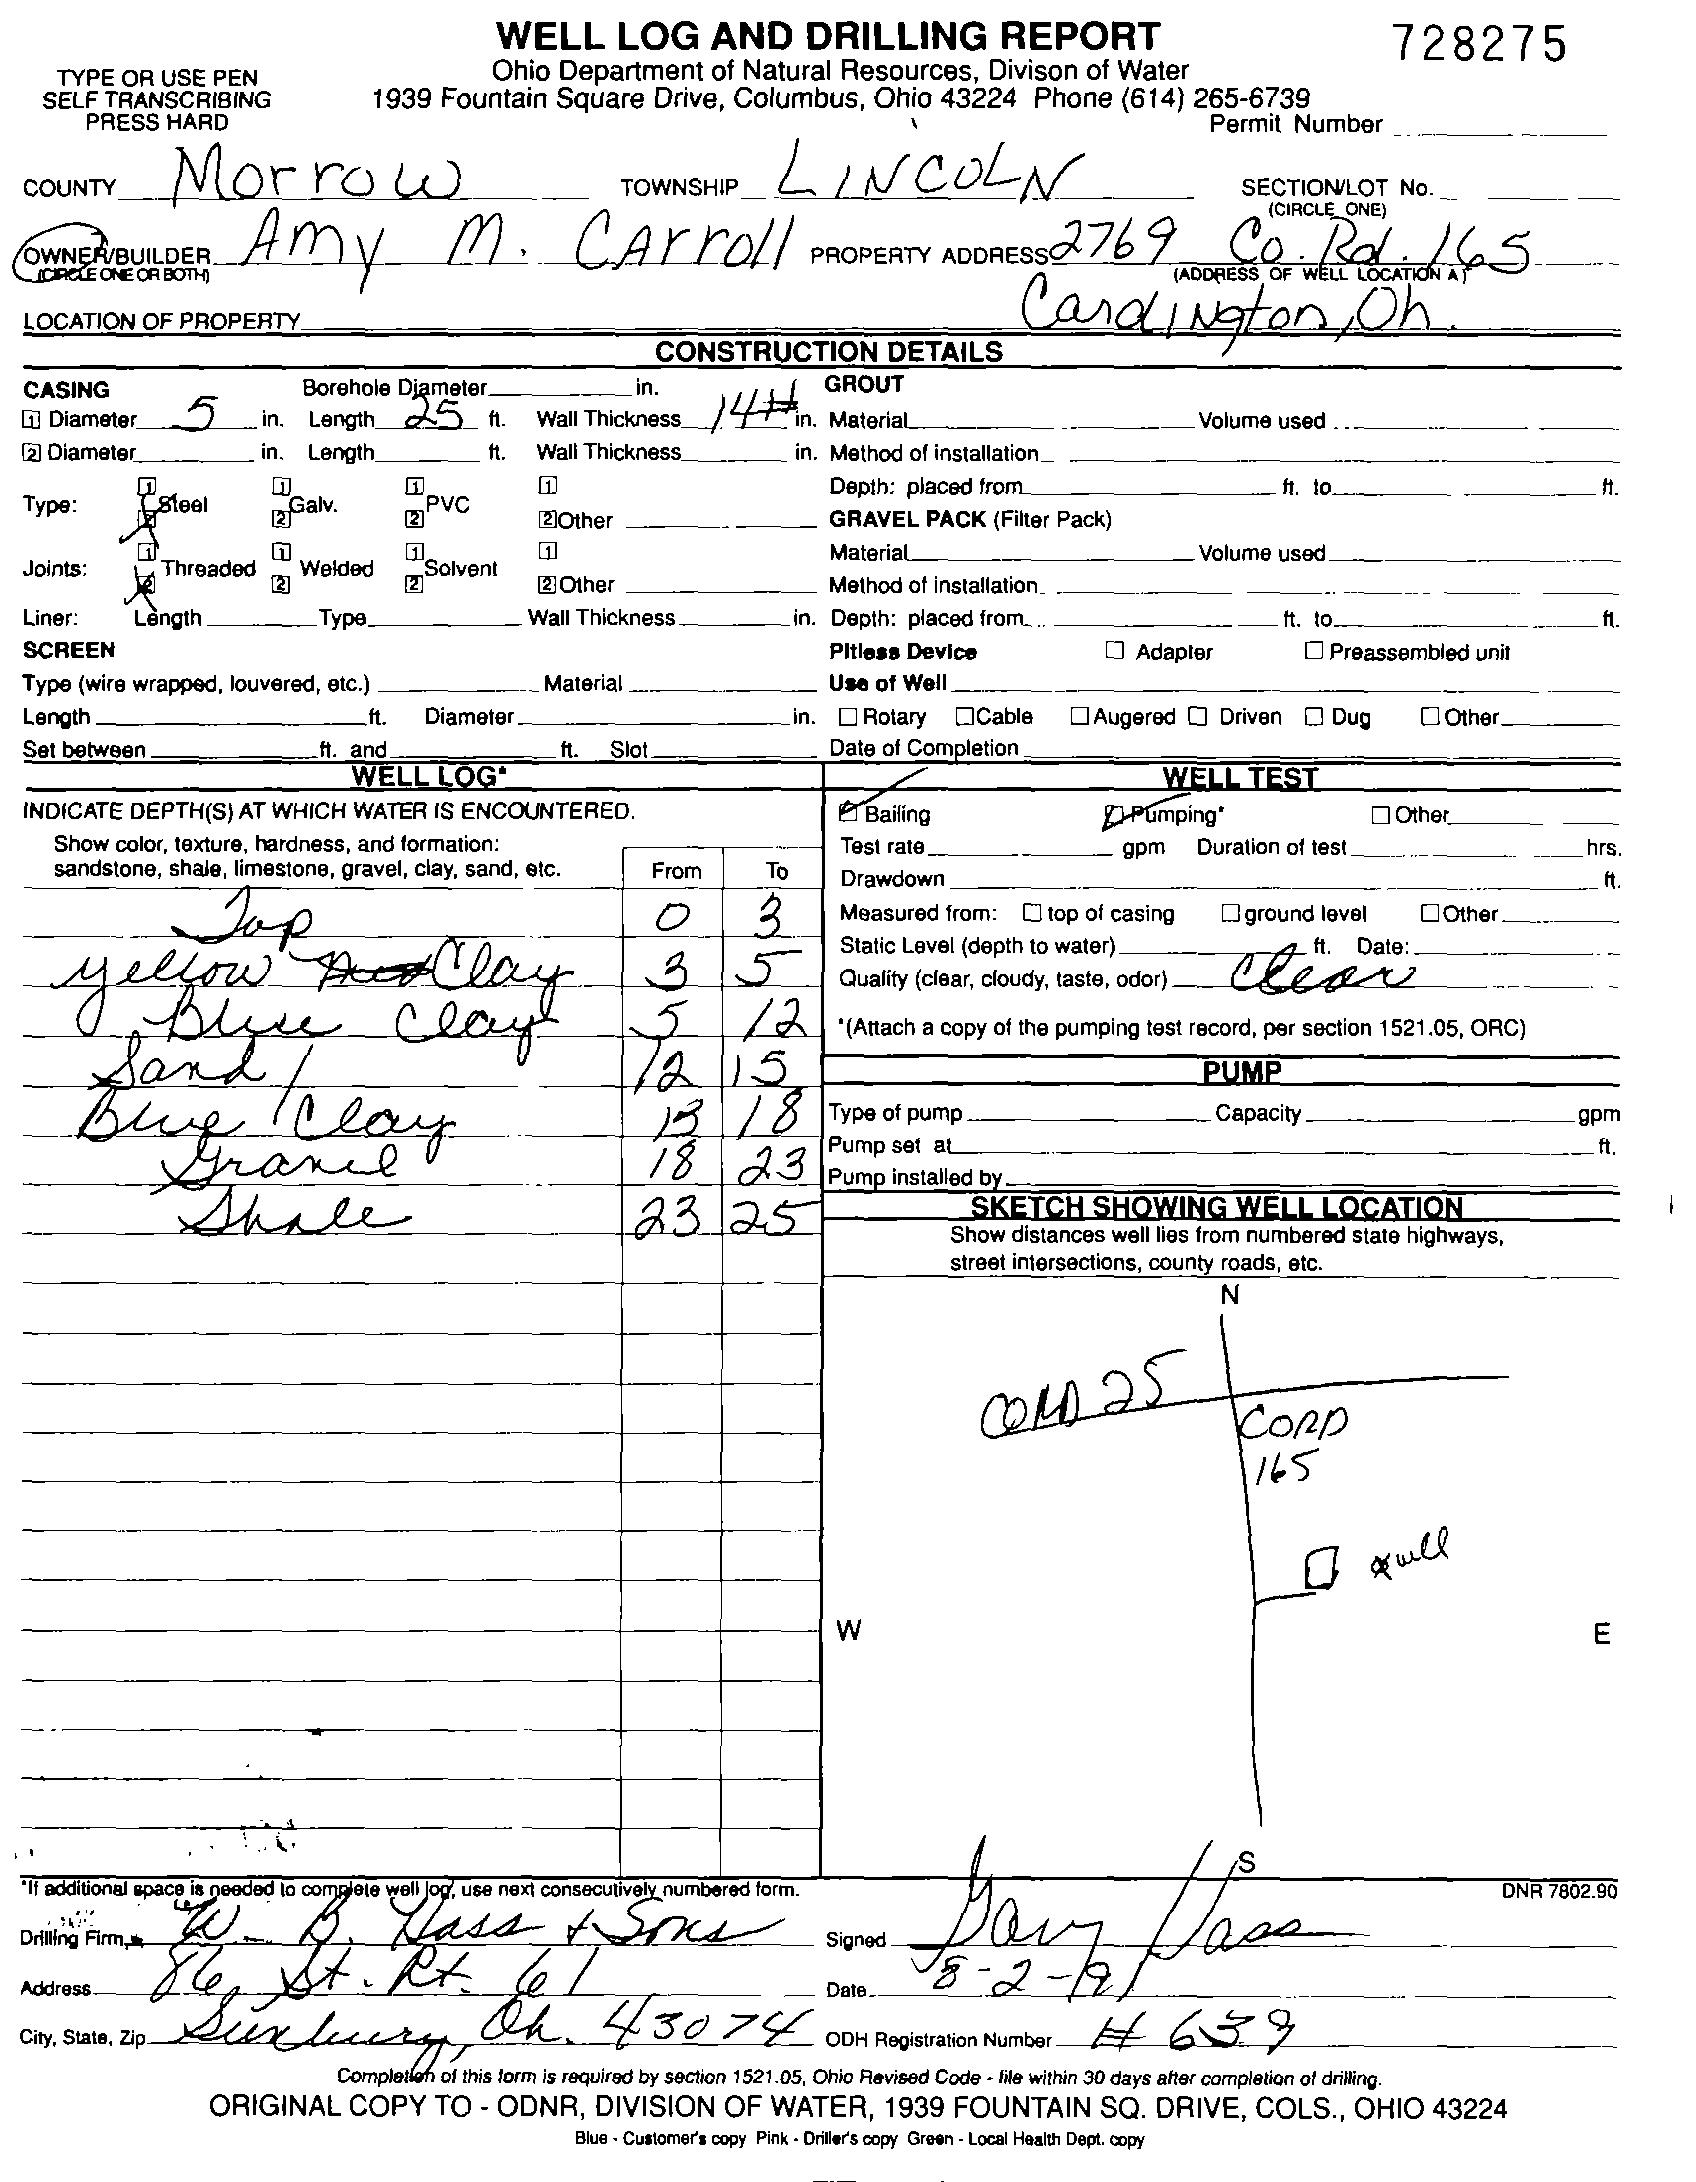
The mapped bedrock topographic surface is shown on Figure 1 (Ohio Georeferenced Information Program, 2018). Bedrock in the region is of relatively variable elevation. The top of bedrock occurs between approximately 975 feet to 1,000 feet msl in the northeastern and central portions of the Project Area and slopes to approximately 925 to 950 feet above msl in the southwestern portion. Two ODNR well log records were located within the Project Area (Appendix C). One well 728275 was installed within the bedrock and indicates bedrock was encountered at 23 feet below ground surface (bgs). Information for depth to bedrock shown on the Ground-Water Resources of Morrow County (Kostelnick, 1981) indicates that bedrock was encountered at depths less than 30 feet bgs in the Study Area.
4.2 Karst Topography
Information obtained from ODNR, Division of Geological Survey, was reviewed for karst topography within or near the Project Area. Based upon this information, there are no verified or suspected karst areas identified within the Project Area. The nearest mapped karst features are located approximately 12 miles west of the Project Area in northern Delaware County (ODNR Web, 2024a). Based on the nature of the glacial drift thickness, underlying shale bedrock and the lack of mapped karst features in the Project Area, karst is not anticipated to impact the Project. The ODNR letter included in Appendix B confirms that there is no record of any sinkholes within 5 miles of the Project Area
4.3 Seismicity
Structural features (e.g. faults, folds) and earthquake epicenters within the Study Area are shown on Figure 2. A review of the geologic and seismic information indicated that no historical earthquake epicenters are mapped within the Project Area. The nearest seismic event occurred in 2010 and included a magnitude 1.5 earthquake located in Crawford County, Ohio, with an epicenter located approximately 17 miles northwest of the Project Area (ODNR Web, 2024a). The ODNR letter included in Appendix B indicates that there is no record of earthquakes within 15 miles of the Project Area.
There is a mapped fault located approximately 8 miles to the south of the Project Area. This is noted as an Unnamed fault along Consortium for Continental Reflection Profiling seismic lines. The mapped fault is Precambrian in age with a contour elevation of 3,000 feet below msl. This would indicate that the mapped Precambrian fault is approximately 4,000 feet below the surface.
The design of the Facility is expected to follow the Ohio Building Code (OBC) which has provisions for earthquake design data. Based on the proposed construction of the Facility, a seismic event poses a minimal hazard/risk to the constructability and operation of the Project.
4.4 Hydrology and Hydrogeology
The Project Area is located within the Upper Scioto River Watershed and within the West Branch Alum Creek and Claypool Run-Whetstone Creek sub-watersheds. Verdantas completed a surface water delineation of the Project Area. Surface waters and wetland features delineated in the Project Area are depicted in Figure 3. Verdantas delineated the streams and wetlands in the Project Area. Surface water flow is generally eastward towards the West Branch Alum Creek. Refer to the surface water delineation report, provided under separate cover, for additional information pertaining to wetlands and waterbodies.
There are no FEMA-mapped 100-year floodplains within the Project Area (Figure 4) A 100-year floodplain is an area where the occurrence of an extreme hydrologic event resulting in a flood is
expected at a 100-year recurrence interval (i.e., a flood of that magnitude has a 1 percent probability of exceedance in any given year). All areas within the Project Area are designated by FEMA as Zone X, an Area of Minimal Flood Hazard. Therefore, construction of the Facility should have minimal impact on the surface drainage in the Project Area. Conversely, there should be minimal impact to the Facility as a result of surface water flow in the Project Area.
4.5 Groundwater Resources
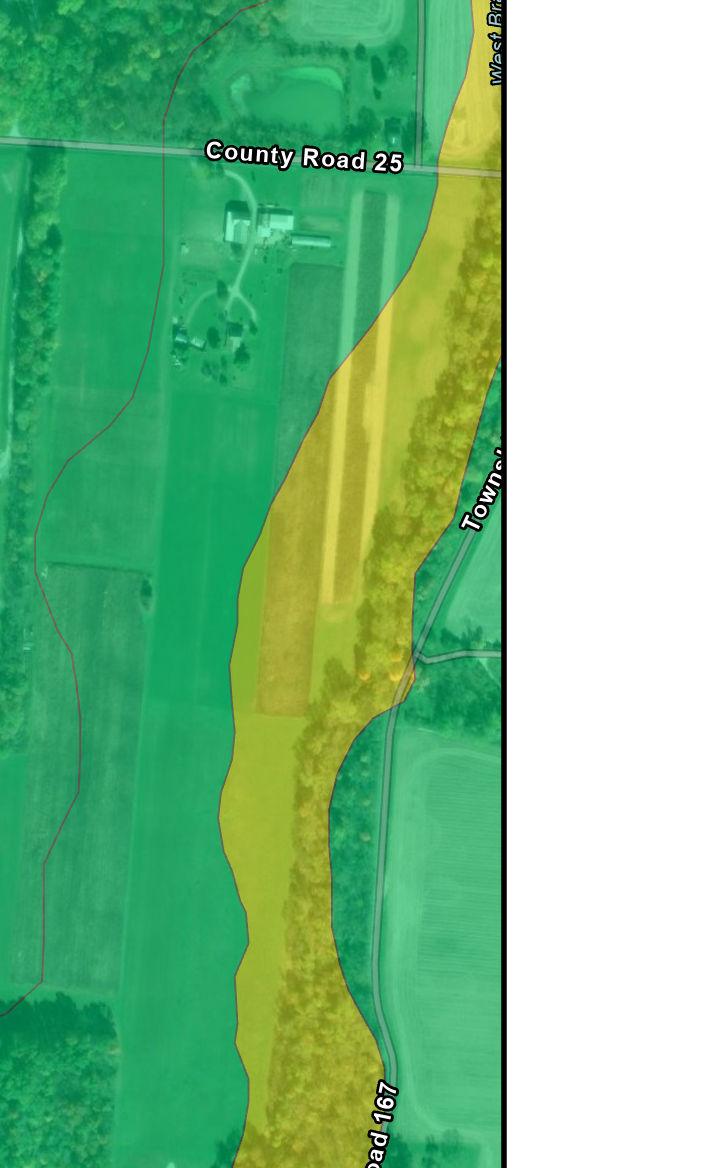
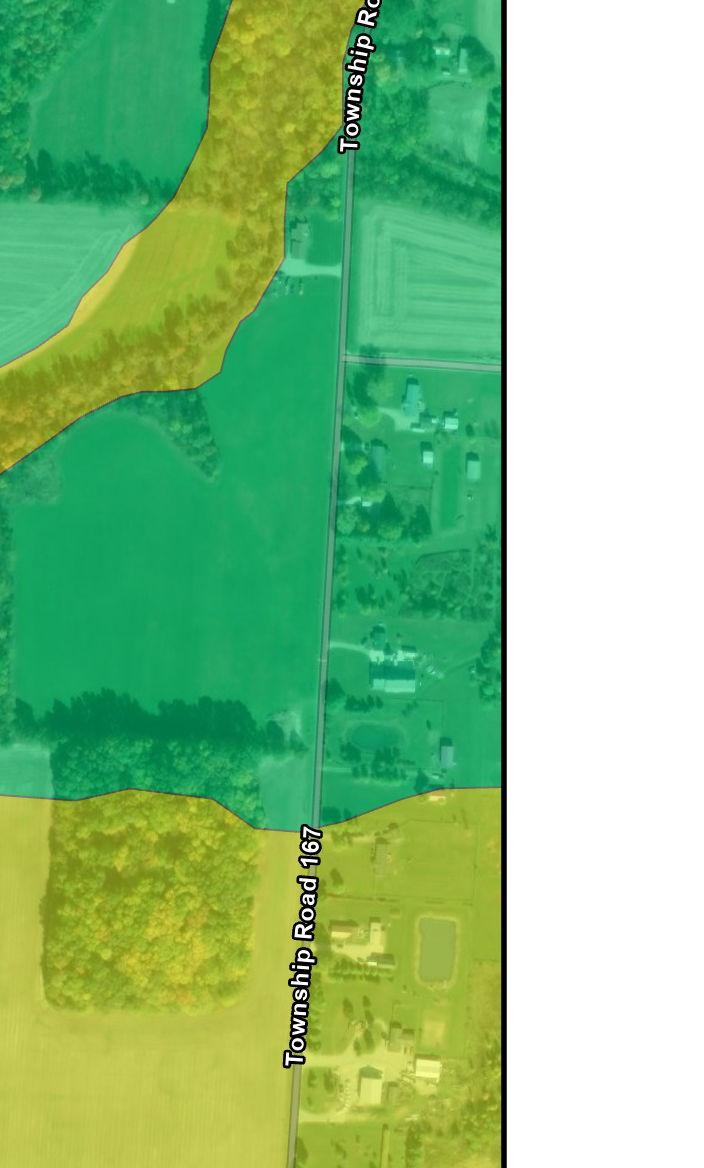
Information obtained from the ODNR Ohio Geology Interactive Map indicates the localized unconsolidated groundwater aquifer within the Project Area is the Powell End Moraine Aquifer (Figure 5). According to the Ground-Water Resources of Morrow County, the principal aquifer in the Project Area the Devonian-Age Ohio Shale. Wells installed from 26 to 50 feet bgs within the shale reportedly yield between 0 and 2 gallons per minute (gpm) following development. This is described as a poor groundwater area where dry holes are common.
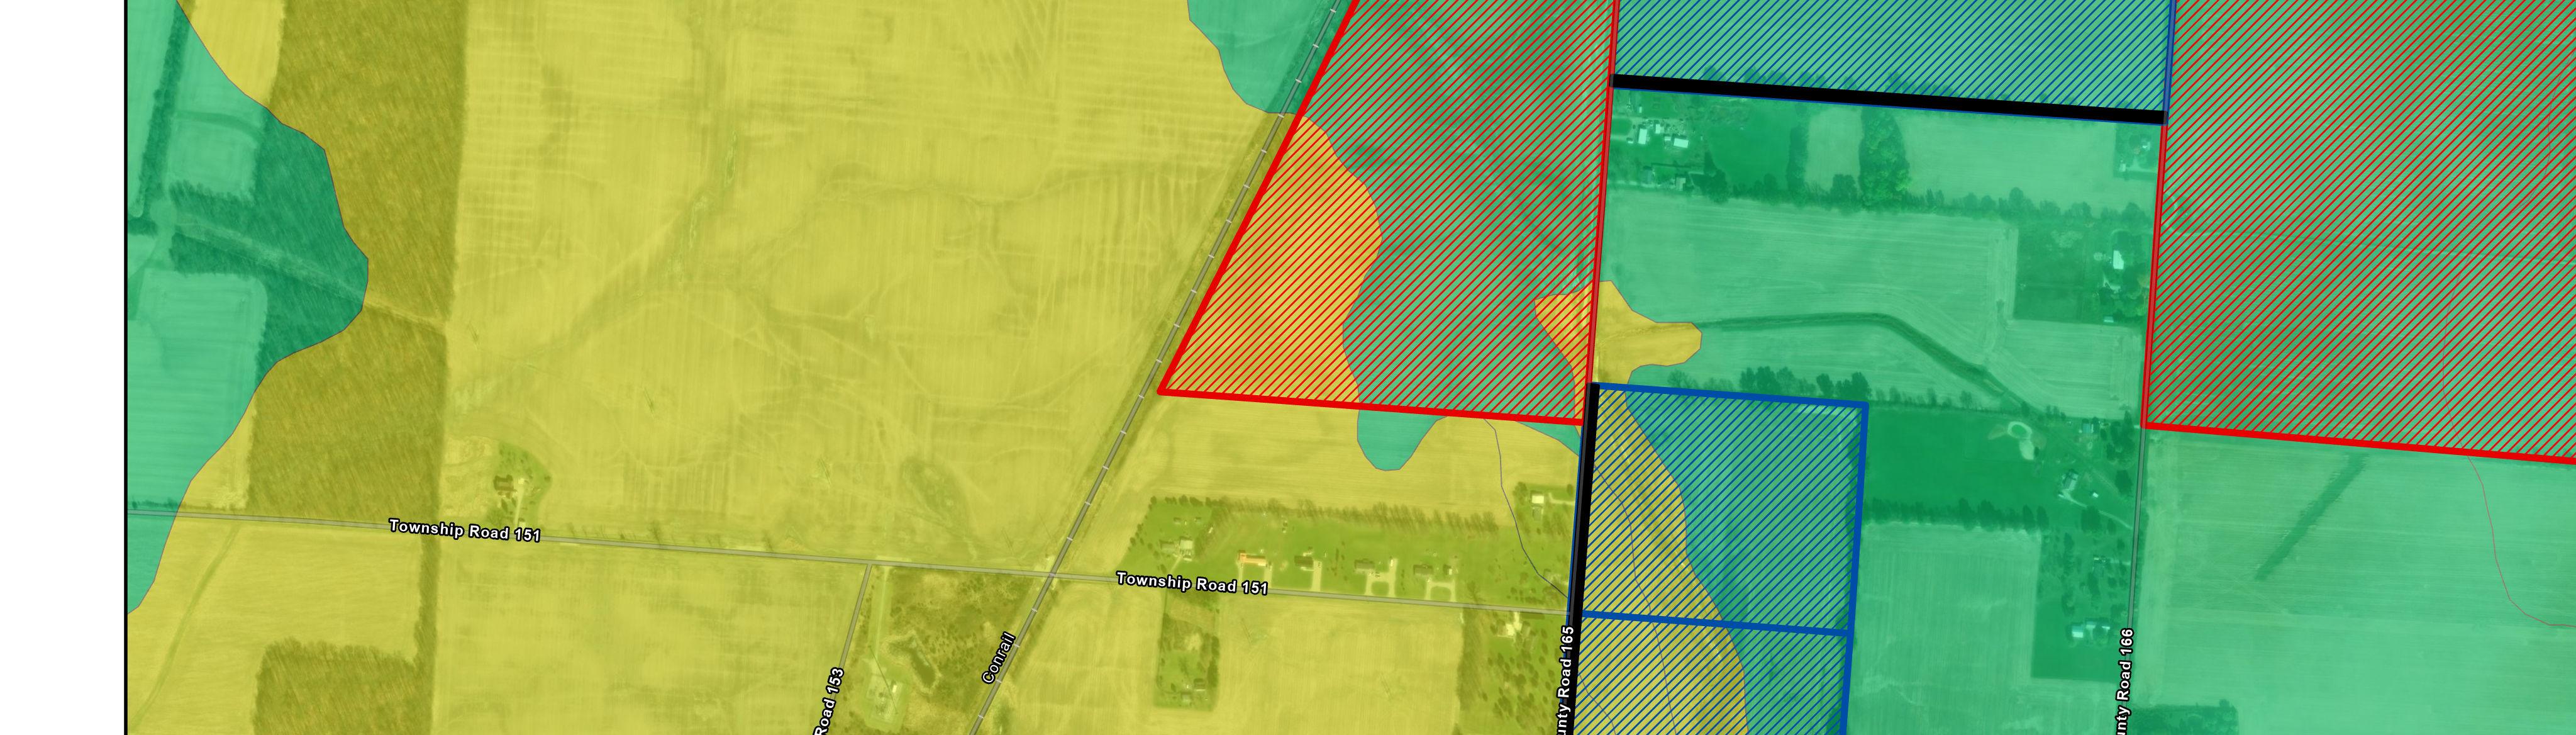
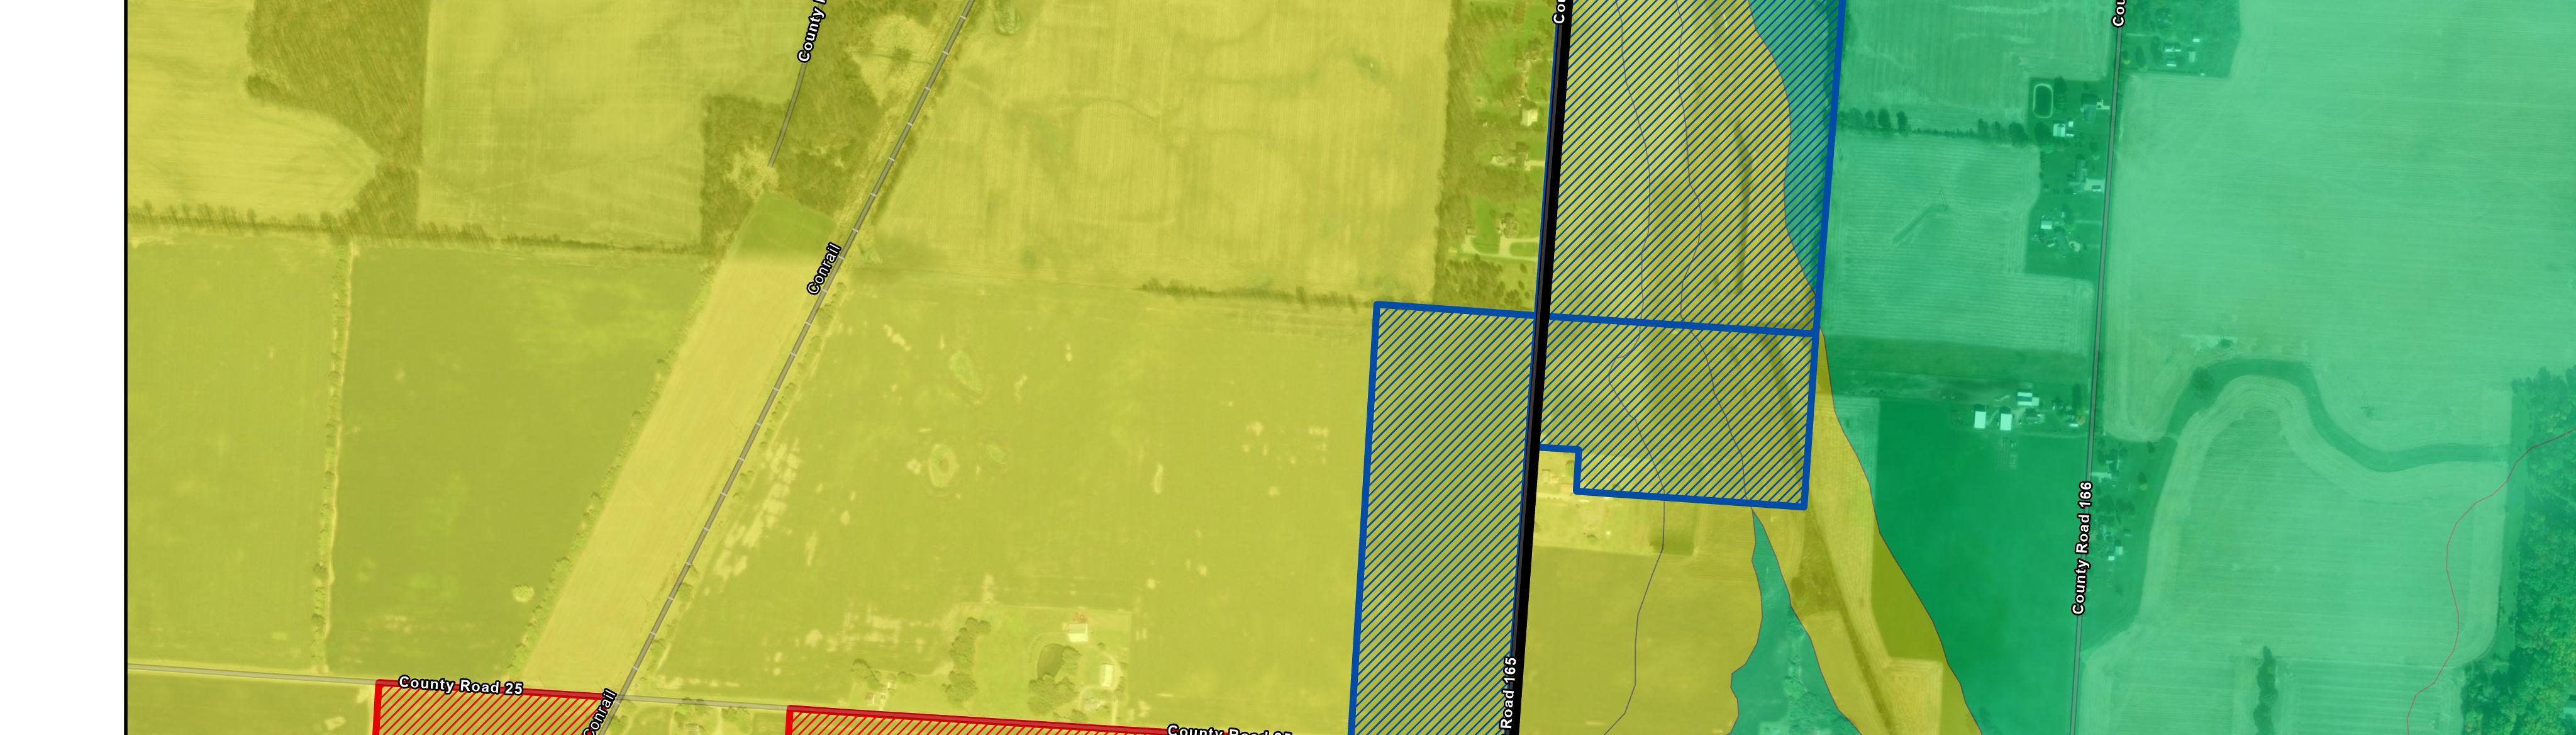
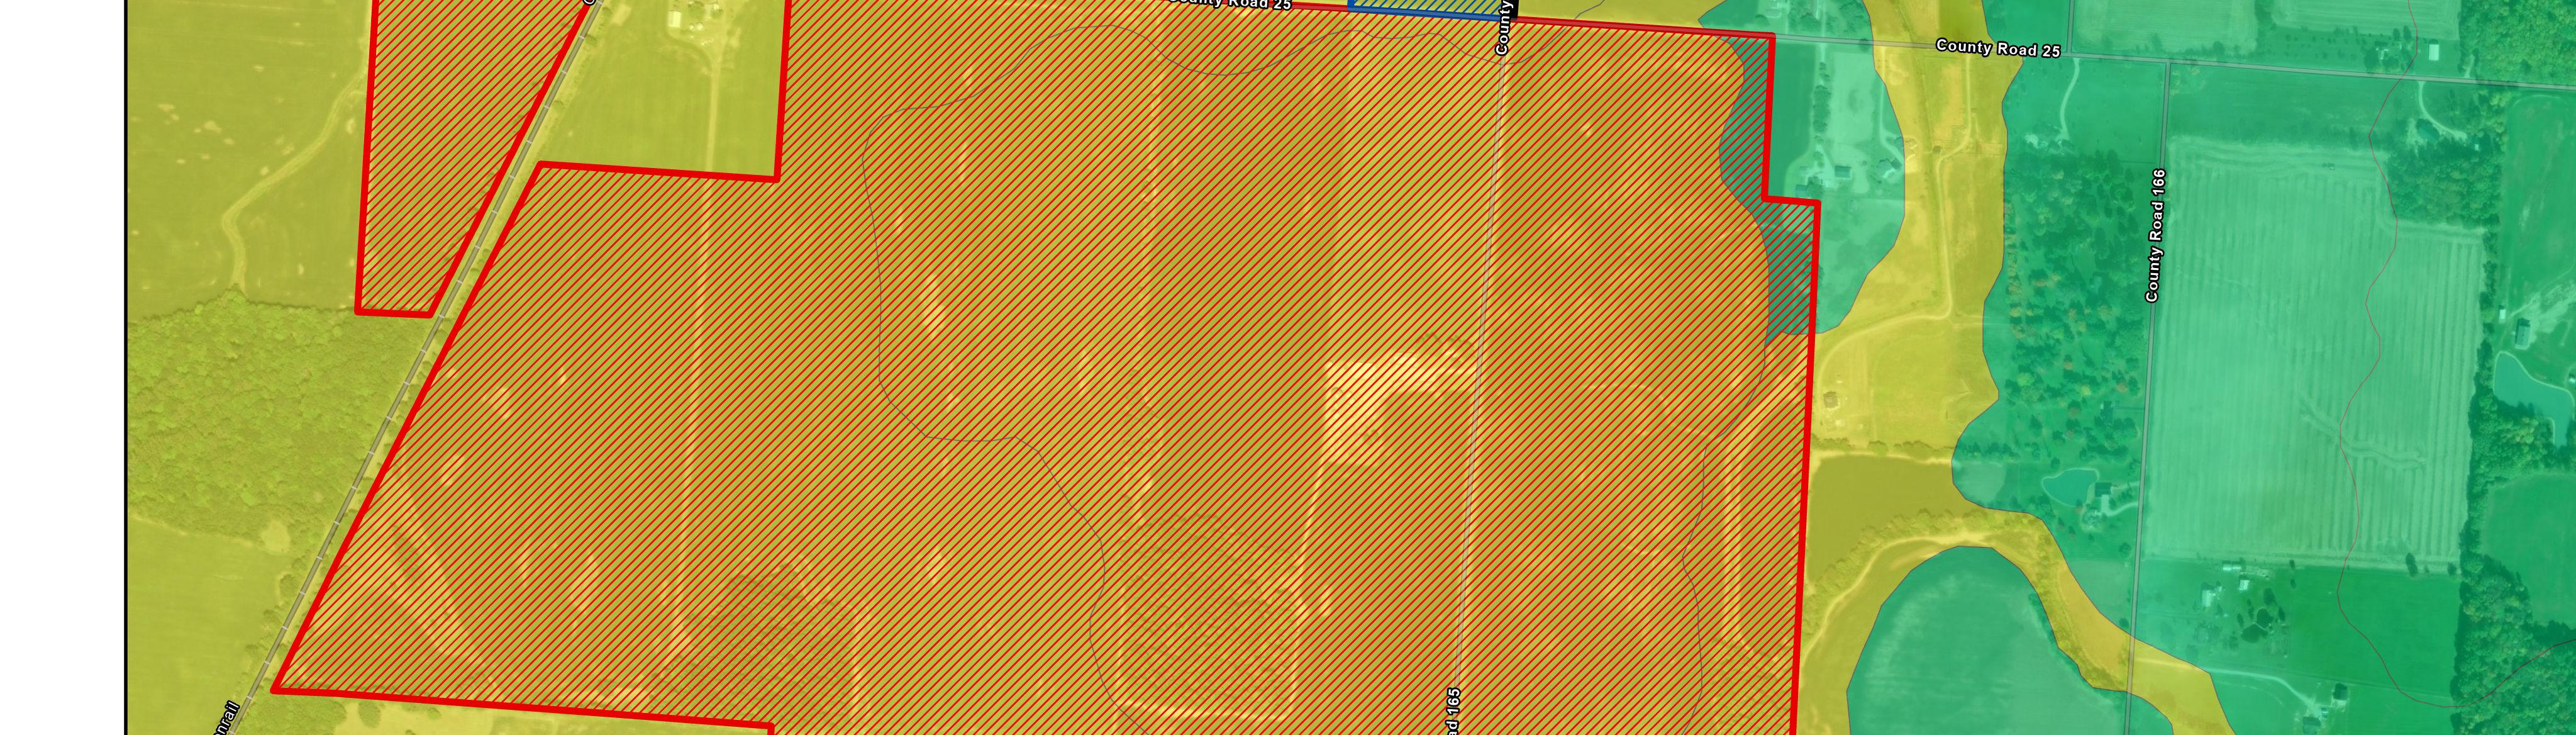
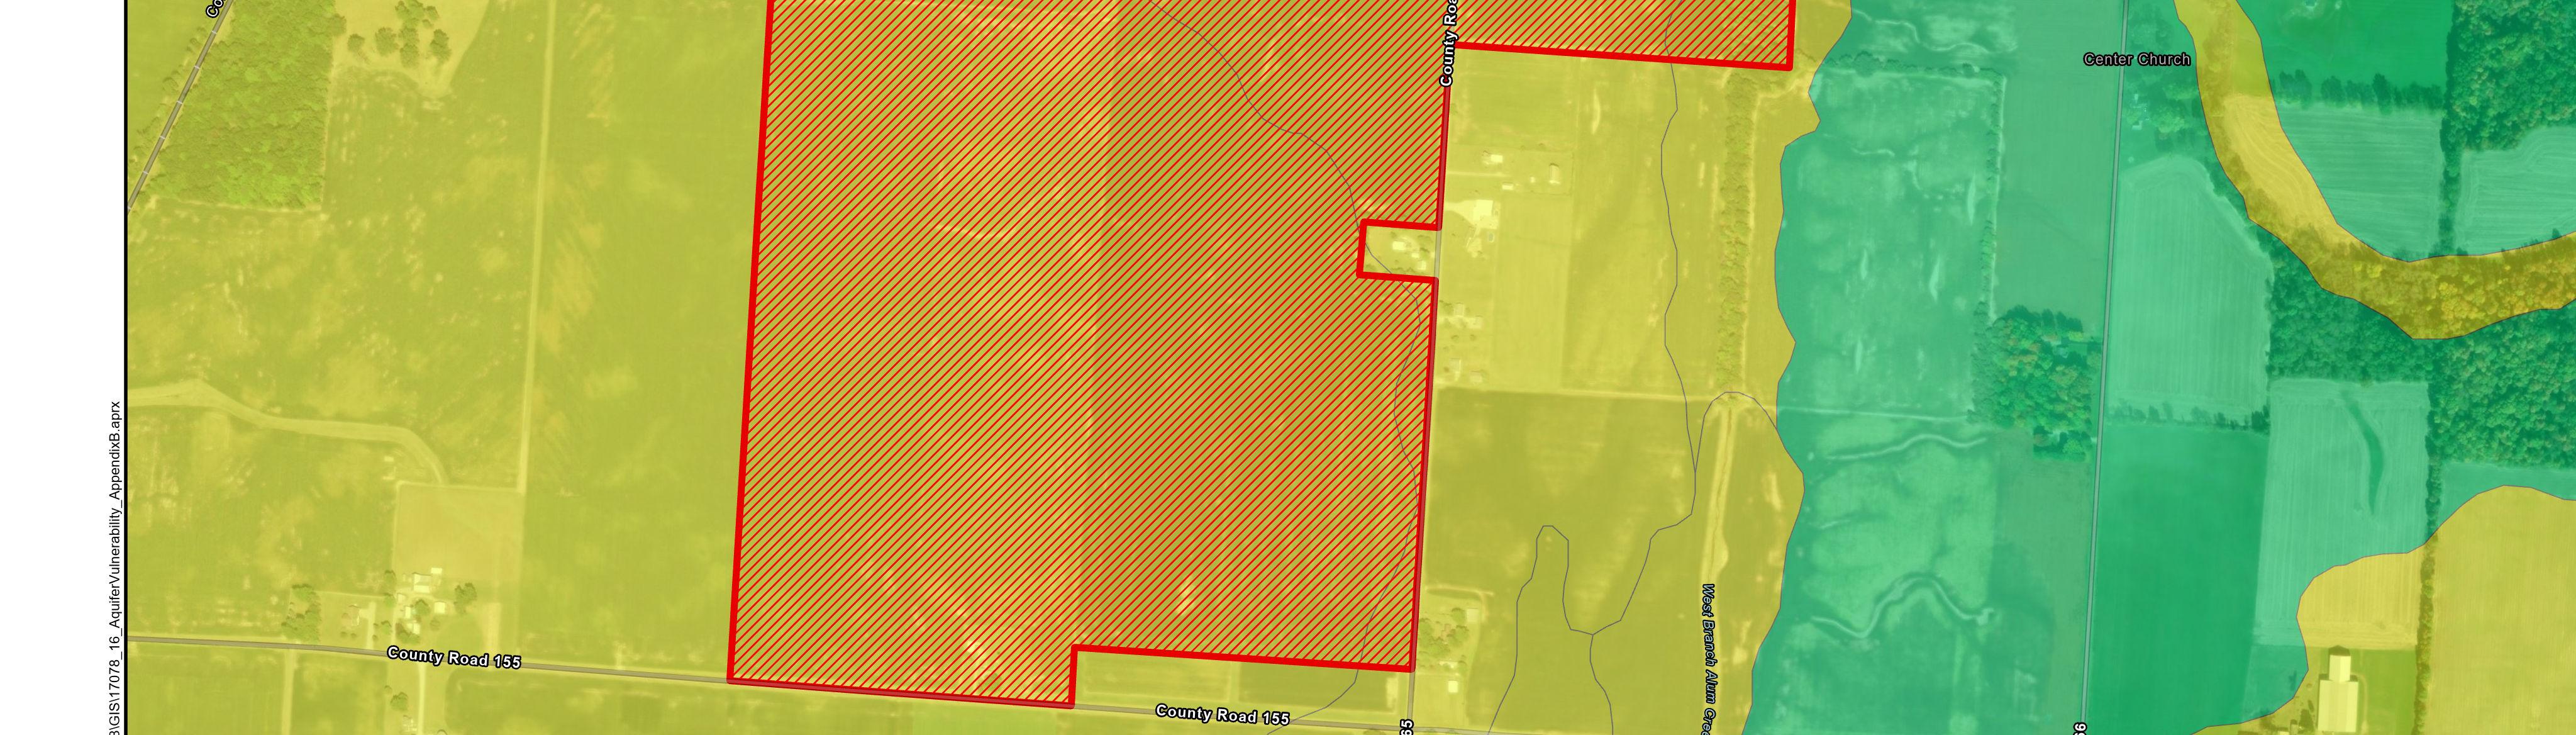
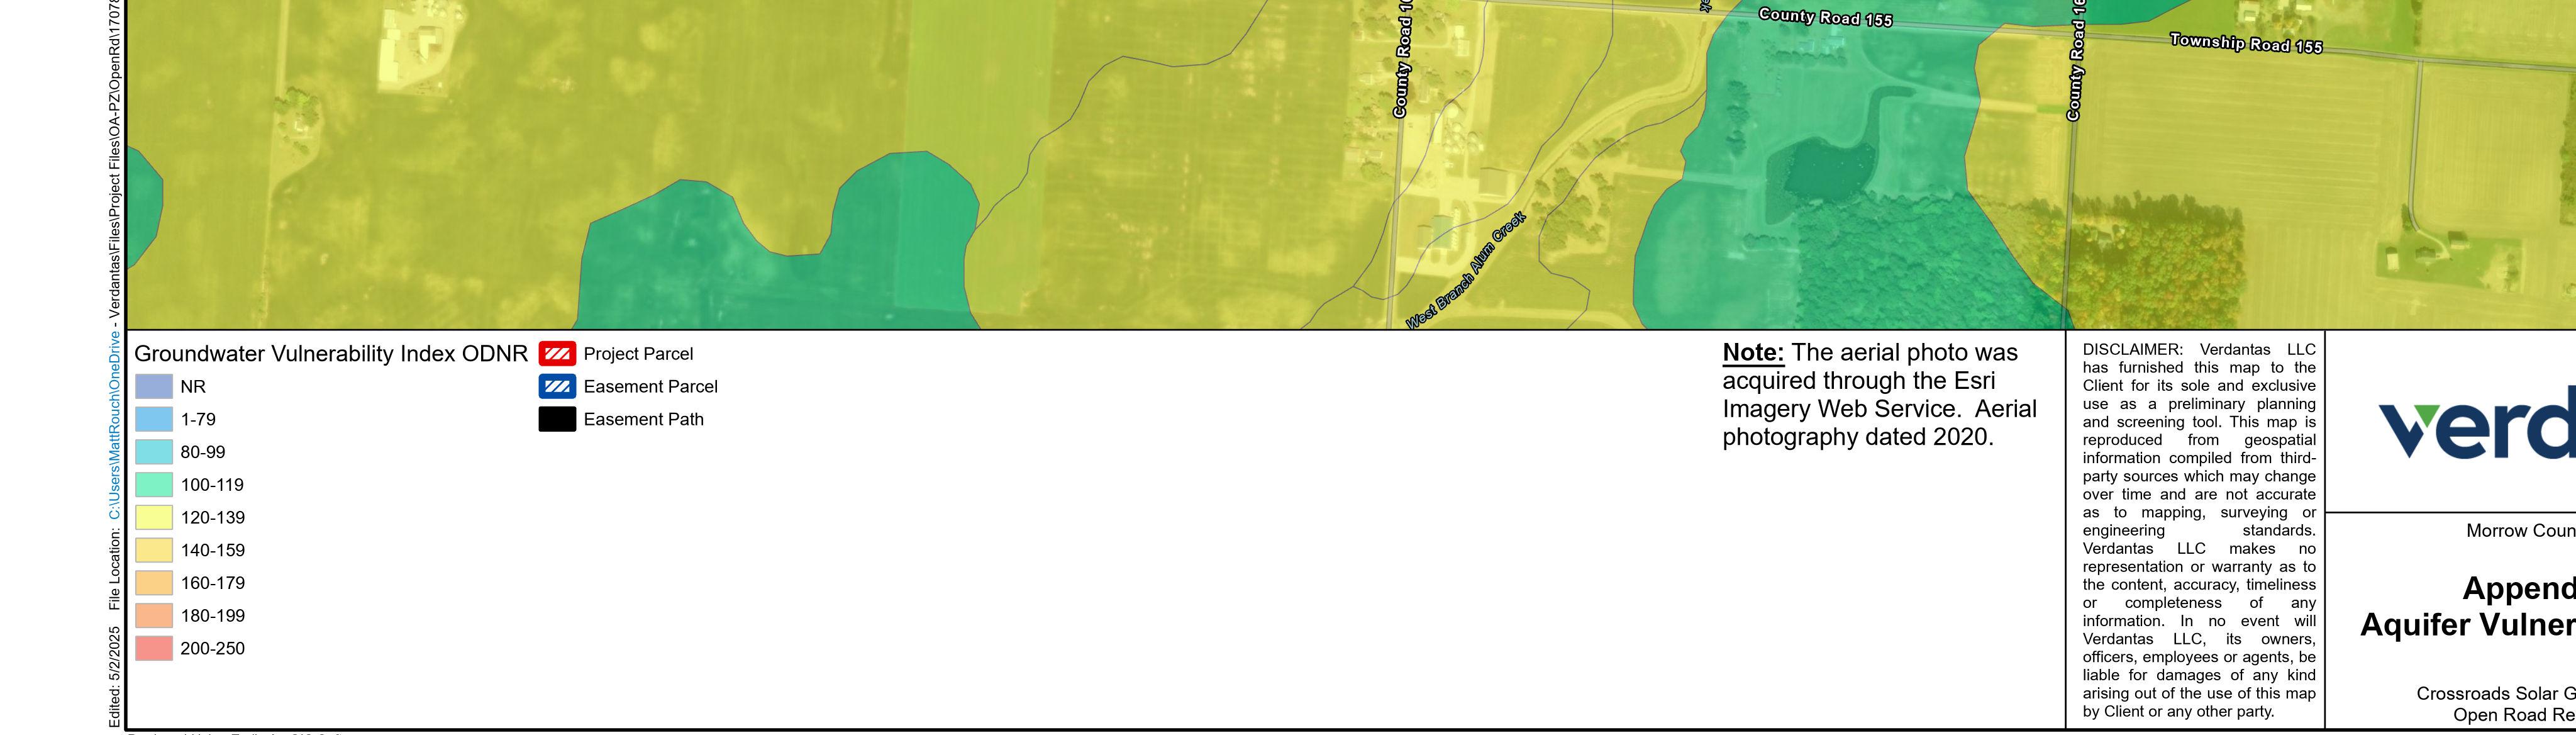
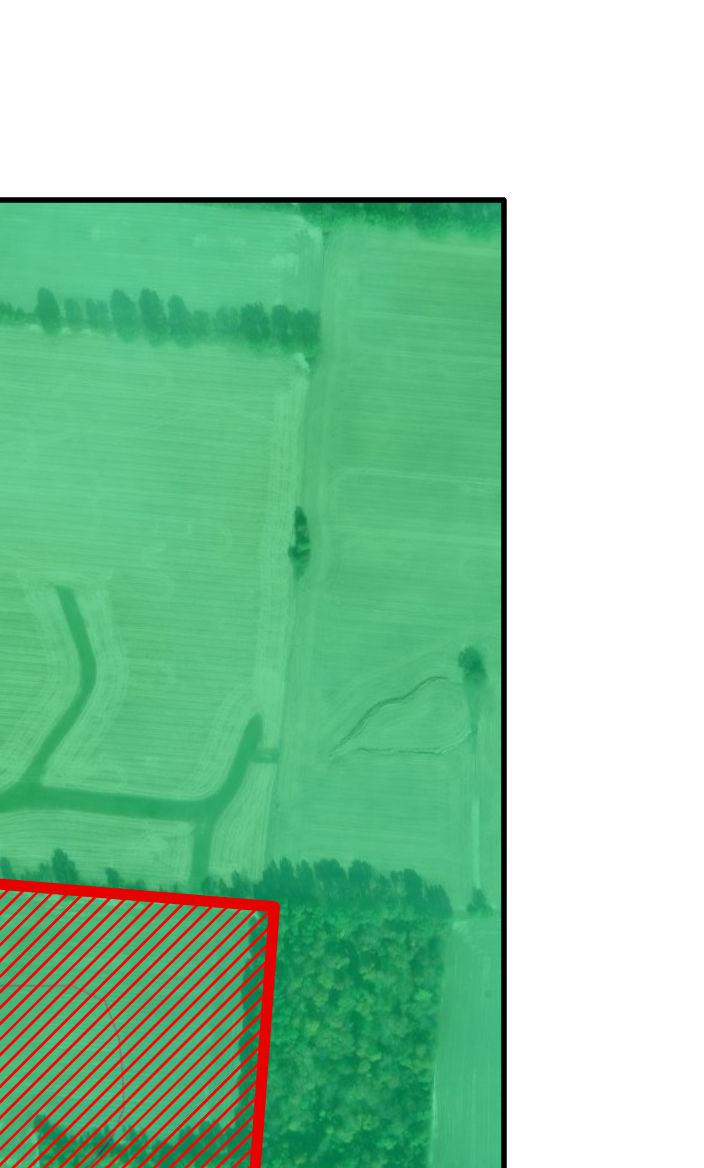
The ODNR Division of Geological Survey (Appendix B) reviewed impacts on public and private water supplies within the Project Area. The groundwater vulnerability in the Project Area ranges from 106-131; this identifies as a moderate susceptibility rating. The risk range on the map is from 1 (lowest) to 250 (highest). The Vulnerability map of the project area is included in Appendix B.2 The ODNR Division of Geological Survey indicates that construction of the Project is unlikely to present a substantial risk of groundwater contamination.
Based on our understanding of the construction and operation of the Facility, there will be no hazardous substances and/or petroleum introduced by or emanating from the Project. Oils used within the electrical substation will not contain polychlorinated biphenyls (PCBs) and a spill control plan would be prepared if applicable. Groundwater may be encountered in the upper fifteen feet generally from thin sand seams within the silty clay-rich unconsolidated glacial till. However, most drinking water wells are greater than 20 feet deep and therefore, it is our opinion that the construction and operation of the Facility will not impact public and private water supplies.
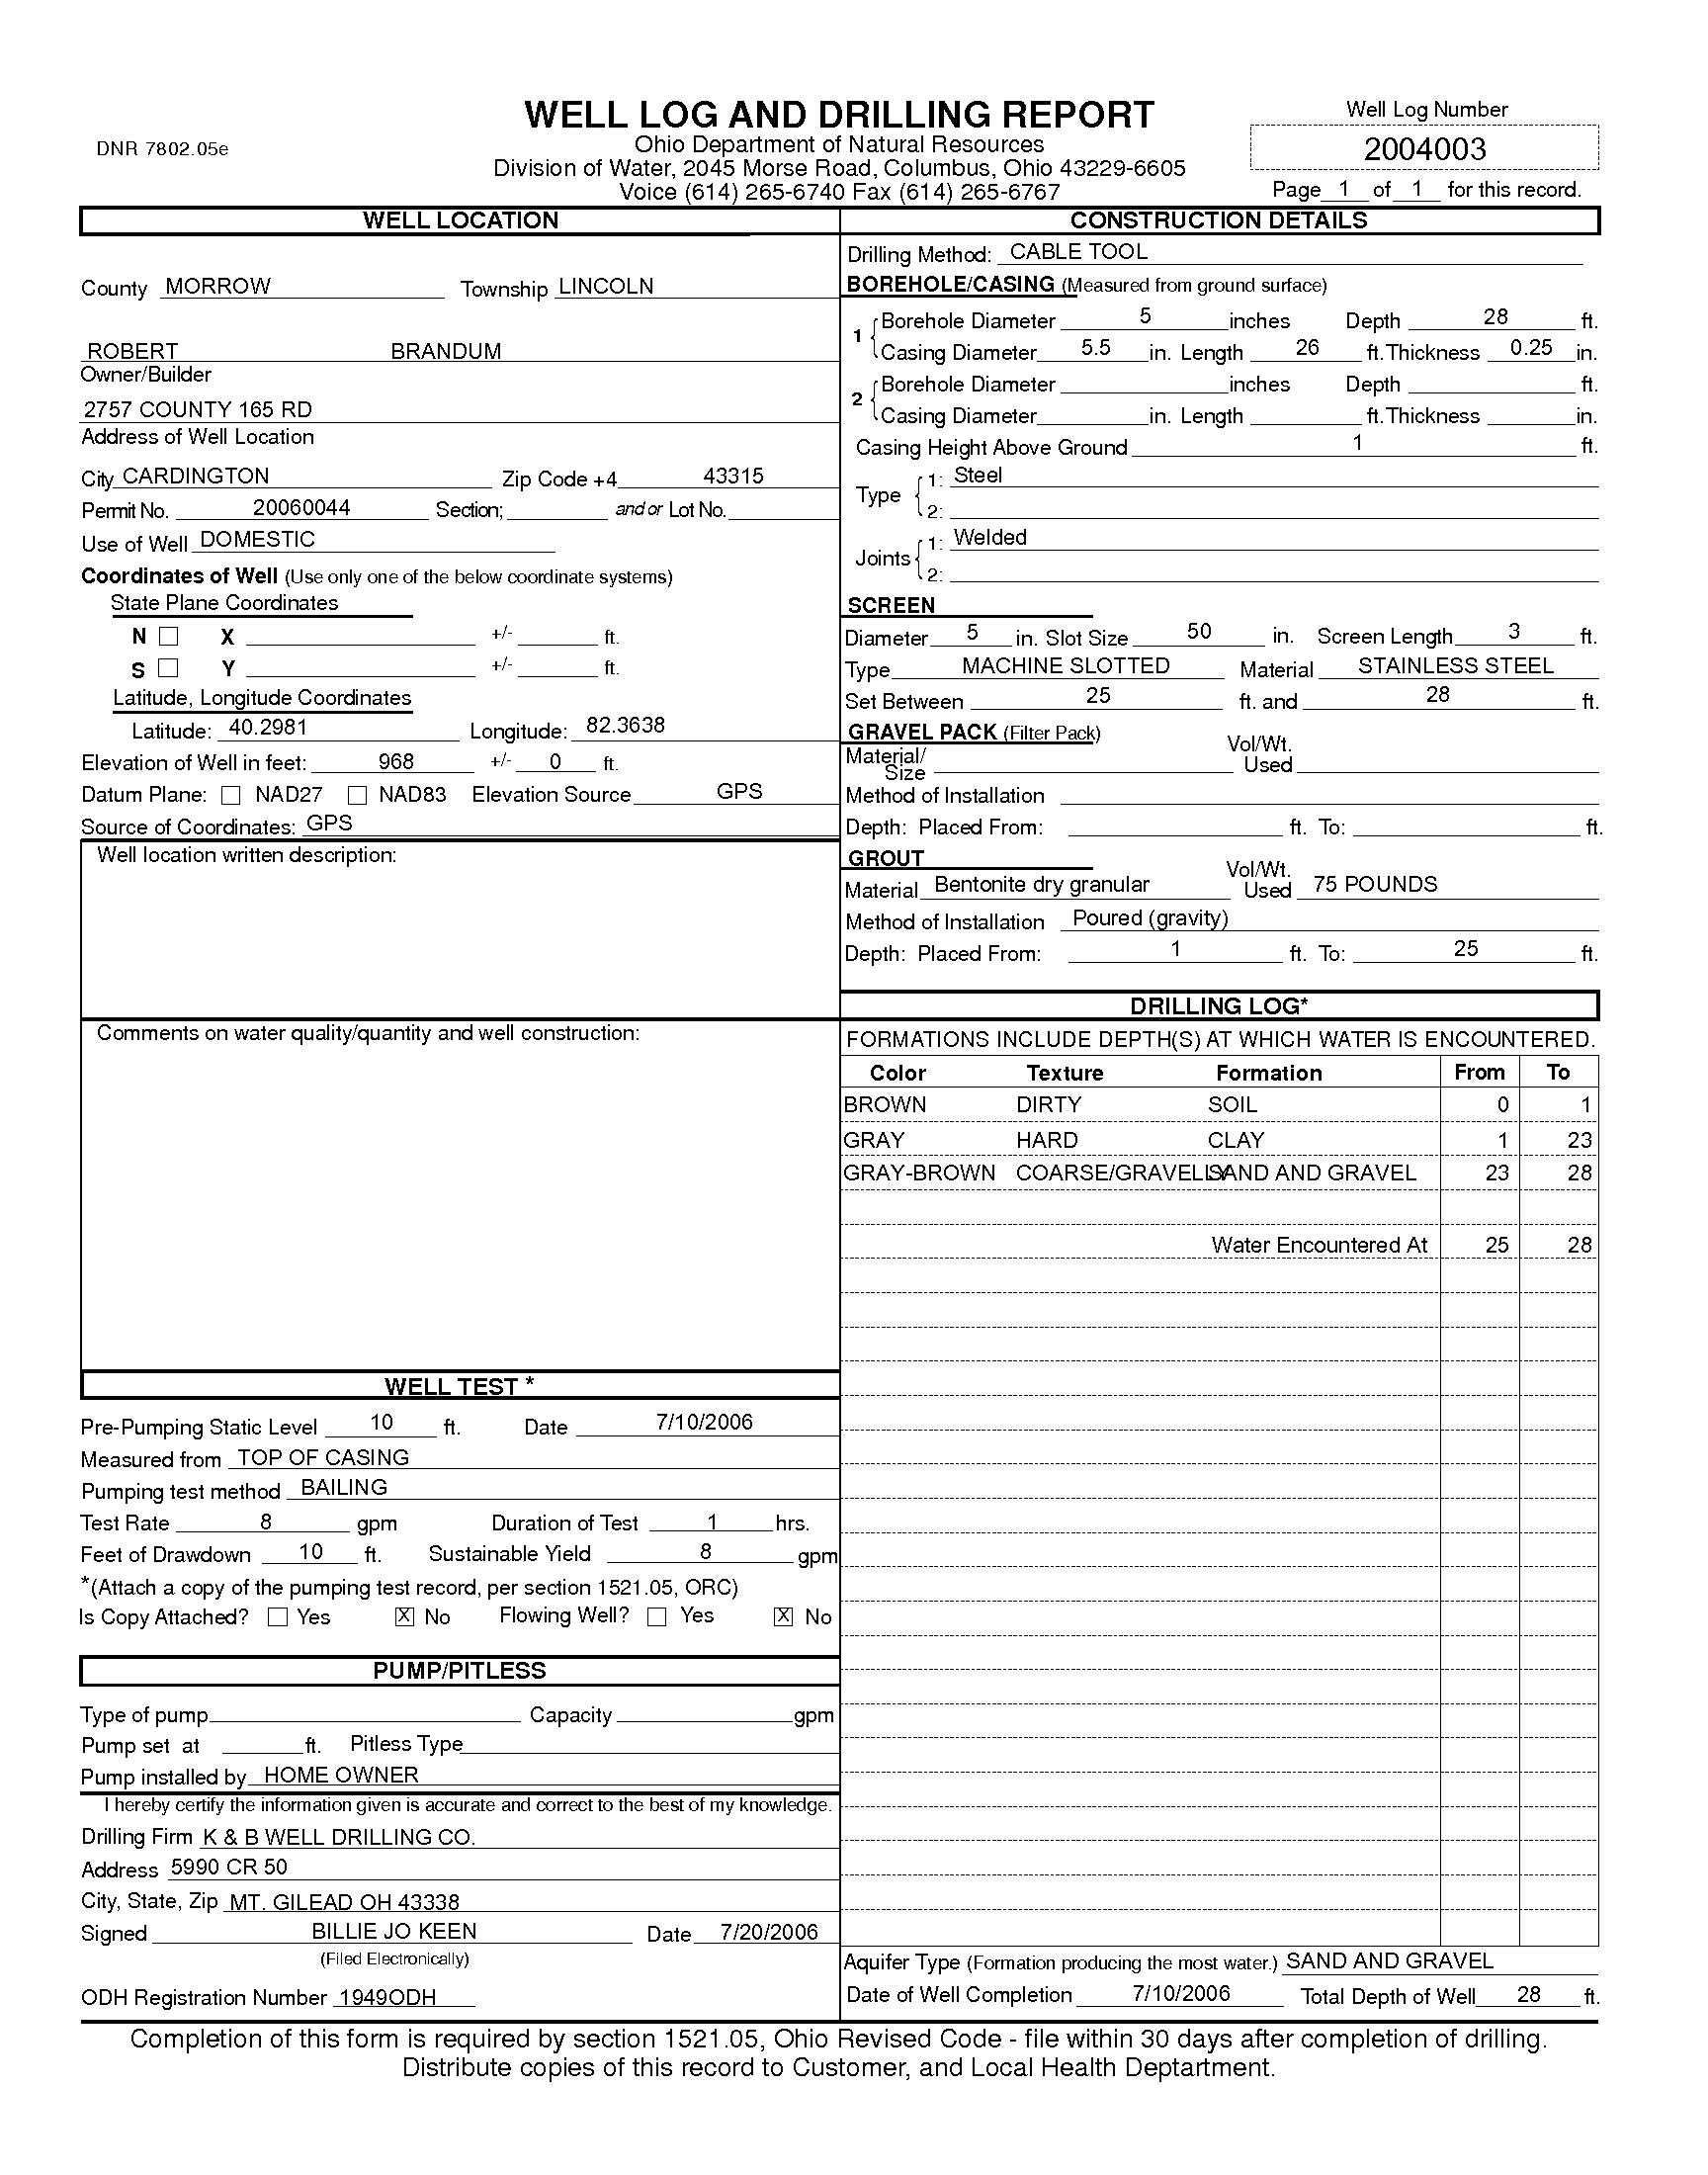
The Ohio Water Well Interactive Database indicates that approximately 73 wells are located within 1 mile of the Project Area. These wells were installed at depths ranging from approximately 22 to 50 feet bgs into the unconsolidated aquifer or underlying shale bedrock. Yields were reported to range from 0 to 8 gpm. The localized aquifers and well locations are shown on Figure 5. Water well location information was provided by ODNR and the Ohio EPA. Based on the geocoding of water wells from ODNR, 2 wells are located within the Project Area. The Water Well Logs and Drilling Reports for the wells in the Project Area are shown in Appendix C and indicate that the top of the shale bedrock was encountered at 23 feet for well 728275, and bedrock was not encountered at well 2004003. Well 728275 was completed at a depth of 25 feet bgs. The static water level was not indicated. Well 2004003 was completed at a depth of 28 feet bgs. The static water level was 10 feet bgs in 2006. The Water Well Logs and Drilling Reports are included in Appendix C. Site-specific information observed during the field program is available within the
2 Groundwater Vulnerability (GV) maps depict an area’s vulnerability to groundwater contamination based upon its hydrogeologic, topographic, and soil media characteristics. Conceptually, GV maps consider the case in which a generic contaminant is introduced at the land surface and allowed to percolate into the aquifer, be attenuated by natural processes, or be transported out of the area. This likelihood is reflected in the overall GV Index. Notably, GV maps do not consider the presence of contaminant sources, only the hydrogeology of the area in question. Therefore, a pristine, uninhabited plot of land with hydrogeologic characteristics conducive for water to flow into its aquifer would exhibit (despite having no known case or source of contamination) a GV Index higher than the location of a chemical storage facility, if hydrogeologic conditions at the facility limited the aquifer’s potential pathways for contamination. In short, GV Index is a contaminant- and land use-indifferent measure of groundwater contamination potential.
Preliminary Geotechnical Investigation which is included as Appendix A As shown in the boring logs included in Appendix A, groundwater was initially observed during drilling at depths between 10.0 and 14.0 feet bgs in each boring completed as part of the preliminary investigation, and at depths ranging from 3.0 to 6.5 feet in each of the borings upon completion. The ODNR Division of Geological Survey determined that the Project’s construction is not expected to have significant impacts on private well yields (refer to Appendix B). According to ODNR well records private wells in the vicinity of the Project Area are generally producing water from zones at depths greater than 20 feet bgs which is deeper that the deepest subsurface infrastructure associated solar construction (solar panel support piles). The panel support piles are expected to be driven at depths of 10 to 15 feet and generally will be isolated from drinking water zones. In addition, ground water yields are not expected to be impacted by solar infrastructure construction because no construction dewatering will be conducted at aquifer depths associated with private wells.
4.6 Drinking Water Source Protection Areas
The potential presence of Source Water Protection Areas (SWPAs) for public water systems located within the Project Area was evaluated. SWPAs are areas defined and approved by the Ohio EPA for the purpose of protecting drinking water resources. The SWPA map provided by Ohio EPA, Division of Drinking and Ground Waters is included as Appendix D. As shown on the figure in Appendix D, there are no SWPAs located within or near the Project Area. The following SWPAs are located near the Project Area:
Cardington Village PWS approximately 6 miles west of the Project Area;
Mt Gilead Village PWS approximately 7 miles northeast of the Project Area; and
Fresh Faith Community Church PWS approximately 6 miles northeast of the Project Area.
The locations of these groundwater SWPAs were confirmed using the Ohio EPA’s Drinking Water Source Protection Areas interactive map (Ohio Environmental Protection Agency Web, 2024).
Environmental regulatory programs of the Ohio EPA, as well as other regulatory agencies such as the Ohio Bureau of Underground Storage Regulations (BUSTR), have adopted regulations that restrict specific activities within SWPAs. These activities include concentrated animal feeding operations, wastewater treatment land application systems, industrial, municipal and residual waste landfills, leaking underground storage tanks (LUSTs), and voluntary action program (VAP) cleanups. The restrictions typically apply to SWPAs relying on groundwater as their drinking water source. Verdantas has reviewed the range of programs which have adopted rules related to the presence of SWPAs and has concluded that construction of the proposed solar farm facility will not constitute an activity that would be restricted within or in the vicinity of either a surface water or groundwater SWPA.
4.7 Well Survey
Verdantas conducted phone interviews or mailed questionnaire forms to complete a brief well survey with each of the seven (7) property owners whose land comprises the Project Area. A list of names and addresses for the property owners was provided by the Client. The survey included multiple questions regarding the number, depth, installation date, and construction of water wells on their properties. Additional information was requested regarding the aquifer type, depth to water, and yield of each well. The survey also requested information regarding any problems experienced by the property owners with their wells.
Responses were received from each of the seven (7) property owners.3 Four (4) respondents indicated that they had at least one well on their property. None of the property owners reported issues with their wells regarding lowering of water table or poor well yields. One (1) of the respondents could not provide any information regarding the depth or diameter of the wells on their property. The remaining wells were between 4 and 7 inches in diameter and reportedly installed at depths between 15 and 20 feet. One (1) respondent indicated that they have a cistern tank located directly behind the house.
4.8 Soil Survey
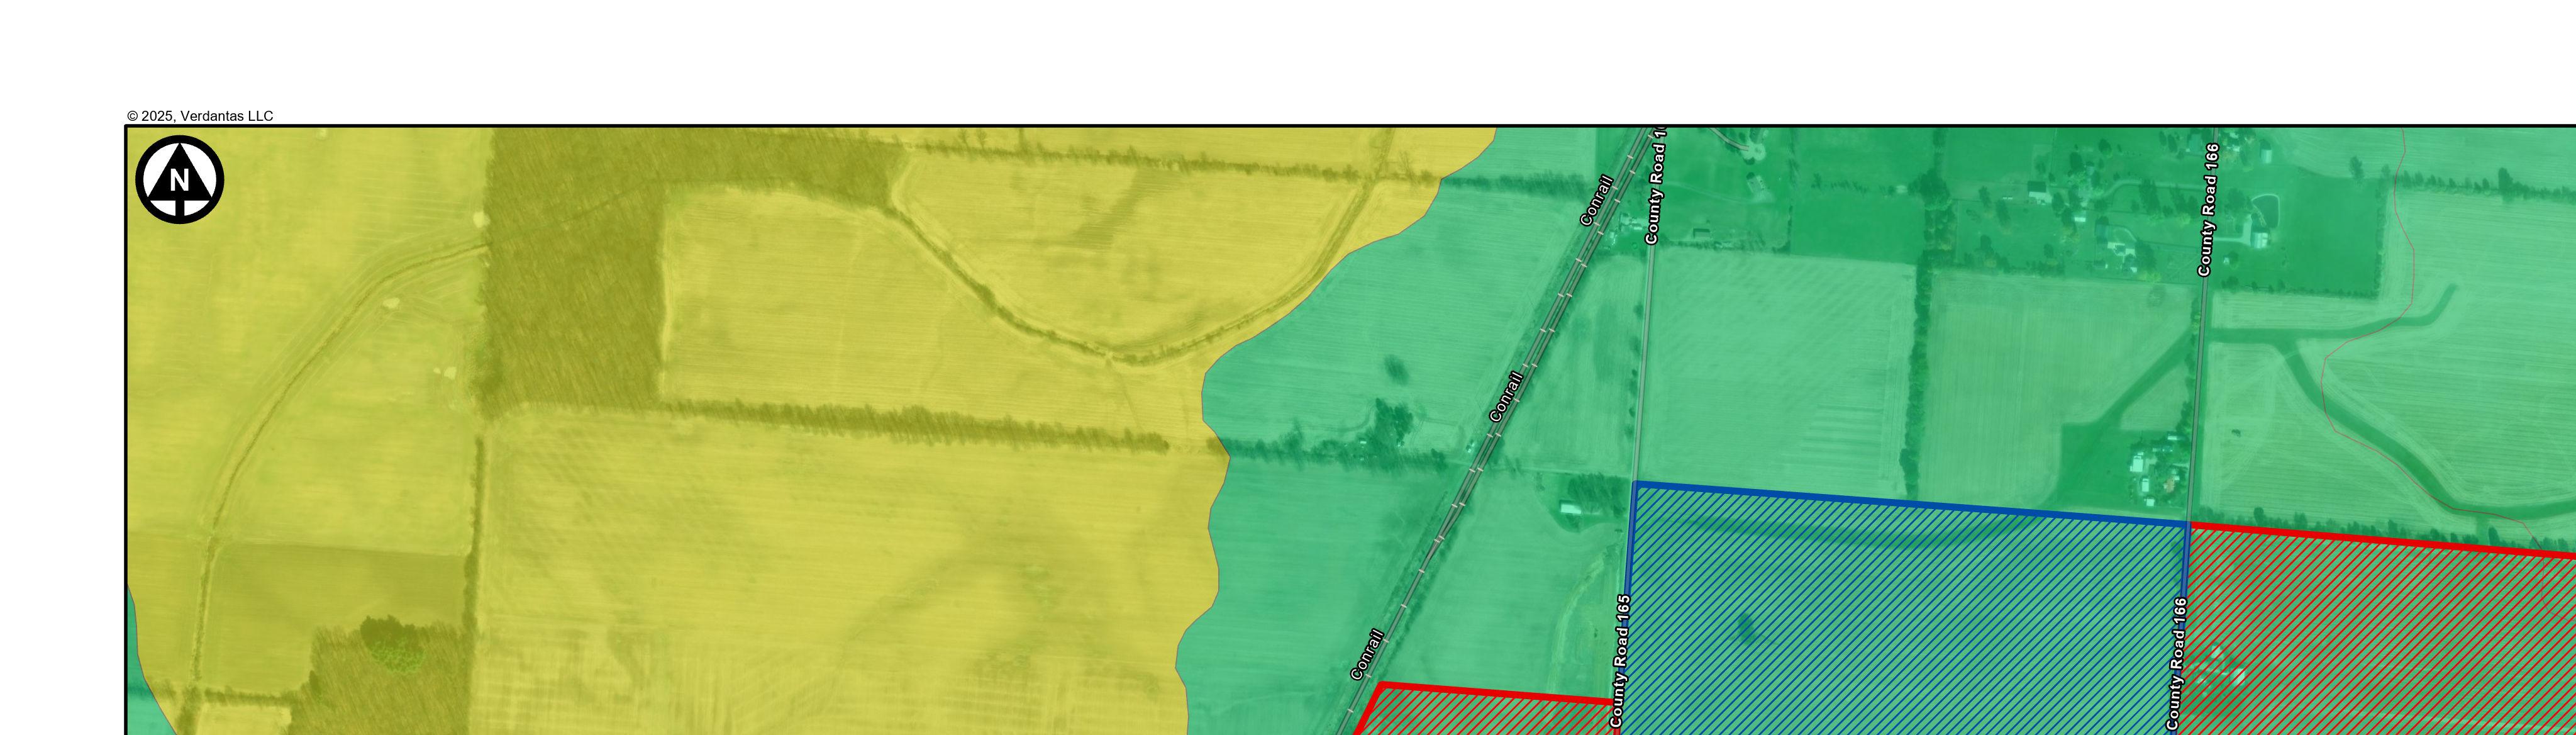
Soil surveys provide maps of surficial soils and general descriptions of the various soil types over the survey area and can be used as a tool to compare the suitability of large areas for general land uses. The USDA Natural Resources Conservation Service of Morrow County (USDA Web, 2025) maps the majority of the surficial soils within the Project Area as Pewamo silty clay loam, 0 to 1 percent slope (Pm), Blount silt loam, ground moraine, 0 to 2 percent slope (Blg1A1), and Glynwood silt loam, ground moraine, 2 to 6 percent slope (Gwg1B1). These soil types cover approximately 39.7, 34.3, and 15.1 percent of the Project Area, respectively. The remainder of the Project Area is covered by various silt, silty clay loams, and clay loams as shown on Figure 6.
The soil survey information suggests that the Pewamo silty clay loam (Pm) soils have 0 to 1 percent slopes and are very poorly drained. The permeability of these soils is moderately high (0.20 to 0.60 inches/hour), and the depth to the top of the seasonal high-water table can range from 0 to 12 inches bgs. The Blount silt loam, ground moraine (Blg1A1) soils have 0 to 2 percent slopes and are somewhat poorly drained. The permeability of these soils is considered low to moderately high (0.01 to 0.20 inches/hour), and the depth to the top of the seasonal high-water table can range from 6 to 12 inches bgs. The Glynwood silt loam, ground moraine, 2 to 6 percent slopes (Gwg1B1) are moderately well drained. The permeability of these soils is considered low to moderately high (0.01 to 0.20 inches/hour), and the depth to the top of the seasonal high-water table can range from 12 to 24 inches bgs (USDA Web, 2025). Based on information provided from ODNR, Pewamo, Blount, and Glynwood have moderate shrink-swell potential. A Custom Soil Resource Report for Morrow County, Ohio is included in Appendix E.
3 Note, two property owners Joe Etgen and Paul Etgen were sent individual letters but provided a combined response.
4.9 Oil and Gas Wells and Injection Wells
According to oil, gas, and mining information included in the comment letter from ODNR in Appendix B, there are approximately 319 oil and gas well heads within one mile of the Project Area, and 14 oil and gas well heads located within the Project Area. Table 1 lists the well number, map symbol (refer to Figure 5), and status of each oil and gas well in the Project Area.
Table 1. Oil and Gas Well Heads Located Within the Project Area. Well Number Map Symbol Status
34117208020000
34117208280000
34117215160000
34117215700000
34117215840000
34117216290000
34117218170000
34117219480000
34117219920000
34117235110000
Oil Producing
Dry hole
Plugged oil
Plugged and Abandoned
Plugged and Abandoned
Plugged oil Final Restoration
Dry hole
Dry hole
Plugged oil
Dry hole
Plugged and Abandoned
Plugged and Abandoned
Final Restoration
Plugged and Abandoned
Oil Producing
Dry hole
Final Restoration
There are two (2) active oil wells located within the Project Area. These wells (34117208020000 and 34117219920000) are located in a wooded area within the Northeast portion of the Project Area and are operated by EOS Energy LLC. ODNR recommends at minimum a 50-foot setback from each active well and 25 feet from plugged wells with at least 15-foot-wide access to the well. The wells are not expected to cause an impediment to the Project.
Based on the geocoding of active Class II injection wells from ODNR, there are no Class II injection wells within the immediate vicinity of the Project Area.
4.10 Underground and Surface Mines
Information obtained from the ODNR Division of Mineral Resources (ODNR Web, 2024b) indicates that there are no mapped abandoned underground or surface mines in the Project Area. The nearest mine to the Project Area is an active surface industrial mine operated by The National Lime and Stone Company, approximately 12 miles east of the Project Area Figure 7 illustrates that no known coal, underground, abandoned, or surface mines are mapped within the Project Area. The ODNR Division of Mineral Resources confirmed there is no record of mining within one mile of the Project Area (Appendix B).
5. Project Area Investigation
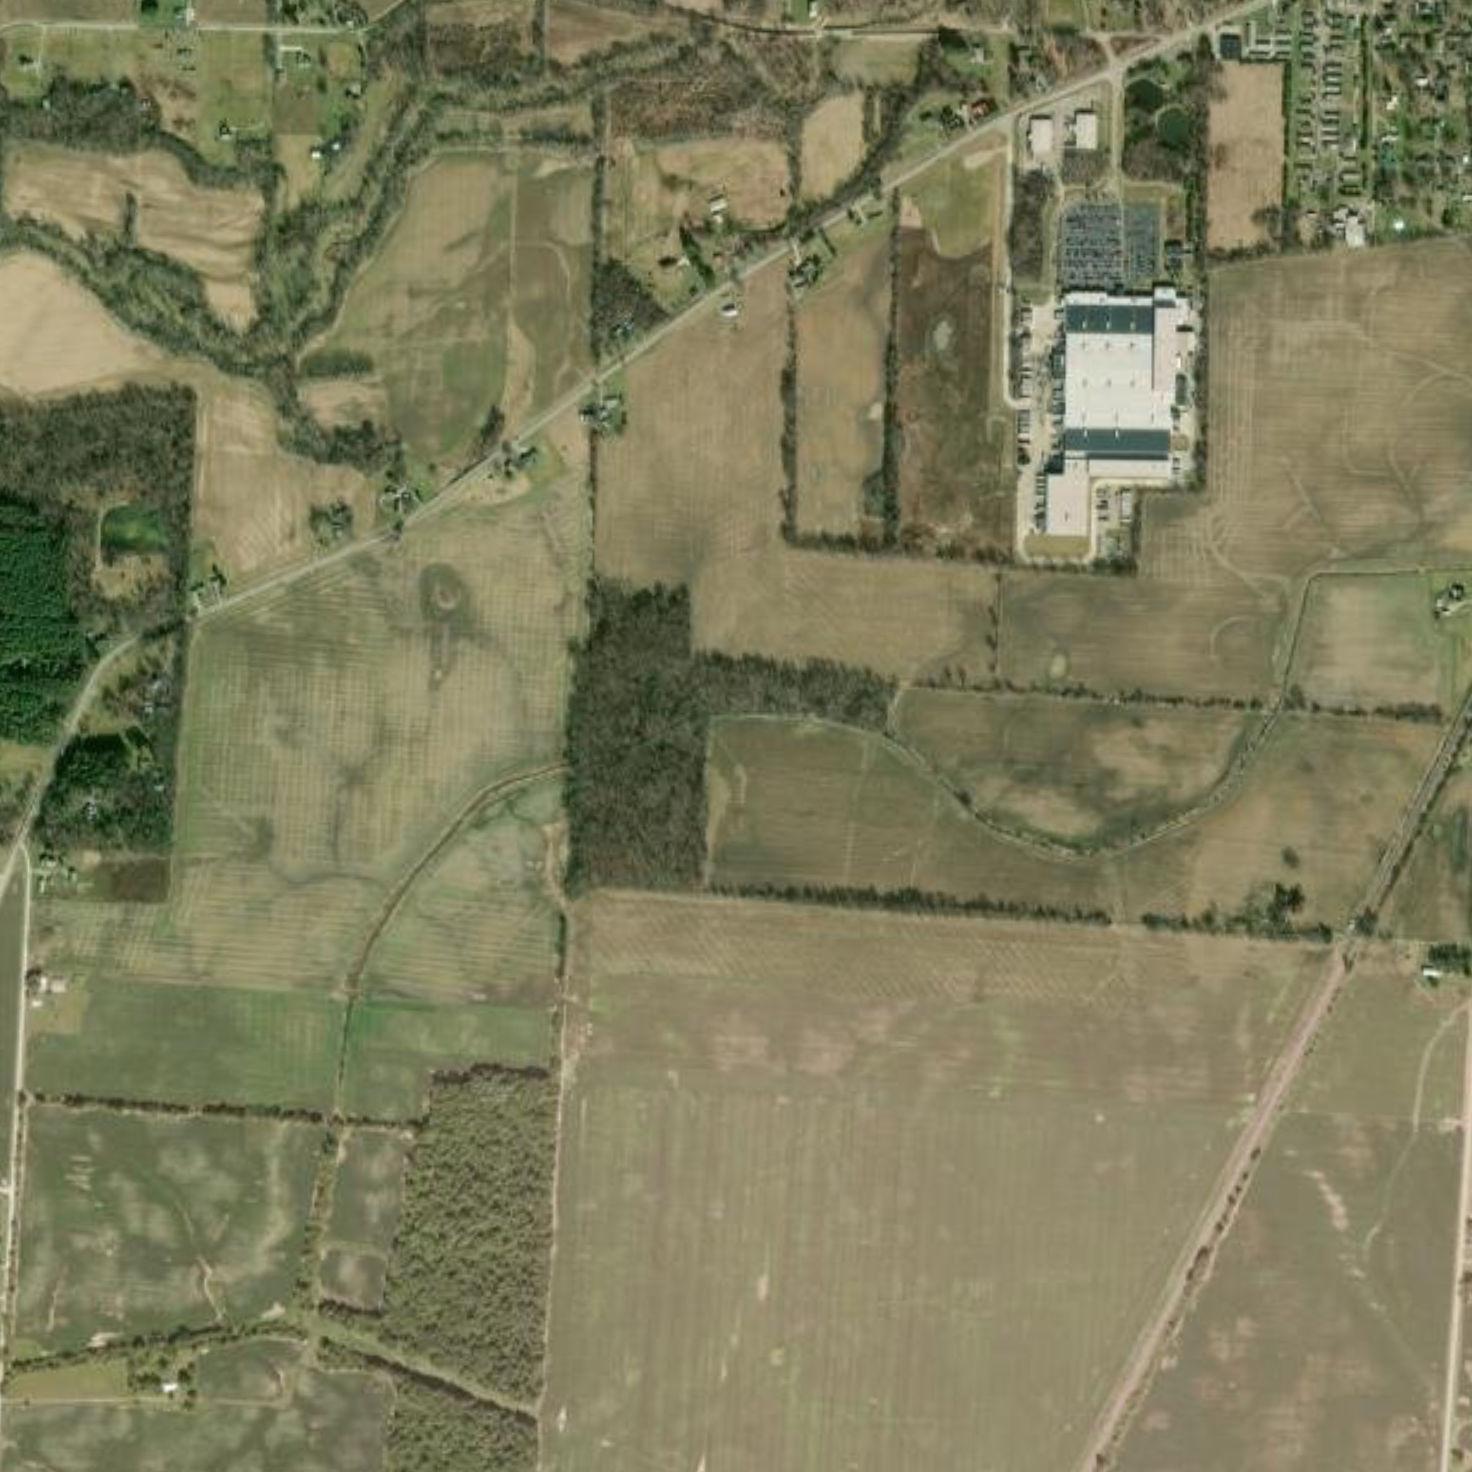
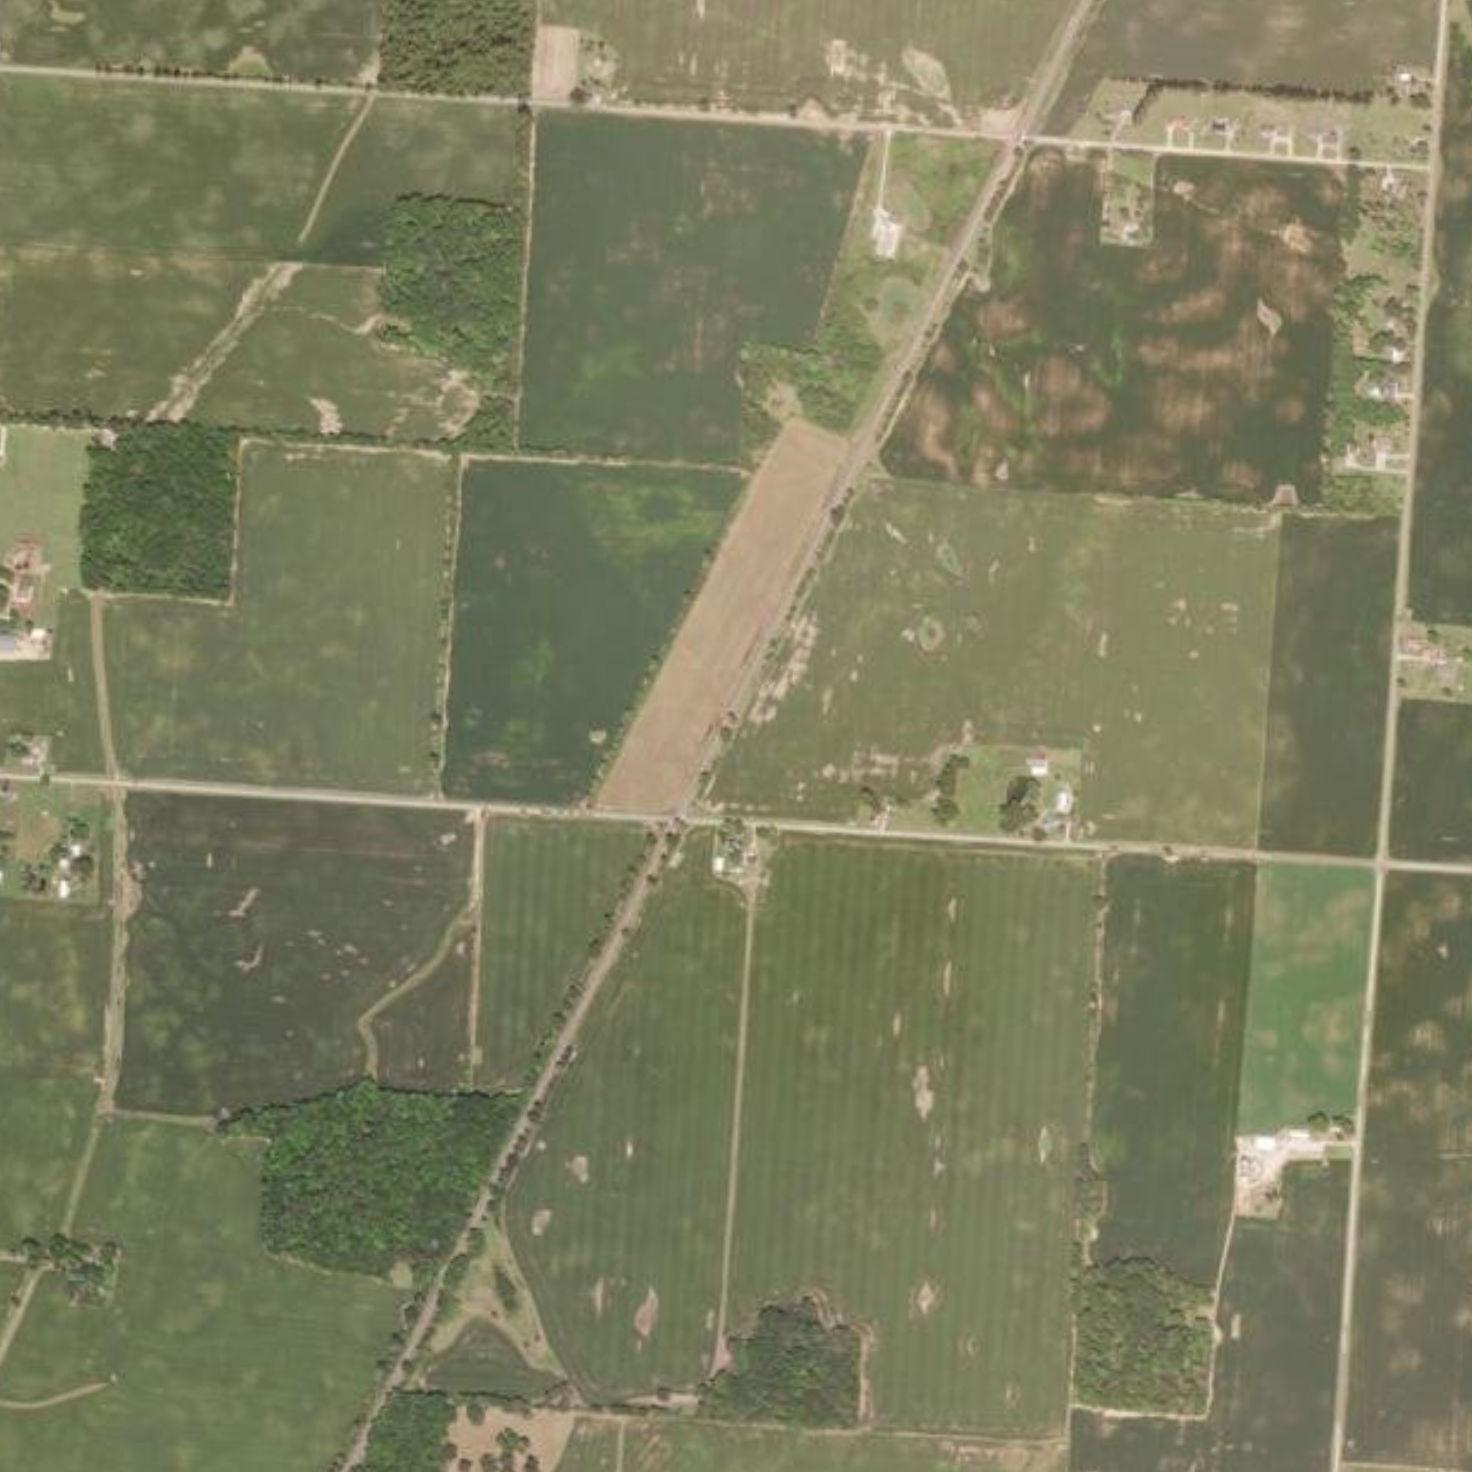
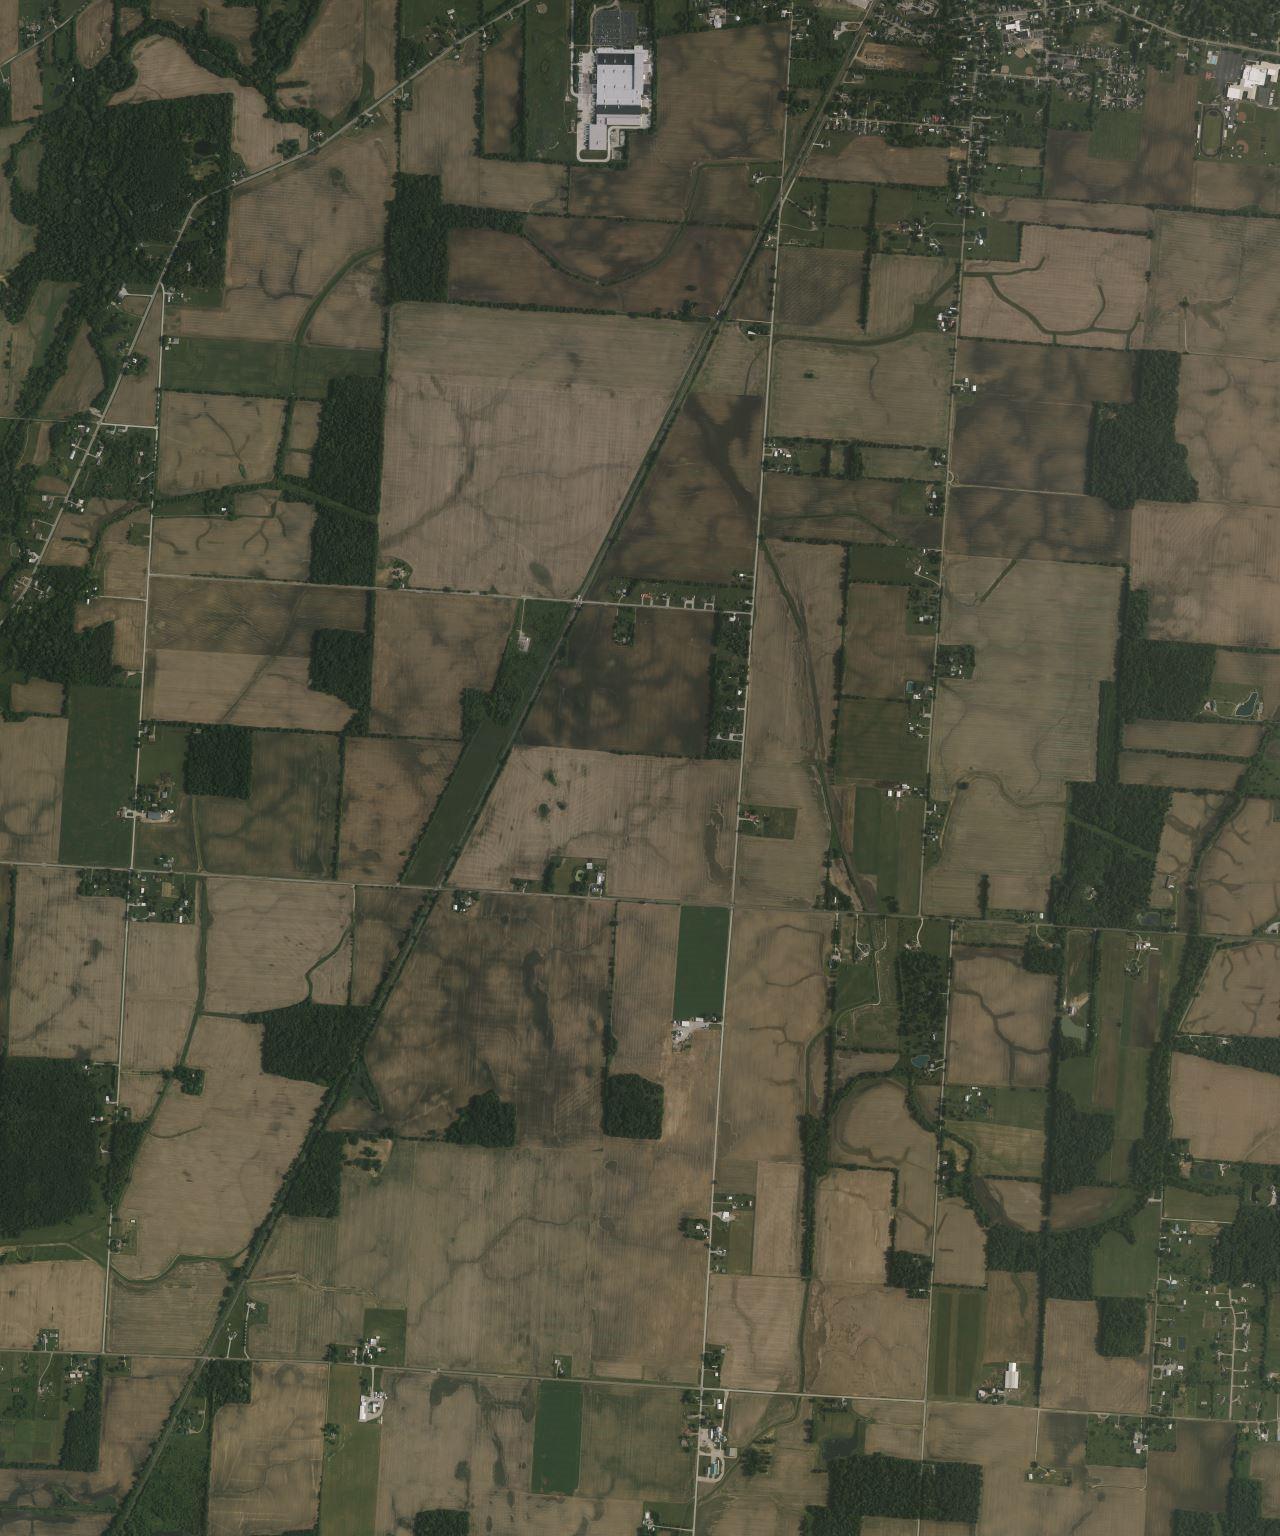
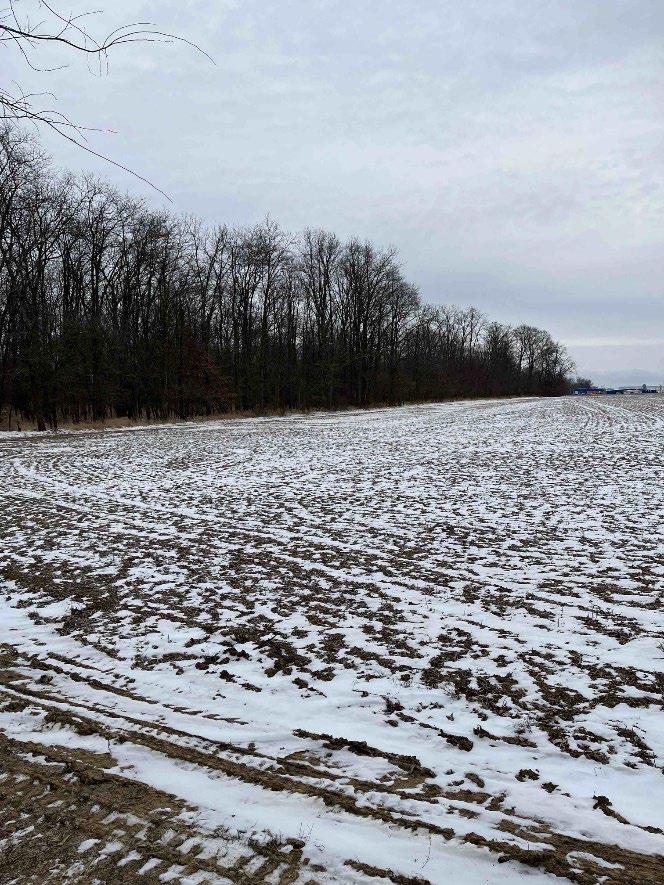
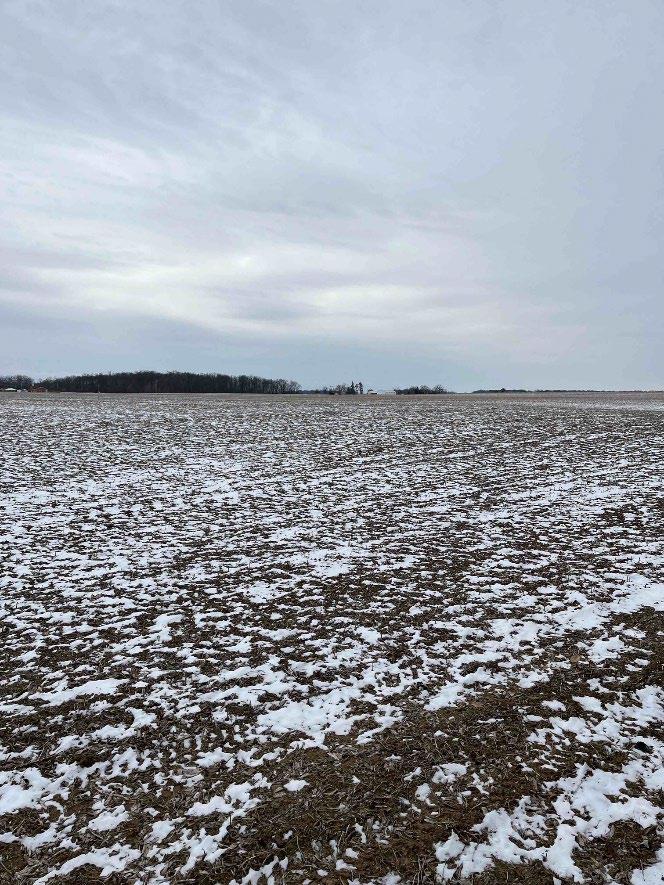
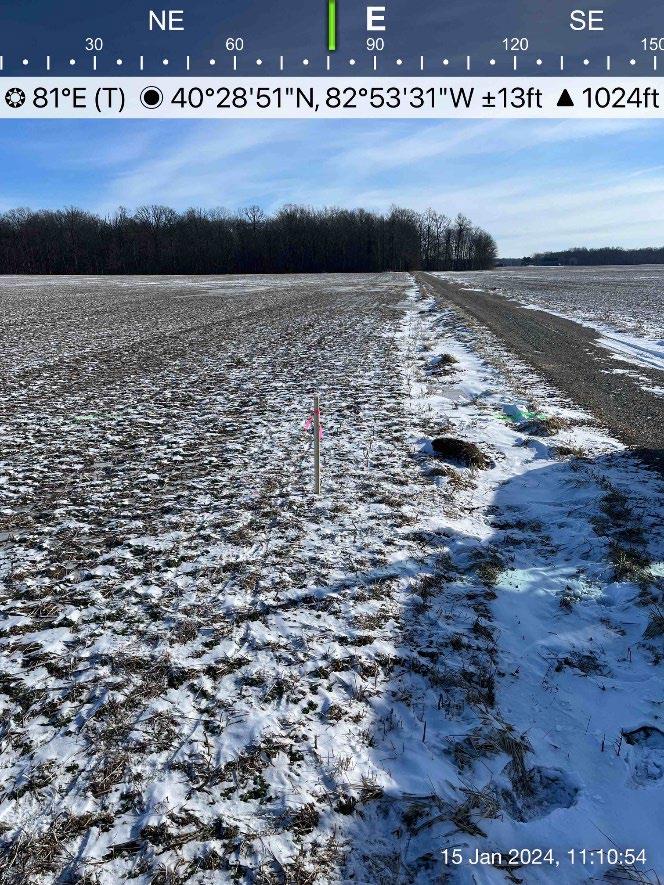
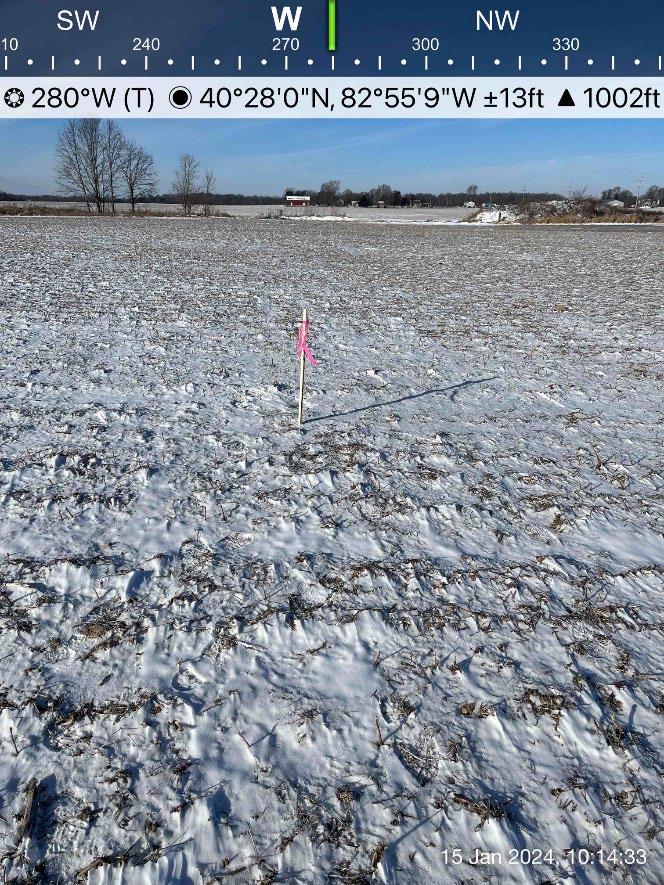
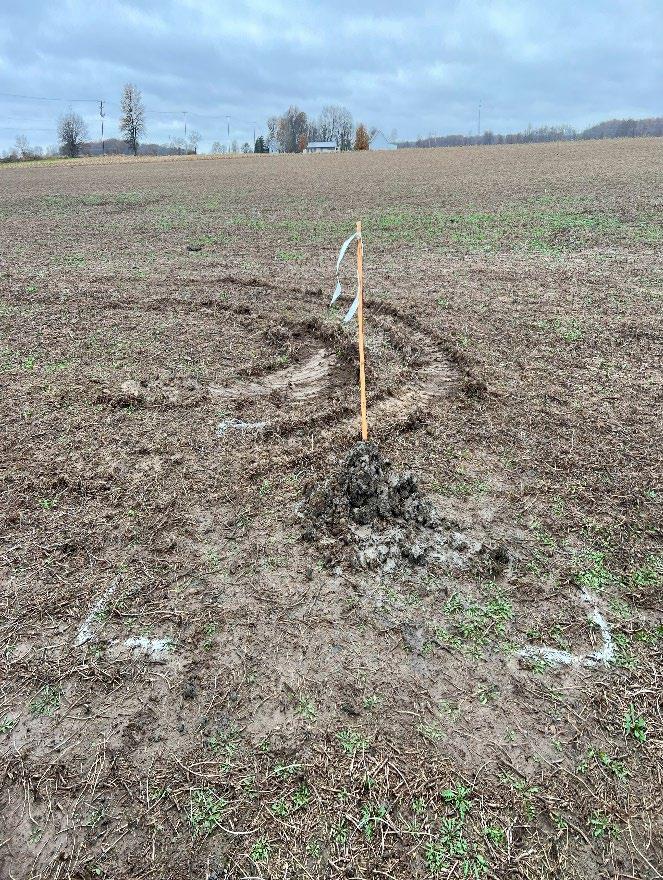
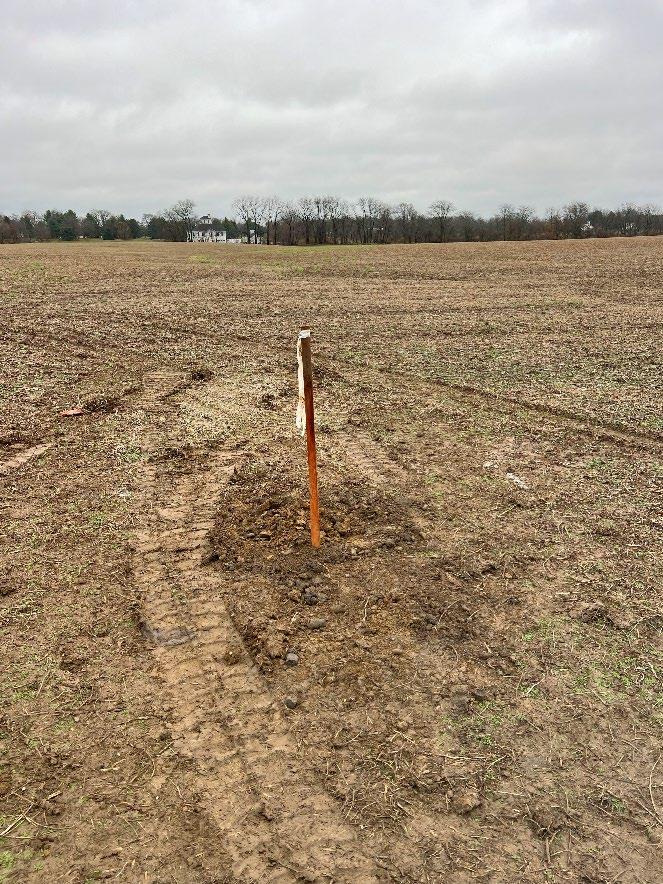
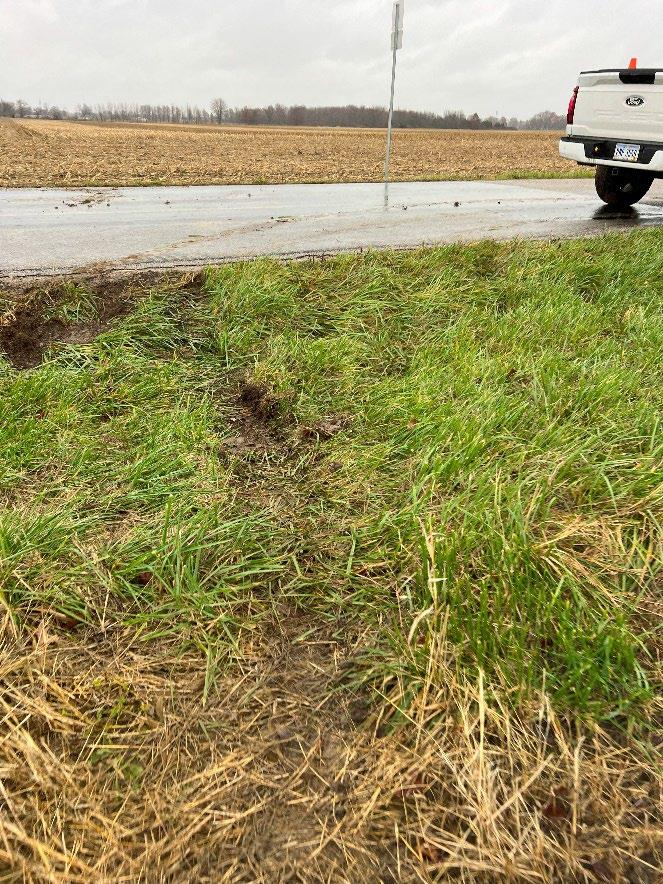
Verdantas completed a reconnaissance of the Project Area on January 15 and 16 and November 22, 2024, from the public right-of-way, to observe Project Area conditions including topography, surface geologic features, and surface water conditions. The Project Area contains a predominance of active agricultural fields, some forested riparian corridor, and some forested woodlots. The terrain within and surrounding the Project Area is predominantly flat, consisting of only slight undulation. Based on a review of the existing topography of the Project Area and the visual observations completed by Verdantas, it is anticipated that the potential for rockfalls and landslides is very low due to the relative flat to slightly rolling topography of the Project Area. In addition, Verdantas did not observe sinkholes, depressions, or evidence of karst topography
within the Project Area. Representative photographs from the reconnaissance which illustrate the general Project Area conditions and a photo location map are presented in Appendix F.
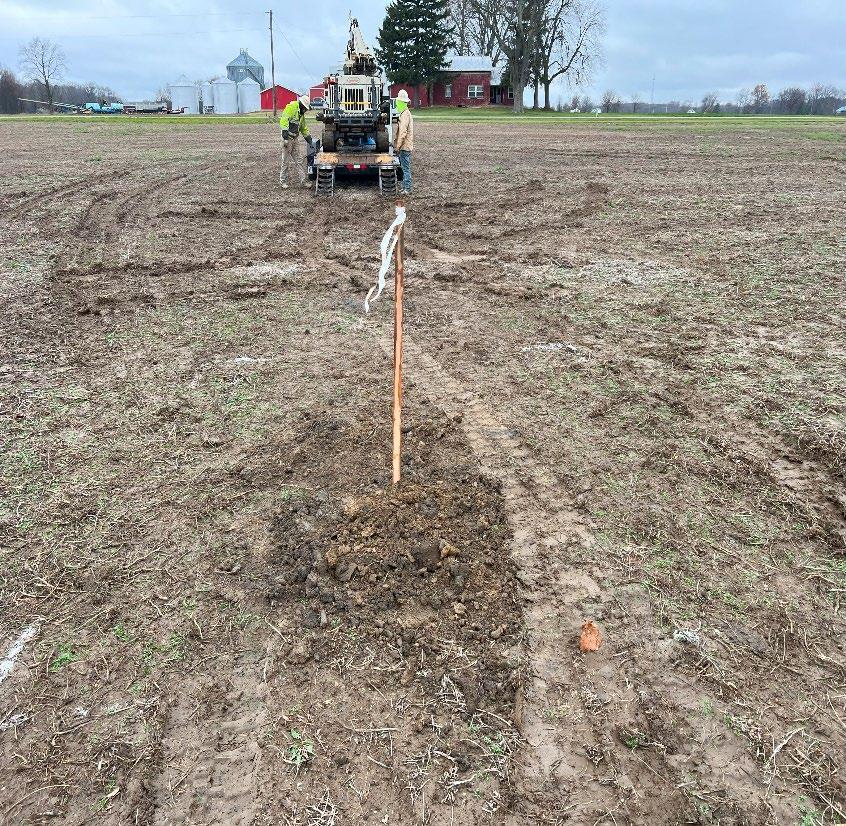
Preliminary characterization of the general subsurface conditions in the Project Area was undertaken with 8 soil borings and a laboratory program which are detailed in the Preliminary Geotechnical Investigation Memorandum in Appendix A. The drilling program was completed between January 15 and 16 and on November 22, 2024.The preliminary investigation provides the information required in OAC 4906-4-08(A)(5). Based upon the conditions observed during the field program, the subsurface conditions in the vicinity of the proposed photovoltaic panel areas can be described as a surficial agricultural till zone with a typical thickness of 3 to 12 inches overlying the native soil. The native subsurface conditions can generally be described as moist, medium stiff to hard lean clay soils with varying plasticity characteristics and sand fractions. In 6 of the 7 panel borings, a 1 to 7 foot thick medium dense to very dense, wet sand layer with varying amounts of fine-grained material or very stiff to hard, wet sandy silt was observed at depths between 7- to 13.0-feet, though the layer was only fully penetrated in B24-03. Groundwater was observed in each of the borings initially during drilling at depths between 10.0 to 14.0 feet beneath the ground surface within the sand layer. Final groundwater measurements at the end of drilling were between 3.0 and 6.5 feet beneath the ground surface in 4 of the 7 panel borings This indicates that groundwater is under a confined condition and will rise to a level in a borehole or well based on the confining pressure in the water producing stratum. Bedrock was not encountered.
In the vicinity of the proposed substation, the subsurface conditions can be described as moist, stiff to very stiff lean clay with sand to approximately 17.0 feet beneath the ground surface underlaid by medium dense to dense poorly graded sand with clay and trace amounts of gravel. Completely weathered bedrock was encountered at 43.5 feet. Auger refusal on possible bedrock was encountered at 47.0 feet. Groundwater was observed initially during drilling at 13.5 feet with a final measured water level of 3.0 feet at the end of the drilling.
6. Agency Interviews
Verdantas contacted the ODOT District 6 and Morrow County Engineer’s offices to inquire about their knowledge and experience of previous construction projects, subsurface conditions, and maintenance history within the Project Area. As of March 28, 2025, Verdantas has not received information from ODOT or the County Engineer’s office
Additionally, Verdantas reviewed ODOT’s Transportation Information Mapping System (TIMS) for available information near the Project Area. Maps that contained geotechnical information including geohazards and bore hole locations were reviewed, and there is no mapped information within the Project Area.
7. Geotechnical Discussion
7.1 Subsurface Conditions
The subsurface conditions observed in the borings were generally consistent with the geology and hydrogeology reviewed as part of the desktop study. Areas where shallow groundwater was observed or located near low lying mapped flood-prone areas may be susceptible to seasonal shallow groundwater or inundation conditions. Groundwater levels in the Study Area may be affected by seasonal and annual variations in precipitation and may be impacted by local and regional development.
7.2 PV Panel and Substation Foundations
Based on our review of the data and the subsurface conditions observed during the field program, Verdantas concludes that the Project Area is generally suitable for development of a solar project. In general, the development of utility scale solar project involves limited earthwork, which typically occurs during installation of access roads, collection lines, inverters, the substation, and spot grading. Based on the subsurface conditions, earthwork including grading and compaction may be accomplished utilizing typical large scale earthwork equipment. Rock excavation is not anticipated to be required during nominal grading activities or panel installation.
Several geotechnical borings exhibited thin saturated sand seams within the upper 10 to 15 feet. Relatively shallow mapped and observed groundwater should be considered as it relates to constructability of foundation systems and other site features. The fields currently have natural surface drainage that extends through or along the perimeter of the parcels. There are visual indications that some of these areas, namely to the north of the currently proposed substation, have poor surficial drainage (preventing active farming operations). During final design and construction of the Facility, Verdantas recommends that these natural drainage paths be maintained, and enhanced, to the extent feasible by minimizing grading in these areas, aligning access roads to avoid these swales, and/or including other design features to preserve the drainage conditions in the Project Area.
It is anticipated that driven steel piles installed into a soil stratum that generally consist of medium stiff or stiffer fine-grained soils or medium dense or denser coarse-grained soils are a suitable foundation system to support the PV panels and racking systems. Conditions on the eastern portion of the site appeared to be denser/stiff compared to the west portion, possibly increasing the effort of installing driven piles This condition may be further documented during later stages of geotechnical investigation upon further design development. Conditions such as shallow bedrock or boulders that would preclude driven pile installation were not observed within the explorations performed as part of this investigation. Lightly loaded ancillary structures in the panel areas can be founded on spread footings or pad foundations bearing on suitable native soil. Temporary construction phase dewatering may be required for shallow foundation excavations near the water table.
The subsurface conditions observed within preliminary explorations indicate that the site soils are suitable to support typical aggregate temporary construction roads along with permanent primary aggregate roads or secondary grass access roads. Depending on the construction season, subgrade stabilization may include the use of a geosynthetic as part of the pavement section or lime stabilization of the roadway subgrade.
The project substation will consist of various electrical infrastructure supported on a variety of foundations. It is anticipated that some of the structures within the substation which have large loads and/or are sensitive to movement will be supported on drilled shaft foundations. Due to the deeper wet, granular soils with low fines content within the substation vicinity, temporary casing and drilling fluid will likely be required if drilled shafts are proposed. Based on the limited exploration, it appears feasible to utilize drilled shaft foundations at the proposed substation location. Shallow foundations are considered suitable support for electrical equipment that is relatively light with minimal lateral loading at the substation. Temporary construction phase dewatering may be required for shallow foundation excavations near the water table.
7.3 Additional Geotechnical Evaluation
We recommend that a design level geotechnical investigation be completed in order to optimize the foundation design once the development of a layout and a grading plan has been finalized and the racking model is selected. The additional investigation may be performed to support final design and validate design assumptions. A design level investigation may include:
Test piles to evaluate and optimize pile embedment, pile installation production, axial capacity, lateral capacity, and establish a pile refusal protocol for the project. The test pile work plan should be developed based on the final racking design and foundation type. The work plan may include location, quantity, section(s), and target depth(s) of piles along with the proposed installation steps, testing documentation, loading application method(s), load steps and durations, and removal/disposal procedures.
Testing to evaluate characteristics of onsite material for handling, placement, and compaction for if specific cut or fill locations are proposed.
Additional investigation to optimize foundation design if heavily loaded structures are proposed at the substation or elsewhere onsite.
Additional investigation to optimize temporary or permanent access road pavement sections. The type, quantity, and location of the additional subsurface investigation should be chosen based on the final layout of the Facility. Additional boreholes or test pits from future investigations should be abandoned in accordance with applicable jurisdiction requirements.
8. Summary and Conclusions
Based on the information reviewed as part of the desktop study and the conditions encountered during the field investigation, it is our opinion that the Project Area is suitable for a utility scale solar project from a geological, hydrogeological, and geotechnical standpoint. Based on Verdantas’ knowledge of typical solar racking construction, it does not appear that the construction of the proposed solar project will have an impact on the local geology and/or hydrogeology of the Project Area. We offer the following conclusions:
The subsurface conditions observed in the borings were generally consistent with the regional geology and hydrogeology mapping and resources reviewed as part of the desktop study. Karst geology or topography was not identified;
Seismicity is not anticipated to significantly impact the project;
There are no 100-year floodplains located within the Study Area;
On-site delineation of streams and wetlands located within the Study Area has been conducted Construction within delineated areas will be limited to road crossings and collection lines and will be performed under appropriate permits and notifications.
There are no SWPAs located within the Project Area;
Given the depth of water wells located in the vicinity of the Project Area and the shallow nature of the planned construction activities, it is our opinion that the construction and operation of the Facility will not impact local public and private water supplies. Solar infrastructure will be placed at least 50 feet from the location of any known private water well within the Project Area. Based on sanitary isolation distances listed in OAC 3701-28-07 (J)
Table 1 an isolation distance of 50 feet is a conservative distance based on the solar field infrastructure;
ODNR recommends at minimum a 50-foot setback from each active oil and gas well and 25 feet from plugged oil and gas wells with at least 15-foot-wide access to the well; The oil and gas wells are not expected to cause an impediment to the Project;
There are no mapped abandoned underground or surface mines in the Project Area;
Based on the subsurface conditions and our experience with the development of solar facilities, the soils are expected to be suitable to support typical PV panel racking foundations and substation equipment foundations. Bedrock is not expected to be encountered at typical panel foundation depths. The shallow soils are suitable for grading and compaction. The site soils are suitable to support typical temporary construction road along with permanent primary aggregate roads or secondary grass access roads;
Natural drainage should be maintained through construction and long-term operation of the facility;
Relatively shallow mapped and observed groundwater should be considered as it relates to constructability of foundation systems and other site features;
A design level geotechnical evaluation with pile load testing is recommended to inform final design. The type, quantity, and location of the additional investigation should be chosen based on the final layout of the Facility.
9. Standard of Care
Verdantas has performed its services using that degree of care and skill ordinarily exercised under similar conditions by reputable members of its profession practicing in the same or similar locality at the time of service. No other warranty, expressed or implied, is made or intended by our proposal or by our oral or written reports. The work does not attempt to evaluate past or present compliance with federal, state, or local environmental or land use laws or regulations. Conclusions presented by Verdantas regarding the area within the Project Area are consistent with the Scope of Work, level of effort specified, and investigative techniques employed. Although soil quality has been inferred from the interpolation of the sampling data, you should explicitly note that subsurface conditions beyond the explorations are unknown. Reports, opinions, letters, and other documents do not evaluate the presence or absence of any condition not specifically analyzed and reported. Verdantas makes no guarantees regarding the completeness or accuracy of any information obtained from public or private files or information provided by subcontractors.
10. References
Ohio Department of Natural Resources. Water Well Database. Retrieved January 2025, from Division of Geological Survey website: https://waterwells.ohiodnr.gov/search/classic-search/home
Ohio Department of Natural Resources, Descriptions of Geologic Map Units. Retrieved February 2024a, from Division of Geological Survey website: http://geosurvey.ohiodnr.gov/portals/geosurvey/PDFs/Misc_State_Maps&Pubs/mapunits.pdf.
Ohio Department of Natural Resources. ODNR Mines of Ohio Viewer. Retrieved November 2024b, from website: https://gis.ohiodnr.gov/MapViewer/?config=OhioMines
Ohio Department of Natural Resources. Ohio Earthquake Epicenters. Retrieved February 2024, from Geographic Information Systems website: https://ohiodnr.gov/business-and-industry/services-tobusiness-industry/gis-mapping-services/earthquake-gis-mapping-service.
Ohio Department of Natural Resources. Ohio Geology Interactive Map. Retrieved November 2024a: Ohio Geology Interactive Map (ohiodnr.gov).
Ohio Division of Geological Survey, 1998, Physiographic regions of Ohio: Ohio Department of Natural Resources, Division of Geological Survey, page-size map with text, 2p., scale 1:2,100,000.
Ohio Division of Geological Survey, 2004, Shaded Drift-Thickness Map of Ohio: Ohio Department of Natural Resources, Division of Geological Survey Map SG-3, generalized page-size version with text, scale 1:2,000,000. [Revised 2017.]. Retrieved April 2024, from website: https://dam.assets.ohio.gov/image/upload/ohiodnr.gov/documents/geology/MiscMap_OhioShade dDriftThickness_2017.pdf
Ohio Division of Geological Survey, 2006, Bedrock Geologic Map of Ohio: Ohio Department of Natural Resources, Division of Geological Survey Map BG-1, generalized page-size version with text, 2 p., scale 1:2,000,000. Retrieved February 2024, from website: https://ohiodnr.gov/wps/wcm/connect/gov/af200770-8656-455b-b41b-ee19ef48ef45/BG1_8.5x11.pdf?MOD=AJPERES&CVID=ne.WWkh
Ohio Division of Geological Survey, rev. 2006, Ohio Karst Areas: Ohio Department of Natural Resources, Division of Geological Survey, page-size map with text, 2p., scale 1:2,000,000.
Ohio Division of Geological Survey, 2005, Glacial Map of Ohio: Ohio Department of Natural Resources, Division of Geological Survey, page-size map with text, 2p., scale 1:2,000,000. Retrieved February 2024, from website: https://ohiodnr.gov/static/documents/geology/MiscMap_OhioGlacialMap_2005.pdf.
Ohio Environmental Protection Agency. Drinking Water Source Protection Areas – Groundwater Public Water Systems. Retrieved February 2024, from website: https://oepa.maps.arcgis.com/apps/webappviewer/index.html?id=3b39e11ba7fc43c3b41801e358 0e6d21
Ohio Georeferenced Information Program, 2018, Drift Thickness of Ohio (ODNR-DGS). Retrieved March 2024, from website: https://ogripgeohio.opendata.arcgis.com/maps/1b2bf3c0c281427f98469999324bef69/explore?location=40.15 3651%2C-82.699450%2C8.53
Kostelnick, J., Richard, 1981, Ground-Water Resources of Morrow County, Ohio Department of Natural Resources, Division of Water.
United States Department of Agriculture, Web Soil Survey. Retrieved January 2025, from Natural Resources Conservation Service-site: https://websoilsurvey.nrcs.usda.gov/app/WebSoilSurvey.aspx
Figures
Figure 1 Project Area With Bedrock Geology And Topography
Figure 2 Structural And Seismic Features
Figure 3 Surface Water And Wetland Information
Figure 4 Floodplain
Figure 5 Aquifers And Wells
Figure 6 Soil Types
Figure 7 Underground And Surface Mines
Note: ODNR DGS Earthquake Epicenters were added to the map, but no features appear within the map extent.
The aerial photo was acquired through the Esri Imagery Web Service. Aerial
DISCLAIMER: Verdantas LLC has furnished this map to the Client for its sole and exclusive use as a preliminary planning and screening tool.This map is reproduced from geospatial information compiled from thirdparty sources which may change over time and are not accurate as to mapping, surveying or engineering standards. Verdantas LLC makes no representation or warranty as to the content, accuracy, timeliness or completeness of any information. In no event will Verdantas LLC, its owners, officers, employees or agents, be liable for damages of any kindarisingoutoftheuseofthis mapbyClientoranyotherparty.
Note: The aerial photo was acquired through the Esri
DISCLAIMER: Verdantas LLC has furnished this map to the Client for its sole and exclusive use as a preliminary planning and screening tool.This map is reproduced from geospatial information compiled from thirdparty sources which may change over time and are not accurate as to mapping, surveying or engineering standards. Verdantas LLC makes no representation or warranty as to the content, accuracy, timeliness or completeness of any information. In no event will Verdantas LLC, its owners, officers, employees or agents, be liable for damages of any kindarisingoutoftheuseofthis mapbyClientoranyotherparty.
Crossroads Solar Project - Project Area
Wetlands
Palustrine Emergent Marsh
Palustrine Forested
Imagery Web Service. Aerial photography dated 2022.
DISCLAIMER: Verdantas LLC has furnished this map to the Client for its sole and exclusive use as a preliminary planning and screening tool.This map is reproduced from geospatial information compiled from thirdparty sources which may change over time and are not accurate as to mapping, surveying or engineering standards. Verdantas LLC makes no representation or warranty as to the content, accuracy, timeliness or completeness of any information. In no event will Verdantas LLC, its owners, officers, employees or agents, be liable for damages of any kindarisingoutoftheuseofthis mapbyClientoranyotherparty.
Note: The aerial photo was acquired through the Esri Imagery Web Service. Aerial photography dated 2022.
DISCLAIMER: Verdantas LLC has furnished this map to the Client for its sole and exclusive use as a preliminary planning and screening tool.This map is reproduced from geospatial information compiled from thirdparty sources which may change over time and are not accurate as to mapping, surveying or engineering standards. Verdantas LLC makes no representation or warranty as to the content, accuracy, timeliness or completeness of any information. In no event will Verdantas LLC, its owners, officers, employees or agents, be liable for damages of any kindarisingoutoftheuseofthis mapbyClientoranyotherparty.
Appendix A
Preliminary Geotechnical Investigation
Memorandum
Date January 17, 2025
To Crossroads Solar, LLC
From Verdantas LLC
Subject Preliminary Geotechnical Investigation
Project Number 17120
This Preliminary Geotechnical Investigation Memorandum has been prepared for the Crossroads Solar Grazing Center (“Crossroads”). Crossroads is proposing to construct a combined utilityscale solar energy facility and sheep grazing facility in Cardington, Lincoln, and Westfield Townships in Morrow County, Ohio (the “Project” or the “Facility”). This Memorandum is intended to supplement the Verdantas Geology, Hydrogeology, and Preliminary Geotechnical Report prepared to satisfy the requirements of the Ohio Power Sitting Board (OPSB) Rule 4906-408(A)(5) of the Ohio Administrative Code.
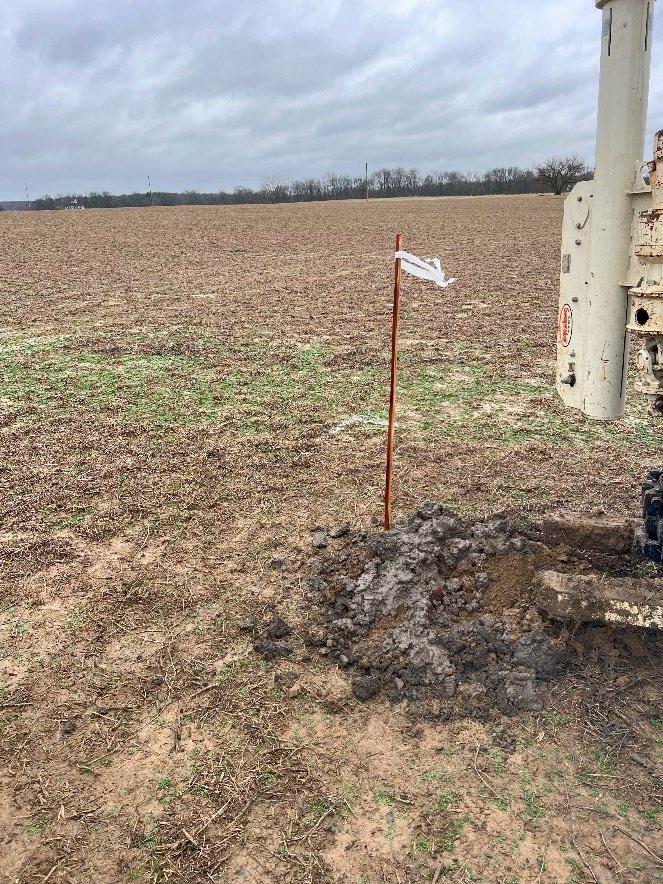
Field Programs
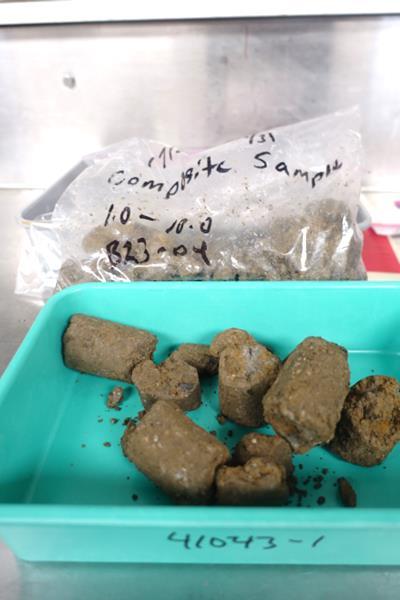
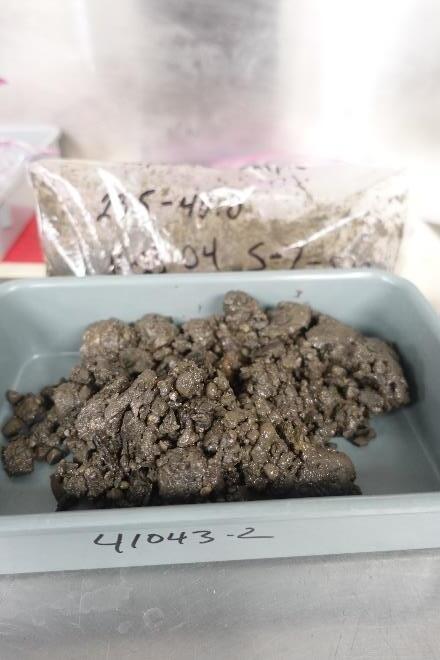
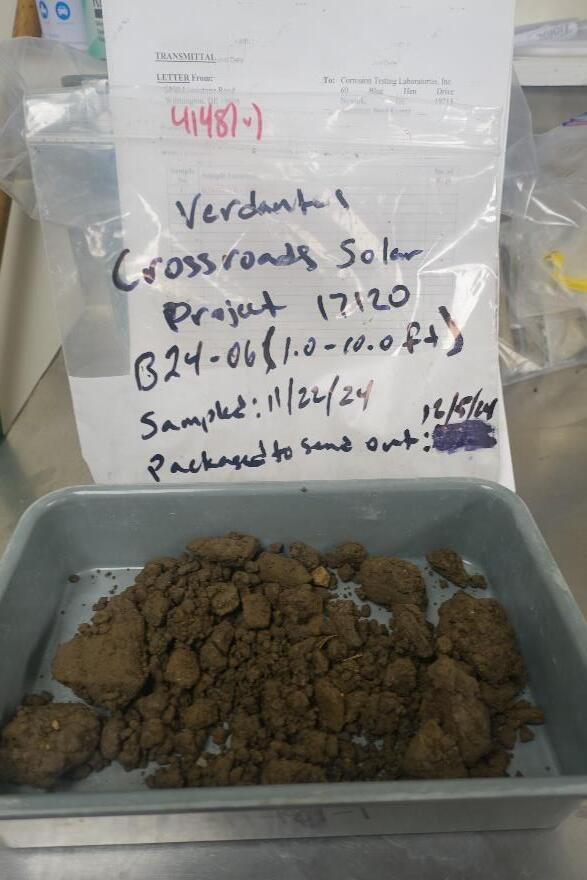
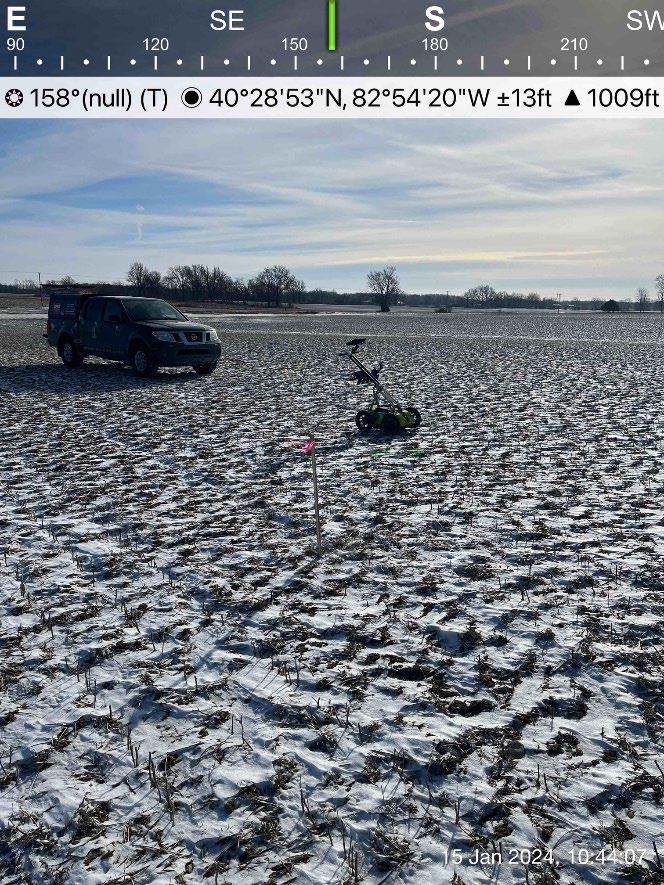
On January 15 and 16, and November 22, 2024, 8 soil borings designated B24-01 to B24-08 were advanced at the site to depths ranging between 13.9 and 47.0 feet beneath existing grade. Exploration locations are presented as the enclosed Figure 1. The field sampling locations and access were selected by Verdantas based on our understanding of the proposed construction at the time of the sampling and were approved by the client and property owners. Prior to the field program, an Ohio 8-1-1 request was submitted by our drilling subcontractor to delineate public utilities in the vicinity of the explorations. Additionally, surface utility scanning with noninvasive methods was performed by GPRS, Inc. at each of the exploration locations prior to drilling. Explorations were advanced in areas accessible to the equipment and clear of marked utilities. The borings were advanced by Envirocore, as a subcontractor to Verdantas, utilizing a track mounted Mobile B-57 or Geoprobe 7822DT drill rig and 2.25- or 3.25-inch inner diameter hollow stem augers. Upon completion, borings were backfilled with auger cuttings and bentonite chips. Standard Penetration Testing was performed with a 2-inch outer diameter split spoon in general accordance with ASTM D1586. Soil samples were returned to Verdantas for review and laboratory test assignment. A tabulated summary of the borings along with boring logs have been enclosed.
Laboratory Testing Program
Geotechnical laboratory testing was performed on representative soil samples. Testing included moisture content, percent passing No. 200 sieve, particle size distribution, Atterberg limits, and corrosion indicator testing (electrical resistivity, pH, sulfates, sulfides, and chlorides). Select test results are included on the enclosed boring logs. Tabulated and individual results are also enclosed.
Site Exploration Map
Boring Logs
Test Boring Summary - Crossroads Solar Grazing Center
Soil Description: Brown, clumpy soil with pebbles.
as-received (Ω-cm) 20,000
Resistivity
soil/water paste (Ω-cm) 3,500
pH 7.3
Chloride (mg/kg) 9.0
Sulfate (mg/kg) 12
Sulfide (yes/trace/no) no
1. CTL specimen 41481-1
3 of 4
Figure
General Notes
GENERAL NOTES
VERDANTAS LLC uses the following definitions and terminology to classify and correlate the field and laboratory samples.
VISUAL UNIFIED CLASSIFICATIONS: The soil samples are described by color, major constituent, modifiers (by percentage), and density (or consistency). Coarse Grained or Granular Soils have more than 50% of their dry weight retained on a No. 200 sieve; they are described as: boulders, cobbles, gravel or sand. Fine Grained Soils have less than 50% of their dry weight retained on a No. 200 sieve; they are described as: clays or clayey silts if they are cohesive and silts if they are noncohesive. In addition to gradation, granular soils are defined on the basis of their relative in-place density and fine grained soils on the basis of their strength or consistency and their plasticity. The Unified Soil Classification symbols are:
COARSE GRAINED SOILS
GW - Well graded gravels
GP - Poorly graded gravels
GM - Silty gravels
GC - Clayey gravels
SW - Well graded sands
SP - Poorly graded sands
SM - Silty sands
SC - Clayey sands
SIZE DESCRIPTION
F - Fine
M - Medium
C - Coarse
G - Gravel
COLOR
Or - Orange
Blk - Black
Yel - Yellow Gr – Gray
Br - Brown R - Red
DENSITY: COARSE GRAINED SOILS
Very loose 4 blows/ft or less
Loose 5 to 10 blows/ft
Medium 11 to 30 blows/ft
Dense 31 to 50 blows/ft
Very Dense 51 blows/ft or more
WH/WOH Weight of hammer advanced sampler
WR/WOR Weight of drilling rods advanced sampler
FINE GRAINED SOILS
ML - Silts of low plasticity
CL - Clays of low to medium plasticity
OL - Organic silt clays of low plasticity
MH - Silts of high plasticity
CH - Clays of high plasticity
OH - Organic silt clays of high plasticity
PT - Peat and highly organic
MODIFIERS (PERCENTAGE)
Tr - Trace 1 - 10
Ltl - Little 11 - 20
Sm - Some 21 - 35
& - And 36 - 50%
Vc - Varicolored
Dk - Dark
Lt - Light
CONSISTENCY: FINE GRAINED SOILS
Very soft 2 blows/ft or less
Soft 3 to 4 blows/ft
Medium 5 to 8 blows/ft
Stiff 9 to 15 blows/ft
Very stiff 16 to 30 blows/ft
Hard 31 blows/ft or more
NOTE: The Standard Penetration Test "N" value is the number of blows per foot of a 140-pound hammer falling 30 inches to advance a 2 inch outside-diameter split spoon sampler between the 6 and 18 inch penetration interval with no corrections applied, except where otherwise noted.
Appendix B
ODNR Coordination Letter
March 1, 2024
Emily Ott Verdantas
4 Hemisphere Way Bedford, Ohio 44146
Re: 24-0184_Crossroads Solar Project
Project: The proposed project involves the installation of a utility-scale solar facility.
Location: The proposed project is located in Cardington, Lincoln and Westfield townships, Morrow County, Ohio.
The Ohio Department of Natural Resources (ODNR) has completed a review of the above referenced project. These comments were generated by an inter-disciplinary review within the Department These comments have been prepared under the authority of the Fish and Wildlife Coordination Act (48 Stat 401, as amended; 16 U.S.C. 661 et seq.), the National Environmental Policy Act, the Coastal Zone Management Act, Ohio Revised Code and other applicable laws and regulations These comments are also based on ODNR’s experience as the state natural resource management agency and do not supersede or replace the regulatory authority of any local, state, or federal agency nor relieve the applicant of the obligation to comply with any local, state, or federal laws or regulations.
Real Estate and Land Management: The Office of Real Estate and Land Management (REALM) has the following comments.
The ODNR Recommended Requirements for Proposed Solar Energy Facilities in Ohio should be incorporated into the project design and site development plan. This guidance document was developed by multiple Divisions within the Ohio Department of Natural Resources. The guidance document is nonexhaustive and project recommendations are made on a site-specific basis and may include additional considerations. The document utilizes the Ohio Solar Pollinator Habitat Planning and Assessment Form. The incorporation of these conditions will help ensure that the project will result in the minimum adverse environmental impact.
Natural Heritage Database: A review of the Ohio Natural Heritage Database indicates there are no records of state or federally listed plants or animals within one mile of the specified project area. Records searched date from 1980.
Please note that Ohio has not been completely surveyed and we rely on receiving information from many sources Therefore, a lack of records for any particular area is not a statement that rare species or unique features are absent from that area
Fish and Wildlife: The Division of Wildlife (DOW) has the following comments.
The DOW recommends that impacts to streams, wetlands and other water resources be avoided and minimized to the fullest extent possible, and that Best Management Practices be utilized to minimize erosion and sedimentation.
The entire state of Ohio is within the range of the Indiana bat (Myotis sodalis), a state endangered and federally endangered species, the northern long-eared bat (Myotis septentrionalis), a state endangered and federally endangered species, the little brown bat (Myotis lucifugus), a state endangered species, and the tricolored bat (Perimyotis subflavus), a state endangered species During the spring and summer (April 1 through September 30), these species of bats predominately roost in trees behind loose, exfoliating bark, in crevices and cavities, or in the leaves However, these species are also dependent on the forest structure surrounding roost trees If trees are present within the project area, and trees must be cut, the DOW recommends cutting only occur from October 1 through March 31, conserving trees with loose, shaggy bark and/or crevices, holes, or cavities, as well as trees with DBH ≥ 20 if possible If trees are present within the project area, and trees must be cut during the summer months, the DOW recommends a mist net survey or acoustic survey be conducted from June 1 through August 15, prior to any cutting Mist net and acoustic surveys should be conducted in accordance with the most recent version of the “OHIO DIVISION OF WILDLIFE GUIDANCE FOR BAT SURVEYS AND TREE CLEARING” . If state listed bats are documented, DOW recommends cutting only occur from October 1 through March 31. However, limited summer tree cutting may be acceptable after consultation with the DOW (contact Eileen Wyza at Eileen.Wyza@dnr.ohio.gov).
The DOW also recommends that a desktop habitat assessment is conducted, followed by a field assessment if needed, to determine if a potential hibernaculum is present within the project area. Direction on how to conduct habitat assessments can be found in the current USFWS “RANGE-WIDE INDIANA BAT & NORTHERN LONG-EARED BAT SURVEY GUIDELINES.” If a habitat assessment finds that a potential hibernaculum is present within 0.25 miles of the project area, please send this information to Eileen Wyza for project recommendations. If a potential or known hibernaculum is found, the DOW recommends a 0.25-mile tree cutting and subsurface disturbance buffer around the hibernaculum entrance, however, limited summer or winter tree cutting may be acceptable after consultation with the DOW. If no tree cutting or subsurface impacts to a hibernaculum are proposed, this project is not likely to impact these species.
The project is within the range of the Iowa darter (Etheostoma exile), a state endangered fish, and the lake chubsucker (Erimyzon sucetta), a state threatened fish. The DOW recommends no in-water work in perennial streams from March 15 through June 30 to reduce impacts to indigenous aquatic species and their habitat If no in-water work is proposed in a perennial stream, this project is not likely to impact these or other aquatic species.
The project is within the range of the northern harrier (Circus hudsonius), a state endangered bird This is a common migrant and winter species Nesters are much rarer, although they occasionally breed in large marshes and grasslands. Harriers often nest in loose colonies The female builds a nest out of sticks on the ground, often on top of a mound. Harriers hunt over grasslands If this type of habitat will be impacted, construction should be avoided in this habitat during the species’ nesting period of April 15 through July 31 If this habitat will not be impacted, the project is not likely to impact this species.
Due to the potential of impacts to federally listed species, as well as to state listed species, we recommend that this project be coordinated with the US Fish & Wildlife Service.
Thank you for affording us the opportunity to comment.
Geological Survey: The Division of Geological Survey has the following comments.
Impacts on Public and Private Water Supplies
The project area is in Cardington, Lincoln, and Westfield townships, Morrow County. The groundwater vulnerability in the project area ranges from 106-131 with the highest ratings on the west side of the project area in Westfield Township (Nelson and Others, 2022). This equates to a moderate susceptibility rating (OEPA,2014). The construction of this facility is not expected to pose a significant groundwater contamination risk.
Groundwater Inventory
Bedrock aquifer yields are limited throughout the project area. The underlying bedrock aquifer beneath the project area is the Ohio Shale, which yields up to five gallons per minute (Kostelnick, 1981, Ohio Department of Natural Resources, Division of Water, Bedrock Aquifer Map, 2000) Wells may also be developed within the unconsolidated Powell End Moraine Aquifer Yields in the Powel End Moraine Aquifer range from 5 to 25 gallons per minute (Ohio Department of Natural Resources, Division of Water, Statewide Unconsolidated Aquifer Map, 2000). ODNR has record of 72 water wells within one mile of the project area. Thirty-seven of these wells are completed in the unconsolidated sand-and-gravel aquifer, while thirty-five wells are completed in the underlying bedrock aquifer (Ohio Department of Natural Resources, Division of Geological Survey, Ohio Water Wells). The construction of the facility is not expected to have significant impacts on private well yields.
Oil, Gas and Mining
There are 319 oil and gas well heads within one mile of the proposed project area. There are 14 oil and gas well heads located within the bounds of the project area. Six of these wells are listed as plugged and abandoned, three are listed as final restoration, two are actively producing and three are listed with an expired permit with an unknown status (Ohio Department of Natural Resources, Division of Oil and Gas, Ohio Oil and Gas Wells Locator).
There is no record of mining within one mile of the project area (Ohio Department of Natural Resources, Division of Mineral Resources, Mines of Ohio).
Geohazards
ODNR has no record of earthquakes within 15-miles of the project area (Ohio Department of Natural Resources, Division of Geological Survey, Ohio Earthquake Epicenters).
Karst
Karst features usually form in areas that are covered by thin or no glacial drift and the bedrock is limestone or dolomite. In this area the bedrock is made of significant deposits of shale with no underlying limestone. ODNR has no record of any sinkholes listed within five miles of the study area (Ohio Department of Natural Resources, Division of Geological Survey, Ohio Karst).
Drift Thickness and Bedrock Geology
Drift thickness is variable throughout the proposed project area. Drift thickness ranges from 13 to 54 feet (Powers and Swinford, 2004).
The underling bedrock geology in this area is composed of the Ohio Shale (Slucher et al., 2006).
Soils
The primary soils within the project area are Blount, Pewamo, and Glynwood. Together these soils make up over 91 percent of the project area. These soils are derived from alluvium, lacustrine deposits, outwash, and till. Shrink-swell potential in these soils is moderate. The Pewamo soil is a hydric soil which is frequently ponded from December to May (Gehring and others, 1993, USDA Web Soil Survey). Hydric soils produce and anerobic environment which may speed up the corrosion of certain materials.
Water Resources: The Division of Water Resources has the following comment.
The local floodplain administrator should be contacted concerning the possible need for any floodplain permits or approvals for this project
ODNR appreciates the opportunity to provide these comments. Please contact Mike Pettegrew at mike.pettegrew@dnr ohio.gov if you have questions about these comments or need additional information
Mike Pettegrew
Environmental Services Administrator
SUMMARY OF ODNR DATABASE SURVEY DATA FOR PRIVATE WATER WELLS AND OIL AND GAS WELLS WITHIN 1-MILE OF THE PROJECT AREA AND WITHIN THE PROJECT AREA
1. ODNR GIS database of oil and gas wells and private water wells. TABLE B1
CROSSROADS SOLAR GRAZING CENTER, MORROW COUNTY, OHIO
ODNR Query of ODNR Database (March 2024)1 Verdantas Query of ODNR Database (April 2025)1
Drinking Water Source Protection Areas and Sole Source Aquifers near the Crossroads Solar Project Area Cardington, Lincoln, Westfield Townships, Morrow County
E
Custom Soil Resource Report for Morrow County, Ohio
Appendix
United States Department of Agriculture
Natural Resources Conservation Service
A product of the National Cooperative Soil Survey, a joint effort of the United States Department of Agriculture and other Federal agencies, State agencies including the Agricultural Experiment Stations, and local participants
Custom Soil Resource Report for Morrow County, Ohio
Preface
Soil surveys contain information that affects land use planning in survey areas. They highlight soil limitations that affect various land uses and provide information about the properties of the soils in the survey areas. Soil surveys are designed for many different users, including farmers, ranchers, foresters, agronomists, urban planners, community officials, engineers, developers, builders, and home buyers. Also, conservationists, teachers, students, and specialists in recreation, waste disposal, and pollution control can use the surveys to help them understand, protect, or enhance the environment.
Various land use regulations of Federal, State, and local governments may impose special restrictions on land use or land treatment. Soil surveys identify soil properties that are used in making various land use or land treatment decisions. The information is intended to help the land users identify and reduce the effects of soil limitations on various land uses. The landowner or user is responsible for identifying and complying with existing laws and regulations.
Although soil survey information can be used for general farm, local, and wider area planning, onsite investigation is needed to supplement this information in some cases. Examples include soil quality assessments (http://www.nrcs.usda.gov/wps/ portal/nrcs/main/soils/health/) and certain conservation and engineering applications. For more detailed information, contact your local USDA Service Center (https://offices.sc.egov.usda.gov/locator/app?agency=nrcs) or your NRCS State Soil Scientist (http://www.nrcs.usda.gov/wps/portal/nrcs/detail/soils/contactus/? cid=nrcs142p2_053951).
Great differences in soil properties can occur within short distances. Some soils are seasonally wet or subject to flooding. Some are too unstable to be used as a foundation for buildings or roads. Clayey or wet soils are poorly suited to use as septic tank absorption fields. A high water table makes a soil poorly suited to basements or underground installations.
The National Cooperative Soil Survey is a joint effort of the United States Department of Agriculture and other Federal agencies, State agencies including the Agricultural Experiment Stations, and local agencies. The Natural Resources Conservation Service (NRCS) has leadership for the Federal part of the National Cooperative Soil Survey.
Information about soils is updated periodically. Updated information is available through the NRCS Web Soil Survey, the site for official soil survey information.
The U.S. Department of Agriculture (USDA) prohibits discrimination in all its programs and activities on the basis of race, color, national origin, age, disability, and where applicable, sex, marital status, familial status, parental status, religion, sexual orientation, genetic information, political beliefs, reprisal, or because all or a part of an individual's income is derived from any public assistance program. (Not all prohibited bases apply to all programs.) Persons with disabilities who require
alternative means for communication of program information (Braille, large print, audiotape, etc.) should contact USDA's TARGET Center at (202) 720-2600 (voice and TDD). To file a complaint of discrimination, write to USDA, Director, Office of Civil Rights, 1400 Independence Avenue, S.W., Washington, D.C. 20250-9410 or call (800) 795-3272 (voice) or (202) 720-6382 (TDD). USDA is an equal opportunity provider and employer.
Blg1A1—Blount silt loam, ground moraine, 0 to 2 percent
Blg1B1—Blount silt loam, ground moraine, 2 to 4 percent slopes
GaB—Gallman silt loam, loamy substratum, 2 to 6 percent slopes
Gwg1B1—Glynwood silt loam, ground moraine, 2 to 6 percent slopes
Gwg5C2—Glynwood clay loam, ground moraine, 6 to 12 percent
How Soil Surveys Are Made
Soil surveys are made to provide information about the soils and miscellaneous areas in a specific area. They include a description of the soils and miscellaneous areas and their location on the landscape and tables that show soil properties and limitations affecting various uses. Soil scientists observed the steepness, length, and shape of the slopes; the general pattern of drainage; the kinds of crops and native plants; and the kinds of bedrock. They observed and described many soil profiles. A soil profile is the sequence of natural layers, or horizons, in a soil. The profile extends from the surface down into the unconsolidated material in which the soil formed or from the surface down to bedrock. The unconsolidated material is devoid of roots and other living organisms and has not been changed by other biological activity.
Currently, soils are mapped according to the boundaries of major land resource areas (MLRAs). MLRAs are geographically associated land resource units that share common characteristics related to physiography, geology, climate, water resources, soils, biological resources, and land uses (USDA, 2006). Soil survey areas typically consist of parts of one or more MLRA.
The soils and miscellaneous areas in a survey area occur in an orderly pattern that is related to the geology, landforms, relief, climate, and natural vegetation of the area. Each kind of soil and miscellaneous area is associated with a particular kind of landform or with a segment of the landform. By observing the soils and miscellaneous areas in the survey area and relating their position to specific segments of the landform, a soil scientist develops a concept, or model, of how they were formed. Thus, during mapping, this model enables the soil scientist to predict with a considerable degree of accuracy the kind of soil or miscellaneous area at a specific location on the landscape.
Commonly, individual soils on the landscape merge into one another as their characteristics gradually change. To construct an accurate soil map, however, soil scientists must determine the boundaries between the soils. They can observe only a limited number of soil profiles. Nevertheless, these observations, supplemented by an understanding of the soil-vegetation-landscape relationship, are sufficient to verify predictions of the kinds of soil in an area and to determine the boundaries.
Soil scientists recorded the characteristics of the soil profiles that they studied. They noted soil color, texture, size and shape of soil aggregates, kind and amount of rock fragments, distribution of plant roots, reaction, and other features that enable them to identify soils. After describing the soils in the survey area and determining their properties, the soil scientists assigned the soils to taxonomic classes (units). Taxonomic classes are concepts. Each taxonomic class has a set of soil characteristics with precisely defined limits. The classes are used as a basis for comparison to classify soils systematically. Soil taxonomy, the system of taxonomic classification used in the United States, is based mainly on the kind and character of soil properties and the arrangement of horizons within the profile. After the soil
scientists classified and named the soils in the survey area, they compared the individual soils with similar soils in the same taxonomic class in other areas so that they could confirm data and assemble additional data based on experience and research.
The objective of soil mapping is not to delineate pure map unit components; the objective is to separate the landscape into landforms or landform segments that have similar use and management requirements. Each map unit is defined by a unique combination of soil components and/or miscellaneous areas in predictable proportions. Some components may be highly contrasting to the other components of the map unit. The presence of minor components in a map unit in no way diminishes the usefulness or accuracy of the data. The delineation of such landforms and landform segments on the map provides sufficient information for the development of resource plans. If intensive use of small areas is planned, onsite investigation is needed to define and locate the soils and miscellaneous areas.
Soil scientists make many field observations in the process of producing a soil map. The frequency of observation is dependent upon several factors, including scale of mapping, intensity of mapping, design of map units, complexity of the landscape, and experience of the soil scientist. Observations are made to test and refine the soil-landscape model and predictions and to verify the classification of the soils at specific locations. Once the soil-landscape model is refined, a significantly smaller number of measurements of individual soil properties are made and recorded. These measurements may include field measurements, such as those for color, depth to bedrock, and texture, and laboratory measurements, such as those for content of sand, silt, clay, salt, and other components. Properties of each soil typically vary from one point to another across the landscape.
Observations for map unit components are aggregated to develop ranges of characteristics for the components. The aggregated values are presented. Direct measurements do not exist for every property presented for every map unit component. Values for some properties are estimated from combinations of other properties.
While a soil survey is in progress, samples of some of the soils in the area generally are collected for laboratory analyses and for engineering tests. Soil scientists interpret the data from these analyses and tests as well as the field-observed characteristics and the soil properties to determine the expected behavior of the soils under different uses. Interpretations for all of the soils are field tested through observation of the soils in different uses and under different levels of management. Some interpretations are modified to fit local conditions, and some new interpretations are developed to meet local needs. Data are assembled from other sources, such as research information, production records, and field experience of specialists. For example, data on crop yields under defined levels of management are assembled from farm records and from field or plot experiments on the same kinds of soil.
Predictions about soil behavior are based not only on soil properties but also on such variables as climate and biological activity. Soil conditions are predictable over long periods of time, but they are not predictable from year to year. For example, soil scientists can predict with a fairly high degree of accuracy that a given soil will have a high water table within certain depths in most years, but they cannot predict that a high water table will always be at a specific level in the soil on a specific date.
After soil scientists located and identified the significant natural bodies of soil in the survey area, they drew the boundaries of these bodies on aerial photographs and
identified each as a specific map unit. Aerial photographs show trees, buildings, fields, roads, and rivers, all of which help in locating boundaries accurately.
Soil Map
The soil map section includes the soil map for the defined area of interest, a list of soil map units on the map and extent of each map unit, and cartographic symbols displayed on the map. Also presented are various metadata about data used to produce the map, and a description of each soil map unit.
Area of Interest (AOI)
Soils
MAP LEGEND
Area of Interest (AOI)
Soil Map Unit Polygons
Soil Map Unit Lines
Soil Map Unit Points
Special Point Features Blowout
Borrow Pit
Clay Spot
Closed Depression
Gravel Pit
Gravelly Spot
Landfill
Lava Flow
Marsh or swamp
Mine or Quarry
Miscellaneous Water
Perennial Water
Rock Outcrop
Saline Spot
Sandy Spot
Severely Eroded Spot
Sinkhole
Slide or Slip
Sodic Spot
and Canals
Highways
MAP INFORMATION
The soil surveys that comprise your AOI were mapped at 1:15,800.
Please rely on the bar scale on each map sheet for map measurements.
Source of Map: Natural Resources Conservation Service Web Soil Survey URL: Coordinate System: Web Mercator (EPSG:3857)
Maps from the Web Soil Survey are based on the Web Mercator projection, which preserves direction and shape but distorts distance and area. A projection that preserves area, such as the Albers equal-area conic projection, should be used if more accurate calculations of distance or area are required.
This product is generated from the USDA-NRCS certified data as of the version date(s) listed below.
Soil Survey Area: Morrow County, Ohio Survey Area Data: Version 23, Aug 28, 2024
Soil map units are labeled (as space allows) for map scales 1:50,000 or larger.
Date(s) aerial images were photographed: May 21, 2023—Aug 8, 2023
The orthophoto or other base map on which the soil lines were compiled and digitized probably differs from the background imagery displayed on these maps. As a result, some minor shifting of map unit boundaries may be evident.
Map Unit Legend
Blount silt loam, ground moraine, 0 to 2 percent slopes
Blount silt loam, ground moraine, 2 to 4 percent slopes
Gallman silt loam, loamy substratum, 2 to 6 percent slopes
Glynwood silt loam, ground moraine, 2 to 6 percent slopes
So Sloan silty clay loam, sandy substratum, occasionally flooded
Map Unit Descriptions
The map units delineated on the detailed soil maps in a soil survey represent the soils or miscellaneous areas in the survey area. The map unit descriptions, along with the maps, can be used to determine the composition and properties of a unit.
A map unit delineation on a soil map represents an area dominated by one or more major kinds of soil or miscellaneous areas. A map unit is identified and named according to the taxonomic classification of the dominant soils. Within a taxonomic class there are precisely defined limits for the properties of the soils. On the landscape, however, the soils are natural phenomena, and they have the characteristic variability of all natural phenomena. Thus, the range of some observed properties may extend beyond the limits defined for a taxonomic class. Areas of soils of a single taxonomic class rarely, if ever, can be mapped without including areas of other taxonomic classes. Consequently, every map unit is made up of the soils or miscellaneous areas for which it is named and some minor components that belong to taxonomic classes other than those of the major soils. Most minor soils have properties similar to those of the dominant soil or soils in the map unit, and thus they do not affect use and management. These are called noncontrasting, or similar, components. They may or may not be mentioned in a particular map unit description. Other minor components, however, have properties
and behavioral characteristics divergent enough to affect use or to require different management. These are called contrasting, or dissimilar, components. They generally are in small areas and could not be mapped separately because of the scale used. Some small areas of strongly contrasting soils or miscellaneous areas are identified by a special symbol on the maps. If included in the database for a given area, the contrasting minor components are identified in the map unit descriptions along with some characteristics of each. A few areas of minor components may not have been observed, and consequently they are not mentioned in the descriptions, especially where the pattern was so complex that it was impractical to make enough observations to identify all the soils and miscellaneous areas on the landscape.
The presence of minor components in a map unit in no way diminishes the usefulness or accuracy of the data. The objective of mapping is not to delineate pure taxonomic classes but rather to separate the landscape into landforms or landform segments that have similar use and management requirements. The delineation of such segments on the map provides sufficient information for the development of resource plans. If intensive use of small areas is planned, however, onsite investigation is needed to define and locate the soils and miscellaneous areas.
An identifying symbol precedes the map unit name in the map unit descriptions. Each description includes general facts about the unit and gives important soil properties and qualities.
Soils that have profiles that are almost alike make up a soil series. Except for differences in texture of the surface layer, all the soils of a series have major horizons that are similar in composition, thickness, and arrangement.
Soils of one series can differ in texture of the surface layer, slope, stoniness, salinity, degree of erosion, and other characteristics that affect their use. On the basis of such differences, a soil series is divided into soil phases. Most of the areas shown on the detailed soil maps are phases of soil series. The name of a soil phase commonly indicates a feature that affects use or management. For example, Alpha silt loam, 0 to 2 percent slopes, is a phase of the Alpha series.
Some map units are made up of two or more major soils or miscellaneous areas. These map units are complexes, associations, or undifferentiated groups.
A complex consists of two or more soils or miscellaneous areas in such an intricate pattern or in such small areas that they cannot be shown separately on the maps. The pattern and proportion of the soils or miscellaneous areas are somewhat similar in all areas. Alpha-Beta complex, 0 to 6 percent slopes, is an example.
An association is made up of two or more geographically associated soils or miscellaneous areas that are shown as one unit on the maps. Because of present or anticipated uses of the map units in the survey area, it was not considered practical or necessary to map the soils or miscellaneous areas separately. The pattern and relative proportion of the soils or miscellaneous areas are somewhat similar. Alpha-Beta association, 0 to 2 percent slopes, is an example.
An undifferentiated group is made up of two or more soils or miscellaneous areas that could be mapped individually but are mapped as one unit because similar interpretations can be made for use and management. The pattern and proportion of the soils or miscellaneous areas in a mapped area are not uniform. An area can be made up of only one of the major soils or miscellaneous areas, or it can be made up of all of them. Alpha and Beta soils, 0 to 2 percent slopes, is an example.
Some surveys include miscellaneous areas. Such areas have little or no soil material and support little or no vegetation. Rock outcrop is an example.
Morrow County, Ohio
Blg1A1—Blount silt loam, ground moraine, 0 to 2 percent slopes
Map Unit Setting
National map unit symbol: 2skcv
Elevation: 700 to 1,300 feet
Mean annual precipitation: 34 to 42 inches
Mean annual air temperature: 48 to 54 degrees F
Frost-free period: 140 to 180 days
Farmland classification: Prime farmland if drained
Map Unit Composition
Blount, ground moraine, and similar soils: 85 percent
Minor components: 15 percent
Estimates are based on observations, descriptions, and transects of the mapunit.
Description of Blount, Ground Moraine
Setting
Landform: Ground moraines on till plains
Landform position (two-dimensional): Footslope
Landform position (three-dimensional): Interfluve
Down-slope shape: Linear
Across-slope shape: Linear
Parent material: Wisconsin till derived from limestone and shale
Typical profile
Ap - 0 to 10 inches: silt loam
Bt - 10 to 33 inches: silty clay
BC - 33 to 39 inches: clay loam
Cd - 39 to 79 inches: clay loam
Properties and qualities
Slope: 0 to 2 percent
Depth to restrictive feature: 31 to 54 inches to densic material
Drainage class: Somewhat poorly drained
Runoff class: High
Capacity of the most limiting layer to transmit water (Ksat): Low to moderately high (0.01 to 0.20 in/hr)
Depth to water table: About 6 to 12 inches
Frequency of flooding: None
Frequency of ponding: None
Calcium carbonate, maximum content: 35 percent
Maximum salinity: Nonsaline to very slightly saline (0.0 to 2.0 mmhos/cm)
Available water supply, 0 to 60 inches: Moderate (about 6.2 inches)
Interpretive groups
Land capability classification (irrigated): None specified
Land capability classification (nonirrigated): 2w
Hydrologic Soil Group: D
Ecological site: F111XB502IN - Wet Till Ridge
Hydric soil rating: No
Minor Components
Pewamo, ground moraine
Percent of map unit: 9 percent
Landform: Ground moraines on till plains
Landform position (two-dimensional): Toeslope
Landform position (three-dimensional): Base slope
Down-slope shape: Linear
Across-slope shape: Linear, concave
Ecological site: F111XB501IN - Till Depression
Hydric soil rating: Yes
Glynwood, ground moraine
Percent of map unit: 6 percent
Landform: Ground moraines on till plains
Landform position (two-dimensional): Shoulder, backslope
Landform position (three-dimensional): Side slope, nose slope
Down-slope shape: Convex
Across-slope shape: Linear
Ecological site: F111XE503IN - Till Ridge
Hydric soil rating: No
Blg1B1—Blount silt loam, ground moraine, 2 to 4 percent slopes
Map Unit Setting
National map unit symbol: 2s1j6
Elevation: 700 to 1,300 feet
Mean annual precipitation: 34 to 42 inches
Mean annual air temperature: 48 to 54 degrees F
Frost-free period: 140 to 180 days
Farmland classification: Prime farmland if drained
Map Unit Composition
Blount, ground moraine, and similar soils: 85 percent
Minor components: 15 percent
Estimates are based on observations, descriptions, and transects of the mapunit.
Description of Blount, Ground Moraine
Setting
Landform: Ground moraines on till plains
Landform position (two-dimensional): Summit, backslope
Landform position (three-dimensional): Interfluve
Down-slope shape: Linear
Across-slope shape: Linear
Parent material: Wisconsin till derived from limestone and shale
Typical profile
Ap - 0 to 9 inches: silt loam
Bt - 9 to 32 inches: silty clay
BC - 32 to 37 inches: clay loam
Cd - 37 to 79 inches: clay loam
Properties and qualities
Slope: 2 to 4 percent
Depth to restrictive feature: 30 to 54 inches to densic material
Drainage class: Somewhat poorly drained
Runoff class: High
Capacity of the most limiting layer to transmit water (Ksat): Low to moderately high (0.01 to 0.20 in/hr)
Depth to water table: About 6 to 12 inches
Frequency of flooding: None
Frequency of ponding: None
Calcium carbonate, maximum content: 35 percent
Maximum salinity: Nonsaline to very slightly saline (0.0 to 2.0 mmhos/cm)
Available water supply, 0 to 60 inches: Low (about 5.6 inches)
Interpretive groups
Land capability classification (irrigated): None specified
Land capability classification (nonirrigated): 2e
Hydrologic Soil Group: D
Ecological site: F111XB502IN - Wet Till Ridge
Hydric soil rating: No
Minor
Components
Pewamo, ground moraine
Percent of map unit: 9 percent
Landform: Ground moraines on till plains
Landform position (two-dimensional): Toeslope
Landform position (three-dimensional): Base slope
Down-slope shape: Linear
Across-slope shape: Concave
Ecological site: F111XB501IN - Till Depression
Hydric soil rating: Yes
Glynwood, ground moraine
Percent of map unit: 6 percent
Landform: Ground moraines on till plains
Landform position (two-dimensional): Shoulder, backslope
Landform position (three-dimensional): Side slope, nose slope
Down-slope shape: Convex
Across-slope shape: Linear
Ecological site: F111XE503IN - Till Ridge
Hydric soil rating: No
Map Unit Setting
National map unit symbol: 5q87
Elevation: 800 to 900 feet
GaB—Gallman silt loam, loamy substratum, 2 to 6 percent slopes
Mean annual precipitation: 30 to 42 inches
Mean annual air temperature: 48 to 55 degrees F
Frost-free period: 140 to 180 days
Farmland classification: All areas are prime farmland
Map Unit Composition
Gallman and similar soils: 85 percent
Minor components: 15 percent
Estimates are based on observations, descriptions, and transects of the mapunit.
The Soil Reports section includes various formatted tabular and narrative reports (tables) containing data for each selected soil map unit and each component of each unit. No aggregation of data has occurred as is done in reports in the Soil Properties and Qualities and Suitabilities and Limitations sections. The reports contain soil interpretive information as well as basic soil properties and qualities. A description of each report (table) is included.
Soil Erosion
This folder contains a collection of tabular reports that present soil erosion factors and groupings. The reports (tables) include all selected map units and components for each map unit. Soil erosion factors are soil properties and interpretations used in evaluating the soil for potential erosion. Example soil erosion factors can include K factor for the whole soil or on a rock free basis, T factor, wind erodibility group and wind erodibility index.
Conservation Planning
This report provides those soil attributes for the conservation plan for the map units in the selected area. The report includes the map unit symbol, the component name, and the percent of the component in the map unit. It provides the soil description along with the slope, runoff, T Factor, WEI, WEG, Erosion class, Drainage class, Land Capability Classification, and the engineering Hydrologic Group and the erosion factors Kf, the representative percentage of fragments, sand, silt, and clay in the mineral surface horizon. Missing surface data may indicate the presence of an organic surface layer. Further information on these factors can be found in the National Soil Survey Handbook section 618 found at the url http:// www.nrcs.usda.gov/wps/portal/nrcs/detail/soils/ref/?cid=nrcs142p2_054223#00 .
Soil properties and interpretations for conservation planning. The surface mineral horizon properties are displayed. Organic surface horizons are not displayed.
Map symbol and soil name
Blg1A1—Blount silt loam, ground moraine, 0 to 2 percent slopes
Conservation Planning–Morrow County, Ohio
Blg1B1—Blount silt loam, ground moraine, 2 to 4 percent slopes
ground
GaB—Gallman silt loam, loamy substratum, 2 to 6
slopes
Gwg1B1—Glynwood silt loam, ground moraine, 2 to 6 percent slopes
American Association of State Highway and Transportation Officials (AASHTO). 2004. Standard specifications for transportation materials and methods of sampling and testing. 24th edition.
American Society for Testing and Materials (ASTM). 2005. Standard classification of soils for engineering purposes. ASTM Standard D2487-00.
Cowardin, L.M., V. Carter, F.C. Golet, and E.T. LaRoe. 1979. Classification of wetlands and deep-water habitats of the United States. U.S. Fish and Wildlife Service FWS/OBS-79/31.
Federal Register. July 13, 1994. Changes in hydric soils of the United States.
Federal Register. September 18, 2002. Hydric soils of the United States.
Hurt, G.W., and L.M. Vasilas, editors. Version 6.0, 2006. Field indicators of hydric soils in the United States.
National Research Council. 1995. Wetlands: Characteristics and boundaries.
Soil Survey Division Staff. 1993. Soil survey manual. Soil Conservation Service. U.S. Department of Agriculture Handbook 18. http://www.nrcs.usda.gov/wps/portal/ nrcs/detail/national/soils/?cid=nrcs142p2_054262
Soil Survey Staff. 1999. Soil taxonomy: A basic system of soil classification for making and interpreting soil surveys. 2nd edition. Natural Resources Conservation Service, U.S. Department of Agriculture Handbook 436. http:// www.nrcs.usda.gov/wps/portal/nrcs/detail/national/soils/?cid=nrcs142p2_053577
Soil Survey Staff. 2010. Keys to soil taxonomy. 11th edition. U.S. Department of Agriculture, Natural Resources Conservation Service. http:// www.nrcs.usda.gov/wps/portal/nrcs/detail/national/soils/?cid=nrcs142p2_053580
Tiner, R.W., Jr. 1985. Wetlands of Delaware. U.S. Fish and Wildlife Service and Delaware Department of Natural Resources and Environmental Control, Wetlands Section.
United States Army Corps of Engineers, Environmental Laboratory. 1987. Corps of Engineers wetlands delineation manual. Waterways Experiment Station Technical Report Y-87-1.
United States Department of Agriculture, Natural Resources Conservation Service. National forestry manual. http://www.nrcs.usda.gov/wps/portal/nrcs/detail/soils/ home/?cid=nrcs142p2_053374
United States Department of Agriculture, Natural Resources Conservation Service. National range and pasture handbook. http://www.nrcs.usda.gov/wps/portal/nrcs/ detail/national/landuse/rangepasture/?cid=stelprdb1043084
United States Department of Agriculture, Natural Resources Conservation Service. National soil survey handbook, title 430-VI. http://www.nrcs.usda.gov/wps/portal/ nrcs/detail/soils/scientists/?cid=nrcs142p2_054242
United States Department of Agriculture, Natural Resources Conservation Service. 2006. Land resource regions and major land resource areas of the United States, the Caribbean, and the Pacific Basin. U.S. Department of Agriculture Handbook 296. http://www.nrcs.usda.gov/wps/portal/nrcs/detail/national/soils/? cid=nrcs142p2_053624
United States Department of Agriculture, Soil Conservation Service. 1961. Land capability classification. U.S. Department of Agriculture Handbook 210. http:// www.nrcs.usda.gov/Internet/FSE_DOCUMENTS/nrcs142p2_052290.pdf
Appendix F
Project Area Reconnaissance Photographs
Geology, Hydrogeology, and Preliminary Geotechnical Report
Project Area Reconnaissance Photographs Jan-24 Crossroads Solar Grazing Center
Project Number: 17078
17078.0003
Morrow County, Ohio
17078.0003.xlsx
PHOTO 1: Shot facing south from Waldo Fulton Chesterville Road just east of B23-03.
PHOTO 2: Picture looking southeast from the area between B23-04 and B23-05.
Geology, Hydrogeology, and Preliminary Geotechnical Report
Crossroads Solar Grazing Center Jan-24
Project Area Reconnaissance Photographs
Morrow County, Ohio
Project Number: 17078
17078.0003
17078.0003.xlsx
PHOTO 3: Picture of Geotech boring location B23-01.
PHOTO 4: Picture of Geotech boring location B23-02.