
TECHNICAL REPORT
Engineering Offices: 5096 N Silver Cloud Drive St. George, UT 84770 USA 703-303-0341
www.hesslernoise.com
Title: Existing Conditions Background Sound Survey and Noise Impact Assessment
Project: Crossroads Solar Grazing Center
Location: Morrow County, OH
Prepared For: Crossroads Solar I, LLC
Prepared By: David M. Hessler, P.E.
Issue Date: August 18, 2025
Reference No: TR-2210-040225-C
Attachments: Graphic A Ambient Survey Measurement Positions
Table T-2210-041825-A Transformer and Inverter Sound Power Level Derivations
Plot 1-A Project Sound Emissions Contour Map – Daytime – Project Area Detail
Plot 1-B Project Sound Emissions Contour Map – Daytime – Overall Study Area
Plot 2 Project Sound Emissions Contour Map – Nighttime
1.0 Introduction
A study has been carried out to evaluate the sound emissions from the proposed Crossroads Solar Grazing Center (the Project) located just south of Cardington in Morrow County, Ohio in order to quantitatively evaluate any potential community noise issues. Compared to other types of power generation facilities, possible noise impacts from a photovoltaic solar energy project are relatively few, relatively mild and, moreover, have the unusual characteristic of essentially occurring only during the daylight hours when noise is much less likely to be an issue in the first place. In this case, any possible concerns about noise are largely confined to the step-up transformer in the proposed substation, the electrical inverters within the various solar panel fields and some shortlived activities during construction. In an effort to methodically evaluate the potential impact of the Project on the surrounding community, a field survey was conducted to establish the existing levels of background sound within the site area so that projections of future Project sound could be evaluated within an appropriate context. This report summarizes the findings from that field survey and discusses the potential noise impacts associated with the Project.

1.1 Executive Summary
A field survey of the existing ambient sound levels within the Project area was carried out in November of 2024 to quantify the baseline environmental conditions. Three monitoring stations distributed over the Project area, recorded continuously day and night for 4.5 days. All statistical measures were generally consistent and followed the same trends at all positions despite being separated by distances of up to 1 mile. This indicates that the average measured level from all three test points would be reasonably representative of any specific location within the Project area.
Current regulations state that the sound emissions from a renewable energy project cannot exceed the existing L50 background level by more than 5 dBA or an absolute level of 40 dBA, whichever is greater. The site-wide average daytime L50 from all three test points was 35 dBA, which puts the Project noise limit at 40 dBA during the day.
At night the Project is essentially idle and silent, but some sound is possible from the substation transformers. The average nighttime L50 of 30 dBA measured at Position 2 near the substation area would ostensibly point to a noise limit of 35 dBA, but the minimum level of 40 dBA would take precedence. Hence the operational sound emissions from the Project are limited to 40 dBA or less at all non-participating residences irrespective of time of day.
A noise model of the site was subsequently developed to evaluate how the Project sound levels will compare to the 40 dBA limit. The model inputs are the sound power levels of the main stepup transformer in the proposed substation and the inverters, which are distributed throughout the panel arrays. In order to quantify the maximum operational sound emissions from the Project on a sunny day, the sound power level of the substation transformers was conservatively calculated at 99 dBA re 1 pW from its maximum expected rating of 110 MVA ONAF2, which represents a hot summer day operating scenario where the radiator fans are on in high speed mode. This is most likely a rare operating configuration occurring only during unusually hot conditions. The inverter make and model for this project will be finalized at a later stage,but a likely/representative candidate is the Power Electronics Model HEM FS4200 MU. The sound power level spectrum of thisinvertermodelwasderivedfromdetailedfieldmeasurementsofasimilarModelHEMFS3430 MU unit in actual operation with a scale-up factor added to account for the size differential. An effective sound power level of 94 dBA re 1 pW was used for each unit.
The maximum daytime sound level due to Project operation is expected to be at or below the 40 dBA design goal at all non-participating residences.
The predicted Project sound levels at nearby non-participating residences are mostly in the 30’s dBA, which is comparable to the existing daytime L50 ambient sound level. This suggests that
any sound emissions from the Project will likely be inconsequential, if not inaudible, at residences in the Project area.
Although solar energy projects are operational only during the day, the substation transformer remains energized at night and may potentially be used in reactive compensation mode that assists with grid stability. Using a conservative operating level of 13 MVA to derive the transformer sound emissions, extremely low sound levels well below the nominal design target of 40 dBA, are calculated at the nearest homes to the substation at night. In fact, the expected levels are so quiet in absolute terms that no disturbance is anticipated, if the substation is even audible at all. While the inverters are minimally active during reactive compensation, the level of operation is a tiny fraction of that during normal operation; consequently, the sound emissions are expected to be negligible.
In contrast to other forms of power generation, the sound emissions from construction activities on a solar project are expected to be dramatically lower in both magnitude and duration. Some unavoidable disturbance is possible when the mounting posts are driven in, but this activity will be fairly short-lived in any particular location. Other sounds from trenching, road building and material delivery will also be brief in duration and will progress from place to place avoiding prolonged exposure at any specific location. Exposure to construction noise is also limited by regulation to the daytime hours and to an even shorter time window for piling and the possible use of hoe rams.
In general, the potential noise impacts from all aspects of the Project are expected to be minimal.
2.0 Existing Conditions Sound Survey
In order to quantitatively evaluate the potential noise impact of the Project, sound monitoring equipment was set up at three locations distributed over the Project area to measure the existing baseline ambient sound level for later comparison to the predicted sound levels from the substation and other equipment Unless very low in absolute terms, generally at or below 40 dBA, the potential noise impact from any project is normally a function of how much its sound exceeds the background level that would otherwise exist. The survey was carried out over a 4.5 day period from noon on November 14th through November 18th, 2024 using continuously recording sound monitors in general accordance with ANSI S12.9-R2013 Quantities and Procedures for Description and Measurement of Environmental Sound. Part 2: Measurement of Long-term, Wide-Area Sound.
2.1 Measurement Locations
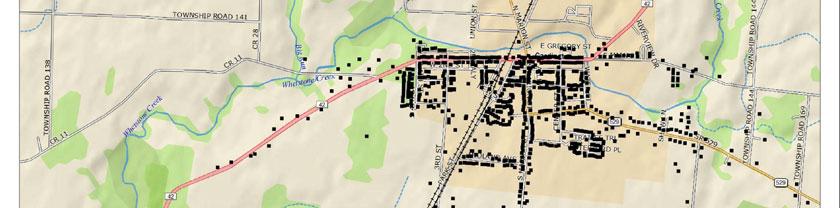
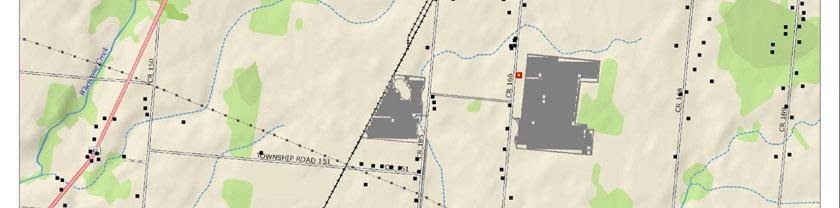
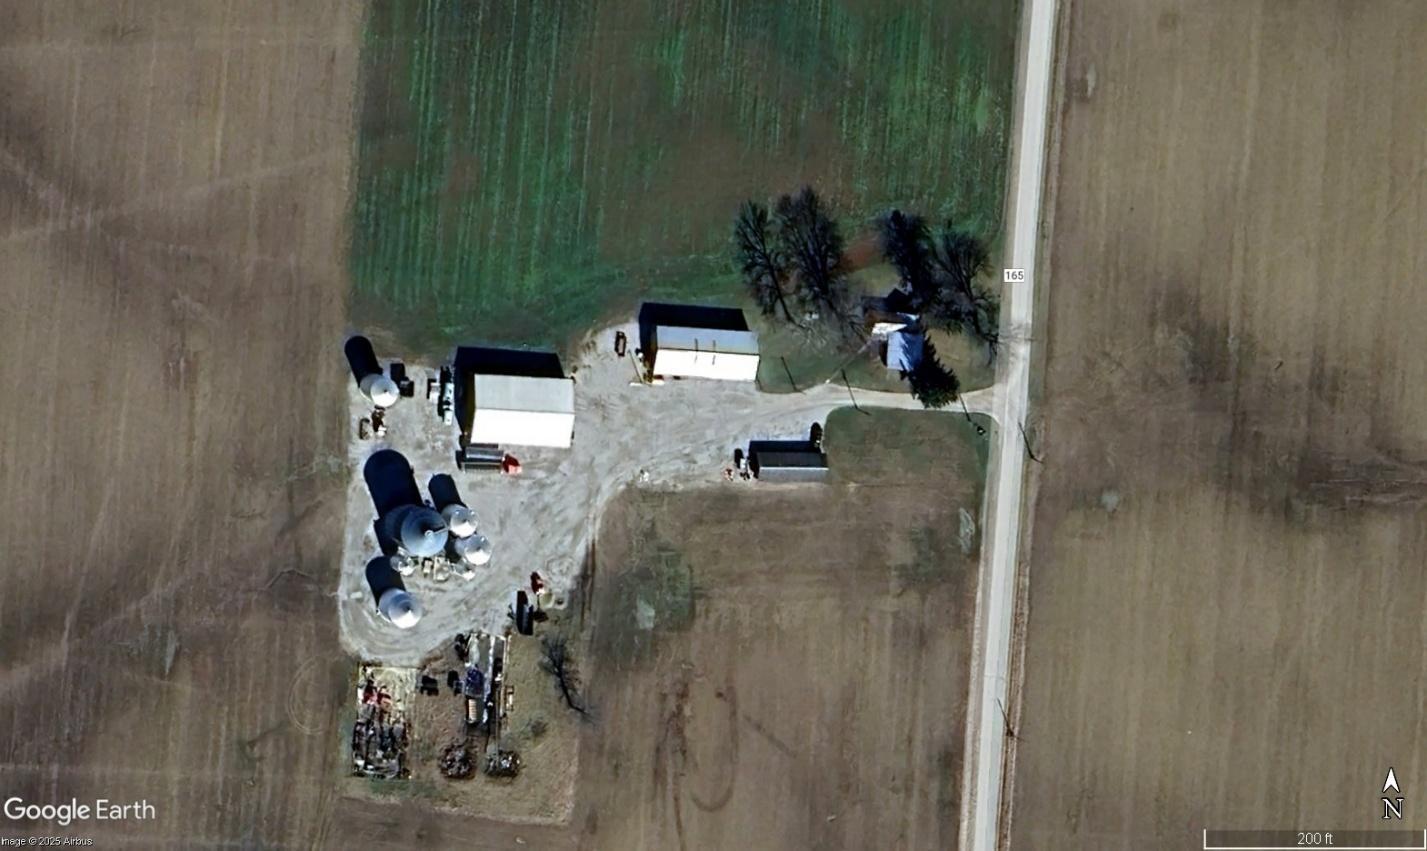
Three measurement locations, illustrated in Graphic A, were selected as being representative of the Project layout, which essentially consists of a large, main area supplemented by two smaller parcels to the north. Two monitoring stations were used within the main area and a third was set
up to capture conditions at the separate sections to the north. Each location is described in further detail below.
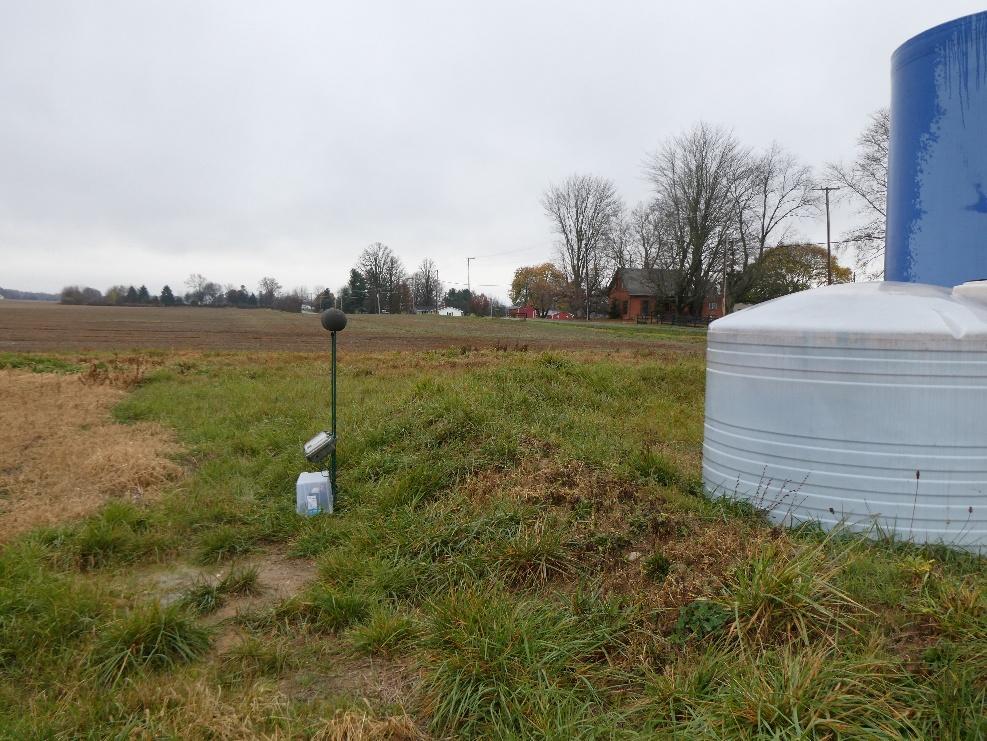
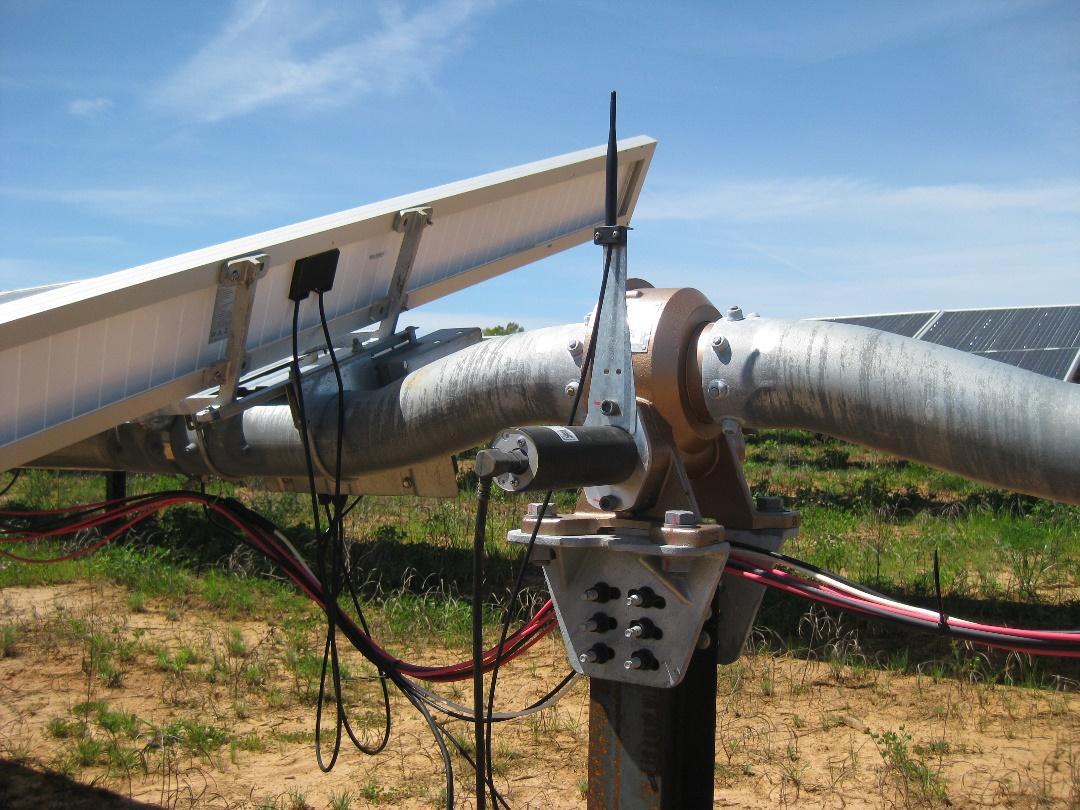
Figure 2.1.1 is an aerial view of Position 1 and its surroundings and Figures 2.1.2 and 2.1.3 show the instrumentation set up on the edge of large field behind the house. Two monitors were used at all positions simply for redundancy.
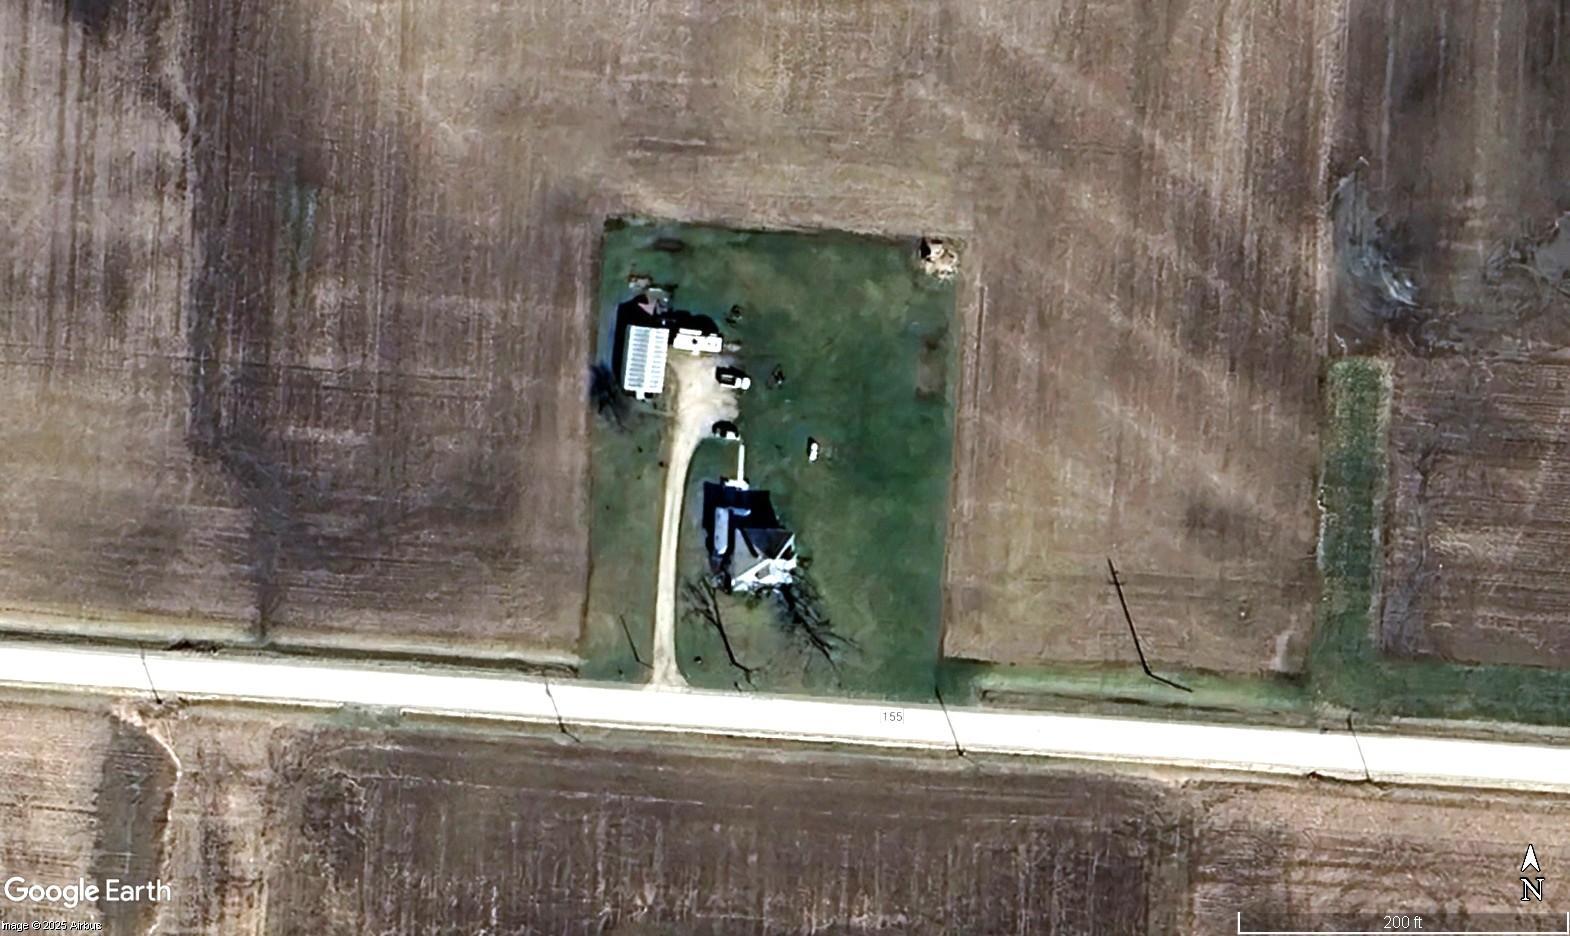

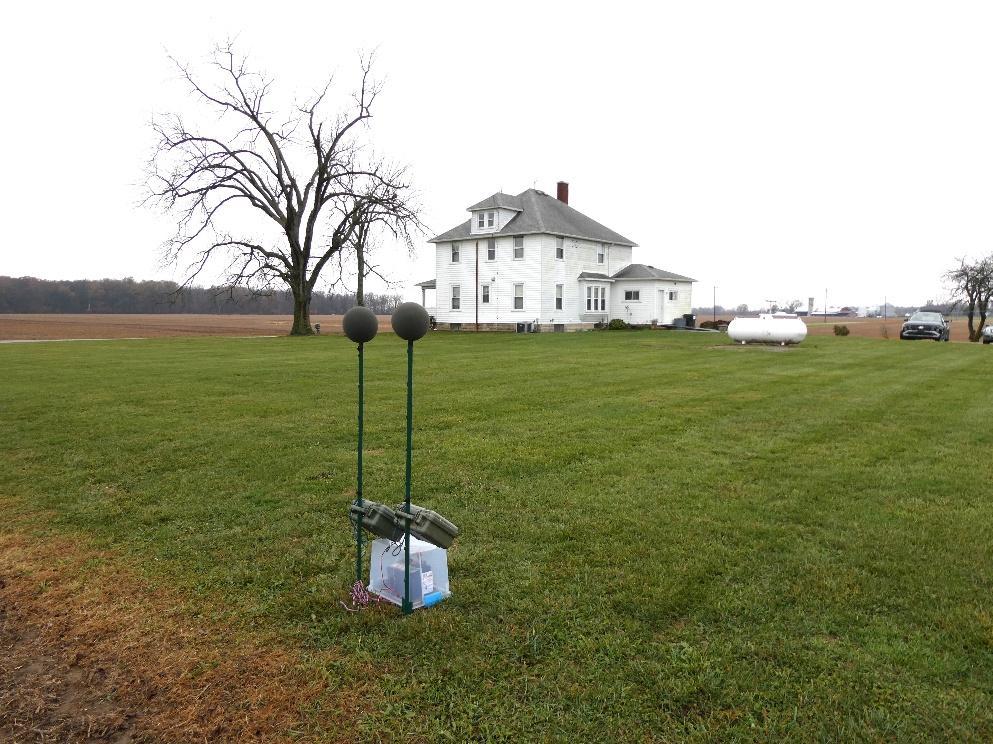
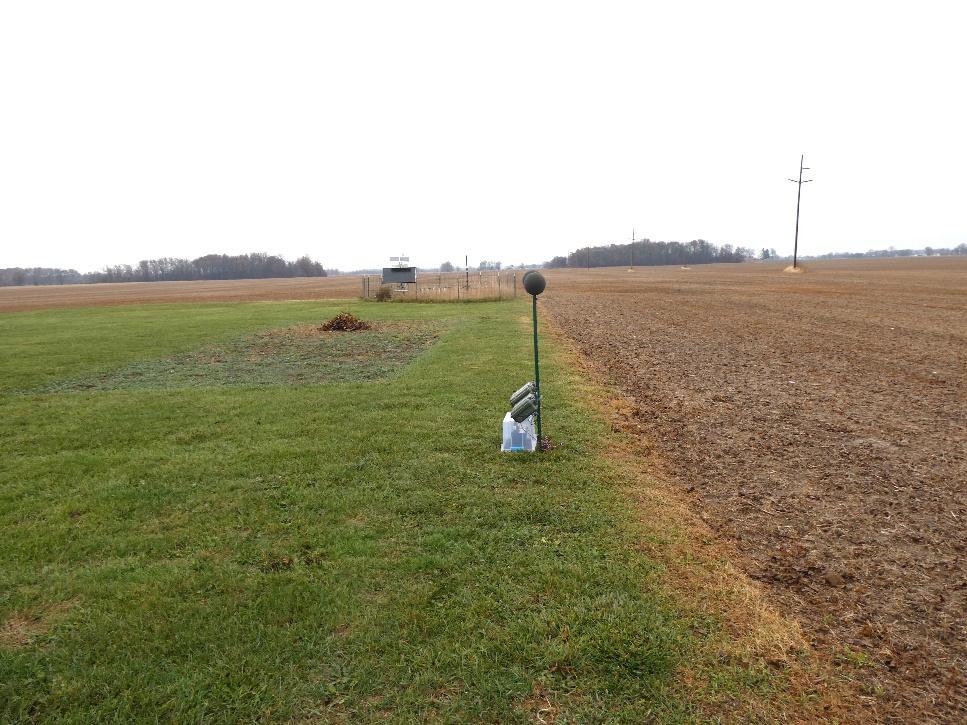
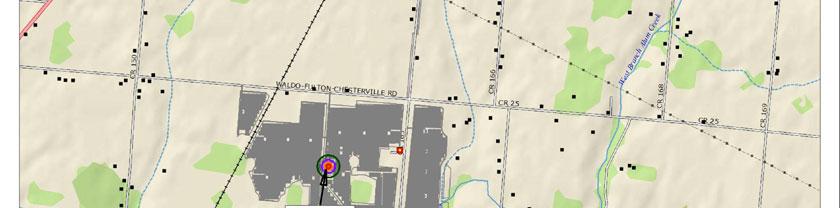
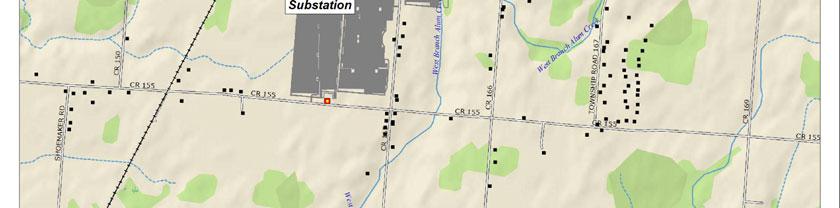
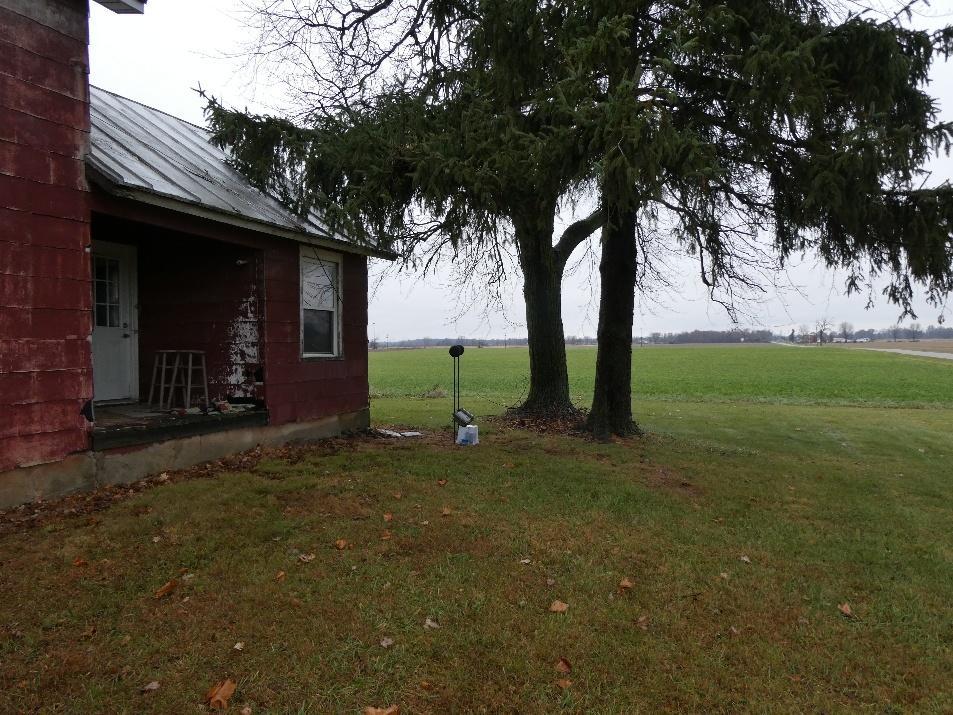
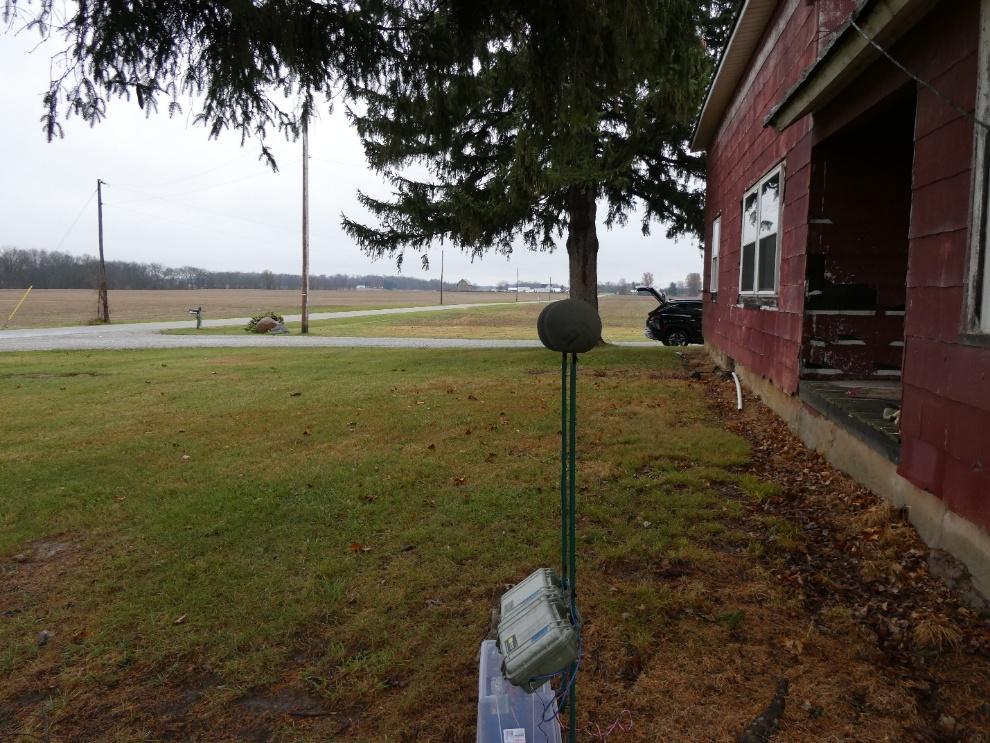
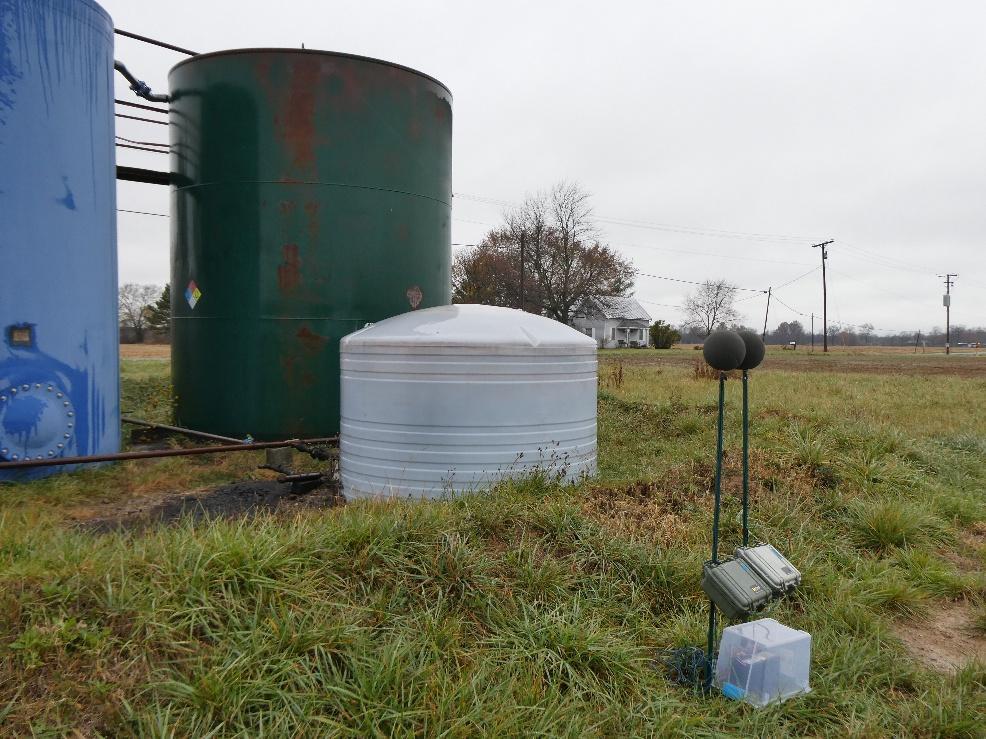
Figure 2.1.4 shows Position 2, which was at a participating, but currently unoccupied, residence within the main project area. Because some noise from the farming activities behind the house
was audible during the setup, the instruments were located on the far side of the house, using it to purposely block out most of this local contamination, which was not perceptible at the setup position. The monitors were placed close to but diagonally opposite the northeast corner of the house to minimize any possible reflections off the walls, as shown in Figure 2.1.5.

shows Position 3 and its surroundings.
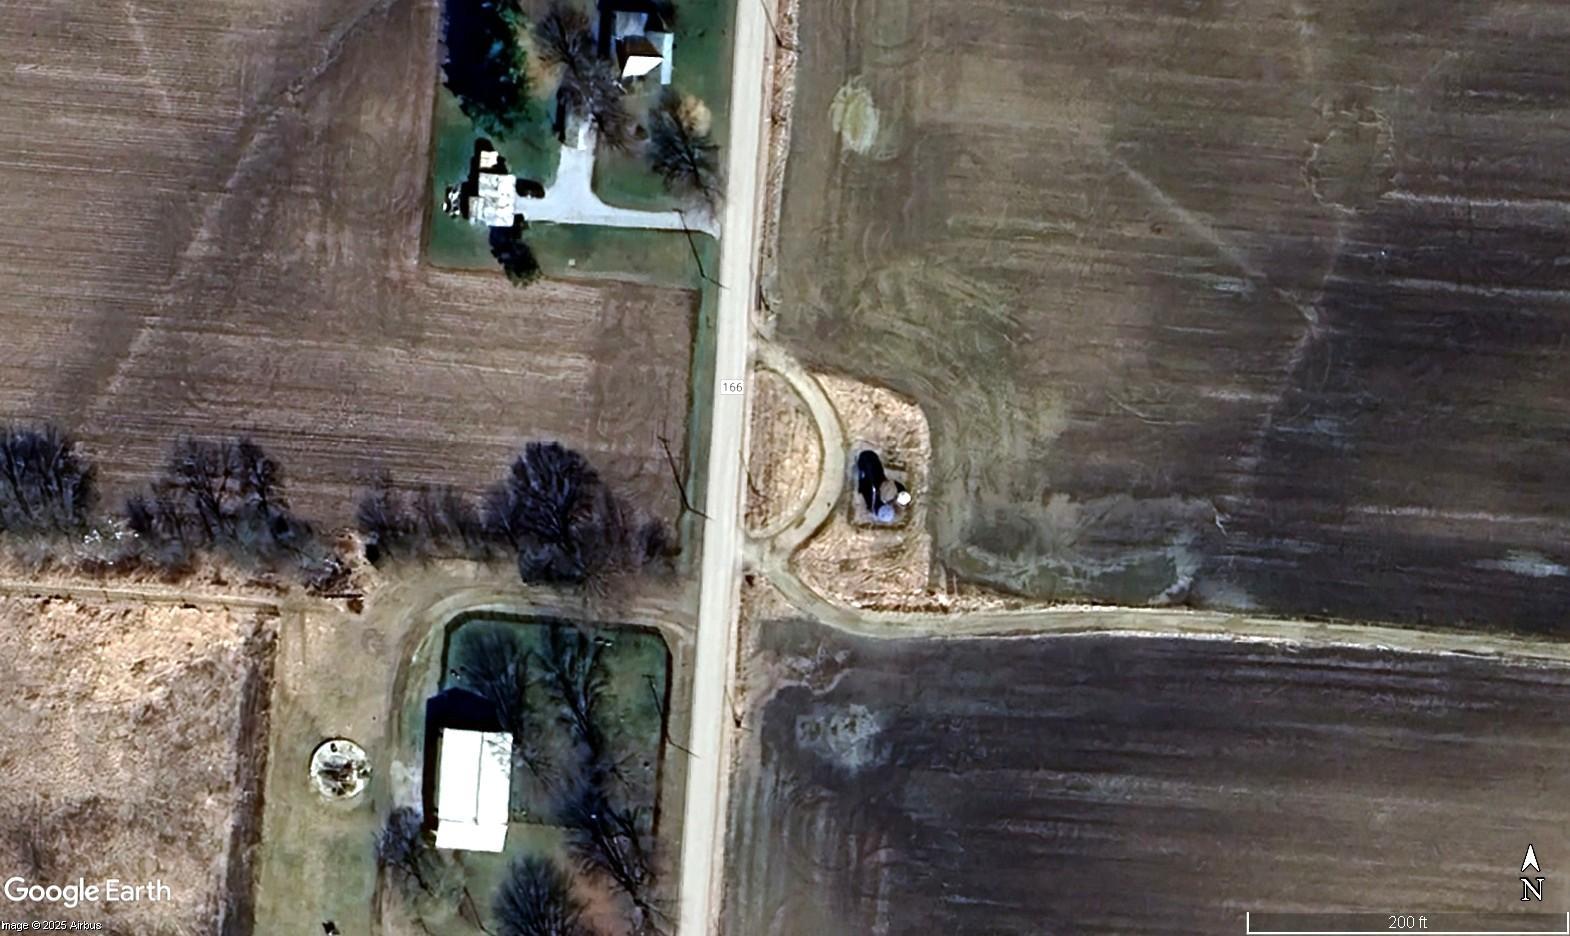
2.1.9 Position 3 Looking NW towards 3422 CR 166
2.2 Survey Equipment and Measurement Parameters
Norsonic N-140, ANSI S1.4-1983(R2006) Type 1 precision, 1/3 octave band frequency analyzers were used at all positions. The monitors were field calibrated with a Rion NC-74, ANSI S1.401984(R1990) Class 1 calibrator at the beginning and end of the survey and exhibited only a small amount of drift within the +0.1 to - 0.3 dB range. Weather-treated 7 in. diameter windscreens were used to minimize self-generated distortion from wind. The microphones were fixed to metal posts at a standard height of about 1.2 m above local grade.
A variety of statistical sound levels were measured in 10-minute increments over the survey period; however, the parameter of primary relevance was the L50 statistical level, or the median soundlevelexceeded50%ofthetimeduringeach10minutemeasurementinterval. Newlyrevised Ohio Power Siting Board (OPSB) noise standards, contained in Section 4906-4-09(E)(2) of the Ohio Administrative Code, use the L50 ambient as the baseline for determining the permissible project sound level. Additional measures, such as the L90 and Leq were also recorded. The L90 statistical measures the level exceeded 90% of the time during the measurement period, or the quietest 1 minute in every 10 minute period. The Leq sound level is the actual average sound level over each measurement period.
2.3 Survey Conditions
The weather conditions over the survey period were conducive for valid data collection with wind speeds generally below 10 mph and no significant rain. A rainy and moderately windy period had just occurred on the morning of the survey set up, but light winds had returned by the time the instruments were put in service.
3.0 Regulatory Noise Limits
As alluded to in Section 2.2, the Ohio Administrative Code has recently been revised with respect to permissible sound levels from renewable energy projects. The new key provisions in Section 4906-4-09(E) for both construction and operational sound emissions are quoted below.
(1) General construction activities shall be limited to the hours of seven a.m. to seven p.m., or until dusk when sunset occurs after seven p.m. Impact pile driving, hoe ram, and blasting operations, if required, shall be limited to the hours between ten a.m. to five p.m., Monday through Friday. Construction activities that do not involve noise increases above ambient levels at sensitive receptors are permitted outside of daylight hours when necessary. Sensitive receptor, for purposes of this rule, refers to any occupied building. The applicant shall notify property owners or affected tenants within the meaning of paragraph (B)(2) of rule 4906-3-03 of the Administrative Code of upcoming construction activities including potential for nighttime construction activities.
(2) The facility shall be operated so that its daytime and nighttime noise contributions do not result in noise levels at any non-participating sensitive receptor within one mile of the project boundary that exceed the greater of 40 dBA or the project area ambient daytime and nighttime average sound level (L50) by five A-weighted decibels (dBA).
4.0 Survey Results and Ambient-Based Design Goal
The overall survey results from all three positions are plotted in Figure 4.0.1 in terms of the L50 statistical sound level.
Figure 4.0.1
This plot shows that the sound levels at all positions were generally similar in magnitude and followed the same large-scale trends on a site-wide basis. No one position was consistently higher or lower than the others. This site-wide continuity suggests that the overall average of all locations would serve as a reasonably good indicator of the sound level at any given location within the site area. For daytime (7 a.m. to 10 p.m.) conditions, when this solar project would be active, the overall average L50 was found to be 35 dBA. This would put the regulatory Project noise limit for daytime operations at 35 dBA + 5 dBA = 40 dBA per the current rules. This target value also happens to corresponds to the minimum allowable level of 40 dBA that would apply to lowambient sites.
At night the project is generally idle but there is a possibility that some sound at a greatly diminished level relative to normal daytime operation could be generated by the substation transformer. The average nighttime L50 at Position 2 near the substation location was measured at 30 dBA. This very low level implies that the minimum regulatory limit of 40 dBA would also apply at night at the nearest non-participating residences.
For informational purposes, the L90 sound levels measured at all positions are plotted below.
Residual - L90(10 min) - Sound Levels at All Test Positions
Sound Pressure Level, dBA
Position 1 Position 2 Position 3 Site Average
Date and Time
Figure 4.0.2
The residual (L90) background levels are generally about 3 to 5 dBA lower than the L50 levels shown in Figure 4.0.1. The overall daytime average L90 was 31 dBA.
Finally, the average, or Leq, sound level recorded during the survey are plotted below.
- Leq(10 min) - Sound Levels at All Test Positions
Date and Time
Figure 4.0.3
This plot shows the typical diurnal variation in environmental sound driven largely by traffic noise and human activity. Theoverall averagedaytimeLeqwas stillfairlylowat44dBA. The nighttime average at Position 2 in the substation vicinity was 36 dBA.
5.0 Sound Emissions from the Project
5.1 Substation Sound Emissions
The input sound power level for the step-up transformer in the Project substation during daytime operation has been conservatively estimated in octave bands in Table T-2210-041825-0 based on the unit’s maximum expected MegaVolt Ampere (MVA) rating of 110 during ONAF2 (oil natural air forced, fans on high speed) operation using empirically derived algorithms from the “Electric Power Plant Environmental Noise Guide1” published by the Edison Electric Institute (EEI). Numerous transformers over a wide range of sizes and manufacturers were measured in the EEI study to develop a formulaic relationship between the MVA rating and sound power. For this size
1 “ElectricPowerPlantEnvironmentalNoiseGuide”,PreparedbyBoltBeranekandNewmanfortheEdison Electric Institute, 2nd Ed., 1984.
transformer, the EEI methodology nominally predicts a near field sound pressure level of 80 dBA and an associated sound power level (Lw) of 99 dBA re 1 pW2 Experience suggests, however, that this prediction methodology is conservative for modern transformers (the EEI study was carried out over 40 years ago) and a lower sound power level from the actual transformer is likely. In cases where the measured performance has been determined, a sound level about 6 to 7 dB lower than the calculated EEI value has been observed, as shown in Section 2 of Table T-2210041825-0. Nevertheless, to be conservative, the as-calculated sound power level without modification, tabulated below, has been used in the modeling analysis.
Table 5.1.1
It is important to note that this sound level conservatively represents operation at maximum capacity with the radiator fans on high speed, as might rarely occur on an especially hot summer day. It will be much more common for the unit to operate without any fans on, or with the fans at low speed at significantly lower sound levels.
At night, the Project is essentially inactive, but the substation transformer remains energized and may produce some sound, although nothing close to the daytime sound power level of 99 dBA re 1 pW assumed above with all the radiator fans on high speed. At this time, the exact operational state of this transformer at night is not definitively known. It could be largely idle supplying only a minor amount of back feed, house load power to the Project with no significant noise, or it may intermittently interact with the grid by supplying some reactive compensation when needed. It is estimated by electrical specialists involved with the Project that if reactive compensation were to occur the transformer might be active at an MVA rating that is roughly 20% of the base 75 MVA ONAN (oil natural air natural, fans off) operating mode, or 13 MVA. Consequently, for design purposes, the nighttime sound emissions from the transformer have been calculated from this 13 MVA value per the EEI algorithm (Table 5.1.2).
2 Soundpowerlevelisanessentiallyintangiblequantity,usedonlyformodelingpurposes,thatiscalculated from the measured sound pressure level and the radiating wave front area at the point of (cont. next page) measurement. It is expressed in units of Watts and the designation “re 1 pW”, or ‘with reference to one picoWatt’, is used by convention to distinguish power levels from pressure levels, which are measured in units of pressure, Pascals.
Table 5.1.2
Estimated 13 MVA ONAN Transformer Sound Power Level (Lw) Spectrum –Nighttime in Reactive Compensation Mode
5.2 Inverter Sound Level
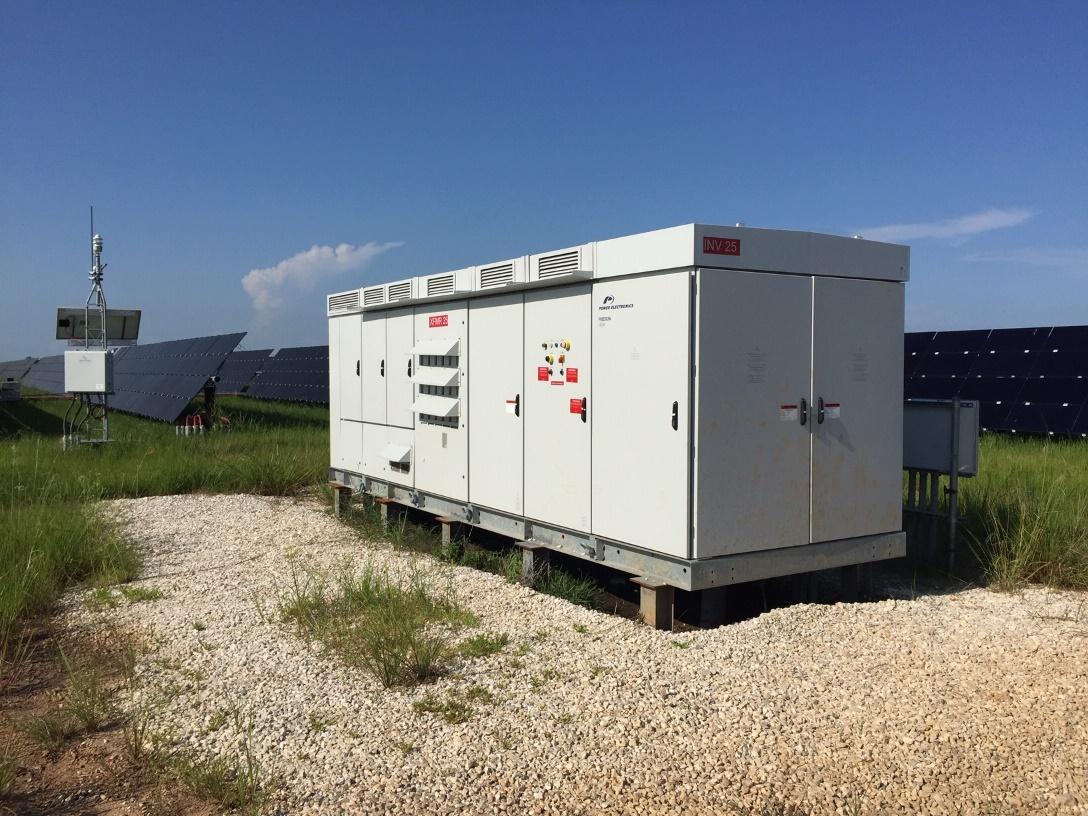
At the present time the specific inverter model for the project has not yet been completely finalized but the Power Electronics (PE) Model HEM FS4200 MU, or similar, is currently anticipated. Adequate sound emissions information on this particular model is not available from the manufacturer; however, a thorough field sound survey of a slightly smaller, but otherwise similar, PE Model HEM FS3430 MU unit was carried out at an operating solar project to quantify the unit’s sound power level.
All the significant noise emerges from the cooling air intakes on both sides of the package (three louvers in Fig. 5.2.1) and is broadband in nature (i.e. with a smooth, bland spectrum) and free from
any tonal content, even when measured a few inches out. The plot below shows the A-weighted 1/3 octave band spectra measured incrementally from the vent face out to 100 m.
A-Weighted 1/3 Octave Band Frequency Spectra at Incremental Distances from Power Electronics HEM -FS3430 MU Inverter
1/3 Octave Band Center Frequency, Hz
5.2.2
This figure shows the absence of any tonal character and that the overall sound level beyond about 30 m becomes obscured and dominated by minor high frequency insect and bird sounds. In Figure 5.2.3 this contamination has been mathematically removed and the overall A-weighted sound recalculated based on the spectrum below 4000 Hz.
A-Weighted 1/3 Octave Band Frequency Spectra at Incremental Distances from Power Electronics HEM -FS3430 MU Inverter At Face of Transformer Vent
Insect/Bird Sounds Deleted
1/3 Octave Band Center Frequency, Hz
5.2.3
In this case, a steadier regression in the A-weighted sound level (dashes down the right side of the chart) is evident at the further distances and the level becomes essentially insignificant (<40 dBA) at about 65 m (213 ft.).
The un-weighted spectra at progressive distances are plotted below to evaluate the potential for tones in more detail.
Unweighted 1/3 Octave Band Frequency Spectra at Incremental Distances from Power Electronics HEM -FS3430 MU Inverter
Sounds Deleted
Figure 5.2.4
Prominent tones are defined in Annex B of ANSI/ASA S12.9-2005/Part 4 as an exceedance of one 1/3 octave band above its neighboring bands by 15 dB for center frequencies between 25 and 125 Hz, inclusive, by 8 dB for center frequencies between 160 and 400 Hz, inclusive and by 5 dB for all bands above 400 Hz. In the chart above it can be seen that no tones, per this definition, are present in the measurement right at the face of the unit (top blue line) nor do any appear at 100 m away (bottom blue line), or generally anywhere in between. The measurements at 5 and 10 m do exhibit a minor prominence at 500 Hz where the differential from the neighboring bands is just over the 5 dB threshold, but this sound immediately disappears at the next test point 20 m out.
The survey measurements were obtained under ideal sunny day, calm wind conditions at a remote solar site with virtually no man-made, interfering ambient noise. The measurements were made of an isolated inverter adjacent to an on-site access road where unobstructed visual contact could be maintained out to 100 m. Beyond about 20 m bird and insect sounds, all above 4000 Hz, dominated the audible sound level. This interference has been removed in some of the graphics above. The measurements were made using an ANSI Type 1 precision Norsonic N-140 1/3 octave band analyzer that was field calibrated before and after the survey and exhibited no drift.
The 1/1 octave band sound power level for each side of the unit (i.e. each cooling air vent) is derived in Section 3 of Table T-2210-041825-0 from pressure level measurements 5, 10 and 20 m out. The overall measured sound pressure levels at these distances of 71, 65 and 58 dBA display an essentially ideal 6 dB loss per doubling of distance demonstrating that the measurements are
uncontaminated by other noises. The conversion from pressure to power uses a ¼ sphere surface area because the sole sound source is a vent on the vertical side face of the package, which can only radiate in one direction. The package shell, as a whole, emits no noticeable noise. The measurements at each distance have been normalized to reverse propagation losses due to ground and air absorption per ISO 9613-23 and give the true sound power level. The maximum sound power level in each octave band of the three nominally equivalent results has been taken as the effective sound power level. Lastly, a scaling factor was added to account for the difference in electrical rating from the measured prototype (3430 kV) to the planned Crossroads units (4200 kV) to form the effective design sound power level spectrum shown in Table 5.2.1 below.
Table 5.2.1
Design Inverter Sound Power Level (Lw) Spectrum, Each Side
This sound power level radiates with a quarter-sphere wave front from each side of the package. For modeling purposes, a single point source with this magnitude is assumed to radiate over a hemispherical surface area, representing the sound emissions from both sides of the unit. This simplification is conservative in the sense that the sound is assumed to radiate equally in all directions, whereas, in reality, the sound emissions off the ends of the package are somewhat lower.
At night the inverters shut down as soon as the sun sets. However, if the Project interacts with the grid at night to provide reactive compensation, the inverters do play a role in that along with the transformer in the substation. It is our understanding that the estimated 20% transformer MVA load that might occur in connection with reactive compensation is supplied cumulatively by all the inverters, such that each inverter might be operating at roughly 1% of its normal capacity. This suggests that any sound emissions from the inverters during this mode of operation will be insignificant and may be neglected.
5.3 Tracking Motors
The only other sound of any kind that may emanate from the Project is from the tracking system that may be used in some areas to intermittently tilt each panel row individually a few degrees to optimize its angle towards the sun. Dynamic tilt arrays are planned for this Project. The motors
3 Acoustics – Attenuation of Sound during Propagation Outdoors, Part 2, “A General Method of Calculation,” ISO 9613-2, International Organization for Standardization, Geneva, Switzerland, 2017.
that drive this function via a worm gear are typically very small, as shown in Figure 4.3.1, and, based on firsthand observations, make no perceptible noise when operating.
Theonlysoundisaslightcreaking/flexinginthepanelframesandarmatureslasting1or2seconds, which is only faintly audible when standing within the panel array itself. Consequently, this sound source is not considered significant with respect to off-site receptor locations.
5.4 Modeling Assumptions
Based on the input sound power level spectra above, the normal, sunny day sound emissions from the Project as well as its estimated nighttime sound levels have been modeled using Cadna/A® modeling software, which is essentially an automated version of ISO 9613-2 Acoustics –Attenuation of Sound during Propagation Outdoors4 .
In this instance, a mid-range, somewhat conservative ground absorption coefficient (Ag from ISO 9613-2) of 0.5 (on a scale of 0 to 1) has been used to represent the site vicinity, which mainly consists of open fields and intermittent wooded areas Normally, farm fields would be considered more acoustically absorptive and would warrant a higher coefficient than 0.5. No propagation losses have been taken for wooded areas or vegetation. There are no significant undulations in the
4 Ibid.
area topography, so flat terrain is assumed along with ISO “standard day” conditions (10 deg. C/70% RH).
5.5 Model Results
The anticipated overall A-weighted sound emissions from the Project during normal daytime operations are shown in Plot 1-A This plot shows the immediate project area and Plot 1-B shows the overall study area out to 1 mile. The contours in these graphics are mathematically plotted out to an extremely low sound level of 35 dBA for informational purposes; however, the key result is that all residences lie either on or outside the purple 40 dBA contour line representing the effective regulatory noise limit for the Project. This means that the Project level is expected to be equal to or, in the vast majority of cases, less than the permissible limit of 40 dBA. The expected Project sound levelat any particular propertylineofinterestmay bedeterminedgraphicallyfrom the plots.
The expected sound levels in the 30’s dBA at the nearest residences are comparable to the existing L50 daytime background level (35 dBA), meaning that any sound from the Project is likely to be inconsequential, if audible at all above the normal environmental sound level. These low operational sound levels are not accidental and generally result from a self-imposed design setback distance of at least 500 ft. between any inverter and any non-participating residence. This design approach essentially mitigates any noise issues proactively.
At sundown, the photovoltaic panels stop producing power and the inverters shut down. While the Project is essentially inert and out of service at night, the substation transformer remains energized and may back feed a small amount of house load to the Project and may possibly also interact with the grid to provide some reactive compensation. This function is not comparable to normal daytime operation and there would never be a need for any radiator fans. Plot 2 illustrates the potential nighttime sound emissions from the Project in the vicinity of the substation if the transformers were to supply a conservatively estimated 13 MVA of reactive compensation each to the grid. This plot shows that extremely low sound levels well below a negligible level of 35 dBA are predicted at the nearest houses, whether participating or not, meaning that the proposed substation should be completely inaudible at the nearest residences at night
6.0 Sound Emissions during Construction
In contrast to other forms of power generation, the construction phase of a solar energy facility is relatively short in duration and the activities that generate any significant noise are few. Where a fossil or wind project would require extensive earthworks and the pouring of massive concrete foundations over a period of many months, a solar energy project generally involves, from a noise generation perspective, the installation of the mounting posts for the panel racks along with some trenching, grading and road building activities.
In general, it is very difficult to quantify or evaluate construction noise in a meaningful way because the noise itself is highly variable with time as individual pieces of equipment start and stop, move forward and backward and, in this case, operate in different parts of the Project area. Nevertheless, Table 6.0.1 gives representative sound levels from construction equipment associated with the different phases of construction relevant to this Project. Figures are given at the standardtestdistanceof 50feet5 andat 500and2000feet. The 500 footdistance verygenerally represents the sound from construction activities as perceived at some of the closest neighboring homes when construction activities are occurring nearby. The 2000 foot distance gives the sound levels that are more representative of what might be heard in the general community some distance away.
Table 6.0.1
Typical Construction Equipment Sound Levels per the FHWA by Phase
1 Not all vehicles are likely to be in simultaneous operation. Maximum level represents the highest level realistically likely at any given time. 2 Based on manufacturer’s information.
While the sound levels 50 feet from the equipment are significant, as might be expected, the sound levels at hundreds or thousands of feet away are fairly moderate and would only occur temporarily and intermittently during the construction period.
5 U. S. Dept. of Transportation, Federal Highway Administration, Roadway Construction Noise Model User’s Guide, Table 1, Jan. 2006.
Very little grading will be required, since the local terrain is essentially flat, but access roads will need to be constructed throughout the Project area. There is no need for concrete pouring beyond the substation area. The inverters and other electrical equipment will typically sit on gravel pads, metal skids or drop-in prefabricated concrete slabs. Concrete pouring is only likely for the transformer basin in the substation. A concrete pump truck and its servicing mixers typically generate a sound level of about 82 dBA at 50 feet6, or roughly at the boundary of the substation. At the nearest non-participating residence over 2000 ft. away, this sound level would decrease to 44 dBA or less and occur only intermittently during the day: probably only for a day or two. No significant structures are needed for the Project beyond one or two small electrical enclosures in the substation and an operations and maintenance building.
In addition to roads, electrical lines will need to be installed underground to connect the various sections of the project to the substation. It is likely that mobile chain-type ditch diggers will be used for trenching possibly supplemented by a hoe ram to break up any large rocks or bedrock encountered, if needed. Horizontal directional drilling (HDD) rigs are expected to be needed to cross under roads and certain wetlands, but only in a few places. No blasting is expected to be needed for this Project.
The most common method of installing the support posts is to drive them into the ground with a small mobile driver, such as a Vermeer PD-10, that has been largely designed for this specific task. This procedure produces a rapidly repetitive, metallic impact noise, which will be unavoidably audible for some distance and could result in some annoyance. On the other hand, this activity is reasonably short-lived and would proceed fairly quickly, only occurring for a period of days or weeks in any one area of the site. In accordance with OAC 4906-4-09(E)(1), the noise impact from pile driving will be mitigated to some extent by limiting the time period when this activity can occur to between 10 a.m. and 5 p.m. Monday through Friday.
Once the supports are in place the panels will need to be transported to the site and installed. Of course, these material deliveries will be spread out over the site area so the trucks will be using different roads in different areas at different times as construction progresses. The actual installation of the panels, i.e. attaching them to the armatures and frames is not an inherently noisy activity.
Per current regulations, construction activities in general, unless they “do not involve increases above ambient”, will be limited to “7 a.m. to 7 p.m., or until dusk when sunset occurs after 7 p.m.”
6 Ibid.
7.0 Conclusions
A field survey of the existing ambient sound levels within the Project area was carried out in November of 2024 to quantify the baseline environmental conditions. Three monitoring stations distributed over the Project area, recorded continuously day and night for 4.5 days. All statistical measures were generally consistent and followed the same trends at all positions despite being separated by distances of up to 1 mile. This indicates that the average measured level from all three test points would be reasonably representative of any specific location within the Project area.
Current regulations state that the sound emissions from a renewable energy project cannot exceed the existing L50 background level by more than 5 dBA or an absolute level of 40 dBA, whichever is greater. The site-wide average daytime L50 from all three test points was 35 dBA, which puts the Project noise limit at 40 dBA during the day.
At night the Project is essentially idle and silent, but some sound is possible from the substation transformers. The average nighttime L50 of 30 dBA measured at Position 2 near the substation area would ostensibly point to a noise limit of 35 dBA, but the minimum level of 40 dBA would take precedence. Hence the operational sound emissions from the Project are limited to 40 dBA or less at all non-participating residences irrespective of time of day.
A noise model of the site was subsequently developed to evaluate how the Project sound levels will compare to the 40 dBA limit. The model inputs are the sound power levels of the main stepup transformer in the proposed substation and the inverters, which are distributed throughout the panel arrays. In order to quantify the maximum operational sound emissions from the Project on a sunny day, the sound power level of the substation transformers was conservatively calculated at 99 dBA re 1 pW from its maximum expected rating of 110 MVA ONAF2, which represents a hot summer day operating scenario where the radiator fans are on in high speed mode. This is most likely a rare operating configuration occurring only during unusually hot conditions. The inverter make and model for this project will be finalized at a later stage,but a likely/representative candidate is the Power Electronics Model HEM FS4200 MU. The sound power level spectrum of thisinvertermodelwasderivedfromdetailedfieldmeasurementsofasimilarModelHEMFS3430 MU unit in actual operation with a scale-up factor added to account for the size differential. An effective sound power level of 94 dBA re 1 pW was used for each unit.
The maximum daytime sound level due to Project operation is expected to be at or below the 40 dBA design goal at all non-participating residences.
The predicted Project sound levels at nearby non-participating residences are mostly in the 30’s dBA, which is comparable to the existing daytime L50 ambient sound level. This suggests that any sound emissions from the Project will likely be inconsequential, if not inaudible, at residences in the Project area.
Although solar energy projects are operational only during the day, the substation transformer remains energized at night and may potentially be used in reactive compensation mode that assists with grid stability. Using a conservative operating level of 13 MVA to derive the transformer sound emissions, extremely low sound levels well below the nominal design target of 40 dBA, are calculated at the nearest homes to the substation at night. In fact, the expected levels are so quiet in absolute terms that no disturbance is anticipated, if the substation is even audible at all. While the inverters are minimally active during reactive compensation, the level of operation is a tiny fraction of that during normal operation; consequently, the sound emissions are expected to be negligible.
In contrast to other forms of power generation, the sound emissions from construction activities on a solar project are expected to be dramatically lower in both magnitude and duration. Some unavoidable disturbance is possible when the mounting posts are driven in, but this activity will be fairly short-lived in any particular location. Other sounds from trenching, road building and material delivery will also be brief in duration and will progress from place to place avoiding prolonged exposure at any specific location. Exposure to construction noise is also limited by regulation to the daytime hours and to an even shorter time window for piling and the possible use of hoe rams.
In general, the potential noise impacts from all aspects of the Project are expected to be minimal.
End of Report Text


A

Table: T-2210-041825-A
Title: Substation Transformer and Inverter Sound Power Level Deriviations
Project: Crossroads Solar Grazing Center
Revision: A
Date: 4/18/25
1. Main Step Up Transformer in Collector Substation
Band Center Frequency, Hz
A. Daytime - Sound Power Level Estimate Based on Max. MegaVolt Ampere (MVA) Rating - ONAF2
(1)
+ Freq. Adj. Factors
B. Nighttime - Sound Power Level Estimate Based on Min. MegaVolt Ampere (MVA) Rating - ONAN x 20%
(1) Oil Natural Air Forced (ONAF2), All radiator fans on high speed. (2) Edison Electric Institute, "Electric Power Plant Environmental Noise Guide", 2nd Ed., BBN, 1984. (3) Oil Natural Air Natural (ONAN), All radiator fans off. Reactive compensation
at 20% of ONAN 75 MVA.
2. Evaluate Validity of Transformer Sound Power Level Algorithm
Check Calculated vs. Measured Level for Typical Solar Project Substation Transformer MVA Rating of Observed Unit at ONAF 108
Near Field Lp(1 m) Based on NEMA Rating
Lw = NEMA Rating + Size Factor + Freq. Adj. Factors
Attenuation to Measurement Point:
Table: T-2210-041825-A Page: 2
Title: Substation Transformer and Inverter Sound Power Level Deriviations
Project: Crossroads Solar Grazing Center
Revision: A
Date: 4/18/25
Descriptor
Octave Band Center Frequency, Hz
Measured Sound Pressure Level of Operating 108 MVA ONAF Solar Project Substation Transformer Compared to EEI Calculation
Band Center Frequency,
Calculated Lp at 45 m
3. Power Electronics Model HEM FS4200 MU Inverter
Derive from Field Test of Power Electronics Model HEM FS3430 MU Inverter
Sound power level derived from field measurements at operating 120 MW site All significant noise from transformer ventilation air discharge each side of unit.
Measured Lp at 45 m
Test Conditions: Clear, Sunny, 90 deg. F, Calm Winds. Facility at Full Production No significant background noise present except high frequency noise from birds and insects ANSI Type 1 precision N-140 1/3 OB Frequency Analyzer, Cal. 94.0 dB at 1 kHz before and after test.
S, 1/4 Sphere Wavefront Area
Remove and Normalize Propagation Losses per ISO 9613-2 Air Absorption
Total Propagation Losses
Table: T-2210-041825-A
Title: Substation Transformer and Inverter Sound Power Level Deriviations
Project: Crossroads Solar Grazing Center
Revision: A
Date: 4/18/25
3. Power Electronics Model HEM FS4200 MU Inverter (Cont.)
1/4 Sphere Wavefront Area at Test Pt
Remove and Normalize Propagation Losses per ISO 9613-2
Absorption, Hs=Hr=1.5
Remove and Normalize Propagation Losses per ISO 9613-2
Scale up from 3430 to 4200 kV
Delta Lw = 10 log (4200/3430)
Participating residence in project area