
Stormwater Assessment
Crossroads Solar Grazing Center Morrow County, Ohio
May 2025
Preparedfor:
Crossroads Solar I, LLC
Preparedby:
Verdantas LLC 1105Navasota Street 6397 EmeraldParkway, Suite 200 Austin, Texas 78702 Dublin, Ohio 43016
17078.0007


TABLES
TABLE1 SelectedSoil Characteristics
TABLE2 RunoffCNParameters
TABLE3 Composite CNValues
TABLE4 Stormwater Runofffor Pre- andPost-Construction Drainage Areas
APPENDICES
APPENDIXA ProjectSite Map
APPENDIXB CustomSoil Report
APPENDIXC Guidance onPost-Construction Stormwater Managementfor Solar Panel Fields
APPENDIXD MathCAD WorksheetsandHydroCAD Reports
APPENDIXE PrecipitationData

1.1

1.0 INTRODUCTION
PROJECT DESCRIPTION AND PURPOSE
This Stormwater Assessment has been prepared for the Crossroads Solar Grazing Center (Crossroads) to be responsive to Ohio Administrative Code (OAC) 4906-4-09(G)(2) Crossroads is proposing to construct a combined utility-scale solar energy and sheep grazing facility in Cardington, Lincoln, and Westfield Townships in Morrow County, Ohio (the Project or the Facility). The Project will use rows of ground-mounted solar panels to supply up to 94 megawatts AC (MWac) of wholesale power to the existing electric grid while also providing pasture for livestock. All of the Project’s above-ground infrastructure will be located within agricultural-style fences, which also will confine the livestock and protect them from predators. The fenced area will be up to 559 acres (the Solar & Grazing Area) of an area totaling approximately 726 acres (the Project Area). A Project Site Map is included in Appendix A.
The objective of this Assessment is to explain stormwater requirements set by state and local (as applicable) stormwater authorities for the Project Area, describe erosion control and sediment management requirements applicable during construction, and provide a comparison of existing stormwater runoff characteristics of the Project Area to postconstruction condition stormwater runoff characteristics.


2.0 PRE-CONSTRUCTION CONDITIONS
2.1 PROJECT AREA DESCRIPTION
The ProjectislocatedinCardington,Lincoln,andWestfieldTownships inMorrowCounty, Ohio. The overall Project Area is approximately 726acres. Existingfeatures within or near the Project Area include transmission lines, public roads, single family residences, and farmsteads. The site is relatively flat with some areas with pronounced slopes near streams.
The Project Area is located within the Upper Scioto Watershed. Several surface water bodies were identified within the Project Area, including eight potential wetlands, two streams, and a freshwater pond. Surface water flow within Drainage Area 1 trends towardsAlumCreek.SurfacewaterflowswithinDrainageAreas2,3,and4trendstowards Whetstone Creek. AProjectSiteMap is included in Appendix A.
2.2 SOILS
Soilsurveysprovidemapsofsurficialsoilsandgeneraldescriptionsofthevarioussoiltypes overthesurveyareaandcanbeusedasatooltocompare thesuitabilityoflargeareas for general land uses. The USDA Natural Resources Conservation Service of Morrow County (USDA Web, 2025) maps the majority of the surficial soils within the Project Area as Pewamosiltyclayloam,0to1percentslope (Pm), Blountsiltloam,groundmoraine,0 to 2 percent slope (Blg1A1), and Glynwood silt loam, ground moraine, 2 to 6 percent slope (Gwg1B1). Thesesoiltypescoverapproximately39.7,34.3,and15.1percentofthe Project Area, respectively. The remainder of the Project Area is covered by various silt, silty clay loams, andclay.
Table 1 below includes selected characteristics on these soils. The remainder of the Project Area is covered by various silt loams. Soils data was verified using a custom soil report obtained from the NRCS Web Soil Survey web application. The custom soil report is included in Appendix B andincludes a map showingsoil types and the corresponding hydrologic soil group (HSG) across the Project Area. HSG type D soils are predominant throughoutthe ProjectArea.


Table 1: Selected Soil Characteristics
Blount silt loam, groundmoraine (Blg1A1)
Glynwoodsilt loam, ground moraine, 2to6 percent slopes (Gwg1B1)
to2
Poorly
to6
Well
For the Project Area, the depth to the top of the seasonal high-water table can range from 0 to 24 inches below ground surface based on the NRCS Soil Survey. The seasonal high-water table is the area of saturated soil at or near the surface which is a result of precipitationrates,soilpermeability,andgeologicalformations.Theseasonalhigh-water table is different from the groundwater resources (which are located at greater depths intheProjectArea),whichisthedepthatwhichsufficientquantitiesofgroundwatercan be obtained for potable or non-potable uses. For more information on groundwater resources, refer totheGeology, Hydrogeology, and Preliminary GeotechnicalReport.


3.0 PROPOSED DEVELOPMENT
The proposed development consists of up to a 94 MWAC utility-scale solar electric generation Facility within the Project Area. The overall Project Area is approximately 726 acres. The area that was modeled includes the area inside the proposed fence line whereCrossroadscancontrolthetypeofgroundcover. Thisisaconservativeapproach because the leased areas outside the fence are anticipated to have permanent vegetative cover as well. Construction of the solar arrays will include elevated solar modules mounted on metal racking atop driven steel piles, inverter, and transformer pads, buried cables, access roads, and pyranometers. A series of access roads will provide access to the centrally located inverter pads. Construction of the Facility is anticipated to necessitate only limited grading that would not result in significant changes to the topography within the Project Area. Throughout the site, the ground coverbelowthesolarmodulesisanticipatedtobeamixofnativegrassesandforbs.The soilswithinconstructiondisturbedareasareexpectedtobescarifiedandde-compacted as neededprior toseeding and mulchingat the conclusion ofconstruction.
Other plans related to the Stormwater Assessment that are in separate Appendices of the Application include the:
1. Preliminary Drain Tile Assessment
2. Preliminary Agricultural Soils Management Plan; and
3. Preliminary Vegetation Management Plan.


4.0 REGULATORY CONSIDERATIONS
Local and state agencies that may require coordination include Morrow County, Ohio, and the Ohio Environmental ProtectionAgency (Ohio EPA).
4.1 CONSTRUCTION STORMWATER MANAGEMENT
Crossroads will be required to comply with the Ohio EPA National Pollutant Discharge Elimination System (NPDES) Construction General Permit OHC000006 (General Permit) issuedinApril2023. The followingrequirements are set forthin the General Permit:
• Submit Notice ofIntent(NOI);
• Prepare Stormwater Pollution Prevention Plan (SWP3);
• Implement Best Management Practices (BMPs) to reduce erosion and control sedimentation duringconstructionoperations;
• Water quality and quantity management requirements as determined by final design;
• Inspections as definedby the General Permit;
• Temporary and Permanent stabilization of disturbed areas as determined by final design;
• Post constructionstormwater managementcontrols, as applicable;
• Submit Notice of Termination (NOT).
4.2 FLOODPLAIN COORDINATION
The Designated Floodplain Administrator for Morrow County is the Planning and Zoning Director.
Thecomponents oftheFacilitywillnotbelocatedinthemappedfloodplainareas. Asa result, floodplain regulation does not apply to this project and there is no need for local consultationon this subject.


5.0
STORMWATER AND EROSION CONTROL DESIGN APPROACH
Post-construction stormwater management for the Project will generally consist of converting tilled farmland to native grasses and forbs, providing impervious surface disconnections,andmanagingstormwaterquantityandqualityinaccordancewiththe General Permit. Prior to construction, a site-specific SWP3 will be prepared as required under the General Permit that will include erosion and sediment control BMPs during construction.
As discussed in Section 3.0 above, a series of access roads will provide entry to the centrally located inverter pads. Construction of the Facility is anticipated to necessitate onlylimitedgradingthatwouldnotresultinsignificantchangestothetopographywithin the Project Area. Throughout the site, the ground cover below the solar modules is anticipated to be native grasses and forbs. The soils within construction disturbed areas are expected to be scarified and de-compacted as needed prior to seeding and mulching at the conclusion of construction. For additional details regarding selection of low-growingvegetationvarietiesrefertotheVegetationManagementPlanpreparedfor the Project.
5.1 PRELIMINARY STORMWATER ASSESSMENT ASSUMPTIONS
• The final design for the Project is expected to incorporate appropriate aspects of the Ohio EPA’s Guidance on Post-Construction Storm Water Controls for Solar Panel Arrays, datedApril 2022,whichis included in Appendix C
• Proposed access roads are expected to include vegetated surfaces that run parallel andadjacentto the roads, where necessary, for stormwater treatment.
• Based on the Custom Soil Report for Morrow County, the Project Area is predominantly covered with poorly drained soils with moderate permeability, particularly inthe current agriculturaluse areas.
5.2 HYDROLOGIC ASSESSMENT
Verdantas used the HydroCAD v.10.2 software to estimate the runoff using the TR-20 method. The TR-20 is a method developed by the Soil Conservation Service (SCS) which isasuitablerunoffmethodforwatershedsandutilizestheTR-55methodfordevelopment of time ofconcentration andrunoffcurve number.
HydroCADutilizessubcatchmentstocharacterizethehydrologyofadrainageareaand estimate the flow rate and volume of runoff resulting from a storm event. Inputs include the time ofconcentration andrunoffcurve number. The SCSMethod for WatershedLag (National Engineering Handbook) was used to estimate the time of concentration for each drainage area. The necessary inputs are flow length, average watershed slope, and the retardance factor. The retardance factor is equivalent to the runoff curve number. The runoff curve number characterizes an area by its land cover and soil type. The output from the subcatchments are runoff hydrographs, which depict the flow from the drainage area with respect to time. The time of concentration and runoff curve


number directly impact the estimatedpeak flow of this runoff hydrograph. The following sections provide additional informationfor inputselectionandassumptions made.
5.2.1 WATERSHED DELINEATION
Verdantas obtained drainage areas from US Geological Survey (USGS) StreamStats online application. Additionally, light detection and ranging (LiDAR) survey data was obtained from the Ohio Geographically Referenced Information Program (OGRIP) to verify drainage divides within the Project Area. The OGRIP database is the industry standard in Ohio for obtaining seamless statewide topography, achieving a vertical accuracy of+/- 1-foot. Four drainage areaswere delineatedandare showninFigure 1.
5.2.2 COMPOSITE RUNOFF CURVE NUMBER
The SCS published a simplified method for determining the potential for runoff in Technical Release 55 (TR-55). The TR-55 includes tables that estimate a curve number (CN),from1to100,thatcharacterizestheProjectdrainageareabasedonlanduseand soils. Land use describes the land cover including lawns, farm fields, pavement, open water, forests, andmany other categories. The native grasses andforbs are identified as the Meadows/Low-growing grass varieties land cover. Each soil type encountered in a drainage area is categorized by a hydrologic soil group (HSG) that describes the potential for infiltration. Soils are listedas HSGA, B, C, or D, withAsoils havinga highrate of infiltration and D soils having a low rate of infiltration. HSG type D soils are the most predominant throughout the Project Area. Land use throughout the Project Area was estimated using the US Geological Survey (USGS) 2023 National Land Cover Database and verified using aerial imagery obtained from the OGRIP dataset. CN tables in the TR55wereusedtoselectanappropriateCNforthelanduse/HSGcombination.RunoffCN for HSG Type D (poorly drained) soils are included in Table 2 as follows using the TR-55. Table 3 describes the composite CNvalues for each drainage area.
Table 2: Runoff CN Parameters
Wetlands D 84


5.2.3 TIME OF CONCENTRATION
Thetimeofconcentrationisgenerallydefinedastheamountoftimeforaraindropfalling at the most hydraulically remote part of the drainage area to reach a point of interest. The time of concentration helps to define the shape of the resulting runoff hydrograph by defining the time it takes for all parts of the watershed to contribute to runoff at the pointofinterest.Forthisassessment,thepointofinterestwasselectedforeachwatershed as the downstream point of the receiving waters that encompasses all of the Project in that watershed. Verdantas estimated the time of concentration using the SCS Method for Watershed Lag. This method uses empirical calculations based on the longest flow path, average watershed land slope, and a retardance factor. The retardance factor is equivalenttotheCN.MathCADExpressPrimev.8.0softwarewasutilizedtocalculatethe time of concentrations for each drainage area. Several lands slopes were analyzed, ranging from 0.5 to 9 percent. The value selected for each drainage area was determined by analyzing the NRCS Custom Soil Report. A weighted average slope was calculatedbasedonthesoilgroupsineachdrainagearea.Timeofconcentrationvalues were calculated, and the value was entered as a manual value into HydroCAD. The MathCAD worksheetsare includedin Appendix D.
5.2.4 PRECIPITATION ESTIMATES
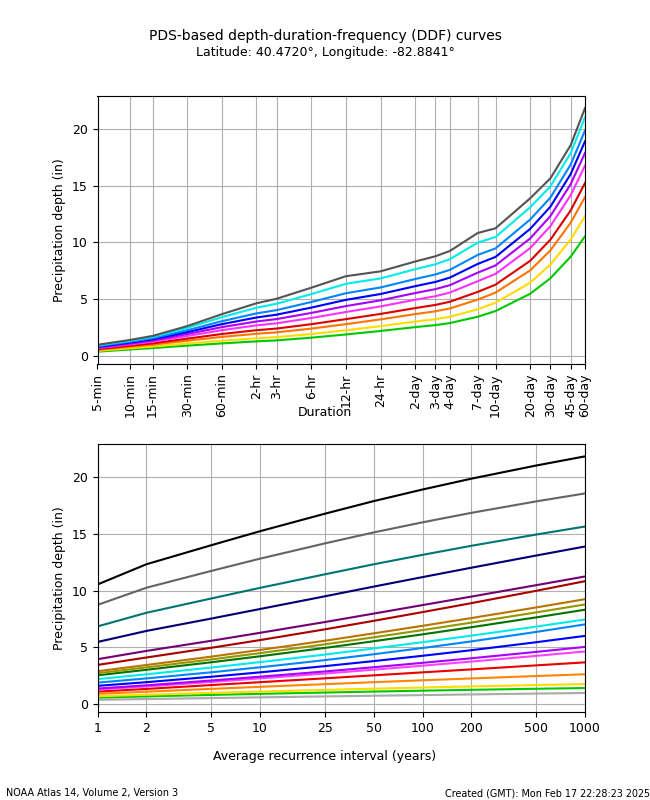
Precipitationdepthforthe1-year,2-year,5-year,10-year,25-year,50-year,and100-year, 24-hour precipitation events were obtained from the NOAA Atlas 14 point precipitation frequencyestimatesdatabase.Precipitationvaluesatapointlocationatthemedianof each drainage area had insignificant differences, so a representative location near the centroidofthefourcombineddrainageareaswasselected.Verdantasusedastandard 24-hour SCS type-II rainfall distribution to characterize the rainfall. NOAA Point Precipitationdata is includedin Appendix E.
5.2.5 PRE VS POST CONSTRUCTION RUNOFF RATE REDUCTION
The following Table 4 describes the estimated stormwater runoff for the pre- and postconstruction conditions for selected rainfall frequencies. The overall Project Area is approximately 726 acres. The area that was modeled includes the area inside the proposed fence line where Crossroads can control the type of ground cover. This is a conservative approach because the leasedareas outside the fence are anticipated to have permanent vegetative cover as well. The full range of rainfall frequencies and outputfor eachdrainage area is includedin the HydroCAD Report in Appendix D


As seen in Table 4 above, development has an effect on the overall CN for Drainage Areas 2, 3, and 4, which reduces the peak runoff from the entire drainage area. Development does not have an impact on the overall CN for Drainage Area 1. The reason for this is that the size of the Project Area in the drainage area is so small relative to the entire drainage area, as indicated in Table 4 above. That reduction in CN for the Project Area does not appreciably reduce peak runoff from the entire drainage area. RefertotheProjectSiteMapin Appendix A forthedrainageareasandtheProjectArea.
5.3 WATER QUALITY VOLUME
Therequiredpost-constructionstormwaterrunoffwaterqualityvolumewillbeaddressed during final design by incorporating BMPs in accordance with the General Permit and the Ohio EPA “Guidance on Post-Construction Stormwater Management for Solar Panel Fields.” This guidance is included in Appendix C. This document describes how impervious surface disconnection can be an effective approach to managing postconstruction stormwater runoff from the solar panels. The impervious areas, such as the solarpanels,onthesitewillbedisconnectedandroutedthroughthevegetatedsurface. The runoff from the panels will fall and be dispersed through the vegetated surface withoutproducingacceleratederosionorconcentratedflow.Thisdisconnectioncanbe usedto manage water quality volume requirements in the GeneralPermit.
Inexistingconditions,thelandcoveroftheproposedProjectAreaisprimarilyagricultural land. In proposed conditions, the land cover of the panels and permanently vegetated surface is primarily meadows. This change from agricultural to meadows will promote greaterinfiltrationofwaterandhelppromotesheetflowandhelpreducetheamountof estimatedpeakstormwater flows produced.
For the Projectsubstation, additional erosionandsediment(E&S)control BMPs andpostconstructionBMPs willbe requiredper the General Permit due tothese areas being coveredinaggregateand various pieces ofelectricalequipment.


6.0
CONCLUSION
Stormwater management will be addressed both during construction and postconstruction. The Project will be required to obtain coverage under the General Permit during construction. To comply with the requirements of the General Permit, the Project will be required to limit erosion and manage sedimentation through best management practices that will be determined during final design and described in a site-specific SWP3. Post-construction stormwater management will be generally achieved through the change in land use from agricultural to permanently vegetated ground cover throughoutmostofthe ProjectArea.
This report describes the methods used to approximate the hydrologic cycle, where rainfallgenerallyinfiltrates,evaporates,orcollectsasrunoffthatfeedsstreamsandrivers. The volume ofrunoff generatedduringa specified storm duration and rainfall depth is a functionofthesoil,thecovertype,andthelandslope.Thepeakrunoffrateincubicfeet per second represents the maximum expected runoff for a particular watershed during a specifiedstormevent.
Inexistingconditions,thelandcoveroftheproposedProjectAreaisprimarilyagricultural land. In proposed conditions, the land cover of the panels and permanently vegetated surface is primarily meadows. This change from agricultural to meadows will promote greaterinfiltrationofwaterandhelppromotesheetflowandhelpreducetheamountof estimated peak stormwater flows produced. By reducing the runoff rate, the Project reduces the potentialfor erosive velocities and flows leavingthe ProjectArea.
This Assessment indicates that peak runoff rates from the Project Area for the 1-year through 100-year events in each watershed decrease, or do not change, as a result of the Project. The estimates of peak runoff reduction contained in this Assessment are based on the information and assumptions described in the sections above. This AssessmentisconsideredpreliminaryandVerdantasrecommendsitberevisedbasedon the finaldesign.




United States Department of Agriculture

Natural Resources Conservation Service
A product of the National Cooperative Soil Survey, a joint effort of the United States Department of Agriculture and other Federal agencies, State agencies including the Agricultural Experiment Stations, and local participants
Custom Soil Resource Report for Morrow County, Ohio
Preface
Soil surveys contain information that affects land use planning in survey areas. They highlight soil limitations that affect various land uses and provide information about the properties of the soils in the survey areas. Soil surveys are designed for many different users, including farmers, ranchers, foresters, agronomists, urban planners, community officials, engineers, developers, builders, and home buyers. Also, conservationists, teachers, students, and specialists in recreation, waste disposal, and pollution control can use the surveys to help them understand, protect, or enhance the environment.
Various land use regulations of Federal, State, and local governments may impose special restrictions on land use or land treatment. Soil surveys identify soil properties that are used in making various land use or land treatment decisions. The information is intended to help the land users identify and reduce the effects of soil limitations on various land uses. The landowner or user is responsible for identifying and complying with existing laws and regulations.
Although soil survey information can be used for general farm, local, and wider area planning, onsite investigation is needed to supplement this information in some cases. Examples include soil quality assessments (http://www.nrcs.usda.gov/wps/ portal/nrcs/main/soils/health/) and certain conservation and engineering applications. For more detailed information, contact your local USDA Service Center (https://offices.sc.egov.usda.gov/locator/app?agency=nrcs) or your NRCS State Soil Scientist (http://www.nrcs.usda.gov/wps/portal/nrcs/detail/soils/contactus/? cid=nrcs142p2_053951).
Great differences in soil properties can occur within short distances. Some soils are seasonally wet or subject to flooding. Some are too unstable to be used as a foundation for buildings or roads. Clayey or wet soils are poorly suited to use as septic tank absorption fields. A high water table makes a soil poorly suited to basements or underground installations.
The National Cooperative Soil Survey is a joint effort of the United States Department of Agriculture and other Federal agencies, State agencies including the Agricultural Experiment Stations, and local agencies. The Natural Resources Conservation Service (NRCS) has leadership for the Federal part of the National Cooperative Soil Survey.
Information about soils is updated periodically. Updated information is available through the NRCS Web Soil Survey, the site for official soil survey information.
The U.S. Department of Agriculture (USDA) prohibits discrimination in all its programs and activities on the basis of race, color, national origin, age, disability, and where applicable, sex, marital status, familial status, parental status, religion, sexual orientation, genetic information, political beliefs, reprisal, or because all or a part of an individual's income is derived from any public assistance program. (Not all prohibited bases apply to all programs.) Persons with disabilities who require
alternative means for communication of program information (Braille, large print, audiotape, etc.) should contact USDA's TARGET Center at (202) 720-2600 (voice and TDD). To file a complaint of discrimination, write to USDA, Director, Office of Civil Rights, 1400 Independence Avenue, S.W., Washington, D.C. 20250-9410 or call (800) 795-3272 (voice) or (202) 720-6382 (TDD). USDA is an equal opportunity provider and employer.
Blg1A1—Blount silt loam, ground moraine, 0 to 2 percent
Blg1B1—Blount silt loam, ground moraine, 2 to 4 percent slopes
GaB—Gallman silt loam, loamy substratum, 2 to 6 percent slopes
Gwg1B1—Glynwood silt loam, ground moraine, 2 to 6 percent slopes
Gwg5C2—Glynwood clay loam, ground moraine, 6 to 12 percent
How Soil Surveys Are Made
Soil surveys are made to provide information about the soils and miscellaneous areas in a specific area. They include a description of the soils and miscellaneous areas and their location on the landscape and tables that show soil properties and limitations affecting various uses. Soil scientists observed the steepness, length, and shape of the slopes; the general pattern of drainage; the kinds of crops and native plants; and the kinds of bedrock. They observed and described many soil profiles. A soil profile is the sequence of natural layers, or horizons, in a soil. The profile extends from the surface down into the unconsolidated material in which the soil formed or from the surface down to bedrock. The unconsolidated material is devoid of roots and other living organisms and has not been changed by other biological activity.
Currently, soils are mapped according to the boundaries of major land resource areas (MLRAs). MLRAs are geographically associated land resource units that share common characteristics related to physiography, geology, climate, water resources, soils, biological resources, and land uses (USDA, 2006). Soil survey areas typically consist of parts of one or more MLRA.
The soils and miscellaneous areas in a survey area occur in an orderly pattern that is related to the geology, landforms, relief, climate, and natural vegetation of the area. Each kind of soil and miscellaneous area is associated with a particular kind of landform or with a segment of the landform. By observing the soils and miscellaneous areas in the survey area and relating their position to specific segments of the landform, a soil scientist develops a concept, or model, of how they were formed. Thus, during mapping, this model enables the soil scientist to predict with a considerable degree of accuracy the kind of soil or miscellaneous area at a specific location on the landscape.
Commonly, individual soils on the landscape merge into one another as their characteristics gradually change. To construct an accurate soil map, however, soil scientists must determine the boundaries between the soils. They can observe only a limited number of soil profiles. Nevertheless, these observations, supplemented by an understanding of the soil-vegetation-landscape relationship, are sufficient to verify predictions of the kinds of soil in an area and to determine the boundaries.
Soil scientists recorded the characteristics of the soil profiles that they studied. They noted soil color, texture, size and shape of soil aggregates, kind and amount of rock fragments, distribution of plant roots, reaction, and other features that enable them to identify soils. After describing the soils in the survey area and determining their properties, the soil scientists assigned the soils to taxonomic classes (units). Taxonomic classes are concepts. Each taxonomic class has a set of soil characteristics with precisely defined limits. The classes are used as a basis for comparison to classify soils systematically. Soil taxonomy, the system of taxonomic classification used in the United States, is based mainly on the kind and character of soil properties and the arrangement of horizons within the profile. After the soil
scientists classified and named the soils in the survey area, they compared the individual soils with similar soils in the same taxonomic class in other areas so that they could confirm data and assemble additional data based on experience and research.
The objective of soil mapping is not to delineate pure map unit components; the objective is to separate the landscape into landforms or landform segments that have similar use and management requirements. Each map unit is defined by a unique combination of soil components and/or miscellaneous areas in predictable proportions. Some components may be highly contrasting to the other components of the map unit. The presence of minor components in a map unit in no way diminishes the usefulness or accuracy of the data. The delineation of such landforms and landform segments on the map provides sufficient information for the development of resource plans. If intensive use of small areas is planned, onsite investigation is needed to define and locate the soils and miscellaneous areas.
Soil scientists make many field observations in the process of producing a soil map. The frequency of observation is dependent upon several factors, including scale of mapping, intensity of mapping, design of map units, complexity of the landscape, and experience of the soil scientist. Observations are made to test and refine the soil-landscape model and predictions and to verify the classification of the soils at specific locations. Once the soil-landscape model is refined, a significantly smaller number of measurements of individual soil properties are made and recorded. These measurements may include field measurements, such as those for color, depth to bedrock, and texture, and laboratory measurements, such as those for content of sand, silt, clay, salt, and other components. Properties of each soil typically vary from one point to another across the landscape.
Observations for map unit components are aggregated to develop ranges of characteristics for the components. The aggregated values are presented. Direct measurements do not exist for every property presented for every map unit component. Values for some properties are estimated from combinations of other properties.
While a soil survey is in progress, samples of some of the soils in the area generally are collected for laboratory analyses and for engineering tests. Soil scientists interpret the data from these analyses and tests as well as the field-observed characteristics and the soil properties to determine the expected behavior of the soils under different uses. Interpretations for all of the soils are field tested through observation of the soils in different uses and under different levels of management. Some interpretations are modified to fit local conditions, and some new interpretations are developed to meet local needs. Data are assembled from other sources, such as research information, production records, and field experience of specialists. For example, data on crop yields under defined levels of management are assembled from farm records and from field or plot experiments on the same kinds of soil.
Predictions about soil behavior are based not only on soil properties but also on such variables as climate and biological activity. Soil conditions are predictable over long periods of time, but they are not predictable from year to year. For example, soil scientists can predict with a fairly high degree of accuracy that a given soil will have a high water table within certain depths in most years, but they cannot predict that a high water table will always be at a specific level in the soil on a specific date.
After soil scientists located and identified the significant natural bodies of soil in the survey area, they drew the boundaries of these bodies on aerial photographs and
identified each as a specific map unit. Aerial photographs show trees, buildings, fields, roads, and rivers, all of which help in locating boundaries accurately.
Soil Map
The soil map section includes the soil map for the defined area of interest, a list of soil map units on the map and extent of each map unit, and cartographic symbols displayed on the map. Also presented are various metadata about data used to produce the map, and a description of each soil map unit.
Area of Interest (AOI)
Soils
MAP LEGEND
Area of Interest (AOI)
Soil Map Unit Polygons
Soil Map Unit Lines
Soil Map Unit Points
Special Point Features Blowout
Borrow Pit
Clay Spot
Closed Depression
Gravel Pit
Gravelly Spot
Landfill
Lava Flow
Marsh or swamp
Mine or Quarry
Miscellaneous Water
Perennial Water
Rock Outcrop
Saline Spot
Sandy Spot
Severely Eroded Spot
Sinkhole
Slide or Slip

Sodic Spot
and Canals
Highways
MAP INFORMATION
The soil surveys that comprise your AOI were mapped at 1:15,800.
Please rely on the bar scale on each map sheet for map measurements.
Source of Map: Natural Resources Conservation Service Web Soil Survey URL: Coordinate System: Web Mercator (EPSG:3857)
Maps from the Web Soil Survey are based on the Web Mercator projection, which preserves direction and shape but distorts distance and area. A projection that preserves area, such as the Albers equal-area conic projection, should be used if more accurate calculations of distance or area are required.
This product is generated from the USDA-NRCS certified data as of the version date(s) listed below.
Soil Survey Area: Morrow County, Ohio Survey Area Data: Version 23, Aug 28, 2024
Soil map units are labeled (as space allows) for map scales 1:50,000 or larger.
Date(s) aerial images were photographed: May 21, 2023—Aug 8, 2023
The orthophoto or other base map on which the soil lines were compiled and digitized probably differs from the background imagery displayed on these maps. As a result, some minor shifting of map unit boundaries may be evident.
Map Unit Legend
Blount silt loam, ground moraine, 0 to 2 percent slopes
Blount silt loam, ground moraine, 2 to 4 percent slopes
Gallman silt loam, loamy substratum, 2 to 6 percent slopes
Glynwood silt loam, ground moraine, 2 to 6 percent slopes
Glynwood clay loam, ground moraine, 6 to 12 percent slopes, eroded
silty clay loam, 0 to 2 percent slopes
to 1 percent slopes
So Sloan silty clay loam, sandy substratum, occasionally flooded
Map Unit Descriptions
The map units delineated on the detailed soil maps in a soil survey represent the soils or miscellaneous areas in the survey area. The map unit descriptions, along with the maps, can be used to determine the composition and properties of a unit.
A map unit delineation on a soil map represents an area dominated by one or more major kinds of soil or miscellaneous areas. A map unit is identified and named according to the taxonomic classification of the dominant soils. Within a taxonomic class there are precisely defined limits for the properties of the soils. On the landscape, however, the soils are natural phenomena, and they have the characteristic variability of all natural phenomena. Thus, the range of some observed properties may extend beyond the limits defined for a taxonomic class. Areas of soils of a single taxonomic class rarely, if ever, can be mapped without including areas of other taxonomic classes. Consequently, every map unit is made up of the soils or miscellaneous areas for which it is named and some minor components that belong to taxonomic classes other than those of the major soils. Most minor soils have properties similar to those of the dominant soil or soils in the map unit, and thus they do not affect use and management. These are called noncontrasting, or similar, components. They may or may not be mentioned in a particular map unit description. Other minor components, however, have properties
and behavioral characteristics divergent enough to affect use or to require different management. These are called contrasting, or dissimilar, components. They generally are in small areas and could not be mapped separately because of the scale used. Some small areas of strongly contrasting soils or miscellaneous areas are identified by a special symbol on the maps. If included in the database for a given area, the contrasting minor components are identified in the map unit descriptions along with some characteristics of each. A few areas of minor components may not have been observed, and consequently they are not mentioned in the descriptions, especially where the pattern was so complex that it was impractical to make enough observations to identify all the soils and miscellaneous areas on the landscape.
The presence of minor components in a map unit in no way diminishes the usefulness or accuracy of the data. The objective of mapping is not to delineate pure taxonomic classes but rather to separate the landscape into landforms or landform segments that have similar use and management requirements. The delineation of such segments on the map provides sufficient information for the development of resource plans. If intensive use of small areas is planned, however, onsite investigation is needed to define and locate the soils and miscellaneous areas.
An identifying symbol precedes the map unit name in the map unit descriptions. Each description includes general facts about the unit and gives important soil properties and qualities.
Soils that have profiles that are almost alike make up a soil series. Except for differences in texture of the surface layer, all the soils of a series have major horizons that are similar in composition, thickness, and arrangement.
Soils of one series can differ in texture of the surface layer, slope, stoniness, salinity, degree of erosion, and other characteristics that affect their use. On the basis of such differences, a soil series is divided into soil phases. Most of the areas shown on the detailed soil maps are phases of soil series. The name of a soil phase commonly indicates a feature that affects use or management. For example, Alpha silt loam, 0 to 2 percent slopes, is a phase of the Alpha series.
Some map units are made up of two or more major soils or miscellaneous areas. These map units are complexes, associations, or undifferentiated groups.
A complex consists of two or more soils or miscellaneous areas in such an intricate pattern or in such small areas that they cannot be shown separately on the maps. The pattern and proportion of the soils or miscellaneous areas are somewhat similar in all areas. Alpha-Beta complex, 0 to 6 percent slopes, is an example.
An association is made up of two or more geographically associated soils or miscellaneous areas that are shown as one unit on the maps. Because of present or anticipated uses of the map units in the survey area, it was not considered practical or necessary to map the soils or miscellaneous areas separately. The pattern and relative proportion of the soils or miscellaneous areas are somewhat similar. Alpha-Beta association, 0 to 2 percent slopes, is an example.
An undifferentiated group is made up of two or more soils or miscellaneous areas that could be mapped individually but are mapped as one unit because similar interpretations can be made for use and management. The pattern and proportion of the soils or miscellaneous areas in a mapped area are not uniform. An area can be made up of only one of the major soils or miscellaneous areas, or it can be made up of all of them. Alpha and Beta soils, 0 to 2 percent slopes, is an example.
Some surveys include miscellaneous areas. Such areas have little or no soil material and support little or no vegetation. Rock outcrop is an example.
Morrow County, Ohio
Blg1A1—Blount silt loam, ground moraine, 0 to 2 percent slopes
Map Unit Setting
National map unit symbol: 2skcv
Elevation: 700 to 1,300 feet
Mean annual precipitation: 34 to 42 inches
Mean annual air temperature: 48 to 54 degrees F
Frost-free period: 140 to 180 days
Farmland classification: Prime farmland if drained
Map Unit Composition
Blount, ground moraine, and similar soils: 85 percent
Minor components: 15 percent
Estimates are based on observations, descriptions, and transects of the mapunit.
Description of Blount, Ground Moraine
Setting
Landform: Ground moraines on till plains
Landform position (two-dimensional): Footslope
Landform position (three-dimensional): Interfluve
Down-slope shape: Linear
Across-slope shape: Linear
Parent material: Wisconsin till derived from limestone and shale
Typical profile
Ap - 0 to 10 inches: silt loam
Bt - 10 to 33 inches: silty clay
BC - 33 to 39 inches: clay loam
Cd - 39 to 79 inches: clay loam
Properties and qualities
Slope: 0 to 2 percent
Depth to restrictive feature: 31 to 54 inches to densic material
Drainage class: Somewhat poorly drained
Runoff class: High
Capacity of the most limiting layer to transmit water (Ksat): Low to moderately high (0.01 to 0.20 in/hr)
Depth to water table: About 6 to 12 inches
Frequency of flooding: None
Frequency of ponding: None
Calcium carbonate, maximum content: 35 percent
Maximum salinity: Nonsaline to very slightly saline (0.0 to 2.0 mmhos/cm)
Available water supply, 0 to 60 inches: Moderate (about 6.2 inches)
Interpretive groups
Land capability classification (irrigated): None specified
Land capability classification (nonirrigated): 2w
Hydrologic Soil Group: D
Ecological site: F111XB502IN - Wet Till Ridge
Hydric soil rating: No
Minor Components
Pewamo, ground moraine
Percent of map unit: 9 percent
Landform: Ground moraines on till plains
Landform position (two-dimensional): Toeslope
Landform position (three-dimensional): Base slope
Down-slope shape: Linear
Across-slope shape: Linear, concave
Ecological site: F111XB501IN - Till Depression
Hydric soil rating: Yes
Glynwood, ground moraine
Percent of map unit: 6 percent
Landform: Ground moraines on till plains
Landform position (two-dimensional): Shoulder, backslope
Landform position (three-dimensional): Side slope, nose slope
Down-slope shape: Convex
Across-slope shape: Linear
Ecological site: F111XE503IN - Till Ridge
Hydric soil rating: No
Blg1B1—Blount silt loam, ground moraine, 2 to 4 percent slopes
Map Unit Setting
National map unit symbol: 2s1j6
Elevation: 700 to 1,300 feet
Mean annual precipitation: 34 to 42 inches
Mean annual air temperature: 48 to 54 degrees F
Frost-free period: 140 to 180 days
Farmland classification: Prime farmland if drained
Map Unit Composition
Blount, ground moraine, and similar soils: 85 percent
Minor components: 15 percent
Estimates are based on observations, descriptions, and transects of the mapunit.
Description of Blount, Ground Moraine
Setting
Landform: Ground moraines on till plains
Landform position (two-dimensional): Summit, backslope
Landform position (three-dimensional): Interfluve
Down-slope shape: Linear
Across-slope shape: Linear
Parent material: Wisconsin till derived from limestone and shale
Typical profile
Ap - 0 to 9 inches: silt loam
Bt - 9 to 32 inches: silty clay
BC - 32 to 37 inches: clay loam
Cd - 37 to 79 inches: clay loam
Properties and qualities
Slope: 2 to 4 percent
Depth to restrictive feature: 30 to 54 inches to densic material
Drainage class: Somewhat poorly drained
Runoff class: High
Capacity of the most limiting layer to transmit water (Ksat): Low to moderately high (0.01 to 0.20 in/hr)
Depth to water table: About 6 to 12 inches
Frequency of flooding: None
Frequency of ponding: None
Calcium carbonate, maximum content: 35 percent
Maximum salinity: Nonsaline to very slightly saline (0.0 to 2.0 mmhos/cm)
Available water supply, 0 to 60 inches: Low (about 5.6 inches)
Interpretive groups
Land capability classification (irrigated): None specified
Land capability classification (nonirrigated): 2e
Hydrologic Soil Group: D
Ecological site: F111XB502IN - Wet Till Ridge
Hydric soil rating: No
Minor
Components
Pewamo, ground moraine
Percent of map unit: 9 percent
Landform: Ground moraines on till plains
Landform position (two-dimensional): Toeslope
Landform position (three-dimensional): Base slope
Down-slope shape: Linear
Across-slope shape: Concave
Ecological site: F111XB501IN - Till Depression
Hydric soil rating: Yes
Glynwood, ground moraine
Percent of map unit: 6 percent
Landform: Ground moraines on till plains
Landform position (two-dimensional): Shoulder, backslope
Landform position (three-dimensional): Side slope, nose slope
Down-slope shape: Convex
Across-slope shape: Linear
Ecological site: F111XE503IN - Till Ridge
Hydric soil rating: No
Map Unit Setting
National map unit symbol: 5q87
Elevation: 800 to 900 feet
GaB—Gallman silt loam, loamy substratum, 2 to 6 percent slopes
Mean annual precipitation: 30 to 42 inches
Mean annual air temperature: 48 to 55 degrees F
Frost-free period: 140 to 180 days
Farmland classification: All areas are prime farmland
Map Unit Composition
Gallman and similar soils: 85 percent
Minor components: 15 percent
Estimates are based on observations, descriptions, and transects of the mapunit.
Description of Gallman
Setting
Landform: Outwash terraces, moraines, kames, outwash plains
Landform position (two-dimensional): Summit, shoulder, backslope
Landform position (three-dimensional): Riser, tread
Down-slope shape: Linear
Across-slope shape: Linear
Parent material: Poorly sorted outwash
Typical profile
H1 - 0 to 10 inches: silt loam
H2 - 10 to 77 inches: gravelly clay loam
H3 - 77 to 88 inches: gravelly loam
Properties and qualities
Slope: 2 to 6 percent
Depth to restrictive feature: More than 80 inches
Drainage class: Well drained
Runoff class: Low
Capacity of the most limiting layer to transmit water (Ksat): Moderately high to high (0.60 to 2.00 in/hr)
Depth to water table: More than 80 inches
Frequency of flooding: None
Frequency of ponding: None
Calcium carbonate, maximum content: 25 percent
Available water supply, 0 to 60 inches: Moderate (about 8.0 inches)
Interpretive groups
Land capability classification (irrigated): None specified
Land capability classification (nonirrigated): 2e
Hydrologic Soil Group: B
Ecological site: F111XE404OH - Dry Outwash Upland
Hydric soil rating: No
Minor Components
Amanda
Percent of map unit: 3 percent
Landform: Ground moraines, end moraines
Ecological site: F111XE503OH - Till Ridge
Glynwood
Percent of map unit: 3 percent
Landform: End moraines, ground moraines
Centerburg
Percent of map unit: 3 percent
Landform: Moraines, till plains
Landform position (two-dimensional): Summit, shoulder
Down-slope shape: Convex
Across-slope shape: Linear
Ecological site: F111XE503OH - Till Ridge
Shale bedrock below 60 inches
Percent of map unit: 2 percent
Sleeth
Percent of map unit: 2 percent
Landform: Outwash plains, stream terraces, outwash terraces
Ecological site: F111XE403OH - Outwash Upland
Millgrove
Percent of map unit: 2 percent
Landform: Depressions
Ecological site: R111XE401OH - Wet Outwash Mollisol
Hydric soil rating: Yes
More sand and less silt and clay in underlying material
Percent of map unit:
Less than 55 inches to underlying material
Percent of map unit:
Moderately well drained soils
Percent of map unit:
Till below 60 inches
Percent of map unit:
Gwg1B1—Glynwood silt loam, ground moraine, 2 to 6 percent slopes
Map Unit Setting
National map unit symbol: 2v4bl
Elevation: 700 to 1,300 feet
Mean annual precipitation: 34 to 42 inches
Mean annual air temperature: 48 to 54 degrees F
Frost-free period: 140 to 180 days
Farmland classification: All areas are prime farmland
Map Unit Composition
Glynwood, ground moraine, and similar soils: 85 percent
Minor components: 15 percent
Estimates are based on observations, descriptions, and transects of the mapunit.
Description of Glynwood, Ground Moraine
Setting
Landform: Ground moraines on till plains
Landform position (two-dimensional): Shoulder, backslope
Landform position (three-dimensional): Side slope, nose slope
Down-slope shape: Linear, convex
Across-slope shape: Convex, linear
Parent material: Wisconsin till derived from limestone and shale
Typical profile
Ap - 0 to 9 inches: silt loam
Bt - 9 to 29 inches: clay
BC - 29 to 34 inches: clay loam
Cd - 34 to 79 inches: clay loam
Properties and qualities
Slope: 2 to 6 percent
Depth to restrictive feature: 28 to 45 inches to densic material
Drainage class: Moderately well drained
Runoff class: High
Capacity of the most limiting layer to transmit water (Ksat): Low to moderately high (0.01 to 0.20 in/hr)
Depth to water table: About 12 to 24 inches
Frequency of flooding: None
Frequency of ponding: None
Calcium carbonate, maximum content: 35 percent
Maximum salinity: Nonsaline to very slightly saline (0.0 to 2.0 mmhos/cm)
Available water supply, 0 to 60 inches: Low (about 5.2 inches)
Interpretive groups
Land capability classification (irrigated): None specified
Land capability classification (nonirrigated): 2e
Hydrologic Soil Group: D
Ecological site: F111XE503IN - Till Ridge
Hydric soil rating: No
Minor Components
Blount, ground moraine
Percent of map unit: 9 percent
Landform: Ground moraines on till plains
Landform position (two-dimensional): Summit, backslope
Landform position (three-dimensional): Interfluve
Down-slope shape: Convex, linear
Across-slope shape: Linear
Ecological site: F111XB502IN - Wet Till Ridge
Hydric soil rating: No
Pewamo
Percent of map unit: 6 percent
Landform: Ground moraines on till plains
Landform position (two-dimensional): Toeslope
Landform position (three-dimensional): Base slope
Down-slope shape: Linear
Across-slope shape: Concave
Ecological site: F111XB501IN - Till Depression
Hydric soil rating: Yes
Gwg5C2—Glynwood clay loam, ground moraine, 6 to 12 percent slopes, eroded
Map Unit Setting
National map unit symbol: 2psgr
Elevation: 750 to 1,300 feet
Mean annual precipitation: 34 to 42 inches
Mean annual air temperature: 48 to 55 degrees F
Frost-free period: 140 to 180 days
Farmland classification: Not prime farmland
Map Unit Composition
Glynwood and similar soils: 85 percent
Minor components: 15 percent
Estimates are based on observations, descriptions, and transects of the mapunit.
Description of Glynwood Setting
Landform: Ground moraines
Landform position (two-dimensional): Shoulder, backslope
Landform position (three-dimensional): Side slope
Down-slope shape: Convex
Across-slope shape: Linear
Parent material: Clayey till
Typical profile
Ap - 0 to 7 inches: clay loam
Bt - 7 to 24 inches: clay
BC - 24 to 29 inches: clay loam
Cd - 29 to 80 inches: clay loam
Properties and qualities
Slope: 6 to 12 percent
Depth to restrictive feature: 24 to 36 inches to densic material
Drainage class: Moderately well drained
Runoff class: Very high
Capacity of the most limiting layer to transmit water (Ksat): Low to moderately high (0.01 to 0.20 in/hr)
Depth to water table: About 12 to 24 inches
Frequency of flooding: None
Frequency of ponding: None
Calcium carbonate, maximum content: 35 percent
Available water supply, 0 to 60 inches: Low (about 4.3 inches)
Interpretive groups
Land capability classification (irrigated): None specified
Land capability classification (nonirrigated): 3e
Hydrologic Soil Group: D
Ecological site: F111XE503IN - Till Ridge
Hydric soil rating: No
Minor Components
Blount
Percent of map unit: 8 percent
Landform: Flats on ground moraines
Landform position (two-dimensional): Footslope
Landform position (three-dimensional): Interfluve
Down-slope shape: Linear
Across-slope shape: Linear
Ecological site: F111XB502IN - Wet Till Ridge
Hydric soil rating: No
Pewamo
Percent of map unit: 7 percent
Landform: Depressions on till plains
Landform position (two-dimensional): Toeslope
Down-slope shape: Concave
Across-slope shape: Linear
Ecological site: F111XB501IN - Till Depression
Hydric soil rating: Yes
Mf—Milford silty clay loam, 0 to 2 percent slopes
Map Unit Setting
National map unit symbol: 2wp28
Elevation: 640 to 1,150 feet
Mean annual precipitation: 29 to 40 inches
Mean annual air temperature: 46 to 50 degrees F
Frost-free period: 140 to 185 days
Farmland classification: Prime farmland if drained
Map Unit Composition
Milford and similar soils: 90 percent
Minor components: 10 percent
Estimates are based on observations, descriptions, and transects of the mapunit.
Description of Milford
Setting
Landform: Lake plains
Landform position (three-dimensional): Talf
Down-slope shape: Linear
Across-slope shape: Concave
Parent material: Lacustrine deposits
Typical profile
Ap - 0 to 13 inches: silty clay loam
Bg1 - 13 to 28 inches: silty clay
Bg2 - 28 to 50 inches: silty clay loam
Cg - 50 to 79 inches: stratified silt loam to silty clay loam to silty clay
Properties and qualities
Slope: 0 to 2 percent
Depth to restrictive feature: More than 80 inches
Drainage class: Poorly drained
Runoff class: Negligible
Capacity of the most limiting layer to transmit water (Ksat): Moderately high (0.20 to 0.60 in/hr)
Depth to water table: About 0 to 6 inches
Frequency of flooding: None
Frequency of ponding: Frequent
Calcium carbonate, maximum content: 30 percent
Maximum salinity: Nonsaline to very slightly saline (0.0 to 2.0 mmhos/cm)
Available water supply, 0 to 60 inches: High (about 9.8 inches)
Interpretive groups
Land capability classification (irrigated): None specified
Land capability classification (nonirrigated): 2w
Hydrologic Soil Group: C/D
Ecological site: F111XB101IN - Lacustrine Flatwood
Hydric soil rating: Yes
Minor Components
Del rey
Percent of map unit: 7 percent
Landform: Lake plains
Landform position (three-dimensional): Rise
Down-slope shape: Linear
Across-slope shape: Convex
Ecological site: F111XB102IN - Lacustrine Forest
Hydric soil rating: No
Houghton, undrained
Percent of map unit: 3 percent
Landform: Lake plains
Landform position (three-dimensional): Dip
Down-slope shape: Concave
Across-slope shape: Concave
Ecological site: R111XB003IN - Deep Muck
Hydric soil rating: Yes
Map Unit Setting
National map unit symbol: 2t6lv
Elevation: 700 to 1,300 feet
Mean annual precipitation: 32 to 42 inches
Mean annual air temperature: 48 to 54 degrees F
Frost-free period: 140 to 180 days
Pm—Pewamo silty clay loam, 0 to 1 percent slopes
Farmland classification: Prime farmland if drained
Map Unit Composition
Pewamo and similar soils: 85 percent
Minor components: 15 percent
Estimates are based on observations, descriptions, and transects of the mapunit.
Description of Pewamo
Setting
Landform: Drainageways on till plains, depressions on till plains
Landform position (two-dimensional): Toeslope
Landform position (three-dimensional): Base slope
Down-slope shape: Linear, concave
Across-slope shape: Concave
Parent material: Wisconsin till derived from limestone and shale
Typical profile
Ap - 0 to 11 inches: silty clay loam
Btg1 - 11 to 34 inches: silty clay
Btg2 - 34 to 47 inches: silty clay
BCg - 47 to 57 inches: clay loam
Cg - 57 to 79 inches: clay loam
Properties and qualities
Slope: 0 to 1 percent
Depth to restrictive feature: More than 80 inches
Drainage class: Very poorly drained
Runoff class: Negligible
Capacity of the most limiting layer to transmit water (Ksat): Moderately high (0.20 to 0.60 in/hr)
Depth to water table: About 0 to 12 inches
Frequency of flooding: None
Frequency of ponding: Frequent
Calcium carbonate, maximum content: 30 percent
Maximum salinity: Nonsaline to very slightly saline (0.0 to 2.0 mmhos/cm)
Available water supply, 0 to 60 inches: Moderate (about 8.5 inches)
Interpretive groups
Land capability classification (irrigated): None specified
Land capability classification (nonirrigated): 2w
Hydrologic Soil Group: C/D
Ecological site: F111XB501IN - Till Depression
Hydric soil rating: Yes
Minor Components
Blount
Percent of map unit: 9 percent
Landform: End moraines on till plains, ground moraines on till plains
Landform position (two-dimensional): Footslope
Landform position (three-dimensional): Interfluve
Down-slope shape: Linear
Across-slope shape: Linear
Ecological site: F111XB502IN - Wet Till Ridge
Hydric soil rating: No
Minster
Percent of map unit: 6 percent
Landform: Depressions on till plains
Landform position (two-dimensional): Toeslope
Landform position (three-dimensional): Base slope
Down-slope shape: Concave
Across-slope shape: Concave
Ecological site: F111XB101IN - Lacustrine Flatwood
Hydric soil rating: Yes
So—Sloan silty clay loam, sandy substratum, occasionally flooded
Map Unit Setting
National map unit symbol: 5q8v
Elevation: 900 to 1,000 feet
Mean annual precipitation: 34 to 42 inches
Mean annual air temperature: 48 to 55 degrees F
Frost-free period: 140 to 180 days
Farmland classification: Prime farmland if drained
Map Unit Composition
Sloan and similar soils: 86 percent
Minor components: 14 percent
Estimates are based on observations, descriptions, and transects of the mapunit.
Description of Sloan
Setting
Landform: Depressions
Parent material: Recent alluvium
Typical profile
H1 - 0 to 12 inches: silty clay loam
H2 - 12 to 48 inches: silty clay loam
H3 - 48 to 64 inches: stratified sandy loam to silty clay loam
H4 - 64 to 80 inches: gravelly loamy sand
Properties and qualities
Slope: 0 to 2 percent
Depth to restrictive feature: More than 80 inches
Drainage class: Very poorly drained
Runoff class: Low
Capacity of the most limiting layer to transmit water (Ksat): Moderately high to high (0.20 to 2.00 in/hr)
Depth to water table: About 0 to 12 inches
Frequency of flooding: Occasional
Frequency of ponding: None
Calcium carbonate, maximum content: 40 percent
Available water supply, 0 to 60 inches: High (about 11.5 inches)
Interpretive groups
Land capability classification (irrigated): None specified
Land capability classification (nonirrigated): 3w
Hydrologic Soil Group: B/D
Ecological site: F111XE201OH - Wet Alluvium Floodplain
Hydric soil rating: Yes
Minor Components
Milford
Percent of map unit: 4 percent
Landform: Lake plains
Ecological site: F111XE101OH - Lacustrine Flatwood
Hydric soil rating: Yes
Shoals
Percent of map unit: 3 percent
Landform: Flood plains
Ecological site: F111XE203OH - Wet Alluvium Forest
Hydric soil rating: No
Pewamo
Percent of map unit: 3 percent
Landform: Moraines
Hydric soil rating: Yes
Silt loam surface layer
Percent of map unit: 1 percent
Landform: Depressions
Hydric soil rating: Yes
More clay in the subsoil
Percent of map unit: 1 percent
Landform: Depressions
Hydric soil rating: Yes
Lighter colored surface layer
Percent of map unit: 1 percent
Landform: Depressions
Hydric soil rating: Yes
More gravel in the underlying material
Percent of map unit: 1 percent
Landform: Depressions
Hydric soil rating: Yes
Soil Information for All Uses Soil
Reports
The Soil Reports section includes various formatted tabular and narrative reports (tables) containing data for each selected soil map unit and each component of each unit. No aggregation of data has occurred as is done in reports in the Soil Properties and Qualities and Suitabilities and Limitations sections. The reports contain soil interpretive information as well as basic soil properties and qualities. A description of each report (table) is included.
Soil Erosion
This folder contains a collection of tabular reports that present soil erosion factors and groupings. The reports (tables) include all selected map units and components for each map unit. Soil erosion factors are soil properties and interpretations used in evaluating the soil for potential erosion. Example soil erosion factors can include K factor for the whole soil or on a rock free basis, T factor, wind erodibility group and wind erodibility index.
Conservation Planning
This report provides those soil attributes for the conservation plan for the map units in the selected area. The report includes the map unit symbol, the component name, and the percent of the component in the map unit. It provides the soil description along with the slope, runoff, T Factor, WEI, WEG, Erosion class, Drainage class, Land Capability Classification, and the engineering Hydrologic Group and the erosion factors Kf, the representative percentage of fragments, sand, silt, and clay in the mineral surface horizon. Missing surface data may indicate the presence of an organic surface layer. Further information on these factors can be found in the National Soil Survey Handbook section 618 found at the url http:// www.nrcs.usda.gov/wps/portal/nrcs/detail/soils/ref/?cid=nrcs142p2_054223#00 .
Soil properties and interpretations for conservation planning. The surface mineral horizon properties are displayed. Organic surface horizons are not displayed.
Map symbol and soil name
Blg1A1—Blount silt loam, ground moraine, 0 to 2 percent slopes
Conservation Planning–Morrow County, Ohio
Blg1B1—Blount silt loam, ground moraine, 2 to 4 percent slopes
ground
GaB—Gallman silt loam, loamy substratum, 2 to 6
slopes
Gwg1B1—Glynwood silt loam, ground moraine, 2 to 6 percent slopes
ground moraine
Gwg5C2—Glynwood clay loam, ground moraine, 6 to 12 percent slopes, eroded
Mf—Milford silty clay loam, 0 to 2 percent slopes
Pm—Pewamo silty clay loam, 0 to 1 percent slopes
So—Sloan silty clay loam, sandy substratum, occasionally flooded
Conservation Planning–Morrow County, Ohio
References
American Association of State Highway and Transportation Officials (AASHTO). 2004. Standard specifications for transportation materials and methods of sampling and testing. 24th edition.
American Society for Testing and Materials (ASTM). 2005. Standard classification of soils for engineering purposes. ASTM Standard D2487-00.
Cowardin, L.M., V. Carter, F.C. Golet, and E.T. LaRoe. 1979. Classification of wetlands and deep-water habitats of the United States. U.S. Fish and Wildlife Service FWS/OBS-79/31.
Federal Register. July 13, 1994. Changes in hydric soils of the United States.
Federal Register. September 18, 2002. Hydric soils of the United States.
Hurt, G.W., and L.M. Vasilas, editors. Version 6.0, 2006. Field indicators of hydric soils in the United States.
National Research Council. 1995. Wetlands: Characteristics and boundaries.
Soil Survey Division Staff. 1993. Soil survey manual. Soil Conservation Service. U.S. Department of Agriculture Handbook 18. http://www.nrcs.usda.gov/wps/portal/ nrcs/detail/national/soils/?cid=nrcs142p2_054262
Soil Survey Staff. 1999. Soil taxonomy: A basic system of soil classification for making and interpreting soil surveys. 2nd edition. Natural Resources Conservation Service, U.S. Department of Agriculture Handbook 436. http:// www.nrcs.usda.gov/wps/portal/nrcs/detail/national/soils/?cid=nrcs142p2_053577
Soil Survey Staff. 2010. Keys to soil taxonomy. 11th edition. U.S. Department of Agriculture, Natural Resources Conservation Service. http:// www.nrcs.usda.gov/wps/portal/nrcs/detail/national/soils/?cid=nrcs142p2_053580
Tiner, R.W., Jr. 1985. Wetlands of Delaware. U.S. Fish and Wildlife Service and Delaware Department of Natural Resources and Environmental Control, Wetlands Section.
United States Army Corps of Engineers, Environmental Laboratory. 1987. Corps of Engineers wetlands delineation manual. Waterways Experiment Station Technical Report Y-87-1.
United States Department of Agriculture, Natural Resources Conservation Service. National forestry manual. http://www.nrcs.usda.gov/wps/portal/nrcs/detail/soils/ home/?cid=nrcs142p2_053374
United States Department of Agriculture, Natural Resources Conservation Service. National range and pasture handbook. http://www.nrcs.usda.gov/wps/portal/nrcs/ detail/national/landuse/rangepasture/?cid=stelprdb1043084
United States Department of Agriculture, Natural Resources Conservation Service. National soil survey handbook, title 430-VI. http://www.nrcs.usda.gov/wps/portal/ nrcs/detail/soils/scientists/?cid=nrcs142p2_054242
United States Department of Agriculture, Natural Resources Conservation Service. 2006. Land resource regions and major land resource areas of the United States, the Caribbean, and the Pacific Basin. U.S. Department of Agriculture Handbook 296. http://www.nrcs.usda.gov/wps/portal/nrcs/detail/national/soils/? cid=nrcs142p2_053624
United States Department of Agriculture, Soil Conservation Service. 1961. Land capability classification. U.S. Department of Agriculture Handbook 210. http:// www.nrcs.usda.gov/Internet/FSE_DOCUMENTS/nrcs142p2_052290.pdf
GUIDANCE ON POST-CONSTRUCTION STORMWATER MANAGEMENT FOR SOLAR PANEL FIELDS

APPENDIX C




MATHCAD WORKSHEETS AND HYDROCAD REPORTS

APPENDIX D

Objective:
Time of Concentration Methods: Crossroads Solar Pre-Construction

Estimate Time of Concentration for a given watershed using accepted methods.
Source:
National Engineering Handbook, Part 630 Hydrology. Chapter 15 -Time of Concentration.
SCS Method for Watershed lag [630.1502(a)]

Drainage Area 1 Pre-Construction ≔ A 4489.835 acre
Drainage Area, ac ≔ l 32900 Flow
Average watershed Land Slope (%)

cn' 87
Retardance Factor (unitless)
Typically equivalent to CN

Time of Concentration, min

Drainage Area 2 Pre-Construction
A 676.734 acre
Drainage Area, ac
l 10250 Flow length, ft

cn' 88
Average watershed Land Slope (%)
Retardance Factor (unitless) Typically

Time of Concentration, min


Drainage Area 3 Pre-Construction ≔ A 309.505 acre
Drainage Area, ac
Average watershed Land Slope (%)
Retardance Factor (unitless) Typically


Time of Concentration, min

Drainage Area 4 Pre-Construction

Average watershed Land Slope (%)

Time of Concentration, min


Objective:
Time of Concentration Methods: Crossroads Solar Post-Construction

Estimate Time of Concentration for a given watershed using accepted methods.
Source:
National Engineering Handbook, Part 630 Hydrology. Chapter 15 -Time of Concentration.
SCS Method for Watershed lag [630.1502(a)]

Drainage Area 1 Post-Construction ≔ A 4489.835 acre
Drainage Area, ac ≔ l 32900
Average watershed Land Slope (%)

cn' 87
Retardance Factor (unitless)
Typically equivalent to CN

Time of Concentration, min

Drainage Area 2 Post-Construction
A 676.734 acre
Drainage Area, ac
l 10250 Flow length, ft

cn' 83
Average watershed Land Slope (%)
Retardance Factor (unitless) Typically

Time of Concentration, min


Drainage Area 3 Post-Construction ≔ A 309.505 acre
Drainage Area, ac
Average watershed Land Slope (%)
Retardance


Drainage Area 4 Post-Construction

Average watershed Land Slope (%)

Time of Concentration, min

DA 4 Post-Construction Routing Diagram for 17078-Stormwater Prepared by Verdantas LLC, Printed 4/22/2025
Subcat Reach Pond Link
Rainfall Events Listing
11 YearType II 24-hrDefault24.0012.182
22 YearType II 24-hrDefault24.0012.612
35 YearType II 24-hrDefault24.0013.202
410 YearType II 24-hrDefault24.0013.682
525 YearType II 24-hrDefault24.0014.352
650 YearType II 24-hrDefault24.0014.892
7100 YearType II 24-hrDefault24.0015.442
4/22/2025
17078-Stormwater
Prepared by Verdantas LLC
HydroCAD® 10.20-6a s/n 02018 © 2024 HydroCAD Software Solutions LLC
Area Listing (selected nodes)
Area (acres) CNDescription (subcatchment-numbers)
9,289.17587 (1E, 1P, 3P)
676.73488 (2E)
676.73483 (2P)
356.03489 (3E, 4E)
46.52986 (4P)
11,045.20687TOTAL AREA
Printed 4/22/2025
Page 3
17078-Stormwater
Prepared by Verdantas LLC
Type II 24-hr 1 Year Rainfall=2.18"
HydroCAD® 10.20-6a s/n 02018 © 2024 HydroCAD Software Solutions LLC
Time span=0.00-48.00 hrs, dt=0.01 hrs, 4801 points x 3
Runoff by SCS TR-20 method, UH=SCS, Weighted-CN
Printed 4/22/2025
Page 4
Reach routing by Dyn-Stor-Ind method - Pond routing by Dyn-Stor-Ind method
Subcatchment1E: DA1
Subcatchment1P: DA1
Runoff Area=4,489.835 ac 0.00% Impervious Runoff Depth=1.05"
Runoff Area=4,489.835 ac 0.00% Impervious Runoff Depth=1.05"
af
Subcatchment2E: DA2 Pre-Construction
Runoff Area=676.734 ac 0.00% Impervious Runoff Depth=1.11"
Subcatchment2P: DA2 Post-Construction
Subcatchment3E: DA3 Pre-Construction
Subcatchment3P: DA3 Post-Construction
Subcatchment4P: DA4 Post-Construction
17078-Stormwater
Prepared by Verdantas LLC
Type II 24-hr 1 Year Rainfall=2.18"
Printed 4/22/2025
HydroCAD® 10.20-6a s/n 02018 © 2024 HydroCAD Software Solutions LLC
Summary for Subcatchment 1E: DA 1 Pre-Construction
Runoff=742.39 cfs @ 15.79 hrs, Volume=392.257 af, Depth=1.05"
Runoff by SCS TR-20 method, UH=SCS, Weighted-CN, Time Span= 0.00-48.00 hrs, dt= 0.01 hrs
Type II 24-hr 1 Year Rainfall=2.18"
Area (ac)CNDescription
*4,489.83587
4,489.835100.00% Pervious Area
TcLengthSlopeVelocityCapacityDescription (min)(feet)(ft/ft)(ft/sec)(cfs)
290.0 Direct Entry,
Subcatchment 1E: DA 1 Pre-Construction
Type II 24-hr 1 Year Rainfall=2.18"
Runoff Area=4,489.835 ac Runoff Volume=392.257 af
Runoff Depth=1.05"
Page 5
Hydrograph
17078-Stormwater
Prepared by Verdantas LLC
Type II 24-hr 1 Year Rainfall=2.18"
Printed 4/22/2025
HydroCAD® 10.20-6a s/n 02018 © 2024 HydroCAD Software Solutions LLC
Summary for Subcatchment 1P: DA 1 Post-Construction
Runoff=742.39 cfs @ 15.79 hrs, Volume=392.257 af, Depth=1.05"
Runoff by SCS TR-20 method, UH=SCS, Weighted-CN, Time Span= 0.00-48.00 hrs, dt= 0.01 hrs
Type II 24-hr 1 Year Rainfall=2.18"
Area (ac)CNDescription *4,489.83587
4,489.835100.00% Pervious Area
TcLengthSlopeVelocityCapacityDescription (min)(feet)(ft/ft)(ft/sec)(cfs)
290.0 Direct Entry,
Subcatchment 1P: DA 1 Post-Construction
Type II 24-hr 1 Year Rainfall=2.18"
Runoff Area=4,489.835 ac Runoff Volume=392.257 af
Runoff Depth=1.05"
Page 6
17078-Stormwater
Prepared by Verdantas LLC
Type II 24-hr 1 Year Rainfall=2.18"
Printed 4/22/2025
HydroCAD® 10.20-6a s/n 02018 © 2024 HydroCAD Software Solutions LLC
Summary for Subcatchment 2E: DA 2 Pre-Construction
Runoff=203.95 cfs @ 13.78 hrs, Volume=62.718 af, Depth=1.11"
Runoff by SCS TR-20 method, UH=SCS, Weighted-CN, Time Span= 0.00-48.00 hrs, dt= 0.01 hrs
Type II 24-hr 1 Year Rainfall=2.18"
(ac)CNDescription
676.734100.00% Pervious Area TcLengthSlopeVelocityCapacityDescription
Direct Entry,
Subcatchment 2E: DA 2 Pre-Construction
Type II 24-hr 1 Year Rainfall=2.18"
Runoff Area=676.734 ac
Runoff Volume=62.718 af
Runoff Depth=1.11" Tc=144.2 min
Page 7
Hydrograph
17078-Stormwater
Prepared by Verdantas LLC
Type II 24-hr 1 Year Rainfall=2.18"
Printed 4/22/2025
HydroCAD® 10.20-6a s/n 02018 © 2024 HydroCAD Software Solutions LLC
Summary for Subcatchment 2P: DA 2 Post-Construction
Runoff=124.69 cfs @ 14.18 hrs, Volume=46.287 af, Depth=0.82"
Runoff by SCS TR-20 method, UH=SCS, Weighted-CN, Time Span= 0.00-48.00 hrs, dt= 0.01 hrs
Type II 24-hr 1 Year Rainfall=2.18"
(ac)CNDescription
676.734100.00% Pervious Area TcLengthSlopeVelocityCapacityDescription
Direct Entry,
Subcatchment 2P: DA 2 Post-Construction
Type II 24-hr 1 Year Rainfall=2.18"
Runoff Area=676.734 ac
Runoff Volume=46.287 af
Runoff Depth=0.82" Tc=172.4 min
Page 8
17078-Stormwater
Prepared by Verdantas LLC
Type II 24-hr 1 Year Rainfall=2.18"
Printed 4/22/2025
HydroCAD® 10.20-6a s/n 02018 © 2024 HydroCAD Software Solutions LLC
Summary for Subcatchment 3E: DA 3 Pre-Construction
Runoff=116.12 cfs @ 13.41 hrs, Volume=30.407 af, Depth=1.18"
Runoff by SCS TR-20 method, UH=SCS, Weighted-CN, Time Span= 0.00-48.00 hrs, dt= 0.01 hrs
Type II 24-hr 1 Year Rainfall=2.18"
Direct Entry,
Subcatchment 3E: DA 3 Pre-Construction
Type II 24-hr 1 Year Rainfall=2.18"
Runoff Area=309.505 ac
Runoff Volume=30.407 af
Runoff Depth=1.18" Tc=118.3 min
Page 9
Hydrograph
17078-Stormwater
Prepared by Verdantas LLC
Type II 24-hr 1 Year Rainfall=2.18"
Printed 4/22/2025
HydroCAD® 10.20-6a s/n 02018 © 2024 HydroCAD Software Solutions LLC
Summary for Subcatchment 3P: DA 3 Post-Construction
Runoff=96.08 cfs @ 13.48 hrs, Volume=27.040 af, Depth=1.05"
Runoff by SCS TR-20 method, UH=SCS, Weighted-CN, Time Span= 0.00-48.00 hrs, dt= 0.01 hrs
Type II 24-hr 1 Year Rainfall=2.18"
Direct Entry,
Subcatchment 3P: DA 3 Post-Construction
Type II 24-hr 1 Year Rainfall=2.18"
Runoff Area=309.505 ac
Runoff Volume=27.040 af
Runoff Depth=1.05" Tc=127.7 min
Page 10
Hydrograph
17078-Stormwater
Prepared by Verdantas LLC
Type II 24-hr 1 Year Rainfall=2.18"
Printed 4/22/2025
HydroCAD® 10.20-6a s/n 02018 © 2024 HydroCAD Software Solutions LLC
Summary for Subcatchment 4E: DA 4 Pre-Construction
Runoff=36.36 cfs @ 12.41 hrs, Volume=4.571 af, Depth=1.18"
Runoff by SCS TR-20 method, UH=SCS, Weighted-CN, Time Span= 0.00-48.00 hrs, dt= 0.01 hrs
Type II 24-hr 1 Year Rainfall=2.18"
Direct Entry,
Subcatchment 4E: DA 4 Pre-Construction
Type II 24-hr 1 Year Rainfall=2.18"
Runoff Area=46.529 ac
Runoff Volume=4.571 af Runoff Depth=1.18" Tc=44.5 min CN=89
Page 11
Hydrograph
17078-Stormwater
Prepared by Verdantas LLC
Type II 24-hr 1 Year Rainfall=2.18"
Printed 4/22/2025
HydroCAD® 10.20-6a s/n 02018 © 2024 HydroCAD Software Solutions LLC
Summary for Subcatchment 4P: DA 4 Post-Construction
Runoff=27.49 cfs @ 12.51 hrs, Volume=3.829 af, Depth=0.99"
Runoff by SCS TR-20 method, UH=SCS, Weighted-CN, Time Span= 0.00-48.00 hrs, dt= 0.01 hrs
Type II 24-hr 1 Year Rainfall=2.18"
Direct Entry,
Subcatchment 4P: DA 4 Post-Construction
Type II 24-hr 1 Year Rainfall=2.18"
Runoff Area=46.529 ac
Runoff Volume=3.829 af
Runoff Depth=0.99" Tc=49.8 min
Page 12
17078-Stormwater
Prepared by Verdantas LLC
Type II 24-hr 2 Year Rainfall=2.61"
HydroCAD® 10.20-6a s/n 02018 © 2024 HydroCAD Software Solutions LLC
Time span=0.00-48.00 hrs, dt=0.01 hrs, 4801 points x 3
Runoff by SCS TR-20 method, UH=SCS, Weighted-CN
Printed 4/22/2025
Page 13
Reach routing by Dyn-Stor-Ind method - Pond routing by Dyn-Stor-Ind method
Subcatchment1E: DA1
Subcatchment1P: DA1
Runoff Area=4,489.835 ac 0.00% Impervious Runoff Depth=1.40"
Runoff Area=4,489.835 ac 0.00% Impervious Runoff Depth=1.40"
Subcatchment2E: DA2 Pre-Construction
Runoff Area=676.734 ac 0.00% Impervious Runoff Depth=1.48"
Subcatchment2P: DA2 Post-Construction
Subcatchment3P: DA3 Post-Construction
17078-Stormwater
Prepared by Verdantas LLC
Type II 24-hr 2 Year Rainfall=2.61"
Printed 4/22/2025
HydroCAD® 10.20-6a s/n 02018 © 2024 HydroCAD Software Solutions LLC
Summary for Subcatchment 1E: DA 1 Pre-Construction
Runoff=1,005.52 cfs @ 15.79 hrs, Volume=525.176 af, Depth=1.40"
Runoff by SCS TR-20 method, UH=SCS, Weighted-CN, Time Span= 0.00-48.00 hrs, dt= 0.01 hrs
Type II 24-hr 2 Year Rainfall=2.61"
Area (ac)CNDescription *4,489.83587
4,489.835100.00% Pervious Area
TcLengthSlopeVelocityCapacityDescription (min)(feet)(ft/ft)(ft/sec)(cfs)
290.0 Direct Entry,
Subcatchment 1E: DA 1 Pre-Construction
Type II 24-hr 2 Year Rainfall=2.61"
Runoff Area=4,489.835 ac Runoff Volume=525.176 af
Runoff Depth=1.40"
Page 14
Hydrograph
17078-Stormwater
Prepared by Verdantas LLC
Type II 24-hr 2 Year Rainfall=2.61"
Printed 4/22/2025
HydroCAD® 10.20-6a s/n 02018 © 2024 HydroCAD Software Solutions LLC
Summary for Subcatchment 1P: DA 1 Post-Construction
Runoff=1,005.52 cfs @ 15.79 hrs, Volume=525.176 af, Depth=1.40"
Runoff by SCS TR-20 method, UH=SCS, Weighted-CN, Time Span= 0.00-48.00 hrs, dt= 0.01 hrs
Type II 24-hr 2 Year Rainfall=2.61" Area (ac)CNDescription *4,489.83587
4,489.835100.00% Pervious Area
TcLengthSlopeVelocityCapacityDescription (min)(feet)(ft/ft)(ft/sec)(cfs) 290.0 Direct Entry,
Subcatchment 1P: DA 1 Post-Construction
Type II 24-hr 2 Year Rainfall=2.61"
Runoff Area=4,489.835 ac Runoff Volume=525.176 af
Runoff Depth=1.40"
Page 15
17078-Stormwater
Prepared by Verdantas LLC
Type II 24-hr 2 Year Rainfall=2.61"
Printed 4/22/2025
HydroCAD® 10.20-6a s/n 02018 © 2024 HydroCAD Software Solutions LLC
Summary for Subcatchment 2E: DA 2 Pre-Construction
Runoff=273.05 cfs @ 13.78 hrs, Volume=83.243 af, Depth=1.48"
Runoff by SCS TR-20 method, UH=SCS, Weighted-CN, Time Span= 0.00-48.00 hrs, dt= 0.01 hrs
Type II 24-hr 2 Year Rainfall=2.61" Area (ac)CNDescription
676.734100.00% Pervious Area TcLengthSlopeVelocityCapacityDescription
Entry,
Subcatchment 2E: DA 2 Pre-Construction
Type II 24-hr 2 Year Rainfall=2.61"
Runoff Area=676.734 ac
Runoff Volume=83.243 af
Runoff Depth=1.48" Tc=144.2 min
Page 16
Hydrograph
17078-Stormwater
Prepared by Verdantas LLC
Type II 24-hr 2 Year Rainfall=2.61"
Printed 4/22/2025
HydroCAD® 10.20-6a s/n 02018 © 2024 HydroCAD Software Solutions LLC
Summary for Subcatchment 2P: DA 2 Post-Construction
Runoff=177.70 cfs @ 14.18 hrs, Volume=64.266 af, Depth=1.14"
Runoff by SCS TR-20 method, UH=SCS, Weighted-CN, Time Span= 0.00-48.00 hrs, dt= 0.01 hrs
Type II 24-hr 2 Year Rainfall=2.61"
(ac)CNDescription
Pervious Area TcLengthSlopeVelocityCapacityDescription
Direct Entry,
Subcatchment 2P: DA 2 Post-Construction
Type II 24-hr 2 Year Rainfall=2.61"
Runoff Area=676.734 ac Runoff Volume=64.266 af Runoff Depth=1.14" Tc=172.4 min
Page 17
17078-Stormwater
Prepared by Verdantas LLC
Type II 24-hr 2 Year Rainfall=2.61"
Printed 4/22/2025
HydroCAD® 10.20-6a s/n 02018 © 2024 HydroCAD Software Solutions LLC
Summary for Subcatchment 3E: DA 3 Pre-Construction
Runoff=153.71 cfs @ 13.41 hrs, Volume=40.012 af, Depth=1.55"
Runoff by SCS TR-20 method, UH=SCS, Weighted-CN, Time Span= 0.00-48.00 hrs, dt= 0.01 hrs
Type II 24-hr 2 Year Rainfall=2.61"
Direct Entry,
Subcatchment 3E: DA 3 Pre-Construction
Type II 24-hr 2 Year Rainfall=2.61"
Runoff Area=309.505 ac
Runoff Volume=40.012 af
Runoff Depth=1.55" Tc=118.3 min CN=89
Page 18
Hydrograph
17078-Stormwater
Prepared by Verdantas LLC
Type II 24-hr 2 Year Rainfall=2.61"
Printed 4/22/2025
HydroCAD® 10.20-6a s/n 02018 © 2024 HydroCAD Software Solutions LLC
Summary for Subcatchment 3P: DA 3 Post-Construction
Runoff=130.39 cfs @ 13.48 hrs, Volume=36.203 af, Depth=1.40"
Runoff by SCS TR-20 method, UH=SCS, Weighted-CN, Time Span= 0.00-48.00 hrs, dt= 0.01 hrs
Type II 24-hr 2 Year Rainfall=2.61"
Direct Entry,
Subcatchment 3P: DA 3 Post-Construction
Type II 24-hr 2 Year Rainfall=2.61"
Runoff Area=309.505 ac
Runoff Volume=36.203 af
Runoff Depth=1.40" Tc=127.7 min CN=87
Page 19
Hydrograph
17078-Stormwater
Prepared by Verdantas LLC
Type II 24-hr 2 Year Rainfall=2.61"
Printed 4/22/2025
HydroCAD® 10.20-6a s/n 02018 © 2024 HydroCAD Software Solutions LLC
Summary for Subcatchment 4E: DA 4 Pre-Construction
Runoff=48.06 cfs @ 12.41 hrs, Volume=6.015 af, Depth=1.55"
Runoff by SCS TR-20 method, UH=SCS, Weighted-CN, Time Span= 0.00-48.00 hrs, dt= 0.01 hrs
Type II 24-hr 2 Year Rainfall=2.61"
Direct Entry,
Subcatchment 4E: DA 4 Pre-Construction
Type II 24-hr 2 Year Rainfall=2.61"
Runoff Area=46.529 ac
Runoff Volume=6.015 af
Runoff Depth=1.55" Tc=44.5 min
CN=89
Page 20
Hydrograph
17078-Stormwater
Prepared by Verdantas LLC
Type II 24-hr 2 Year Rainfall=2.61"
Printed 4/22/2025
HydroCAD® 10.20-6a s/n 02018 © 2024 HydroCAD Software Solutions LLC
Summary for Subcatchment 4P: DA 4 Post-Construction
Runoff=37.62 cfs @ 12.50 hrs, Volume=5.172 af, Depth=1.33"
Runoff by SCS TR-20 method, UH=SCS, Weighted-CN, Time Span= 0.00-48.00 hrs, dt= 0.01 hrs
Type II 24-hr 2 Year Rainfall=2.61"
Direct Entry,
Subcatchment 4P: DA 4 Post-Construction
Type II 24-hr 2 Year Rainfall=2.61"
Runoff Area=46.529 ac
Runoff Volume=5.172 af Runoff Depth=1.33" Tc=49.8 min
Page 21
17078-Stormwater
Type II 24-hr 5 Year Rainfall=3.20"
Printed 4/22/2025
HydroCAD® 10.20-6a s/n 02018 © 2024 HydroCAD Software Solutions LLC
Prepared by Verdantas LLC Page 22
Time span=0.00-48.00 hrs, dt=0.01 hrs, 4801 points x 3
Runoff by SCS TR-20 method, UH=SCS, Weighted-CN
Reach routing by Dyn-Stor-Ind method - Pond routing by Dyn-Stor-Ind method
Subcatchment1E: DA1
Subcatchment1P: DA1
Runoff Area=4,489.835 ac 0.00% Impervious Runoff Depth=1.91"
Runoff Area=4,489.835 ac 0.00% Impervious Runoff Depth=1.91"
Subcatchment2E: DA2 Pre-Construction
Subcatchment2P: DA2 Post-Construction
Subcatchment3P: DA3 Post-Construction
DA4 Post-Construction
17078-Stormwater
Prepared by Verdantas LLC
Type II 24-hr 5 Year Rainfall=3.20"
Printed 4/22/2025
HydroCAD® 10.20-6a s/n 02018 © 2024 HydroCAD Software Solutions LLC
Summary for Subcatchment 1E: DA 1 Pre-Construction
Runoff=1,382.09 cfs @ 15.79 hrs, Volume=716.458 af, Depth=1.91"
Runoff by SCS TR-20 method, UH=SCS, Weighted-CN, Time Span= 0.00-48.00 hrs, dt= 0.01 hrs
Type II 24-hr 5 Year Rainfall=3.20" Area (ac)CNDescription
Subcatchment 1E: DA 1 Pre-Construction
Type II 24-hr 5 Year Rainfall=3.20"
Runoff Area=4,489.835 ac Runoff Volume=716.458 af
Runoff Depth=1.91"
Page 23
Hydrograph
17078-Stormwater
Prepared by Verdantas LLC
Type II 24-hr 5 Year Rainfall=3.20"
Printed 4/22/2025
HydroCAD® 10.20-6a s/n 02018 © 2024 HydroCAD Software Solutions LLC
Summary for Subcatchment 1P: DA 1 Post-Construction
Runoff=1,382.09 cfs @ 15.79 hrs, Volume=716.458 af, Depth=1.91"
Runoff by SCS TR-20 method, UH=SCS, Weighted-CN, Time Span= 0.00-48.00 hrs, dt= 0.01 hrs
Type II 24-hr 5 Year Rainfall=3.20"
Subcatchment 1P: DA 1 Post-Construction
Type II 24-hr 5 Year Rainfall=3.20"
Runoff Area=4,489.835 ac Runoff Volume=716.458 af
Runoff Depth=1.91"
Page 24
17078-Stormwater
Prepared by Verdantas LLC
Type II 24-hr 5 Year Rainfall=3.20"
Printed 4/22/2025
HydroCAD® 10.20-6a s/n 02018 © 2024 HydroCAD Software Solutions LLC
Summary for Subcatchment 2E: DA 2 Pre-Construction
Runoff=371.10 cfs @ 13.63 hrs, Volume=112.620 af, Depth=2.00"
Runoff by SCS TR-20 method, UH=SCS, Weighted-CN, Time Span= 0.00-48.00 hrs, dt= 0.01 hrs
Type II 24-hr 5 Year Rainfall=3.20"
(ac)CNDescription
676.734100.00% Pervious Area TcLengthSlopeVelocityCapacityDescription
Direct Entry,
Subcatchment 2E: DA 2 Pre-Construction
Type II 24-hr 5 Year Rainfall=3.20"
Runoff Area=676.734 ac Runoff Volume=112.620 af
Runoff Depth=2.00"
Page 25
Hydrograph
17078-Stormwater
Prepared by Verdantas LLC
Type II 24-hr 5 Year Rainfall=3.20"
Printed 4/22/2025
HydroCAD® 10.20-6a s/n 02018 © 2024 HydroCAD Software Solutions LLC
Summary for Subcatchment 2P: DA 2 Post-Construction
Runoff=255.63 cfs @ 14.17 hrs, Volume=90.749 af, Depth=1.61"
Runoff by SCS TR-20 method, UH=SCS, Weighted-CN, Time Span= 0.00-48.00 hrs, dt= 0.01 hrs
Type II 24-hr 5 Year Rainfall=3.20" Area (ac)CNDescription
676.734100.00% Pervious Area
Entry,
Subcatchment 2P: DA 2 Post-Construction
Type II 24-hr 5 Year Rainfall=3.20"
Runoff Area=676.734 ac
Runoff Volume=90.749 af Runoff Depth=1.61" Tc=172.4 min
Page 26
17078-Stormwater
Prepared by Verdantas LLC
Type II 24-hr 5 Year Rainfall=3.20"
Printed 4/22/2025
HydroCAD® 10.20-6a s/n 02018 © 2024 HydroCAD Software Solutions LLC
Summary for Subcatchment 3E: DA 3 Pre-Construction
Runoff=206.61 cfs @ 13.40 hrs, Volume=53.687 af, Depth=2.08"
Runoff by SCS TR-20 method, UH=SCS, Weighted-CN, Time Span= 0.00-48.00 hrs, dt= 0.01 hrs
Type II 24-hr 5 Year Rainfall=3.20"
Direct Entry,
Subcatchment 3E: DA 3 Pre-Construction
Type II 24-hr 5 Year Rainfall=3.20"
Runoff Area=309.505 ac Runoff Volume=53.687 af
Runoff Depth=2.08" Tc=118.3 min
Page 27
Hydrograph
17078-Stormwater
Prepared by Verdantas LLC
Type II 24-hr 5 Year Rainfall=3.20"
Printed 4/22/2025
HydroCAD® 10.20-6a s/n 02018 © 2024 HydroCAD Software Solutions LLC
Summary for Subcatchment 3P: DA 3 Post-Construction
Runoff=179.36 cfs @ 13.48 hrs, Volume=49.389 af, Depth=1.91"
Runoff by SCS TR-20 method, UH=SCS, Weighted-CN, Time Span= 0.00-48.00 hrs, dt= 0.01 hrs
Type II 24-hr 5 Year Rainfall=3.20"
Direct Entry,
Subcatchment 3P: DA 3 Post-Construction
Type II 24-hr 5 Year Rainfall=3.20"
Runoff Area=309.505 ac
Runoff Volume=49.389 af
Runoff Depth=1.91" Tc=127.7 min
Page 28
Hydrograph
17078-Stormwater
Prepared by Verdantas LLC
Type II 24-hr 5 Year Rainfall=3.20"
Printed 4/22/2025
HydroCAD® 10.20-6a s/n 02018 © 2024 HydroCAD Software Solutions LLC
Summary for Subcatchment 4E: DA 4 Pre-Construction
Runoff=64.49 cfs @ 12.41 hrs, Volume=8.071 af, Depth=2.08"
Runoff by SCS TR-20 method, UH=SCS, Weighted-CN, Time Span= 0.00-48.00 hrs, dt= 0.01 hrs
Type II 24-hr 5 Year Rainfall=3.20"
Direct Entry,
Subcatchment 4E: DA 4 Pre-Construction
Type II 24-hr 5 Year Rainfall=3.20"
Runoff Area=46.529 ac
Runoff Volume=8.071 af
Runoff Depth=2.08" Tc=44.5 min CN=89
Page 29
Hydrograph
17078-Stormwater
Prepared by Verdantas LLC
Type II 24-hr 5 Year Rainfall=3.20"
Printed 4/22/2025
HydroCAD® 10.20-6a s/n 02018 © 2024 HydroCAD Software Solutions LLC
Summary for Subcatchment 4P: DA 4 Post-Construction
Runoff=52.14 cfs @ 12.50 hrs, Volume=7.116 af, Depth=1.84"
Runoff by SCS TR-20 method, UH=SCS, Weighted-CN, Time Span= 0.00-48.00 hrs, dt= 0.01 hrs
Type II 24-hr 5 Year Rainfall=3.20"
Direct Entry,
Subcatchment 4P: DA 4 Post-Construction
Type II 24-hr 5 Year Rainfall=3.20"
Runoff Area=46.529 ac
Runoff Volume=7.116 af
Runoff Depth=1.84" Tc=49.8 min CN=86
Page 30
Hydrograph
17078-Stormwater
Type II 24-hr 10 Year Rainfall=3.68"
Printed 4/22/2025
HydroCAD® 10.20-6a s/n 02018 © 2024 HydroCAD Software Solutions LLC
Prepared by Verdantas LLC Page 31
Time span=0.00-48.00 hrs, dt=0.01 hrs, 4801 points x 3
Runoff by SCS TR-20 method, UH=SCS, Weighted-CN
Subcatchment1E: DA1
Reach routing by Dyn-Stor-Ind method - Pond routing by Dyn-Stor-Ind method Runoff Area=4,489.835 ac 0.00% Impervious Runoff Depth=2.34"
Subcatchment1P: DA1
Subcatchment2E: DA2 Pre-Construction
Subcatchment2P: DA2 Post-Construction
Subcatchment3P: DA3 Post-Construction
17078-Stormwater
Prepared by Verdantas LLC
Type II 24-hr 10 Year Rainfall=3.68"
Printed 4/22/2025
HydroCAD® 10.20-6a s/n 02018 © 2024 HydroCAD Software Solutions LLC
Summary for Subcatchment 1E: DA 1 Pre-Construction
Runoff=1,696.62 cfs @ 15.79 hrs, Volume=877.339 af, Depth=2.34"
Runoff by SCS TR-20 method, UH=SCS, Weighted-CN, Time Span= 0.00-48.00 hrs, dt= 0.01 hrs
Type II 24-hr 10 Year Rainfall=3.68" Area (ac)CNDescription *4,489.83587
4,489.835100.00% Pervious Area
TcLengthSlopeVelocityCapacityDescription (min)(feet)(ft/ft)(ft/sec)(cfs) 290.0 Direct Entry,
Subcatchment 1E: DA 1 Pre-Construction
Type II 24-hr 10 Year Rainfall=3.68"
Runoff Area=4,489.835 ac Runoff Volume=877.339 af Runoff Depth=2.34"
Page 32
17078-Stormwater
Prepared by Verdantas LLC
Type II 24-hr 10 Year Rainfall=3.68"
Printed 4/22/2025
HydroCAD® 10.20-6a s/n 02018 © 2024 HydroCAD Software Solutions LLC
Summary for Subcatchment 1P: DA 1 Post-Construction
Runoff=1,696.62 cfs @ 15.79 hrs, Volume=877.339 af, Depth=2.34"
Runoff by SCS TR-20 method, UH=SCS, Weighted-CN, Time Span= 0.00-48.00 hrs, dt= 0.01 hrs
Type II 24-hr 10 Year Rainfall=3.68" Area (ac)CNDescription *4,489.83587
4,489.835100.00% Pervious Area
TcLengthSlopeVelocityCapacityDescription (min)(feet)(ft/ft)(ft/sec)(cfs) 290.0 Direct Entry,
Subcatchment 1P: DA 1 Post-Construction
Type II 24-hr 10 Year Rainfall=3.68"
Runoff Area=4,489.835 ac Runoff Volume=877.339 af Runoff Depth=2.34"
Page 33
17078-Stormwater
Prepared by Verdantas LLC
Type II 24-hr 10 Year Rainfall=3.68"
Printed 4/22/2025
HydroCAD® 10.20-6a s/n 02018 © 2024 HydroCAD Software Solutions LLC
Summary for Subcatchment 2E: DA 2 Pre-Construction
Runoff=453.14 cfs @ 13.63 hrs, Volume=137.230 af, Depth=2.43"
Runoff by SCS TR-20 method, UH=SCS, Weighted-CN, Time Span= 0.00-48.00 hrs, dt= 0.01 hrs
Type II 24-hr 10 Year Rainfall=3.68"
(ac)CNDescription
Pervious
Direct Entry,
Subcatchment 2E: DA 2 Pre-Construction
Type II 24-hr 10 Year Rainfall=3.68"
Runoff Area=676.734 ac Runoff Volume=137.230 af
Runoff Depth=2.43"
Page 34
17078-Stormwater
Prepared by Verdantas LLC
Type II 24-hr 10 Year Rainfall=3.68"
Printed 4/22/2025
HydroCAD® 10.20-6a s/n 02018 © 2024 HydroCAD Software Solutions LLC
Summary for Subcatchment 2P: DA 2 Post-Construction
Runoff=321.97 cfs @ 14.17 hrs, Volume=113.406 af, Depth=2.01"
Runoff by SCS TR-20 method, UH=SCS, Weighted-CN, Time Span= 0.00-48.00 hrs, dt= 0.01 hrs
Type II 24-hr 10 Year Rainfall=3.68"
(ac)CNDescription
Pervious Area TcLengthSlopeVelocityCapacityDescription
Direct Entry,
Subcatchment 2P: DA 2 Post-Construction
Type II 24-hr 10 Year Rainfall=3.68"
Runoff Area=676.734 ac Runoff Volume=113.406 af
Runoff Depth=2.01" Tc=172.4 min
Page 35
17078-Stormwater
Prepared by Verdantas LLC
Type II 24-hr 10 Year Rainfall=3.68"
Printed 4/22/2025
HydroCAD® 10.20-6a s/n 02018 © 2024 HydroCAD Software Solutions LLC
Summary for Subcatchment 3E: DA 3 Pre-Construction
Runoff=250.28 cfs @ 13.40 hrs, Volume=65.100 af, Depth=2.52"
Runoff by SCS TR-20 method, UH=SCS, Weighted-CN, Time Span= 0.00-48.00 hrs, dt= 0.01 hrs
Type II 24-hr 10 Year Rainfall=3.68"
Direct Entry,
Subcatchment 3E: DA 3 Pre-Construction
Type II 24-hr 10 Year Rainfall=3.68"
Runoff Area=309.505 ac
Runoff Volume=65.100 af
Runoff Depth=2.52" Tc=118.3 min
CN=89
Page 36
Hydrograph
17078-Stormwater
Prepared by Verdantas LLC
Type II 24-hr 10 Year Rainfall=3.68"
Printed 4/22/2025
HydroCAD® 10.20-6a s/n 02018 © 2024 HydroCAD Software Solutions LLC
Summary for Subcatchment 3P: DA 3 Post-Construction
Runoff=220.17 cfs @ 13.48 hrs, Volume=60.479 af, Depth=2.34"
Runoff by SCS TR-20 method, UH=SCS, Weighted-CN, Time Span= 0.00-48.00 hrs, dt= 0.01 hrs
Type II 24-hr 10 Year Rainfall=3.68"
Direct Entry,
Subcatchment 3P: DA 3 Post-Construction
Type II 24-hr 10 Year Rainfall=3.68"
Runoff Area=309.505 ac Runoff Volume=60.479 af Runoff Depth=2.34" Tc=127.7 min
Page 37
Hydrograph
17078-Stormwater
Prepared by Verdantas LLC
Type II 24-hr 10 Year Rainfall=3.68"
Printed 4/22/2025
HydroCAD® 10.20-6a s/n 02018 © 2024 HydroCAD Software Solutions LLC
Summary for Subcatchment 4E: DA 4 Pre-Construction
Runoff=78.02 cfs @ 12.41 hrs, Volume=9.787 af, Depth=2.52"
Runoff by SCS TR-20 method, UH=SCS, Weighted-CN, Time Span= 0.00-48.00 hrs, dt= 0.01 hrs
Type II 24-hr 10 Year Rainfall=3.68"
Direct Entry,
Subcatchment 4E: DA 4 Pre-Construction
Type II 24-hr 10 Year Rainfall=3.68"
Runoff Area=46.529 ac
Runoff Volume=9.787 af
Runoff Depth=2.52" Tc=44.5 min CN=89
Page 38
Hydrograph
17078-Stormwater
Prepared by Verdantas LLC
Type II 24-hr 10 Year Rainfall=3.68"
Printed 4/22/2025
HydroCAD® 10.20-6a s/n 02018 © 2024 HydroCAD Software Solutions LLC
Summary for Subcatchment 4P: DA 4 Post-Construction
Runoff=64.29 cfs @ 12.46 hrs, Volume=8.757 af, Depth=2.26"
Runoff by SCS TR-20 method, UH=SCS, Weighted-CN, Time Span= 0.00-48.00 hrs, dt= 0.01 hrs
Type II 24-hr 10 Year Rainfall=3.68"
Direct Entry,
Subcatchment 4P: DA 4 Post-Construction
Type II 24-hr 10 Year Rainfall=3.68"
Runoff Area=46.529 ac
Runoff Volume=8.757 af
Runoff Depth=2.26" Tc=49.8 min CN=86
Page 39
Hydrograph
Type II 24-hr 25 Year Rainfall=4.35"
17078-Stormwater Printed 4/22/2025
HydroCAD® 10.20-6a s/n 02018 © 2024 HydroCAD Software Solutions LLC
Prepared by Verdantas LLC Page 40
Time span=0.00-48.00 hrs, dt=0.01 hrs, 4801 points x 3
Runoff by SCS TR-20 method, UH=SCS, Weighted-CN Reach routing by Dyn-Stor-Ind method - Pond routing by Dyn-Stor-Ind method
Subcatchment1E: DA1
Subcatchment1P: DA1
Runoff Area=4,489.835 ac 0.00% Impervious Runoff Depth=2.96"
Runoff Area=4,489.835 ac 0.00% Impervious Runoff Depth=2.96"
Subcatchment2E: DA2 Pre-Construction
Runoff Area=676.734 ac 0.00% Impervious Runoff Depth=3.06"
Subcatchment2P: DA2 Post-Construction
Subcatchment3P: DA3 Post-Construction
17078-Stormwater
Prepared by Verdantas LLC
Type II 24-hr 25 Year Rainfall=4.35"
Printed 4/22/2025
HydroCAD® 10.20-6a s/n 02018 © 2024 HydroCAD Software Solutions LLC
Summary for Subcatchment 1E: DA 1 Pre-Construction
Runoff=2,142.84 cfs @ 15.79 hrs, Volume=1,107.319 af, Depth=2.96"
Runoff by SCS TR-20 method, UH=SCS, Weighted-CN, Time Span= 0.00-48.00 hrs, dt= 0.01 hrs
Type II 24-hr 25 Year Rainfall=4.35"
Subcatchment 1E: DA 1 Pre-Construction
Type II 24-hr 25 Year Rainfall=4.35"
Runoff Area=4,489.835 ac Runoff Volume=1,107.319 af
Runoff Depth=2.96" Tc=290.0 min
Page 41
Hydrograph
17078-Stormwater
Prepared by Verdantas LLC
Type II 24-hr 25 Year Rainfall=4.35"
Printed 4/22/2025
HydroCAD® 10.20-6a s/n 02018 © 2024 HydroCAD Software Solutions LLC
Summary for Subcatchment 1P: DA 1 Post-Construction
Runoff=2,142.84 cfs @ 15.79 hrs, Volume=1,107.319 af, Depth=2.96"
Runoff by SCS TR-20 method, UH=SCS, Weighted-CN, Time Span= 0.00-48.00 hrs, dt= 0.01 hrs
Type II 24-hr 25 Year Rainfall=4.35"
Subcatchment 1P: DA 1 Post-Construction
Type II 24-hr 25 Year Rainfall=4.35"
Runoff Area=4,489.835 ac Runoff Volume=1,107.319 af
Page 42
17078-Stormwater
Prepared by Verdantas LLC
Type II 24-hr 25 Year Rainfall=4.35"
Printed 4/22/2025
HydroCAD® 10.20-6a s/n 02018 © 2024 HydroCAD Software Solutions LLC
Summary for Subcatchment 2E: DA 2 Pre-Construction
Runoff=569.11 cfs @ 13.62 hrs, Volume=172.308 af, Depth=3.06"
Runoff by SCS TR-20 method, UH=SCS, Weighted-CN, Time Span= 0.00-48.00 hrs, dt= 0.01 hrs
Type II 24-hr 25 Year Rainfall=4.35" Area (ac)CNDescription
676.734100.00% Pervious Area TcLengthSlopeVelocityCapacityDescription
Direct Entry,
Subcatchment 2E: DA 2 Pre-Construction
Type II 24-hr 25 Year Rainfall=4.35"
Runoff Area=676.734 ac
Runoff Volume=172.308 af
Runoff Depth=3.06" Tc=144.2 min
Page 43
Hydrograph
17078-Stormwater
Prepared by Verdantas LLC
Type II 24-hr 25 Year Rainfall=4.35"
Printed 4/22/2025
HydroCAD® 10.20-6a s/n 02018 © 2024 HydroCAD Software Solutions LLC
Summary for Subcatchment 2P: DA 2 Post-Construction
Runoff=418.26 cfs @ 13.99 hrs, Volume=146.213 af, Depth=2.59"
Runoff by SCS TR-20 method, UH=SCS, Weighted-CN, Time Span= 0.00-48.00 hrs, dt= 0.01 hrs
Type II 24-hr 25 Year Rainfall=4.35"
(ac)CNDescription
Pervious Area TcLengthSlopeVelocityCapacityDescription
Direct Entry,
Subcatchment 2P: DA 2 Post-Construction
Type II 24-hr 25 Year Rainfall=4.35"
Runoff Area=676.734 ac Runoff Volume=146.213 af
Runoff Depth=2.59" Tc=172.4 min
Page 44
17078-Stormwater
Prepared by Verdantas LLC
Type II 24-hr 25 Year Rainfall=4.35"
Printed 4/22/2025
HydroCAD® 10.20-6a s/n 02018 © 2024 HydroCAD Software Solutions LLC
Summary for Subcatchment 3E: DA 3 Pre-Construction
Runoff=311.76 cfs @ 13.28 hrs, Volume=81.322 af, Depth=3.15"
Runoff by SCS TR-20 method, UH=SCS, Weighted-CN, Time Span= 0.00-48.00 hrs, dt= 0.01 hrs
Type II 24-hr 25 Year Rainfall=4.35"
Pervious
Direct Entry,
Subcatchment 3E: DA 3 Pre-Construction
Type II 24-hr 25 Year Rainfall=4.35"
Runoff Area=309.505 ac
Runoff Volume=81.322 af
Runoff Depth=3.15" Tc=118.3 min
Page 45
Hydrograph
17078-Stormwater
Prepared by Verdantas LLC
Type II 24-hr 25 Year Rainfall=4.35"
Printed 4/22/2025
HydroCAD® 10.20-6a s/n 02018 © 2024 HydroCAD Software Solutions LLC
Summary for Subcatchment 3P: DA 3 Post-Construction
Runoff=277.94 cfs @ 13.48 hrs, Volume=76.333 af, Depth=2.96"
Runoff by SCS TR-20 method, UH=SCS, Weighted-CN, Time Span= 0.00-48.00 hrs, dt= 0.01 hrs
Type II 24-hr 25 Year Rainfall=4.35"
Direct Entry,
Subcatchment 3P: DA 3 Post-Construction
Type II 24-hr 25 Year Rainfall=4.35"
Runoff Area=309.505 ac
Runoff Volume=76.333 af
Runoff Depth=2.96" Tc=127.7 min CN=87
Page 46
Hydrograph
17078-Stormwater
Prepared by Verdantas LLC
Type II 24-hr 25 Year Rainfall=4.35"
Printed 4/22/2025
HydroCAD® 10.20-6a s/n 02018 © 2024 HydroCAD Software Solutions LLC
Summary for Subcatchment 4E: DA 4 Pre-Construction
Runoff=97.00 cfs @ 12.41 hrs, Volume=12.225 af, Depth=3.15"
Runoff by SCS TR-20 method, UH=SCS, Weighted-CN, Time Span= 0.00-48.00 hrs, dt= 0.01 hrs
Type II 24-hr 25 Year Rainfall=4.35"
Direct Entry,
Subcatchment 4E: DA 4 Pre-Construction
Type II 24-hr 25 Year Rainfall=4.35"
Runoff Area=46.529 ac
Runoff Volume=12.225 af
Runoff Depth=3.15" Tc=44.5 min
Page 47
Hydrograph
17078-Stormwater
Prepared by Verdantas LLC
Type II 24-hr 25 Year Rainfall=4.35"
Printed 4/22/2025
HydroCAD® 10.20-6a s/n 02018 © 2024 HydroCAD Software Solutions LLC
Summary for Subcatchment 4P: DA 4 Post-Construction
Runoff=81.58 cfs @ 12.46 hrs, Volume=11.110 af, Depth=2.87"
Runoff by SCS TR-20 method, UH=SCS, Weighted-CN, Time Span= 0.00-48.00 hrs, dt= 0.01 hrs
Type II 24-hr 25 Year Rainfall=4.35"
Direct Entry,
Subcatchment 4P: DA 4 Post-Construction
Type II 24-hr 25 Year Rainfall=4.35"
Runoff Area=46.529 ac
Runoff Volume=11.110 af
Runoff Depth=2.87" Tc=49.8 min
Page 48
Hydrograph
17078-Stormwater
Type II 24-hr 50 Year Rainfall=4.89"
Printed 4/22/2025
HydroCAD® 10.20-6a s/n 02018 © 2024 HydroCAD Software Solutions LLC
Prepared by Verdantas LLC Page 49
Time span=0.00-48.00 hrs, dt=0.01 hrs, 4801 points x 3
Runoff by SCS TR-20 method, UH=SCS, Weighted-CN Reach routing by Dyn-Stor-Ind method - Pond routing by Dyn-Stor-Ind method
Subcatchment1E: DA1
Subcatchment1P: DA1
Runoff Area=4,489.835 ac 0.00% Impervious Runoff Depth=3.46"
Runoff Area=4,489.835 ac 0.00% Impervious Runoff Depth=3.46"
Subcatchment2E: DA2 Pre-Construction
Runoff Area=676.734 ac 0.00% Impervious Runoff Depth=3.56"
Subcatchment2P: DA2 Post-Construction
Subcatchment3P: DA3 Post-Construction
DA4 Post-Construction
17078-Stormwater
Prepared by Verdantas LLC
Type II 24-hr 50 Year Rainfall=4.89"
Printed 4/22/2025
HydroCAD® 10.20-6a s/n 02018 © 2024 HydroCAD Software Solutions LLC
Summary for Subcatchment 1E: DA 1 Pre-Construction
Runoff=2,505.90 cfs @ 15.78 hrs, Volume=1,295.993 af, Depth=3.46"
Runoff by SCS TR-20 method, UH=SCS, Weighted-CN, Time Span= 0.00-48.00 hrs, dt= 0.01 hrs
Type II 24-hr 50 Year Rainfall=4.89"
Subcatchment 1E: DA 1 Pre-Construction
Type II 24-hr 50 Year Rainfall=4.89"
Runoff Area=4,489.835 ac Runoff Volume=1,295.993 af
Runoff Depth=3.46"
Page 50
Hydrograph
17078-Stormwater
Prepared by Verdantas LLC
Type II 24-hr 50 Year Rainfall=4.89"
Printed 4/22/2025
HydroCAD® 10.20-6a s/n 02018 © 2024 HydroCAD Software Solutions LLC
Summary for Subcatchment 1P: DA 1 Post-Construction
Runoff=2,505.90 cfs @ 15.78 hrs, Volume=1,295.993 af, Depth=3.46"
Runoff by SCS TR-20 method, UH=SCS, Weighted-CN, Time Span= 0.00-48.00 hrs, dt= 0.01 hrs
Type II 24-hr 50 Year Rainfall=4.89"
Subcatchment 1P: DA 1 Post-Construction
Type II 24-hr 50 Year Rainfall=4.89"
Runoff Area=4,489.835 ac Runoff Volume=1,295.993 af
Runoff Depth=3.46"
Page 51
17078-Stormwater
Prepared by Verdantas LLC
Type II 24-hr 50 Year Rainfall=4.89"
Printed 4/22/2025
HydroCAD® 10.20-6a s/n 02018 © 2024 HydroCAD Software Solutions LLC
Summary for Subcatchment 2E: DA 2 Pre-Construction
Runoff=663.09 cfs @ 13.62 hrs, Volume=201.021 af, Depth=3.56"
Runoff by SCS TR-20 method, UH=SCS, Weighted-CN, Time Span= 0.00-48.00 hrs, dt= 0.01 hrs
Type II 24-hr 50 Year Rainfall=4.89"
(ac)CNDescription
676.734100.00% Pervious Area TcLengthSlopeVelocityCapacityDescription
Direct Entry,
Subcatchment 2E: DA 2 Pre-Construction
Type II 24-hr 50 Year Rainfall=4.89"
Runoff Area=676.734 ac
Runoff Volume=201.021 af
Runoff Depth=3.56" Tc=144.2 min
Page 52
Hydrograph
17078-Stormwater
Prepared by Verdantas LLC
Type II 24-hr 50 Year Rainfall=4.89"
Printed 4/22/2025
HydroCAD® 10.20-6a s/n 02018 © 2024 HydroCAD Software Solutions LLC
Summary for Subcatchment 2P: DA 2 Post-Construction
Runoff=497.76 cfs @ 13.99 hrs, Volume=173.399 af, Depth=3.07"
Runoff by SCS TR-20 method, UH=SCS, Weighted-CN, Time Span= 0.00-48.00 hrs, dt= 0.01 hrs
Type II 24-hr 50 Year Rainfall=4.89"
676.734100.00% Pervious Area TcLengthSlopeVelocityCapacityDescription
Direct Entry,
Subcatchment 2P: DA 2 Post-Construction
Type II 24-hr 50 Year Rainfall=4.89"
Runoff Area=676.734 ac
Runoff Volume=173.399 af
Runoff Depth=3.07" Tc=172.4 min CN=83
Page 53
17078-Stormwater
Prepared by Verdantas LLC
Type II 24-hr 50 Year Rainfall=4.89"
Printed 4/22/2025
HydroCAD® 10.20-6a s/n 02018 © 2024 HydroCAD Software Solutions LLC
Summary for Subcatchment 3E: DA 3 Pre-Construction
Runoff=361.74 cfs @ 13.28 hrs, Volume=94.572 af, Depth=3.67"
Runoff by SCS TR-20 method, UH=SCS, Weighted-CN, Time Span= 0.00-48.00 hrs, dt= 0.01 hrs
Type II 24-hr 50 Year Rainfall=4.89"
Direct Entry,
Subcatchment 3E: DA 3 Pre-Construction
Type II 24-hr 50 Year Rainfall=4.89"
Runoff Area=309.505 ac
Runoff Volume=94.572 af
Runoff Depth=3.67" Tc=118.3 min
Page 54
Hydrograph
17078-Stormwater
Prepared by Verdantas LLC
Type II 24-hr 50 Year Rainfall=4.89"
Printed 4/22/2025
HydroCAD® 10.20-6a s/n 02018 © 2024 HydroCAD Software Solutions LLC
Summary for Subcatchment 3P: DA 3 Post-Construction
Runoff=324.88 cfs @ 13.48 hrs, Volume=89.339 af, Depth=3.46"
Runoff by SCS TR-20 method, UH=SCS, Weighted-CN, Time Span= 0.00-48.00 hrs, dt= 0.01 hrs
Type II 24-hr 50 Year Rainfall=4.89"
Direct Entry,
Subcatchment 3P: DA 3 Post-Construction
Type II 24-hr 50 Year Rainfall=4.89"
Runoff Area=309.505 ac
Runoff Volume=89.339 af
Runoff Depth=3.46" Tc=127.7 min
Page 55
Hydrograph
17078-Stormwater
Prepared by Verdantas LLC
Type II 24-hr 50 Year Rainfall=4.89"
Printed 4/22/2025
HydroCAD® 10.20-6a s/n 02018 © 2024 HydroCAD Software Solutions LLC
Summary for Subcatchment 4E: DA 4 Pre-Construction
Runoff=112.31 cfs @ 12.41 hrs, Volume=14.217 af, Depth=3.67"
Runoff by SCS TR-20 method, UH=SCS, Weighted-CN, Time Span= 0.00-48.00 hrs, dt= 0.01 hrs
Type II 24-hr 50 Year Rainfall=4.89"
Direct Entry,
Subcatchment 4E: DA 4 Pre-Construction
Type II 24-hr 50 Year Rainfall=4.89"
Runoff Area=46.529 ac
Runoff Volume=14.217 af
Runoff Depth=3.67" Tc=44.5 min
Page 56
Hydrograph
17078-Stormwater
Prepared by Verdantas LLC
Type II 24-hr 50 Year Rainfall=4.89"
Printed 4/22/2025
HydroCAD® 10.20-6a s/n 02018 © 2024 HydroCAD Software Solutions LLC
Summary for Subcatchment 4P: DA 4 Post-Construction
Runoff=95.65 cfs @ 12.46 hrs, Volume=13.045 af, Depth=3.36"
Runoff by SCS TR-20 method, UH=SCS, Weighted-CN, Time Span= 0.00-48.00 hrs, dt= 0.01 hrs
Type II 24-hr 50 Year Rainfall=4.89"
Direct Entry,
Subcatchment 4P: DA 4 Post-Construction
Type II 24-hr 50 Year Rainfall=4.89"
Runoff Area=46.529 ac
Runoff Volume=13.045 af
Runoff Depth=3.36" Tc=49.8 min
Page 57
Hydrograph
17078-Stormwater
Prepared by Verdantas LLC
Type II 24-hr 100 Year Rainfall=5.44"
HydroCAD® 10.20-6a s/n 02018 © 2024 HydroCAD Software Solutions LLC
Time span=0.00-48.00 hrs, dt=0.01 hrs, 4801 points x 3
Runoff by SCS TR-20 method, UH=SCS, Weighted-CN
Printed 4/22/2025
Page 58
Reach routing by Dyn-Stor-Ind method - Pond routing by Dyn-Stor-Ind method
Subcatchment1E: DA1
Subcatchment1P: DA1
Runoff Area=4,489.835 ac 0.00% Impervious Runoff Depth=3.98"
Runoff Area=4,489.835 ac 0.00% Impervious Runoff Depth=3.98"
Subcatchment2E: DA2 Pre-Construction
Runoff Area=676.734 ac 0.00% Impervious Runoff Depth=4.09"
Subcatchment2P: DA2 Post-Construction
Subcatchment3P: DA3 Post-Construction
DA4 Post-Construction
17078-Stormwater
Prepared by Verdantas LLC
Type II 24-hr 100 Year Rainfall=5.44"
Printed 4/22/2025
HydroCAD® 10.20-6a s/n 02018 © 2024 HydroCAD Software Solutions LLC
Summary for Subcatchment 1E: DA 1 Pre-Construction
Runoff=2,877.78 cfs @ 15.78 hrs, Volume=1,490.398 af, Depth=3.98"
Runoff by SCS TR-20 method, UH=SCS, Weighted-CN, Time Span= 0.00-48.00 hrs, dt= 0.01 hrs
Type II 24-hr 100 Year Rainfall=5.44"
Subcatchment 1E: DA 1 Pre-Construction
Type II 24-hr 100 Year Rainfall=5.44" Runoff Area=4,489.835 ac Runoff Volume=1,490.398 af Runoff Depth=3.98"
Page 59
17078-Stormwater
Prepared by Verdantas LLC
Type II 24-hr 100 Year Rainfall=5.44"
Printed 4/22/2025
HydroCAD® 10.20-6a s/n 02018 © 2024 HydroCAD Software Solutions LLC
Summary for Subcatchment 1P: DA 1 Post-Construction
Runoff=2,877.78 cfs @ 15.78 hrs, Volume=1,490.398 af, Depth=3.98"
Runoff by SCS TR-20 method, UH=SCS, Weighted-CN, Time Span= 0.00-48.00 hrs, dt= 0.01 hrs
Type II 24-hr 100 Year Rainfall=5.44"
(ac)CNDescription
Subcatchment 1P: DA 1 Post-Construction
Type II 24-hr 100 Year Rainfall=5.44" Runoff Area=4,489.835 ac Runoff Volume=1,490.398 af Runoff Depth=3.98"
Page 60
17078-Stormwater
Prepared by Verdantas LLC
Type II 24-hr 100 Year Rainfall=5.44"
Printed 4/22/2025
HydroCAD® 10.20-6a s/n 02018 © 2024 HydroCAD Software Solutions LLC
Summary for Subcatchment 2E: DA 2 Pre-Construction
Runoff=759.03 cfs @ 13.62 hrs, Volume=230.561 af, Depth=4.09"
Runoff by SCS TR-20 method, UH=SCS, Weighted-CN, Time Span= 0.00-48.00 hrs, dt= 0.01 hrs
Type II 24-hr 100 Year Rainfall=5.44" Area (ac)CNDescription
676.734100.00% Pervious Area TcLengthSlopeVelocityCapacityDescription
Direct Entry,
Subcatchment 2E: DA 2 Pre-Construction
Type II 24-hr 100 Year Rainfall=5.44"
Runoff Area=676.734 ac Runoff Volume=230.561 af
Runoff Depth=4.09" Tc=144.2 min
Page 61
Hydrograph
17078-Stormwater
Prepared by Verdantas LLC
Type II 24-hr 100 Year Rainfall=5.44"
Printed 4/22/2025
HydroCAD® 10.20-6a s/n 02018 © 2024 HydroCAD Software Solutions LLC
Summary for Subcatchment 2P: DA 2 Post-Construction
Runoff=579.76 cfs @ 13.99 hrs, Volume=201.600 af, Depth=3.57"
Runoff by SCS TR-20 method, UH=SCS, Weighted-CN, Time Span= 0.00-48.00 hrs, dt= 0.01 hrs
Type II 24-hr 100 Year Rainfall=5.44"
(ac)CNDescription
676.734100.00% Pervious Area TcLengthSlopeVelocityCapacityDescription
Direct Entry,
Subcatchment 2P: DA 2 Post-Construction
Type II 24-hr 100 Year Rainfall=5.44"
Runoff Area=676.734 ac
Runoff Volume=201.600 af
Runoff Depth=3.57" Tc=172.4 min CN=83
Page 62
17078-Stormwater
Prepared by Verdantas LLC
Type II 24-hr 100 Year Rainfall=5.44"
Printed 4/22/2025
HydroCAD® 10.20-6a s/n 02018 © 2024 HydroCAD Software Solutions LLC
Summary for Subcatchment 3E: DA 3 Pre-Construction
Runoff=412.73 cfs @ 13.28 hrs, Volume=108.184 af, Depth=4.19"
Runoff by SCS TR-20 method, UH=SCS, Weighted-CN, Time Span= 0.00-48.00 hrs, dt= 0.01 hrs
Type II 24-hr 100 Year Rainfall=5.44"
Direct Entry,
Subcatchment 3E: DA 3 Pre-Construction
Type II 24-hr 100 Year Rainfall=5.44"
Runoff Area=309.505 ac Runoff Volume=108.184 af
Runoff Depth=4.19" Tc=118.3
Page 63
Hydrograph
17078-Stormwater
Prepared by Verdantas LLC
Type II 24-hr 100 Year Rainfall=5.44"
Printed 4/22/2025
HydroCAD® 10.20-6a s/n 02018 © 2024 HydroCAD Software Solutions LLC
Summary for Subcatchment 3P: DA 3 Post-Construction
Runoff=372.86 cfs @ 13.48 hrs, Volume=102.740 af, Depth=3.98"
Runoff by SCS TR-20 method, UH=SCS, Weighted-CN, Time Span= 0.00-48.00 hrs, dt= 0.01 hrs
Type II 24-hr 100 Year Rainfall=5.44"
Direct Entry,
Subcatchment 3P: DA 3 Post-Construction
Type II 24-hr 100 Year Rainfall=5.44"
Runoff Area=309.505 ac Runoff Volume=102.740 af
Runoff Depth=3.98" Tc=127.7 min
Page 64
Hydrograph
17078-Stormwater
Prepared by Verdantas LLC
Type II 24-hr 100 Year Rainfall=5.44"
Printed 4/22/2025
HydroCAD® 10.20-6a s/n 02018 © 2024 HydroCAD Software Solutions LLC
Summary for Subcatchment 4E: DA 4 Pre-Construction
Runoff=127.90 cfs @ 12.41 hrs, Volume=16.264 af, Depth=4.19"
Runoff by SCS TR-20 method, UH=SCS, Weighted-CN, Time Span= 0.00-48.00 hrs, dt= 0.01 hrs
Type II 24-hr 100 Year Rainfall=5.44"
Direct Entry,
Subcatchment 4E: DA 4 Pre-Construction
Type II 24-hr 100 Year Rainfall=5.44"
Runoff Area=46.529 ac
Runoff Volume=16.264 af
Runoff Depth=4.19" Tc=44.5 min
CN=89
Page 65
Hydrograph
17078-Stormwater
Prepared by Verdantas LLC
Type II 24-hr 100 Year Rainfall=5.44"
Printed 4/22/2025
HydroCAD® 10.20-6a s/n 02018 © 2024 HydroCAD Software Solutions LLC
Summary for Subcatchment 4P: DA 4 Post-Construction
Runoff=110.10 cfs @ 12.45 hrs, Volume=15.043 af, Depth=3.88"
Runoff by SCS TR-20 method, UH=SCS, Weighted-CN, Time Span= 0.00-48.00 hrs, dt= 0.01 hrs
Type II 24-hr 100 Year Rainfall=5.44"
Direct Entry,
Subcatchment 4P: DA 4 Post-Construction
Type II 24-hr 100 Year Rainfall=5.44"
Runoff Area=46.529 ac Runoff Volume=15.043 af Runoff Depth=3.88" Tc=49.8 min
Page 66
Hydrograph
E
PRECIPITATION DATA

APPENDIX


