EXHIBIT L Stormwater Analysis
APPLICATION TO THE OHIO POWER SITING BOARD FOR A
CERTIFICATE OF ENVIRONMENTAL COMPATIBILITY AND PUBLIC NEED FOR THE
Case No. 24-0801-EL -BGN


APPLICATION TO THE OHIO POWER SITING BOARD FOR A
CERTIFICATE OF ENVIRONMENTAL COMPATIBILITY AND PUBLIC NEED FOR THE
Case No. 24-0801-EL -BGN

Date October 3, 2024
To Doug Herling, Grange Solar Grazing Center
From Eric Koch, P.E.
Subject Preliminary Stormwater Assessment
Project Number 15770
The Grange Solar Grazing Center (Project) is a combined utility-scale solar energy facility and sheep grazing operation being developed in Logan County, Ohio (“Project”). The Project will use rows of ground-mounted solar panels to supply wholesale power to the existing electric grid while also providing pasture for livestock. All of the Project’s above-ground structures will sit within vegetated fields enclosed within agricultural-style fences, which also will confine the livestock and protect them from predators. The Project will be located within an area totaling approximately 4,100 acres (the “Study Area”), of which approximately 2,600 acres will be used for construction of above-ground infrastructure. The Project will consist of arrays of ground-mounted solar modules, a metal racking system with driven foundations, underground electric collection lines, inverters, transformers, a substation, pyranometers, an electrical interconnect transmission line, and associated access roads (the “Facility)”
The objective of this Preliminary Stormwater Assessment is to explain stormwater requirements set by state and local stormwater authorities for the Study Area, describe erosion control and sediment management requirements applicable during construction, and provide a comparison of existing stormwater runoff characteristics of the Study Area to post-construction stormwater runoff characteristics of the Study Area.
Stormwater management for the Project will generally consist of converting tilled farmland to land vegetated with a mixture of grasses and forbs, providing impervious surface disconnections, and managing stormwater quantity and quality in accordance with the Ohio Environmental Protection Agency (Ohio EPA) General Permit Authorization for Stormwater Discharges Associated with Construction Activity Under the National Pollutant Discharge Elimination System (General Permit)
A series of access roads will provide entry to the centrally located inverter pads. Construction and operation of the Facility is anticipated to necessitate only limited grading that would not result in significant changes to the topography within the Study Area. Throughout the site, the ground cover below the solar modules is anticipated to be a mixture of grasses and forbs. The soils within construction disturbed areas are expected to be scarified and de-compacted prior to seeding and mulching at the conclusion of construction. For additional detail regarding post-construction revegetation methods and seed mix selection, refer to the vegetation management plan prepared for the Project
The following assumptions were made for this Assessment. The final design for the Project is expected to incorporate appropriate aspects of the Ohio EPA’s Guidance on Post-Construction Stormwater Management for Solar Panel Fields, dated April 2022 (Attachment A). Proposed access roads are expected to include vegetated surfaces that run parallel and adjacent to the roads, where necessary, to improve water quality. Based on the Custom Soil Report for Logan

County, the Study Area is predominantly covered with poorly drained soils with low to moderately high permeability, particularly in the current agricultural use areas.
Verdantas obtained watersheds from the US Geological Survey (USGS) StreamStats online application. Additionally, Verdantas obtained light detection and ranging (LiDAR) survey data from the Ohio Geographically Referenced Information Program (OGRIP) to verify drainage divides within the Study Area. The OGRIP database is the industry standard in Ohio for obtaining seamless statewide topography, achieving a vertical accuracy of +/- 1-foot. Verdantas delineated 9 watersheds that covered the entirety of the Study Area, as shown on the Project Site Map (Attachment B).
Verdantas used the HydroCAD v.10.2 software to estimate the runoff during operation using the Soil Conservation Service (SCS) Technical Release 20 (TR-20). HydroCAD utilizes subcatchments to characterize the hydrology of a watershed and estimate the flow rate and volume of runoff resulting from a storm event. Inputs include the runoff curve number (CN) and time of concentration (Tc) Supporting information discussed in the following sections is included in Attachment C.
The TR-20 utilizes the Technical Release 55 (TR-55) method for development of the CN. The TR55 includes tables that estimate the CN from 1 to 100 that characterizes the watershed based on land use and soils. Land use describes the land cover including lawns, farm fields, pavement, open water, forests, and many other categories. The permanent vegetative cover planned for the project, a mixture of grasses and forbs, is identified as the Meadows/Low-growing grass varieties land cover. Each soil type encountered in a watershed is categorized by a hydrologic soil group (HSG) that describes the potential for infiltration. Soils are listed as HSG A, B, C, or D, with A soils having a high rate of infiltration and D soils having a low rate of infiltration. HSG type D soils are the most predominant throughout the Study Area watersheds. Land use throughout the watersheds was estimated using the US Geological Survey (USGS) 2021 National Land Cover Database and verified using aerial imagery obtained from the OGRIP dataset. The CN tables in the TR-55 were used to select an appropriate CN for the land use/ HSG combination. Runoff CN for HSG Type D (poorly drained) soils are included in Error! Reference source not found. as follows using the TR-55. Table 2 describes the composite CN values for each watershed
Table 1: Runoff CN Parameters Land Cover
Curve Number Barren Land (Rock/Sand/Clay) D 94 Cultivated Crops D 91 Deciduous Forest D 79 Developed, High Intensity D 95 Developed, Medium Intensity D 92 Developed, Low Intensity D 86 Developed, Open Space D 80 Emergent Herbaceous Wetlands D 84 Evergreen Forest D 79 Grassland/Herbaceous D 77

The SCS Method for Watershed Lag (National Engineering Handbook) was used to estimate the time of concentration for each watershed The time of concentration is generally defined as the amount of time for a rain drop falling at the most hydraulically remote part of the watershed to reach a point of interest. The time of concentration helps to define the shape of the resulting runoff hydrograph by defining the time it takes for all parts of the watershed to contribute to runoff at the point of interest. The necessary inputs are flow length, average watershed slope, and the retardance factor. The retardance factor is equivalent to the runoff curve number. The output from the subcatchments are runoff hydrographs, which depict the flow from the watershed with respect to time. The time of concentration and runoff curve number directly impact the estimated peak flow of this runoff hydrograph.
For this Assessment, the point of interest was selected for each watershed as the downstream point of the receiving waters that encompasses all of the Study Area in that watershed. MathCAD Express Prime v.8.0 software was utilized to calculate the time of concentration for each watershed. Several land slopes were analyzed, ranging from 0.5 to 15 percent. The slope selected for each watershed was determined by analyzing the NRCS Custom Soil Report for each watershed. A weighted average slope was calculated based on the soil groups in each watershed. Time of concentration values were calculated, and the value was entered as a manual value into HydroCAD. The time of concentration values are included in Table 3.
Table 3: Time of Concentration (Tc) Values
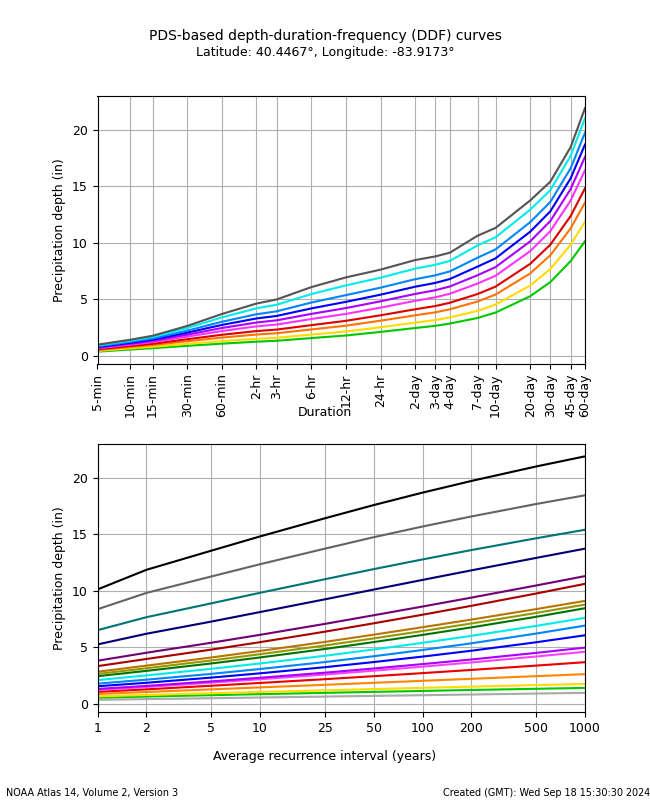
Precipitation depth for the 1-year, 25-year, and 100-year, 24-hour precipitation events were obtained from the NOAA Atlas 14 point precipitation frequency estimates database from a point location at the median of each watershed. The precipitation values did not significantly differ between watersheds. Verdantas used a standard 24-hour SCS type-II rainfall distribution to characterize the rainfall. The 1-year, 24-hour precipitation value is 2.09 inches, the 25-year, 24-

hour precipitation value is 4.24 inches, and the 100-year, 24-hour precipitation value is 5.39 inches.
Table 4 describes the estimated stormwater runoff for the pre- and post-construction conditions for selected rainfall frequencies. The overall area studied in this Assessment is approximately 140,596 acres across 9 watersheds The Study Area that was included in this model is 2,770 acres, which represents the area inside of the proposed fence lines that the Project owner will be able to control. The HydroCAD Reports are included in Attachment C.
4: Stormwater Runoff Pre- and Post-Construction by Watershed
To analyze the effects of the Study Area within the watersheds, a point of interest far enough downstream to capture the entire area must be identified The location of this point may dilute the Project’s effects by including additional drainage not related to the Project. This situation is evident in Watersheds 1 and 5. The Project has little to no effect on the post-construction CN for these watersheds because the Study Area is small compared to the entire watershed. As a result, the composite CN is not appreciably reduced; therefore, these two watersheds do not experience a change in peak runoff.

The localized effects of the Study Area are most apparent in Watershed 3, 6, 8, and 9 where the percentage of the Project Area within the Study Area exceeds 25% and the composite CNProposed has the largest decrease from the CN-Existing in these watersheds. This is due to the larger percentage of Study Area located within the watershed. This drives the increase in time of concentration (Table 3), which is due to the land cover change from agricultural in existing conditions to meadow in proposed conditions. A longer the time of concentration will distribute the volume of water out over a greater period resulting in a lower the peak runoff rate.
To comply with the Ohio EPA general permit, the required post-construction stormwater runoff water quality volume is expected to be addressed during final design by incorporating the Ohio EPA document, “Guidance on Post-Construction Stormwater Management for Solar Panel Fields” requirements within the array areas and incorporating best management practices (BMPs) in accordance with the Ohio EPA General Permit for areas of concentrated impervious area, e.g., the project substation.
In existing conditions, the land cover of the proposed Study Area is primarily agricultural land. In proposed conditions, the land cover of the panels and permanently vegetated surface is primarily meadows. This change from agricultural to meadows will decrease the CN, promote greater infiltration, promote sheet flow, and increase the time of concentration, thereby reducing the estimated peak stormwater runoff from the Project Area Table 4 summarizes that in 7 of the 9 watersheds, the estimated peak runoff will decrease as a result of the Project. The remaining 2 watersheds are not expected to experience a change in estimated peak runoff.
This Assessment describes the methods used to approximate the hydrologic cycle, where rainfall generally infiltrates, evaporates, or collects as runoff that feeds streams and rivers. The volume of runoff generated during a specified storm duration and rainfall depth is a function of the soil, the cover type, and the land slope. The peak runoff rate in cubic feet per second represents the maximum expected runoff for a particular watershed during a specified storm event. By reducing the runoff rate, the Project reduces the potential for erosive velocities and flows leaving the Study Area. This Assessment indicates that peak runoff rates from the Study Area for the 1-year through 100-year events in each watershed do not increase as a result of the Project. The estimates of peak runoff reduction contained in this Assessment are based on the information and assumptions described in the sections above. This Assessment is considered preliminary and Verdantas recommends it be revised based on the final design.
Attachments:
Attachment A Ohio EPA’s Guidance on Post-Construction Stormwater Management for Solar Panel Fields
Attachment B Project Site Map
Attachment C Hydrologic Study Supporting Information


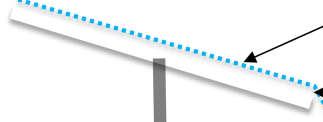


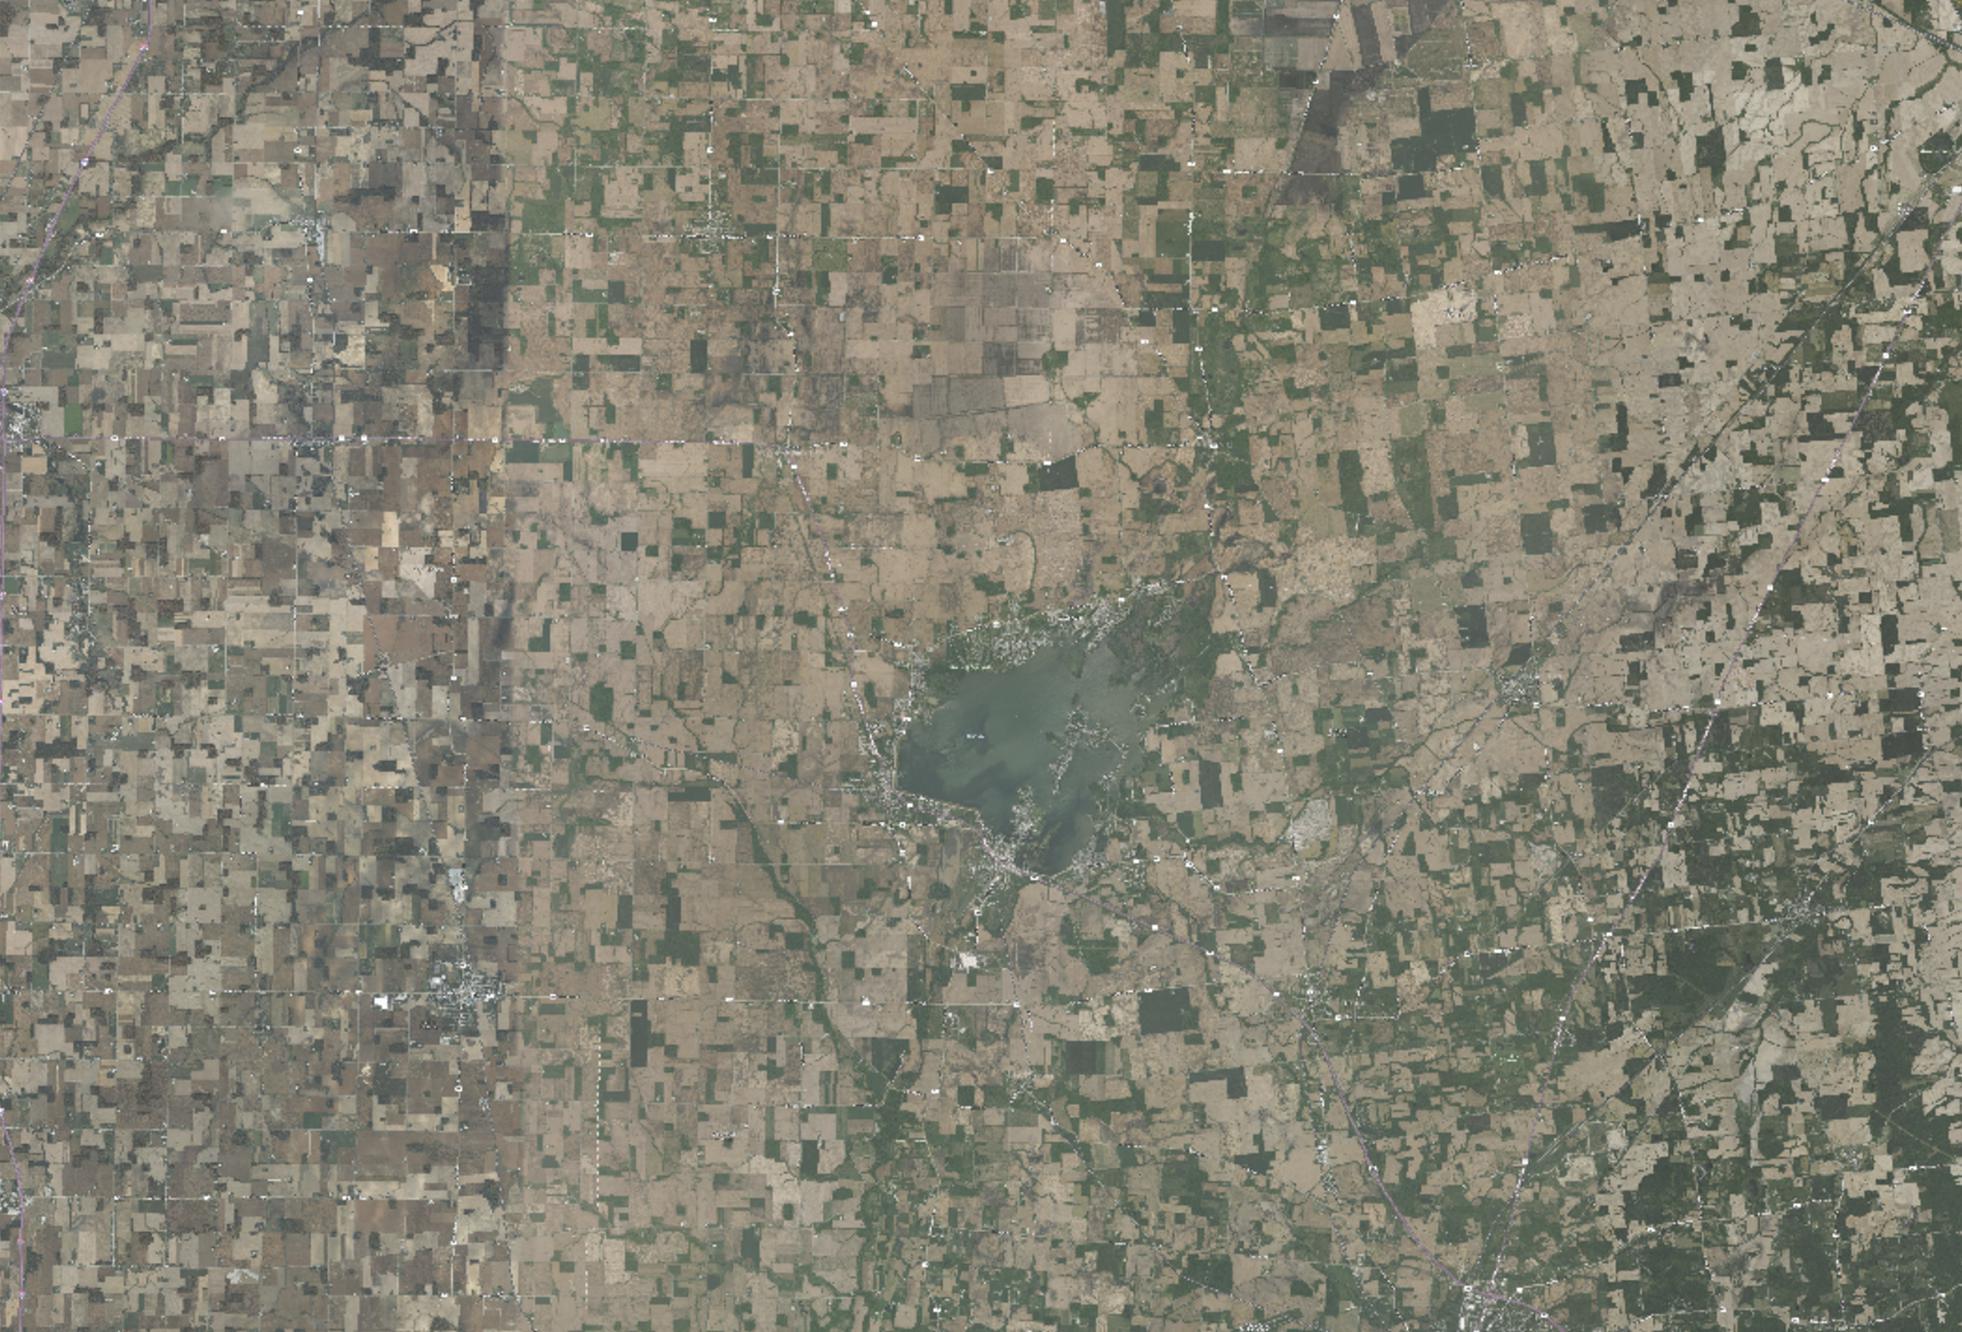
Slope: 2.63%

Objective:
Estimate Time of Concentration for a given watershed using accepted methods.
Source:
National Engineering Handbook, Part 630 Hydrology. Chapter 15 - Time of Concentration.
SCS Method for Watershed lag [630.1502(a)]
Watershed 1
A 78731 acre
l 82809
Y 15 2.63 1
cn' 89
Drainage Area, ac
Flow length, ft
Average watershed Land Slope (%)
Retardance Factor (unitless)
Time of Concentration, min
Watershed 2
A 5427 acre Drainage Area, ac
l 35302
Y 4 0.69 0.5
cn' 89
Flow length, ft
Average watershed Land Slope (%)
Retardance Factor (unitless) Typically
Time of Concentration, min

Watershed 3
A 675 acre
l 7413
Y 4 1.01 0.5
cn' 90
Drainage Area, ac
Flow length, ft
Average watershed Land Slope (%)
Retardance Factor (unitless)
Typically equivalent to CN S =1000 cn' 10 1.111
Maximum Potential Retention, in
Watershed 4
A 135 acre
Drainage Area, ac l 3317
Flow length, ft Y 2 0.8 0.5
Average watershed Land Slope (%) cn' 91
Retardance Factor (unitless)
Typically equivalent to CN S =1000 cn' 10 0.989
Maximum Potential Retention, in
Concentration, min

Watershed 5
A 53227 acre
l 94735
Drainage Area, ac
Flow length, ft Y 9 1.64 0.5
cn' 90
Average watershed Land Slope (%)
Retardance Factor (unitless)
Typically equivalent to CN S =1000 cn' 10 1.111 Maximum Potential Retention, in
Time of Concentration, min
Watershed 6
A 2213 acre
l 19180
Drainage Area, ac
Flow length, ft Y 3 1.1 0.5
Average watershed Land Slope (%) cn' 90
Retardance Factor (unitless)
Typically equivalent to CN S =1000 cn' 10 1.111 Maximum Potential Retention, in
Time of Concentration, min

Watershed 7 A 37 acre
Drainage Area, ac l 2409
Flow length, ft Y 3 0.76 0.5
cn' 89
Average watershed Land Slope (%)
Retardance Factor (unitless)
Typically equivalent to CN S =1000 cn' 10 1.236
Maximum Potential Retention, in
Watershed 8 A 44 acre Drainage Area, ac
Average watershed Land Slope (%) cn' 90
Retardance Factor (unitless)
Typically equivalent to CN S =1000 cn' 10 1.111
Maximum Potential Retention, in
Time of Concentration, min

Watershed 9 A 109 acre
Drainage Area, ac l 3635
Flow length, ft Y 4 2.88 1
cn' 90
Average watershed Land Slope (%)
Retardance Factor (unitless)
Typically equivalent to CN S =1000 cn' 10 1.111
Maximum Potential Retention, in

Objective:
Estimate Time of Concentration for a given watershed using accepted methods.
Source:
National Engineering Handbook, Part 630 Hydrology. Chapter 15 - Time of Concentration.
SCS Method for Watershed lag [630.1502(a)]
Watershed 1
A 78731 acre
l 82809
Y 15 2.63 1
cn' 89
Drainage Area, ac
Flow length, ft
Average watershed Land Slope (%)
Retardance Factor (unitless)
Time of Concentration, min
Watershed 2
A 5427 acre Drainage Area, ac
l 35302
Y 4 0.69 0.5
cn' 88
Flow length, ft
Average watershed Land Slope (%)
Retardance Factor (unitless) Typically
Time of Concentration, min

Watershed 3
A 675 acre
l 7413
Drainage Area, ac
Flow length, ft Y 4 1.01 0.5
cn' 84
Average watershed Land Slope (%)
Retardance Factor (unitless)
Typically equivalent to CN S =1000 cn' 10 1.905
Maximum Potential Retention, in
of Concentration, min
Watershed 4
A 135 acre
Drainage Area, ac l 3317
Flow length, ft Y 2 0.8 0.5
Average watershed Land Slope (%) cn' 90
Retardance Factor (unitless)
Typically equivalent to CN S =1000 cn' 10 1.111 Maximum Potential Retention, in
Time of Concentration, min

Watershed 5
A 53227 acre
l 94735
Drainage Area, ac
Flow length, ft Y 9 1.64 0.5
cn' 90
Average watershed Land Slope (%)
Retardance Factor (unitless)
Typically equivalent to CN S =1000 cn' 10 1.111
Maximum Potential Retention, in
Time of Concentration, min
Watershed 6
A 2213 acre
l 19180
Drainage Area, ac
Flow length, ft Y 3 1.1 0.5
Average watershed Land Slope (%) cn' 87
Retardance Factor (unitless)
Typically equivalent to CN S =1000 cn' 10 1.494 Maximum Potential Retention, in
Time of Concentration, min

Watershed 7 A 37 acre
Area, ac
Average watershed Land Slope (%) cn' 88
Retardance Factor (unitless) Typically equivalent to CN
Watershed 8 A 44 acre Drainage Area, ac
86
Average watershed Land Slope (%)
Retardance Factor (unitless) Typically equivalent to CN

Watershed 9 A 109 acre
Drainage Area, ac l 3635
Flow length, ft Y 4 2.88 1
cn' 85
Average watershed Land Slope (%)
Retardance Factor (unitless)
Typically equivalent to CN S =1000 cn' 10 1.765
Maximum Potential Retention, in












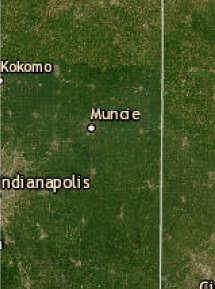

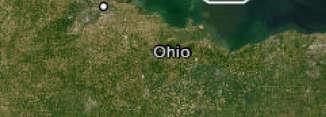
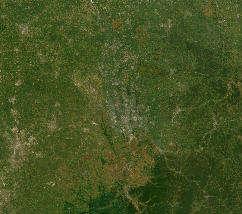
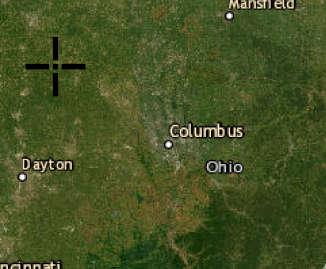
1S Watershed 1 2S Watershed 2 3S Watershed 3
4S Watershed 4 5S Watershed 5 6S Watershed 6
7S Watershed 7 8S Watershed 8 9S Watershed 9
Routing Diagram for 15770 Existing Conditions Prepared by Verdantas LLC, Printed 10/3/2024 HydroCAD® 10.20-5b s/n 05286 © 2023 HydroCAD
1
Rainfall Events Listing (selected events)
Printed 10/3/2024 Prepared by Verdantas LLC
HydroCAD® 10.20-5b s/n 05286 © 2023 HydroCAD Software Solutions LLC
Area Listing (selected nodes)
(acres) CN Description (subcatchment-numbers)
84,194.080 89 (1S, 2S, 7S)
56,265.975 90 (3S, 5S, 6S, 8S, 9S) 134.764 91 (4S)
140,594.819 89 TOTAL AREA
Page 3
Prepared by Verdantas LLC
HydroCAD® 10.20-5b s/n 05286 © 2023 HydroCAD Software Solutions LLC
Time span=0.00-72.00 hrs, dt=0.01 hrs, 7201 points x 3
Runoff by SCS TR-20 method, UH=SCS, Weighted-CN
Printed 10/3/2024
Page 4
Reach routing by Dyn-Stor-Ind method - Pond routing by Dyn-Stor-Ind method
Subcatchment 1S: Watershed 1
Subcatchment 2S: Watershed 2
Subcatchment 3S: Watershed 3
Subcatchment 4S: Watershed 4
Subcatchment 5S: Watershed 5
Subcatchment 6S: Watershed 6
Subcatchment 7S: Watershed 7
Subcatchment 8S: Watershed 8
Runoff Area=78,730.995 ac 0.00% Impervious Runoff Depth=1.10"
Tc=490.2 min CN=89 Runoff=8,889.65 cfs 7,236.836 af
Runoff Area=5,426.505 ac 0.00% Impervious Runoff Depth=1.10"
Runoff Area=674.993 ac 0.00% Impervious Runoff Depth=1.17"
Runoff Area=134.764 ac 0.00% Impervious Runoff Depth=1.24"
Runoff Area=36.580 ac 0.00% Impervious Runoff Depth=1.10"
min CN=89 Runoff=23.20 cfs 3.362 af
Runoff Area=43.862 ac 0.00% Impervious Runoff Depth=1.17"
Runoff Area=108.440 ac 0.00% Impervious Runoff Depth=1.17"
Subcatchment 9S: Watershed 9 Tc=36.9 min CN=90 Runoff=96.03 cfs 10.583 af Total Runoff Area = 140,594.819 ac Runoff Volume = 13,244.067 af Average Runoff Depth = 1.13" 100.00% Pervious =
15770 Existing Conditions
Prepared by Verdantas LLC
Type II 24-hr 1-Year Rainfall=2.09"
Printed 10/3/2024
HydroCAD® 10.20-5b s/n 05286 © 2023 HydroCAD Software Solutions LLC
Summary for Subcatchment 1S: Watershed 1
Runoff = 8,889.65 cfs @ 17.98 hrs, Volume= 7,236.836 af, Depth= 1.10"
Runoff by SCS TR-20 method, UH=SCS, Weighted-CN, Time Span= 0.00-72.00 hrs, dt= 0.01 hrs
Type II 24-hr 1-Year Rainfall=2.09"
Area (ac) CN Description * 78,730.995 89
78,730.995 100.00% Pervious Area Tc Length
490.2
Flow (cfs)
9,000 8,500 8,000 7,500 7,000 6,500 6,000 5,500 5,000 4,500 4,000 3,500 3,000 2,500 2,000 1,500
Direct Entry, SCS Method for Watershed Lag
Subcatchment 1S: Watershed 1
Type II 24-hr 1-Year Rainfall=2.09"
Runoff Area=78,730.995 ac Runoff Volume=7,236.836 af
Runoff Depth=1.10" Tc=490.2 min CN=89
Page 5
15770 Existing Conditions
Prepared by Verdantas LLC
Type II 24-hr 1-Year Rainfall=2.09"
Printed 10/3/2024
HydroCAD® 10.20-5b s/n 05286 © 2023 HydroCAD Software Solutions LLC
Summary for Subcatchment 2S: Watershed 2
Runoff = 628.70 cfs @ 18.81 hrs, Volume= 498.796 af, Depth= 1.10"
Runoff by SCS TR-20 method, UH=SCS, Weighted-CN, Time Span= 0.00-72.00 hrs, dt= 0.01 hrs
Type II 24-hr 1-Year Rainfall=2.09" Area (ac) CN Description * 5,426.505 89
5,426.505 100.00% Pervious Area Tc Length Slope
483.8 Direct Entry, SCS Method for Watershed Lag
Subcatchment 2S: Watershed 2
Type II 24-hr 1-Year Rainfall=2.09"
Runoff Area=5,426.505 ac Runoff Volume=498.796 af
Runoff Depth=1.10"
Page 6
15770 Existing Conditions
Prepared by Verdantas LLC
Type II 24-hr 1-Year Rainfall=2.09"
Printed 10/3/2024
HydroCAD® 10.20-5b s/n 05286 © 2023 HydroCAD Software Solutions LLC
Summary for Subcatchment 3S: Watershed 3
Runoff = 267.32 cfs @ 13.34 hrs, Volume= 65.874 af, Depth= 1.17"
Runoff by SCS TR-20 method, UH=SCS, Weighted-CN, Time Span= 0.00-72.00 hrs, dt= 0.01 hrs
Type II 24-hr 1-Year Rainfall=2.09"
(ac)
674.993 100.00% Pervious Area
Direct Entry, SCS Method for Watershed Lag
Subcatchment 3S: Watershed 3
Type II 24-hr 1-Year Rainfall=2.09"
Runoff Area=674.993 ac
Runoff Volume=65.874 af
Runoff Depth=1.17"
Page 7
15770 Existing Conditions
Prepared by Verdantas LLC
Type II 24-hr 1-Year Rainfall=2.09"
Printed 10/3/2024
HydroCAD® 10.20-5b s/n 05286 © 2023 HydroCAD Software Solutions LLC
Summary for Subcatchment 4S: Watershed 4
Runoff = 86.96 cfs @ 12.68 hrs, Volume= 13.956 af, Depth= 1.24"
Runoff by SCS TR-20 method, UH=SCS, Weighted-CN, Time Span= 0.00-72.00 hrs, dt= 0.01 hrs
Type II 24-hr 1-Year Rainfall=2.09"
Pervious
Direct Entry, SCS Method for Watershed Lag
Subcatchment 4S: Watershed 4
Type II 24-hr 1-Year Rainfall=2.09"
Runoff Area=134.764 ac
Runoff Volume=13.956 af Runoff Depth=1.24"
Page 8
15770 Existing Conditions
Prepared by Verdantas LLC
Type II 24-hr 1-Year Rainfall=2.09"
Printed 10/3/2024
HydroCAD® 10.20-5b s/n 05286 © 2023 HydroCAD Software Solutions LLC
Summary for Subcatchment 5S: Watershed 5
Runoff = 5,126.03 cfs @ 21.39 hrs, Volume= 5,194.455 af, Depth= 1.17"
Runoff by SCS TR-20 method, UH=SCS, Weighted-CN, Time Span= 0.00-72.00 hrs, dt= 0.01 hrs
Type II 24-hr 1-Year Rainfall=2.09"
Area (ac) CN Description * 53,226.164 90
53,226.164 100.00% Pervious Area Tc Length
664.0
Direct Entry, SCS Method for Watershed Lag
Subcatchment 5S: Watershed 5
Type II 24-hr 1-Year Rainfall=2.09"
Runoff Area=53,226.164 ac Runoff Volume=5,194.455 af
Depth=1.17"
Page 9
15770 Existing Conditions
Prepared by Verdantas LLC
Type II 24-hr 1-Year Rainfall=2.09"
Printed 10/3/2024
HydroCAD® 10.20-5b s/n 05286 © 2023 HydroCAD Software Solutions LLC
Summary for Subcatchment 6S: Watershed 6
Runoff = 502.60 cfs @ 14.81 hrs, Volume= 215.924 af, Depth= 1.17"
Runoff by SCS TR-20 method, UH=SCS, Weighted-CN, Time Span= 0.00-72.00 hrs, dt= 0.01 hrs
Type II 24-hr 1-Year Rainfall=2.09" Area (ac) CN Description * 2,212.516 90
2,212.516 100.00% Pervious Area
Direct Entry, SCS Method for Watershed Lag
Subcatchment 6S: Watershed 6
Type II 24-hr 1-Year Rainfall=2.09"
Runoff Area=2,212.516 ac Runoff Volume=215.924 af
Runoff Depth=1.17"
Page 10
15770 Existing Conditions
Prepared by Verdantas LLC
Type II 24-hr 1-Year Rainfall=2.09"
Printed 10/3/2024
HydroCAD® 10.20-5b s/n 05286 © 2023 HydroCAD Software Solutions LLC
Summary for Subcatchment 7S: Watershed 7
Runoff = 23.20 cfs @ 12.55 hrs, Volume= 3.362 af, Depth= 1.10"
Runoff by SCS TR-20 method, UH=SCS, Weighted-CN, Time Span= 0.00-72.00 hrs, dt= 0.01 hrs
Type II 24-hr 1-Year Rainfall=2.09"
36.580 100.00% Pervious Area
Direct Entry, SCS Method for Watershed Lag
Subcatchment 7S: Watershed 7
Type II 24-hr 1-Year Rainfall=2.09"
Runoff Area=36.580 ac
Runoff Volume=3.362 af
Runoff Depth=1.10" Tc=53.8 min
Page 11
15770 Existing Conditions
Prepared by Verdantas LLC
Type II 24-hr 1-Year Rainfall=2.09"
Printed 10/3/2024
HydroCAD® 10.20-5b s/n 05286 © 2023 HydroCAD Software Solutions LLC
Summary for Subcatchment 8S: Watershed 8
Runoff = 53.36 cfs @ 12.15 hrs, Volume= 4.281 af, Depth= 1.17"
Runoff by SCS TR-20 method, UH=SCS, Weighted-CN, Time Span= 0.00-72.00 hrs, dt= 0.01 hrs
Type II 24-hr 1-Year Rainfall=2.09"
43.862 90 43.862 100.00% Pervious Area
Direct Entry, SCS Method for Watershed Lag
Subcatchment 8S: Watershed 8
Type II 24-hr 1-Year Rainfall=2.09"
Runoff Area=43.862 ac
Runoff Volume=4.281 af
Runoff Depth=1.17" Tc=22.5 min
Page 12
15770 Existing Conditions
Prepared by Verdantas LLC
Type II 24-hr 1-Year Rainfall=2.09"
Printed 10/3/2024
HydroCAD® 10.20-5b s/n 05286 © 2023 HydroCAD Software Solutions LLC
Summary for Subcatchment 9S: Watershed 9
Runoff = 96.03 cfs @ 12.34 hrs, Volume= 10.583 af, Depth= 1.17"
Runoff by SCS TR-20 method, UH=SCS, Weighted-CN, Time Span= 0.00-72.00 hrs, dt= 0.01 hrs
Type II 24-hr 1-Year Rainfall=2.09"
100.00% Pervious Area
Direct Entry, SCS Method for Watershed Lag
Subcatchment 9S: Watershed 9
Type II 24-hr 1-Year Rainfall=2.09"
Runoff Area=108.440 ac
Runoff Volume=10.583 af
Runoff Depth=1.17"
Page 13
Prepared by Verdantas LLC
HydroCAD® 10.20-5b s/n 05286 © 2023 HydroCAD Software Solutions LLC
Time span=0.00-72.00 hrs, dt=0.01 hrs, 7201 points x 3
Printed 10/3/2024
Page 14
Runoff by SCS TR-20 method, UH=SCS, Weighted-CN Reach routing by Dyn-Stor-Ind method - Pond routing by Dyn-Stor-Ind method
Subcatchment 1S: Watershed 1 Tc=490.2 min CN=89 Runoff=25,202.17 cfs 20,004.261 af
Subcatchment 2S: Watershed 2
Subcatchment 3S: Watershed 3
Subcatchment 4S: Watershed 4
Subcatchment 5S: Watershed 5
6S: Watershed 6
Subcatchment 7S: Watershed 7
Subcatchment 8S: Watershed 8
Subcatchment 9S: Watershed 9
Runoff Area=78,730.995 ac 0.00% Impervious Runoff Depth=3.05"
Runoff Area=5,426.505 ac 0.00% Impervious Runoff Depth=3.05"
Runoff Area=674.993 ac 0.00% Impervious Runoff Depth=3.15"
Runoff Area=134.764 ac 0.00% Impervious Runoff Depth=3.25"
Runoff Area=36.580 ac 0.00% Impervious Runoff Depth=3.05"
Runoff Area=43.862 ac 0.00% Impervious Runoff Depth=3.15"
Runoff=140.52 cfs 11.504 af Runoff Area=108.440 ac 0.00% Impervious Runoff Depth=3.15"
Runoff=254.53 cfs
af
15770 Existing Conditions
Prepared by Verdantas LLC
Type II 24-hr 25-Year Rainfall=4.24"
Printed 10/3/2024
HydroCAD® 10.20-5b s/n 05286 © 2023 HydroCAD Software Solutions LLC
Summary for Subcatchment 1S: Watershed 1
Runoff = 25,202.17 cfs @ 17.98 hrs, Volume= 20,004.261 af, Depth= 3.05"
Runoff by SCS TR-20 method, UH=SCS, Weighted-CN, Time Span= 0.00-72.00 hrs, dt= 0.01 hrs
Type II 24-hr 25-Year Rainfall=4.24"
Area (ac) CN Description * 78,730.995 89
78,730.995 100.00% Pervious Area Tc Length Slope
490.2
2,000 0
Direct Entry, SCS Method for Watershed Lag
Subcatchment 1S: Watershed 1
Type II 24-hr 25-Year Rainfall=4.24"
Runoff Area=78,730.995 ac Runoff Volume=20,004.261 af
Runoff Depth=3.05" Tc=490.2 min CN=89
Page 15
15770 Existing Conditions
Prepared by Verdantas LLC
Type II 24-hr 25-Year Rainfall=4.24"
Printed 10/3/2024
HydroCAD® 10.20-5b s/n 05286 © 2023 HydroCAD Software Solutions LLC
Summary for Subcatchment 2S: Watershed 2
Runoff = 1,756.92 cfs @ 18.28 hrs, Volume= 1,378.786 af, Depth= 3.05"
Runoff by SCS TR-20 method, UH=SCS, Weighted-CN, Time Span= 0.00-72.00 hrs, dt= 0.01 hrs
Type II 24-hr 25-Year Rainfall=4.24"
Area (ac) CN Description * 5,426.505 89
5,426.505 100.00% Pervious Area
483.8
Direct Entry, SCS Method for Watershed Lag
Subcatchment 2S: Watershed 2
Type II 24-hr 25-Year Rainfall=4.24"
Runoff Area=5,426.505 ac
Runoff Volume=1,378.786 af
Runoff Depth=3.05" Tc=483.8 min CN=89
Page 16
15770 Existing Conditions
Prepared by Verdantas LLC
Type II 24-hr 25-Year Rainfall=4.24"
Printed 10/3/2024
HydroCAD® 10.20-5b s/n 05286 © 2023 HydroCAD Software Solutions LLC
Summary for Subcatchment 3S: Watershed 3
Runoff = 717.48 cfs @ 13.23 hrs, Volume= 177.038 af, Depth= 3.15"
Runoff by SCS TR-20 method, UH=SCS, Weighted-CN, Time Span= 0.00-72.00 hrs, dt= 0.01 hrs
Type II 24-hr 25-Year Rainfall=4.24"
(ac)
674.993 100.00% Pervious Area
Direct Entry, SCS Method for Watershed Lag
Subcatchment 3S: Watershed 3
Type II 24-hr 25-Year Rainfall=4.24"
Runoff Area=674.993 ac Runoff Volume=177.038 af
Runoff Depth=3.15"
Page 17
15770 Existing Conditions
Prepared by Verdantas LLC
Type II 24-hr 25-Year Rainfall=4.24"
Printed 10/3/2024
HydroCAD® 10.20-5b s/n 05286 © 2023 HydroCAD Software Solutions LLC
Summary for Subcatchment 4S: Watershed 4
Runoff = 224.38 cfs @ 12.62 hrs, Volume= 36.472 af, Depth= 3.25"
Runoff by SCS TR-20 method, UH=SCS, Weighted-CN, Time Span= 0.00-72.00 hrs, dt= 0.01 hrs
Type II 24-hr 25-Year Rainfall=4.24"
100.00% Pervious Area
Direct Entry, SCS Method for Watershed Lag
Subcatchment 4S: Watershed 4
Type II 24-hr 25-Year Rainfall=4.24"
Runoff Area=134.764 ac
Runoff Volume=36.472 af Runoff Depth=3.25"
Page 18
15770 Existing Conditions
Prepared by Verdantas LLC
Type II 24-hr 25-Year Rainfall=4.24"
Printed 10/3/2024
HydroCAD® 10.20-5b s/n 05286 © 2023 HydroCAD Software Solutions LLC
Summary for Subcatchment 5S: Watershed 5
Runoff = 13,816.71 cfs @ 20.66 hrs, Volume= 13,960.226 af, Depth= 3.15"
Runoff by SCS TR-20 method, UH=SCS, Weighted-CN, Time Span= 0.00-72.00 hrs, dt= 0.01 hrs
Type II 24-hr 25-Year Rainfall=4.24"
Area (ac) CN Description * 53,226.164 90
53,226.164 100.00% Pervious Area
664.0
4,000 3,000 2,000 1,000 0
Direct Entry, SCS Method for Watershed Lag
Subcatchment 5S: Watershed 5
Type II 24-hr 25-Year Rainfall=4.24" Runoff Area=53,226.164 ac Runoff Volume=13,960.226 af
Runoff Depth=3.15" Tc=664.0 min CN=90
Page 19
15770 Existing Conditions
Prepared by Verdantas LLC
Type II 24-hr 25-Year Rainfall=4.24"
Printed 10/3/2024
HydroCAD® 10.20-5b s/n 05286 © 2023 HydroCAD Software Solutions LLC
Summary for Subcatchment 6S: Watershed 6
Runoff = 1,359.84 cfs @ 14.81 hrs, Volume= 580.302 af, Depth= 3.15"
Runoff by SCS TR-20 method, UH=SCS, Weighted-CN, Time Span= 0.00-72.00 hrs, dt= 0.01 hrs
Type II 24-hr 25-Year Rainfall=4.24" Area (ac) CN Description * 2,212.516 90
2,212.516 100.00% Pervious Area
225.9 Direct Entry, SCS Method for Watershed Lag
Subcatchment 6S: Watershed 6
Type II 24-hr 25-Year Rainfall=4.24"
Runoff Area=2,212.516 ac Runoff Volume=580.302 af
Page 20
15770 Existing Conditions
Prepared by Verdantas LLC
Type II 24-hr 25-Year Rainfall=4.24"
Printed 10/3/2024
HydroCAD® 10.20-5b s/n 05286 © 2023 HydroCAD Software Solutions LLC
Summary for Subcatchment 7S: Watershed 7
Runoff = 64.26 cfs @ 12.50 hrs, Volume= 9.294 af, Depth= 3.05"
Runoff by SCS TR-20 method, UH=SCS, Weighted-CN, Time Span= 0.00-72.00 hrs, dt= 0.01 hrs
Type II 24-hr 25-Year Rainfall=4.24"
36.580 100.00% Pervious Area
Direct Entry, SCS Method for Watershed Lag
Subcatchment 7S: Watershed 7
Type II 24-hr 25-Year Rainfall=4.24"
Runoff Area=36.580 ac
Runoff Volume=9.294 af
Runoff Depth=3.05" Tc=53.8 min
Page 21
15770 Existing Conditions
Prepared by Verdantas LLC
Type II 24-hr 25-Year Rainfall=4.24"
Printed 10/3/2024
HydroCAD® 10.20-5b s/n 05286 © 2023 HydroCAD Software Solutions LLC
Summary for Subcatchment 8S: Watershed 8
Runoff = 140.52 cfs @ 12.15 hrs, Volume= 11.504 af, Depth= 3.15"
Runoff by SCS TR-20 method, UH=SCS, Weighted-CN, Time Span= 0.00-72.00 hrs, dt= 0.01 hrs
Type II 24-hr 25-Year Rainfall=4.24"
43.862 90 43.862 100.00% Pervious Area
Direct Entry, SCS Method for Watershed Lag
Subcatchment 8S: Watershed 8
Type II 24-hr 25-Year Rainfall=4.24"
Runoff Area=43.862 ac
Runoff Volume=11.504 af
Runoff Depth=3.15"
Page 22
15770 Existing Conditions
Prepared by Verdantas LLC
Type II 24-hr 25-Year Rainfall=4.24"
Printed 10/3/2024
HydroCAD® 10.20-5b s/n 05286 © 2023 HydroCAD Software Solutions LLC
Summary for Subcatchment 9S: Watershed 9
Runoff = 254.53 cfs @ 12.33 hrs, Volume= 28.442 af, Depth= 3.15"
Runoff by SCS TR-20 method, UH=SCS, Weighted-CN, Time Span= 0.00-72.00 hrs, dt= 0.01 hrs
Type II 24-hr 25-Year Rainfall=4.24"
100.00% Pervious Area
Direct Entry, SCS Method for Watershed Lag
Subcatchment 9S: Watershed 9
Type II 24-hr 25-Year Rainfall=4.24"
Runoff Area=108.440 ac
Runoff Volume=28.442 af
Runoff Depth=3.15"
Page 23
Type II 24-hr 100-Year Rainfall=5.39" 15770 Existing Conditions
Printed 10/3/2024
HydroCAD® 10.20-5b s/n 05286 © 2023 HydroCAD Software Solutions LLC
Prepared by Verdantas LLC Page 24
Time span=0.00-72.00 hrs, dt=0.01 hrs, 7201 points x 3
Runoff by SCS TR-20 method, UH=SCS, Weighted-CN Reach routing by Dyn-Stor-Ind method - Pond routing by Dyn-Stor-Ind method
Subcatchment 1S: Watershed 1 Tc=490.2 min CN=89 Runoff=34,288.85 cfs 27,203.748 af
Subcatchment 2S: Watershed 2
Runoff Area=78,730.995 ac 0.00% Impervious Runoff Depth=4.15"
Runoff Area=5,426.505 ac 0.00% Impervious Runoff Depth=4.15"
min CN=89 Runoff=2,384.36 cfs 1,875.008 af
Runoff Area=674.993 ac 0.00% Impervious Runoff Depth=4.25"
Subcatchment 3S: Watershed 3 Tc=110.2 min CN=90 Runoff=962.24 cfs 239.245 af
Runoff Area=134.764 ac 0.00% Impervious Runoff Depth=4.36"
Subcatchment 5S: Watershed 5
Subcatchment 4S: Watershed 4 Tc=62.4 min CN=91 Runoff=298.26 cfs 48.980 af Runoff Area=53,226.164 ac 0.00% Impervious Runoff
6S: Watershed 6
Subcatchment 7S: Watershed 7
Subcatchment 8S: Watershed 8
Subcatchment 9S: Watershed 9
Area=36.580 ac 0.00% Impervious Runoff Depth=4.15"
Area=108.440 ac 0.00% Impervious Runoff Depth=4.25"
min CN=90 Runoff=340.23 cfs 38.436 af
15770 Existing Conditions
Prepared by Verdantas LLC
Type II 24-hr 100-Year Rainfall=5.39"
Printed 10/3/2024
HydroCAD® 10.20-5b s/n 05286 © 2023 HydroCAD Software Solutions LLC
Summary for Subcatchment 1S: Watershed 1
Runoff = 34,288.85 cfs @ 17.97 hrs, Volume= 27,203.748 af, Depth= 4.15"
Runoff by SCS TR-20 method, UH=SCS, Weighted-CN, Time Span= 0.00-72.00 hrs, dt= 0.01 hrs
Type II 24-hr 100-Year Rainfall=5.39"
Area (ac) CN Description * 78,730.995 89
78,730.995 100.00% Pervious Area
Tc Length Slope
490.2
Direct Entry, SCS Method for Watershed Lag
Subcatchment 1S: Watershed 1
Type II 24-hr 100-Year Rainfall=5.39"
Runoff Area=78,730.995 ac Runoff Volume=27,203.748 af
Runoff Depth=4.15" Tc=490.2 min CN=89
Page 25
15770 Existing Conditions
Prepared by Verdantas LLC
Type II 24-hr 100-Year Rainfall=5.39"
Printed 10/3/2024
HydroCAD® 10.20-5b s/n 05286 © 2023 HydroCAD Software Solutions LLC
Summary for Subcatchment 2S: Watershed 2
Runoff = 2,384.36 cfs @ 18.27 hrs, Volume= 1,875.008 af, Depth= 4.15"
Runoff by SCS TR-20 method, UH=SCS, Weighted-CN, Time Span= 0.00-72.00 hrs, dt= 0.01 hrs
Type II 24-hr 100-Year Rainfall=5.39"
Area (ac) CN Description * 5,426.505 89
5,426.505 100.00% Pervious Area
483.8
Direct Entry, SCS Method for Watershed Lag
Subcatchment 2S: Watershed 2
Type II 24-hr 100-Year Rainfall=5.39"
Runoff Area=5,426.505 ac Runoff Volume=1,875.008 af
Runoff Depth=4.15"
Page 26
15770 Existing Conditions
Prepared by Verdantas LLC
Type II 24-hr 100-Year Rainfall=5.39"
Printed 10/3/2024
HydroCAD® 10.20-5b s/n 05286 © 2023 HydroCAD Software Solutions LLC
Summary for Subcatchment 3S: Watershed 3
Runoff = 962.24 cfs @ 13.23 hrs, Volume= 239.245 af, Depth= 4.25"
Runoff by SCS TR-20 method, UH=SCS, Weighted-CN, Time Span= 0.00-72.00 hrs, dt= 0.01 hrs
Type II 24-hr 100-Year Rainfall=5.39" Area (ac) CN Description * 674.993 90
674.993 100.00% Pervious Area
Direct Entry, SCS Method for Watershed Lag
Subcatchment 3S: Watershed 3
Type II 24-hr 100-Year Rainfall=5.39" Runoff Area=674.993 ac Runoff Volume=239.245 af
Page 27
15770 Existing Conditions
Prepared by Verdantas LLC
Type II 24-hr 100-Year Rainfall=5.39"
Printed 10/3/2024
HydroCAD® 10.20-5b s/n 05286 © 2023 HydroCAD Software Solutions LLC
Summary for Subcatchment 4S: Watershed 4
Runoff = 298.26 cfs @ 12.62 hrs, Volume= 48.980 af, Depth= 4.36"
Runoff by SCS TR-20 method, UH=SCS, Weighted-CN, Time Span= 0.00-72.00 hrs, dt= 0.01 hrs
Type II 24-hr 100-Year Rainfall=5.39"
100.00% Pervious Area
Direct Entry, SCS Method for Watershed Lag
Subcatchment 4S: Watershed 4
Type II 24-hr 100-Year Rainfall=5.39" Runoff Area=134.764 ac
Runoff Volume=48.980 af
Runoff Depth=4.36"
Page 28
15770 Existing Conditions
Prepared by Verdantas LLC
Type II 24-hr 100-Year Rainfall=5.39"
Printed 10/3/2024
HydroCAD® 10.20-5b s/n 05286 © 2023 HydroCAD Software Solutions LLC
Summary for Subcatchment 5S: Watershed 5
Runoff = 18,633.22 cfs @ 20.66 hrs, Volume= 18,865.520 af, Depth= 4.25"
Runoff by SCS TR-20 method, UH=SCS, Weighted-CN, Time Span= 0.00-72.00 hrs, dt= 0.01 hrs
Type II 24-hr 100-Year Rainfall=5.39"
Area (ac) CN Description * 53,226.164 90
53,226.164 100.00% Pervious Area
664.0
8,000 7,000 6,000 5,000 4,000 3,000
Direct Entry, SCS Method for Watershed Lag
Subcatchment 5S: Watershed 5
Type II 24-hr 100-Year Rainfall=5.39"
Runoff Area=53,226.164 ac Runoff Volume=18,865.520 af
Runoff Depth=4.25" Tc=664.0 min CN=90
Page 29
15770 Existing Conditions
Prepared by Verdantas LLC
Type II 24-hr 100-Year Rainfall=5.39"
Printed 10/3/2024
HydroCAD® 10.20-5b s/n 05286 © 2023 HydroCAD Software Solutions LLC
Summary for Subcatchment 6S: Watershed 6
Runoff = 1,827.22 cfs @ 14.81 hrs, Volume= 784.206 af, Depth= 4.25"
Runoff by SCS TR-20 method, UH=SCS, Weighted-CN, Time Span= 0.00-72.00 hrs, dt= 0.01 hrs
Type II 24-hr 100-Year Rainfall=5.39"
Area (ac) CN Description * 2,212.516 90
2,212.516 100.00% Pervious Area Tc Length
Direct Entry, SCS Method for Watershed Lag
Subcatchment 6S: Watershed 6
Type II 24-hr 100-Year Rainfall=5.39"
Runoff Area=2,212.516 ac
Runoff Volume=784.206 af
Runoff Depth=4.25" Tc=225.9 min
Page 30
15770 Existing Conditions
Prepared by Verdantas LLC
Type II 24-hr 100-Year Rainfall=5.39"
Printed 10/3/2024
HydroCAD® 10.20-5b s/n 05286 © 2023 HydroCAD Software Solutions LLC
Summary for Subcatchment 7S: Watershed 7
Runoff = 86.69 cfs @ 12.50 hrs, Volume= 12.639 af, Depth= 4.15"
Runoff by SCS TR-20 method, UH=SCS, Weighted-CN, Time Span= 0.00-72.00 hrs, dt= 0.01 hrs
Type II 24-hr 100-Year Rainfall=5.39"
(ac)
36.580 89
36.580 100.00% Pervious Area
Direct Entry, SCS Method for Watershed Lag
Subcatchment 7S: Watershed 7
Type II 24-hr 100-Year Rainfall=5.39"
Runoff Area=36.580 ac
Runoff Volume=12.639 af Runoff Depth=4.15"
Page 31
15770 Existing Conditions
Prepared by Verdantas LLC
Type II 24-hr 100-Year Rainfall=5.39"
Printed 10/3/2024
HydroCAD® 10.20-5b s/n 05286 © 2023 HydroCAD Software Solutions LLC
Summary for Subcatchment 8S: Watershed 8
Runoff = 187.38 cfs @ 12.15 hrs, Volume= 15.546 af, Depth= 4.25"
Runoff by SCS TR-20 method, UH=SCS, Weighted-CN, Time Span= 0.00-72.00 hrs, dt= 0.01 hrs
Type II 24-hr 100-Year Rainfall=5.39"
43.862 90 43.862 100.00% Pervious Area
Direct Entry, SCS Method for Watershed Lag
Subcatchment 8S: Watershed 8
Type II 24-hr 100-Year Rainfall=5.39"
Runoff Area=43.862 ac
Runoff Volume=15.546 af Runoff Depth=4.25"
Page 32
15770 Existing Conditions
Prepared by Verdantas LLC
Type II 24-hr 100-Year Rainfall=5.39"
Printed 10/3/2024
HydroCAD® 10.20-5b s/n 05286 © 2023 HydroCAD Software Solutions LLC
Summary for Subcatchment 9S: Watershed 9
Runoff = 340.23 cfs @ 12.31 hrs, Volume= 38.436 af, Depth= 4.25"
Runoff by SCS TR-20 method, UH=SCS, Weighted-CN, Time Span= 0.00-72.00 hrs, dt= 0.01 hrs
Type II 24-hr 100-Year Rainfall=5.39"
100.00% Pervious Area
Direct Entry, SCS Method for Watershed Lag
Subcatchment 9S: Watershed 9
Type II 24-hr 100-Year Rainfall=5.39" Runoff Area=108.440 ac Runoff Volume=38.436 af
Runoff Depth=4.25"
Page 33
1P
Watershed 1 2P
Watershed 2 3P Watershed 3 4P
Watershed 4 5P Watershed 5 6P Watershed 6 7P Watershed 7 8P Watershed 8 9P Watersed 9
Routing Diagram for 15770 Proposed Conditions Prepared by Verdantas LLC, Printed 10/3/2024 HydroCAD® 10.20-5b s/n 05286 © 2023 HydroCAD
1
Rainfall Events Listing (selected events)
Printed 10/3/2024 Prepared by Verdantas LLC
HydroCAD® 10.20-5b s/n 05286 © 2023 HydroCAD Software Solutions LLC
Area Listing (selected nodes)
Area (acres) CN Description (subcatchment-numbers)
78,730.995 89 (1P)
5,463.085 88 (2P, 7P)
674.993 84 (3P)
53,360.928 90 (4P, 5P)
2,212.516 87 (6P)
43.862 86 (8P)
108.440 85 (9P)
140,594.819 89 TOTAL AREA
Page 3
Prepared by Verdantas LLC
HydroCAD® 10.20-5b s/n 05286 © 2023 HydroCAD Software Solutions LLC
Time span=0.00-72.00 hrs, dt=0.01 hrs, 7201 points x 3
Runoff by SCS TR-20 method, UH=SCS, Weighted-CN
Printed 10/3/2024
Page 4
Reach routing by Dyn-Stor-Ind method - Pond routing by Dyn-Stor-Ind method
Subcatchment 1P: Watershed 1 Tc=490.2 min CN=89 Runoff=8,889.65 cfs 7,236.836 af
Subcatchment 2P: Watershed 2
Subcatchment 3P: Watershed 3
Subcatchment 4P: Watershed 4
Subcatchment 5P: Watershed 5
Subcatchment 6P: Watershed 6
Subcatchment 7P: Watershed 7
Subcatchment 8P: Watershed 8
Runoff Area=78,730.995 ac 0.00% Impervious Runoff Depth=1.10"
Runoff Area=5,426.505 ac 0.00% Impervious Runoff Depth=1.04"
Runoff Area=674.993 ac 0.00% Impervious Runoff Depth=0.81"
Runoff Area=134.764 ac 0.00% Impervious Runoff Depth=1.17"
Area=2,212.516 ac 0.00% Impervious Runoff Depth=0.98"
Runoff Area=36.580 ac 0.00% Impervious Runoff Depth=1.04"
min CN=88 Runoff=21.08 cfs 3.165 af
Runoff Area=43.862 ac 0.00% Impervious Runoff Depth=0.92"
Runoff Area=108.440 ac 0.00% Impervious Runoff Depth=0.86"
Subcatchment 9P: Watersed 9 Tc=44.6 min CN=85 Runoff=60.03 cfs 7.787 af Total Runoff Area = 140,594.819 ac Runoff Volume = 13,153.749 af Average Runoff Depth = 1.12"
15770 Proposed Conditions
Prepared by Verdantas LLC
Type II 24-hr 1-Year Rainfall=2.09"
Printed 10/3/2024
HydroCAD® 10.20-5b s/n 05286 © 2023 HydroCAD Software Solutions LLC
Summary for Subcatchment 1P: Watershed 1
Runoff = 8,889.65 cfs @ 17.98 hrs, Volume= 7,236.836 af, Depth= 1.10"
Runoff by SCS TR-20 method, UH=SCS, Weighted-CN, Time Span= 0.00-72.00 hrs, dt= 0.01 hrs
Type II 24-hr 1-Year Rainfall=2.09"
Area (ac) CN Description * 78,730.995 89
78,730.995 100.00% Pervious Area Tc Length
490.2
Flow (cfs)
9,000 8,500 8,000 7,500 7,000 6,500 6,000 5,500 5,000 4,500 4,000 3,500 3,000 2,500 2,000 1,500
Direct Entry, SCS Method for Watershed Lag
Subcatchment 1P: Watershed 1
Type II 24-hr 1-Year Rainfall=2.09"
Runoff Area=78,730.995 ac Runoff Volume=7,236.836 af
Runoff Depth=1.10" Tc=490.2 min CN=89
Page 5
15770 Proposed Conditions
Prepared by Verdantas LLC
Type II 24-hr 1-Year Rainfall=2.09"
Printed 10/3/2024
HydroCAD® 10.20-5b s/n 05286 © 2023 HydroCAD Software Solutions LLC
Summary for Subcatchment 2P: Watershed 2
Runoff = 570.64 cfs @ 18.45 hrs, Volume= 469.492 af, Depth= 1.04"
Runoff by SCS TR-20 method, UH=SCS, Weighted-CN, Time Span= 0.00-72.00 hrs, dt= 0.01 hrs
Type II 24-hr 1-Year Rainfall=2.09" Area (ac) CN Description * 5,426.505 88
5,426.505 100.00% Pervious Area Tc Length Slope
503.0 Direct Entry, SCS Method for Watershed Lag
Subcatchment 2P: Watershed 2
Type II 24-hr 1-Year Rainfall=2.09"
Runoff Area=5,426.505 ac Runoff Volume=469.492 af
Runoff Depth=1.04"
Page 6
15770 Proposed Conditions
Prepared by Verdantas LLC
Type II 24-hr 1-Year Rainfall=2.09"
Printed 10/3/2024
HydroCAD® 10.20-5b s/n 05286 © 2023 HydroCAD Software Solutions LLC
Summary for Subcatchment 3P: Watershed 3
Runoff = 146.73 cfs @ 13.63 hrs, Volume= 45.463 af, Depth= 0.81"
Runoff by SCS TR-20 method, UH=SCS, Weighted-CN, Time Span= 0.00-72.00 hrs, dt= 0.01 hrs
Type II 24-hr 1-Year Rainfall=2.09"
(ac) CN
* 674.993 84
674.993 100.00% Pervious Area
Direct Entry, SCS Method for Watershed Lag
Subcatchment 3P: Watershed 3
Type II 24-hr 1-Year Rainfall=2.09"
Runoff Area=674.993 ac
Runoff Volume=45.463 af
Runoff Depth=0.81"
Page 7
15770 Proposed Conditions
Prepared by Verdantas LLC
Type II 24-hr 1-Year Rainfall=2.09"
Printed 10/3/2024
HydroCAD® 10.20-5b s/n 05286 © 2023 HydroCAD Software Solutions LLC
Summary for Subcatchment 4P: Watershed 4
Runoff = 79.35 cfs @ 12.66 hrs, Volume= 13.152 af, Depth= 1.17"
Runoff by SCS TR-20 method, UH=SCS, Weighted-CN, Time Span= 0.00-72.00 hrs, dt= 0.01 hrs
Type II 24-hr 1-Year Rainfall=2.09"
Pervious
Direct Entry, SCS Method for Watershed Lag
Subcatchment 4P: Watershed 4
Type II 24-hr 1-Year Rainfall=2.09"
Runoff Area=134.764 ac Runoff Volume=13.152 af Runoff Depth=1.17"
Page 8
15770 Proposed Conditions
Prepared by Verdantas LLC
Type II 24-hr 1-Year Rainfall=2.09"
Printed 10/3/2024
HydroCAD® 10.20-5b s/n 05286 © 2023 HydroCAD Software Solutions LLC
Summary for Subcatchment 5P: Watershed 5
Runoff = 5,126.03 cfs @ 21.39 hrs, Volume= 5,194.455 af, Depth= 1.17"
Runoff by SCS TR-20 method, UH=SCS, Weighted-CN, Time Span= 0.00-72.00 hrs, dt= 0.01 hrs
Type II 24-hr 1-Year Rainfall=2.09"
Area (ac) CN Description * 53,226.164 90
53,226.164 100.00% Pervious Area Tc Length
664.0
Direct Entry, SCS Method for Watershed Lag
Subcatchment 5P: Watershed 5
Type II 24-hr 1-Year Rainfall=2.09"
Runoff Area=53,226.164 ac Runoff Volume=5,194.455 af
Depth=1.17"
Page 9
15770 Proposed Conditions
Prepared by Verdantas LLC
Type II 24-hr 1-Year Rainfall=2.09"
Printed 10/3/2024
HydroCAD® 10.20-5b s/n 05286 © 2023 HydroCAD Software Solutions LLC
Summary for Subcatchment 6P: Watershed 6
Runoff = 371.36 cfs @ 15.24 hrs, Volume= 180.045 af, Depth= 0.98"
Runoff by SCS TR-20 method, UH=SCS, Weighted-CN, Time Span= 0.00-72.00 hrs, dt= 0.01 hrs
Type II 24-hr 1-Year Rainfall=2.09" Area (ac) CN
* 2,212.516 87
2,212.516 100.00% Pervious Area
Direct Entry, SCS Method for Watershed Lag
Subcatchment 6P: Watershed 6
Type II 24-hr 1-Year Rainfall=2.09"
Runoff Area=2,212.516 ac Runoff Volume=180.045 af
Runoff Depth=0.98"
Page 10
15770 Proposed Conditions
Prepared by Verdantas LLC
Type II 24-hr 1-Year Rainfall=2.09"
Printed 10/3/2024
HydroCAD® 10.20-5b s/n 05286 © 2023 HydroCAD Software Solutions LLC
Summary for Subcatchment 7P: Watershed 7
Runoff = 21.08 cfs @ 12.57 hrs, Volume= 3.165 af, Depth= 1.04"
Runoff by SCS TR-20 method, UH=SCS, Weighted-CN, Time Span= 0.00-72.00 hrs, dt= 0.01 hrs
Type II 24-hr 1-Year Rainfall=2.09"
Pervious
Direct Entry, SCS Method for Watershed Lag
Subcatchment 7P: Watershed 7
Type II 24-hr 1-Year Rainfall=2.09"
Runoff Area=36.580 ac
Runoff Volume=3.165 af Runoff Depth=1.04" Tc=56.0 min
Page 11
15770 Proposed Conditions
Prepared by Verdantas LLC
Type II 24-hr 1-Year Rainfall=2.09"
Printed 10/3/2024
HydroCAD® 10.20-5b s/n 05286 © 2023 HydroCAD Software Solutions LLC
Summary for Subcatchment 8P: Watershed 8
Runoff = 37.59 cfs @ 12.20 hrs, Volume= 3.354 af, Depth= 0.92"
Runoff by SCS TR-20 method, UH=SCS, Weighted-CN, Time Span= 0.00-72.00 hrs, dt= 0.01 hrs
Type II 24-hr 1-Year Rainfall=2.09"
Pervious Area
Direct Entry, SCS Method for Watershed Lag
Subcatchment 8P: Watershed 8
Type II 24-hr 1-Year Rainfall=2.09"
Runoff Area=43.862 ac
Runoff Volume=3.354 af Runoff Depth=0.92" Tc=26.2 min
Page 12
15770 Proposed Conditions
Prepared by Verdantas LLC
Type II 24-hr 1-Year Rainfall=2.09"
Printed 10/3/2024
HydroCAD® 10.20-5b s/n 05286 © 2023 HydroCAD Software Solutions LLC
Summary for Subcatchment 9P: Watersed 9
Runoff = 60.03 cfs @ 12.44 hrs, Volume= 7.787 af, Depth= 0.86"
Runoff by SCS TR-20 method, UH=SCS, Weighted-CN, Time Span= 0.00-72.00 hrs, dt= 0.01 hrs
Type II 24-hr 1-Year Rainfall=2.09"
Pervious
Direct Entry, SCS Method for Watershed Lag
Subcatchment 9P: Watersed 9
Type II 24-hr 1-Year Rainfall=2.09"
Runoff Area=108.440 ac
Runoff Volume=7.787 af
Runoff Depth=0.86" Tc=44.6 min
Page 13
Conditions
Prepared by Verdantas LLC
HydroCAD® 10.20-5b s/n 05286 © 2023 HydroCAD Software Solutions LLC
Time span=0.00-72.00 hrs, dt=0.01 hrs, 7201 points x 3
Printed 10/3/2024
Page 14
Runoff by SCS TR-20 method, UH=SCS, Weighted-CN Reach routing by Dyn-Stor-Ind method - Pond routing by Dyn-Stor-Ind method
Subcatchment 1P: Watershed 1 Tc=490.2 min CN=89 Runoff=25,202.17 cfs 20,004.261 af
Subcatchment 2P: Watershed 2
Subcatchment 3P: Watershed 3
Subcatchment 4P: Watershed 4
Subcatchment 5P: Watershed 5
6P: Watershed 6
Subcatchment 7P: Watershed 7
Subcatchment 8P: Watershed 8
Subcatchment 9P: Watersed 9
Runoff Area=78,730.995 ac 0.00% Impervious Runoff Depth=3.05"
Runoff Area=5,426.505 ac 0.00% Impervious Runoff Depth=2.95"
Runoff Area=674.993 ac 0.00% Impervious Runoff Depth=2.58"
Runoff Area=134.764 ac 0.00% Impervious Runoff Depth=3.15"
Area=108.440 ac 0.00% Impervious Runoff Depth=2.67"
min CN=85 Runoff=192.39 cfs 24.158 af
15770 Proposed Conditions
Prepared by Verdantas LLC
Type II 24-hr 25-Year Rainfall=4.24"
Printed 10/3/2024
HydroCAD® 10.20-5b s/n 05286 © 2023 HydroCAD Software Solutions LLC
Summary for Subcatchment 1P: Watershed 1
Runoff = 25,202.17 cfs @ 17.98 hrs, Volume= 20,004.261 af, Depth= 3.05"
Runoff by SCS TR-20 method, UH=SCS, Weighted-CN, Time Span= 0.00-72.00 hrs, dt= 0.01 hrs
Type II 24-hr 25-Year Rainfall=4.24"
Area (ac) CN Description * 78,730.995 89
78,730.995 100.00% Pervious Area Tc Length Slope
490.2
2,000 0
Direct Entry, SCS Method for Watershed Lag
Subcatchment 1P: Watershed 1
Type II 24-hr 25-Year Rainfall=4.24"
Runoff Area=78,730.995 ac Runoff Volume=20,004.261 af
Runoff Depth=3.05" Tc=490.2 min CN=89
Page 15
15770 Proposed Conditions
Prepared by Verdantas LLC
Type II 24-hr 25-Year Rainfall=4.24"
Printed 10/3/2024
HydroCAD® 10.20-5b s/n 05286 © 2023 HydroCAD Software Solutions LLC
Summary for Subcatchment 2P: Watershed 2
Runoff = 1,662.67 cfs @ 18.44 hrs, Volume= 1,335.125 af, Depth= 2.95"
Runoff by SCS TR-20 method, UH=SCS, Weighted-CN, Time Span= 0.00-72.00 hrs, dt= 0.01 hrs
Type II 24-hr 25-Year Rainfall=4.24"
Area (ac) CN Description * 5,426.505 88
5,426.505 100.00% Pervious Area
503.0
Direct Entry, SCS Method for Watershed Lag
Subcatchment 2P: Watershed 2
Type II 24-hr 25-Year Rainfall=4.24"
Runoff Area=5,426.505 ac
Runoff Volume=1,335.125 af
Runoff Depth=2.95" Tc=503.0 min CN=88
Page 16
15770 Proposed Conditions
Prepared by Verdantas LLC
Type II 24-hr 25-Year Rainfall=4.24"
Printed 10/3/2024
HydroCAD® 10.20-5b s/n 05286 © 2023 HydroCAD Software Solutions LLC
Summary for Subcatchment 3P: Watershed 3
Runoff = 498.56 cfs @ 13.63 hrs, Volume= 145.334 af, Depth= 2.58"
Runoff by SCS TR-20 method, UH=SCS, Weighted-CN, Time Span= 0.00-72.00 hrs, dt= 0.01 hrs
Type II 24-hr 25-Year Rainfall=4.24"
(ac) CN Description * 674.993 84
674.993 100.00% Pervious Area
Direct Entry, SCS Method for Watershed Lag
Subcatchment 3P: Watershed 3
Type II 24-hr 25-Year Rainfall=4.24"
Runoff Area=674.993 ac Runoff Volume=145.334 af
Runoff Depth=2.58"
Page 17
15770 Proposed Conditions
Prepared by Verdantas LLC
Type II 24-hr 25-Year Rainfall=4.24"
Printed 10/3/2024
HydroCAD® 10.20-5b s/n 05286 © 2023 HydroCAD Software Solutions LLC
Summary for Subcatchment 4P: Watershed 4
Runoff = 212.71 cfs @ 12.66 hrs, Volume= 35.346 af, Depth= 3.15"
Runoff by SCS TR-20 method, UH=SCS, Weighted-CN, Time Span= 0.00-72.00 hrs, dt= 0.01 hrs
Type II 24-hr 25-Year Rainfall=4.24"
Pervious Area
Direct Entry, SCS Method for Watershed Lag
Subcatchment 4P: Watershed 4
Type II 24-hr 25-Year Rainfall=4.24"
Runoff Area=134.764 ac
Runoff Volume=35.346 af Runoff Depth=3.15"
Page 18
15770 Proposed Conditions
Prepared by Verdantas LLC
Type II 24-hr 25-Year Rainfall=4.24"
Printed 10/3/2024
HydroCAD® 10.20-5b s/n 05286 © 2023 HydroCAD Software Solutions LLC
Summary for Subcatchment 5P: Watershed 5
Runoff = 13,816.71 cfs @ 20.66 hrs, Volume= 13,960.226 af, Depth= 3.15"
Runoff by SCS TR-20 method, UH=SCS, Weighted-CN, Time Span= 0.00-72.00 hrs, dt= 0.01 hrs
Type II 24-hr 25-Year Rainfall=4.24"
Area (ac) CN Description * 53,226.164 90
53,226.164 100.00% Pervious Area
664.0
4,000 3,000 2,000 1,000 0
Direct Entry, SCS Method for Watershed Lag
Subcatchment 5P: Watershed 5
Type II 24-hr 25-Year Rainfall=4.24" Runoff Area=53,226.164 ac Runoff Volume=13,960.226 af
Runoff Depth=3.15" Tc=664.0 min CN=90
Page 19
15770 Proposed Conditions
Prepared by Verdantas LLC
Type II 24-hr 25-Year Rainfall=4.24"
Printed 10/3/2024
HydroCAD® 10.20-5b s/n 05286 © 2023 HydroCAD Software Solutions LLC
Summary for Subcatchment 6P: Watershed 6
Runoff = 1,116.74 cfs @ 15.23 hrs, Volume= 526.889 af, Depth= 2.86"
Runoff by SCS TR-20 method, UH=SCS, Weighted-CN, Time Span= 0.00-72.00 hrs, dt= 0.01 hrs
Type II 24-hr 25-Year Rainfall=4.24"
Area (ac) CN Description * 2,212.516 87
2,212.516 100.00% Pervious Area Tc Length Slope
Direct Entry, SCS Method for Watershed Lag
Subcatchment 6P: Watershed 6
Type II 24-hr 25-Year Rainfall=4.24"
Runoff Area=2,212.516 ac
Runoff Volume=526.889 af
Runoff Depth=2.86" Tc=253.9 min
Page 20
15770 Proposed Conditions
Prepared by Verdantas LLC
Type II 24-hr 25-Year Rainfall=4.24"
Printed 10/3/2024
HydroCAD® 10.20-5b s/n 05286 © 2023 HydroCAD Software Solutions LLC
Summary for Subcatchment 7P: Watershed 7
Runoff = 60.53 cfs @ 12.57 hrs, Volume= 9.000 af, Depth= 2.95"
Runoff by SCS TR-20 method, UH=SCS, Weighted-CN, Time Span= 0.00-72.00 hrs, dt= 0.01 hrs
Type II 24-hr 25-Year Rainfall=4.24"
36.580 100.00% Pervious Area
Direct Entry, SCS Method for Watershed Lag
Subcatchment 7P: Watershed 7
Type II 24-hr 25-Year Rainfall=4.24"
Runoff Area=36.580 ac
Runoff Volume=9.000 af
Runoff Depth=2.95" Tc=56.0 min
Page 21
15770 Proposed Conditions
Prepared by Verdantas LLC
Type II 24-hr 25-Year Rainfall=4.24"
Printed 10/3/2024
HydroCAD® 10.20-5b s/n 05286 © 2023 HydroCAD Software Solutions LLC
Summary for Subcatchment 8P: Watershed 8
Runoff = 114.77 cfs @ 12.20 hrs, Volume= 10.105 af, Depth= 2.76"
Runoff by SCS TR-20 method, UH=SCS, Weighted-CN, Time Span= 0.00-72.00 hrs, dt= 0.01 hrs
Type II 24-hr 25-Year Rainfall=4.24"
43.862 86
43.862 100.00% Pervious Area
Direct Entry, SCS Method for Watershed Lag
Subcatchment 8P: Watershed 8
Type II 24-hr 25-Year Rainfall=4.24"
Runoff Area=43.862 ac
Runoff Volume=10.105 af Runoff
Page 22
15770 Proposed Conditions
Prepared by Verdantas LLC
Type II 24-hr 25-Year Rainfall=4.24"
Printed 10/3/2024
HydroCAD® 10.20-5b s/n 05286 © 2023 HydroCAD Software Solutions LLC
Summary for Subcatchment 9P: Watersed 9
Runoff = 192.39 cfs @ 12.43 hrs, Volume= 24.158 af, Depth= 2.67"
Runoff by SCS TR-20 method, UH=SCS, Weighted-CN, Time Span= 0.00-72.00 hrs, dt= 0.01 hrs
Type II 24-hr 25-Year Rainfall=4.24"
100.00% Pervious Area
Direct Entry, SCS Method for Watershed Lag
Subcatchment 9P: Watersed 9
Type II 24-hr 25-Year Rainfall=4.24"
Runoff Area=108.440 ac
Runoff Volume=24.158 af Runoff Depth=2.67"
Page 23
Type II 24-hr 100-Year Rainfall=5.39" 15770 Proposed Conditions
Prepared by Verdantas LLC
HydroCAD® 10.20-5b s/n 05286 © 2023 HydroCAD Software Solutions LLC
Time span=0.00-72.00 hrs, dt=0.01 hrs, 7201 points x 3
Printed 10/3/2024
Page 24
Runoff by SCS TR-20 method, UH=SCS, Weighted-CN Reach routing by Dyn-Stor-Ind method - Pond routing by Dyn-Stor-Ind method
Subcatchment 1P: Watershed 1 Tc=490.2 min CN=89 Runoff=34,288.85 cfs 27,203.748 af
Subcatchment 2P: Watershed 2
Runoff Area=78,730.995 ac 0.00% Impervious Runoff Depth=4.15"
Runoff Area=5,426.505 ac 0.00% Impervious Runoff Depth=4.04"
min CN=88 Runoff=2,275.38 cfs 1,827.175 af
Subcatchment 3P: Watershed 3 Tc=137.8 min CN=84 Runoff=701.54 cfs 204.132 af
Subcatchment 4P: Watershed 4
Subcatchment 5P: Watershed 5
6P: Watershed 6
Subcatchment 7P: Watershed 7
Subcatchment 8P: Watershed 8
Subcatchment 9P: Watersed 9
Runoff Area=674.993 ac 0.00% Impervious Runoff Depth=3.63"
Runoff Area=134.764 ac 0.00% Impervious Runoff Depth=4.25"
ac 0.00% Impervious Runoff Depth=4.04"
Runoff Area=108.440 ac 0.00% Impervious Runoff Depth=3.73"
15770 Proposed Conditions
Prepared by Verdantas LLC
Type II 24-hr 100-Year Rainfall=5.39"
Printed 10/3/2024
HydroCAD® 10.20-5b s/n 05286 © 2023 HydroCAD Software Solutions LLC
Summary for Subcatchment 1P: Watershed 1
Runoff = 34,288.85 cfs @ 17.97 hrs, Volume= 27,203.748 af, Depth= 4.15"
Runoff by SCS TR-20 method, UH=SCS, Weighted-CN, Time Span= 0.00-72.00 hrs, dt= 0.01 hrs
Type II 24-hr 100-Year Rainfall=5.39"
Area (ac) CN Description * 78,730.995 89
78,730.995 100.00% Pervious Area
Tc Length Slope
490.2
Direct Entry, SCS Method for Watershed Lag
Subcatchment 1P: Watershed 1
Type II 24-hr 100-Year Rainfall=5.39"
Runoff Area=78,730.995 ac Runoff Volume=27,203.748 af
Runoff Depth=4.15" Tc=490.2 min CN=89
Page 25
15770 Proposed Conditions
Prepared by Verdantas LLC
Type II 24-hr 100-Year Rainfall=5.39"
Printed 10/3/2024
HydroCAD® 10.20-5b s/n 05286 © 2023 HydroCAD Software Solutions LLC
Summary for Subcatchment 2P: Watershed 2
Runoff = 2,275.38 cfs @ 18.44 hrs, Volume= 1,827.175 af, Depth= 4.04"
Runoff by SCS TR-20 method, UH=SCS, Weighted-CN, Time Span= 0.00-72.00 hrs, dt= 0.01 hrs
Type II 24-hr 100-Year Rainfall=5.39"
Area (ac) CN Description * 5,426.505 88
5,426.505 100.00% Pervious Area
(min) (feet) (ft/ft) (ft/sec) (cfs)
503.0
1,400 1,300 1,200 1,100 1,000
Direct Entry, SCS Method for Watershed Lag
Subcatchment 2P: Watershed 2
Type II 24-hr 100-Year Rainfall=5.39"
Area=5,426.505 ac
af
Runoff Depth=4.04" Tc=503.0 min CN=88
Page 26
15770 Proposed Conditions
Prepared by Verdantas LLC
Type II 24-hr 100-Year Rainfall=5.39"
Printed 10/3/2024
HydroCAD® 10.20-5b s/n 05286 © 2023 HydroCAD Software Solutions LLC
Summary for Subcatchment 3P: Watershed 3
Runoff = 701.54 cfs @ 13.63 hrs, Volume= 204.132 af, Depth= 3.63"
Runoff by SCS TR-20 method, UH=SCS, Weighted-CN, Time Span= 0.00-72.00 hrs, dt= 0.01 hrs
Type II 24-hr 100-Year Rainfall=5.39" Area (ac) CN Description * 674.993 84
674.993 100.00% Pervious Area
Direct Entry, SCS Method for Watershed Lag
Subcatchment 3P: Watershed 3
Type II 24-hr 100-Year Rainfall=5.39" Runoff Area=674.993 ac Runoff Volume=204.132 af
Runoff Depth=3.63"
Page 27
15770 Proposed Conditions
Prepared by Verdantas LLC
Type II 24-hr 100-Year Rainfall=5.39"
Printed 10/3/2024
HydroCAD® 10.20-5b s/n 05286 © 2023 HydroCAD Software Solutions LLC
Summary for Subcatchment 4P: Watershed 4
Runoff = 284.83 cfs @ 12.66 hrs, Volume= 47.766 af, Depth= 4.25"
Runoff by SCS TR-20 method, UH=SCS, Weighted-CN, Time Span= 0.00-72.00 hrs, dt= 0.01 hrs
Type II 24-hr 100-Year Rainfall=5.39"
Pervious Area
Direct Entry, SCS Method for Watershed Lag
Subcatchment 4P: Watershed 4
Type II 24-hr 100-Year Rainfall=5.39" Runoff Area=134.764 ac Runoff Volume=47.766 af Runoff Depth=4.25"
Page 28
15770 Proposed Conditions
Prepared by Verdantas LLC
Type II 24-hr 100-Year Rainfall=5.39"
Printed 10/3/2024
HydroCAD® 10.20-5b s/n 05286 © 2023 HydroCAD Software Solutions LLC
Summary for Subcatchment 5P: Watershed 5
Runoff = 18,633.22 cfs @ 20.66 hrs, Volume= 18,865.520 af, Depth= 4.25"
Runoff by SCS TR-20 method, UH=SCS, Weighted-CN, Time Span= 0.00-72.00 hrs, dt= 0.01 hrs
Type II 24-hr 100-Year Rainfall=5.39"
Area (ac) CN Description * 53,226.164 90
53,226.164 100.00% Pervious Area
664.0
8,000 7,000 6,000 5,000 4,000 3,000
Direct Entry, SCS Method for Watershed Lag
Subcatchment 5P: Watershed 5
Type II 24-hr 100-Year Rainfall=5.39"
Runoff Area=53,226.164 ac Runoff Volume=18,865.520 af
Runoff Depth=4.25" Tc=664.0 min CN=90
Page 29
15770 Proposed Conditions
Prepared by Verdantas LLC
Type II 24-hr 100-Year Rainfall=5.39"
Printed 10/3/2024
HydroCAD® 10.20-5b s/n 05286 © 2023 HydroCAD Software Solutions LLC
Summary for Subcatchment 6P: Watershed 6
Runoff = 1,537.70 cfs @ 14.96 hrs, Volume= 725.696 af, Depth= 3.94"
Runoff by SCS TR-20 method, UH=SCS, Weighted-CN, Time Span= 0.00-72.00 hrs, dt= 0.01 hrs
Type II 24-hr 100-Year Rainfall=5.39"
Area (ac) CN Description * 2,212.516 87
2,212.516 100.00% Pervious Area
253.9
Direct Entry, SCS Method for Watershed Lag
Subcatchment 6P: Watershed 6
Type II 24-hr 100-Year Rainfall=5.39"
Runoff Area=2,212.516 ac
Runoff Volume=725.696 af Runoff Depth=3.94"
Page 30
15770 Proposed Conditions
Prepared by Verdantas LLC
Type II 24-hr 100-Year Rainfall=5.39"
Printed 10/3/2024
HydroCAD® 10.20-5b s/n 05286 © 2023 HydroCAD Software Solutions LLC
Summary for Subcatchment 7P: Watershed 7
Runoff = 82.20 cfs @ 12.56 hrs, Volume= 12.317 af, Depth= 4.04"
Runoff by SCS TR-20 method, UH=SCS, Weighted-CN, Time Span= 0.00-72.00 hrs, dt= 0.01 hrs
Type II 24-hr 100-Year Rainfall=5.39"
(ac)
36.580 100.00% Pervious Area
Direct Entry, SCS Method for Watershed Lag
Subcatchment 7P: Watershed 7
Type II 24-hr 100-Year Rainfall=5.39"
Runoff Area=36.580 ac
Runoff Volume=12.317 af
Runoff Depth=4.04"
Page 31
15770 Proposed Conditions
Prepared by Verdantas LLC
Type II 24-hr 100-Year Rainfall=5.39"
Printed 10/3/2024
HydroCAD® 10.20-5b s/n 05286 © 2023 HydroCAD Software Solutions LLC
Summary for Subcatchment 8P: Watershed 8
Runoff = 157.78 cfs @ 12.20 hrs, Volume= 14.008 af, Depth= 3.83"
Runoff by SCS TR-20 method, UH=SCS, Weighted-CN, Time Span= 0.00-72.00 hrs, dt= 0.01 hrs
Type II 24-hr 100-Year Rainfall=5.39"
(ac)
* 43.862 86
43.862 100.00% Pervious Area
Direct Entry, SCS Method for Watershed Lag
Subcatchment 8P: Watershed 8
Type II 24-hr 100-Year Rainfall=5.39"
Runoff Area=43.862 ac Runoff Volume=14.008 af Runoff Depth=3.83"
Page 32
15770 Proposed Conditions
Prepared by Verdantas LLC
Type II 24-hr 100-Year Rainfall=5.39"
Printed 10/3/2024
HydroCAD® 10.20-5b s/n 05286 © 2023 HydroCAD Software Solutions LLC
Summary for Subcatchment 9P: Watersed 9
Runoff = 267.26 cfs @ 12.43 hrs, Volume= 33.709 af, Depth= 3.73"
Runoff by SCS TR-20 method, UH=SCS, Weighted-CN, Time Span= 0.00-72.00 hrs, dt= 0.01 hrs
Type II 24-hr 100-Year Rainfall=5.39"
100.00% Pervious Area
Direct Entry, SCS Method for Watershed Lag
Subcatchment 9P: Watersed 9
Type II 24-hr 100-Year Rainfall=5.39" Runoff Area=108.440 ac Runoff Volume=33.709 af
Runoff Depth=3.73"
Page 33