Exhibit G - Summary of Public Outreach (Part 2 of 2)
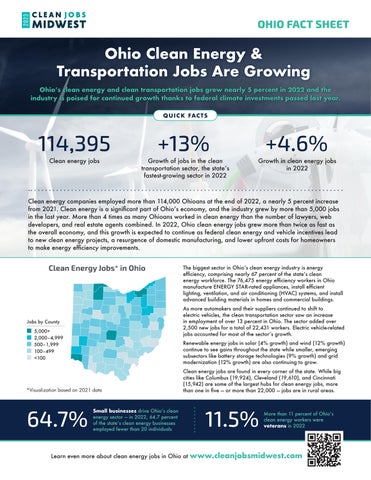
Ohio Clean Energy & Transportation Jobs Are Growing
Ohio’s clean energy and clean transportation jobs grew nearly 5 percent in 2022 and the industry is poised for continued growth thanks to federal climate investments passed last year.
114,395 +13% +4.6%
Clean energy jobs
Growth of jobs in the clean transportation sector, the state’s fastest-growing sector in 2022
Growth in clean energy jobs in 2022
Clean energy companies employed more than 114,000 Ohioans at the end of 2022, a nearly 5 percent increase from 2021. Clean energy is a significant part of Ohio’s economy, and the industry grew by more than 5,000 jobs in the last year. More than 4 times as many Ohioans worked in clean energy than the number of lawyers, web developers, and real estate agents combined. In 2022, Ohio clean energy jobs grew more than twice as fast as the overall economy, and this growth is expected to continue as federal clean energy and vehicle incentives lead to new clean energy projects, a resurgence of domestic manufacturing, and lower upfront costs for homeowners to make energy efficiency improvements.
Clean Energy Jobs* in Ohio
Jobs by County 5,000+ 2,000–4,999
*Visualization based on 2021 data
64.7%
The biggest sector in Ohio’s clean energy industry is energy efficiency, comprising nearly 67 percent of the state’s clean energy workforce. The 76,475 energy efficiency workers in Ohio manufacture ENERGY STAR-rated appliances, install efficient lighting, ventilation, and air conditioning (HVAC) systems, and install advanced building materials in homes and commercial buildings. As more automakers and their suppliers continued to shift to electric vehicles, the clean transportation sector saw an increase in employment of over 13 percent in Ohio. The sector added over 2,500 new jobs for a total of 22,431 workers. Electric vehicle-related jobs accounted for most of the sector’s growth.
Renewable energy jobs in solar (4% growth) and wind (12% growth) continue to see gains throughout the state while smaller, emerging subsectors like battery storage technologies (9% growth) and grid modernization (12% growth) are also continuing to grow.
Clean energy jobs are found in every corner of the state. While big cities like Columbus (19,924), Cleveland (19,610), and Cincinnati (15,942) are some of the largest hubs for clean energy jobs, more than one in five — or more than 22,000 — jobs are in rural areas.
11.5% Small businesses drive Ohio’s clean energy sector — in 2022, 64.7 percent of the state’s clean energy businesses employed fewer than 20 individuals
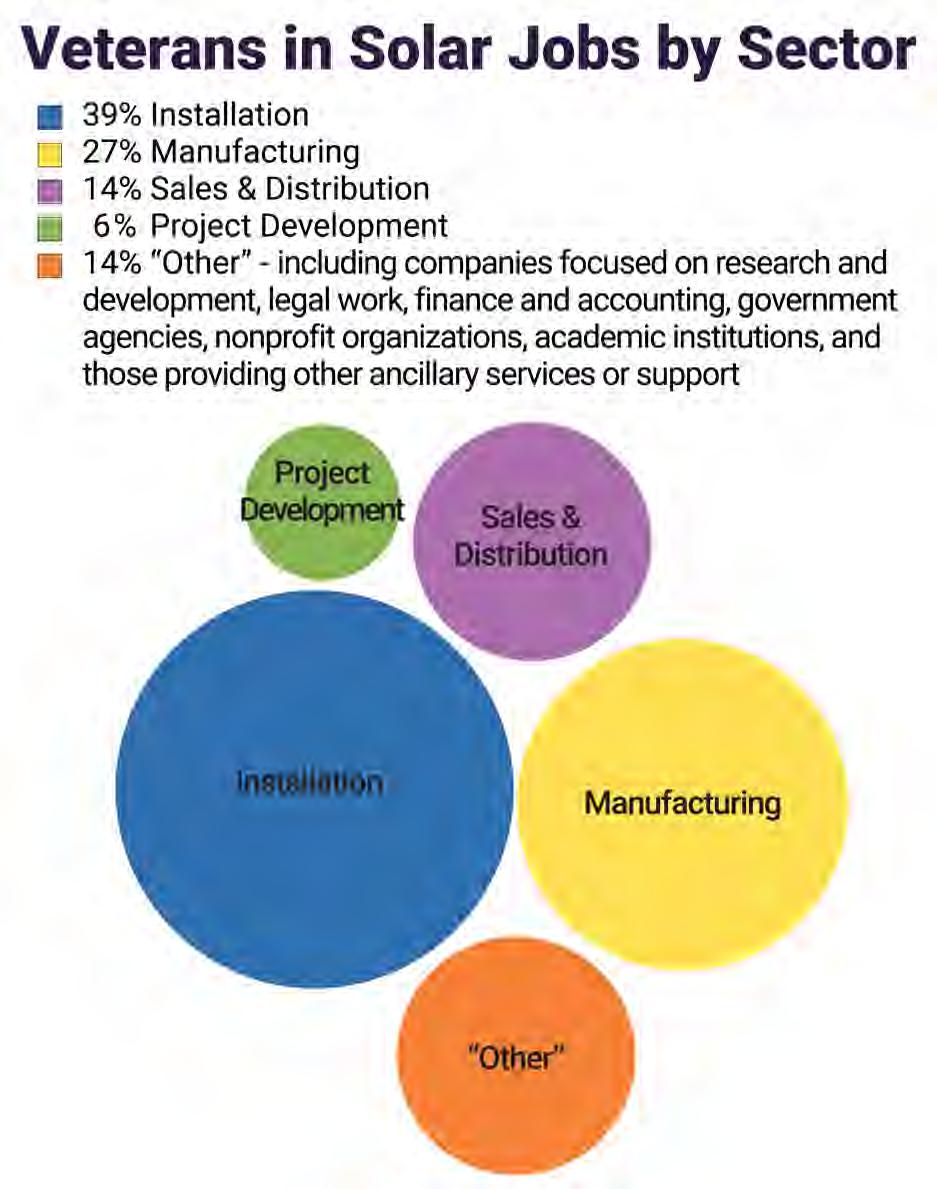
More than 11 percent of Ohio’s clean energy workers were veterans in 2022
Learn even more about clean energy jobs in Ohio at www.cleanjobsmidwest.com
QUICK FACTS
POLICIES MATTER
While recent federal policies, including investments and tax credits for energy efficiency upgrades, EV and solar purchases and new clean energy projects create strong tailwinds, there is still more to do. To meet the nation’s goals of reducing climate emissions by 50 percent by 2030, improve equity in the clean energy economy and grow clean energy jobs, lawmakers and policymakers should:
• Defend against attempts to roll back federal clean energy and vehicle investments: Just one year after the passage of the Inflation Reduction Act, companies are investing over $86 billion in large scale clean energy projects that will lead to the creation of over 74,000 jobs, thanks to the federal investments and incentives in the new law. Of the 210 projects announced, almost a quarter are in Midwestern states. Attempts to rollback provisions of the federal clean energy incentives threaten future clean energy job growth and economic opportunity.
• Develop and fund federal and state workforce development programs. One of the largest barriers to clean energy job growth is the challenge to fill open positions. Workforce training will be critical to the continued growth of the industry, as nearly 88 percent of employers in Ohio report at least some difficulty hiring workers. Union apprenticeship programs are well-positioned to help meet this demand.
• Expand transmission to increase access for clean energy projects. Federal and state governments must work with the Midwest regional transmission organizations to build more transmission. Without more transmission, many wind and solar projects will not be built.
• Advance state-level clean energy policies. It will be important for Ohio to adopt state policies that leverage federal investment and help create thousands of new jobs, including legislation that would establish voluntary energy efficiency programs and community solar in the state.
JOBS BY SECTOR
2022 SUBSECTOR DETAILS
Unless otherwise stated, the data and analyses presented in this report by Evergreen Climate Innovations and Environmental Entrepreneurs (E2) are based on data collected for the 2023 U.S. Energy Employment Report (2023 USEER), produced by the United States Department of Energy (DOE) and collected and analyzed by BW Research Partnership (BWRP).
Crossroads PILOT Summary
Here's what the proposed PILOT means for Morrow County.
$33.8 MILLION
What is a "PILOT"?
The PILOT (Payment In Lieu of Taxes) program allows local communities to create a lasting partnership with a utility-scale solar facility that will provide significant and sustaining revenues for schools and local governments, while creating jobs and economic activity. of
guaranteed revenue over 40 years
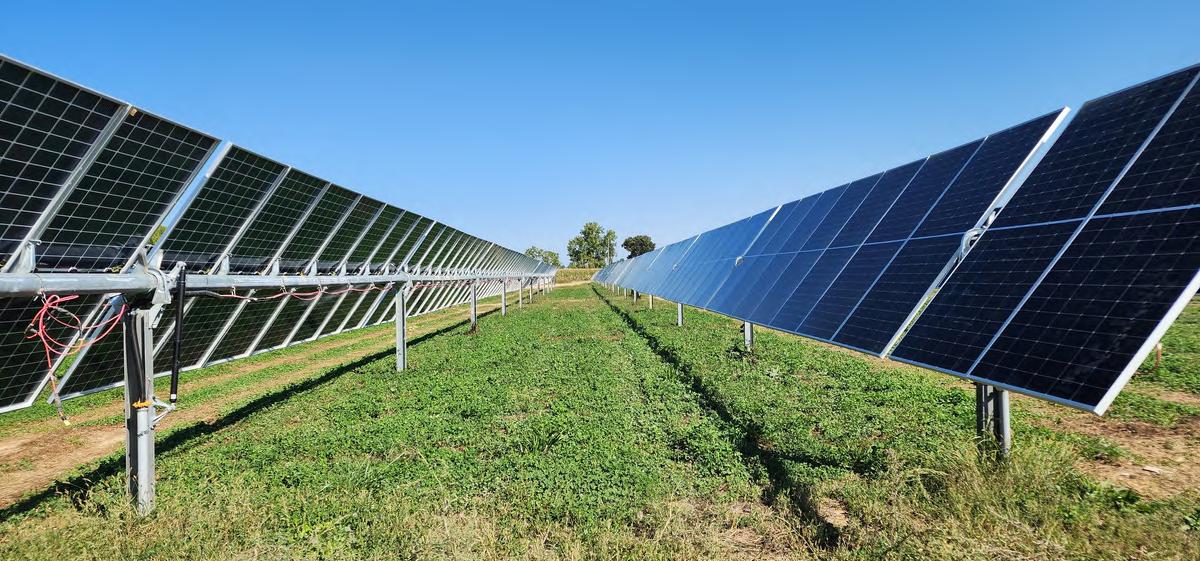
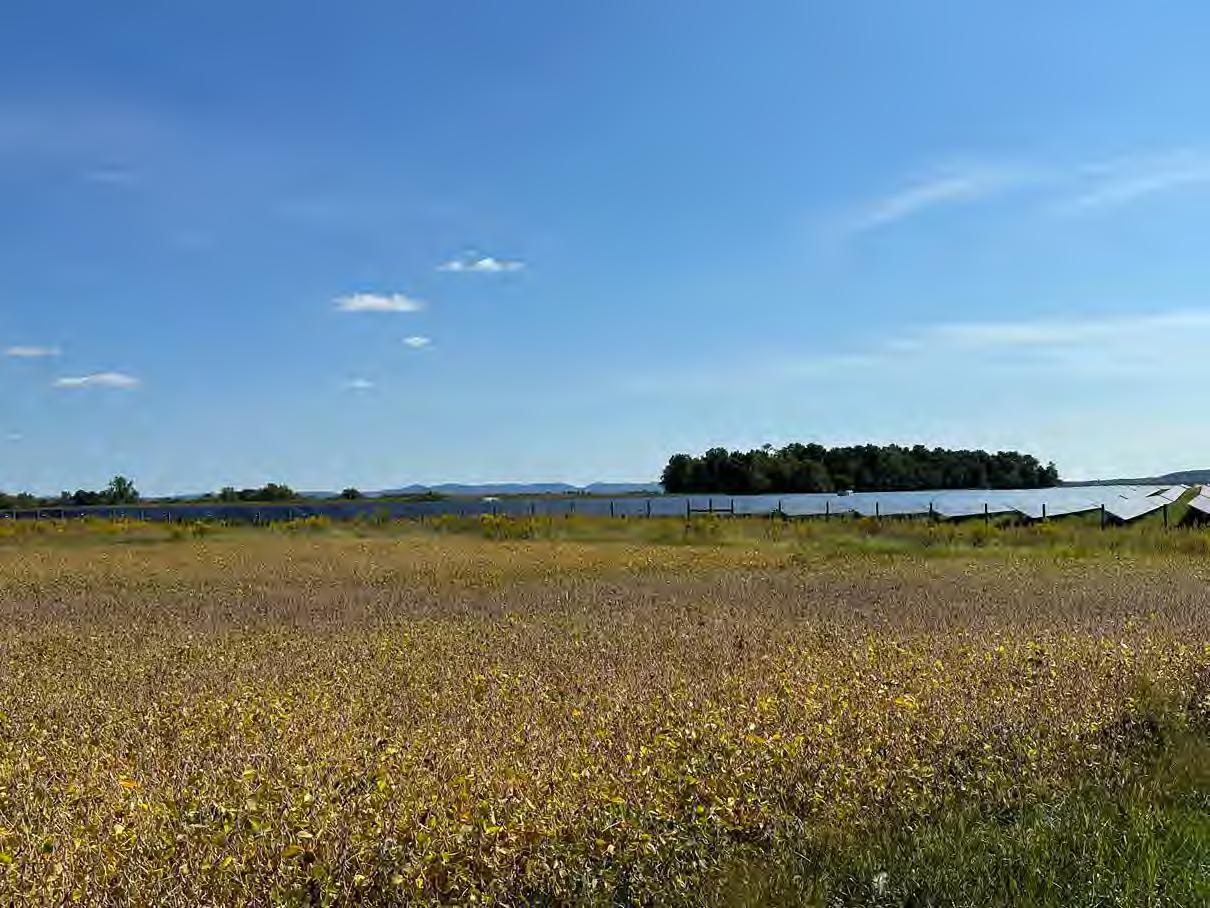
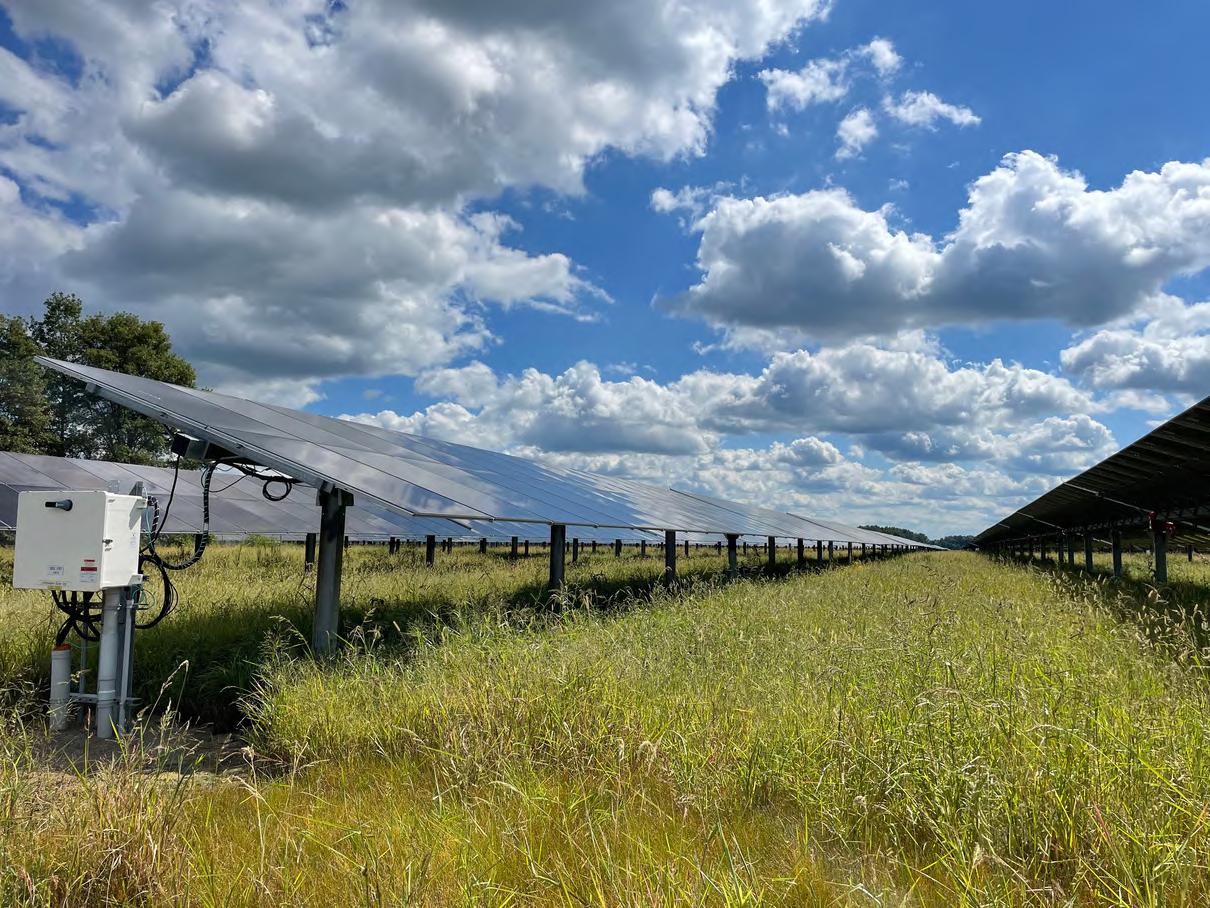
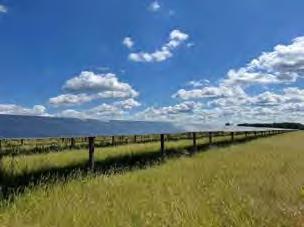
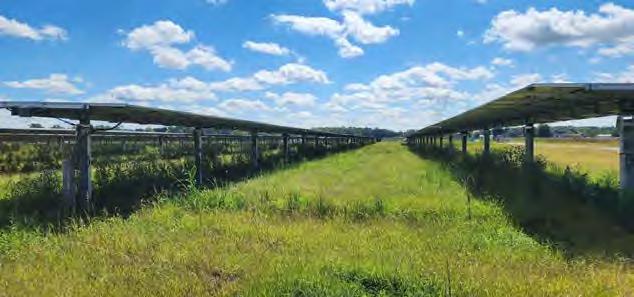
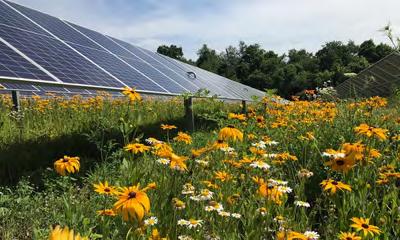
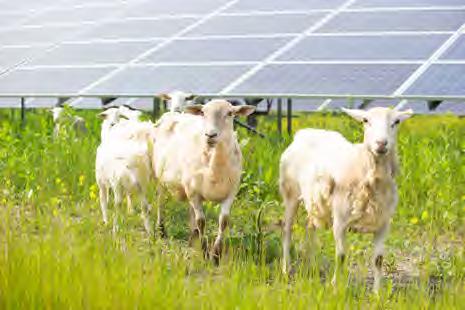
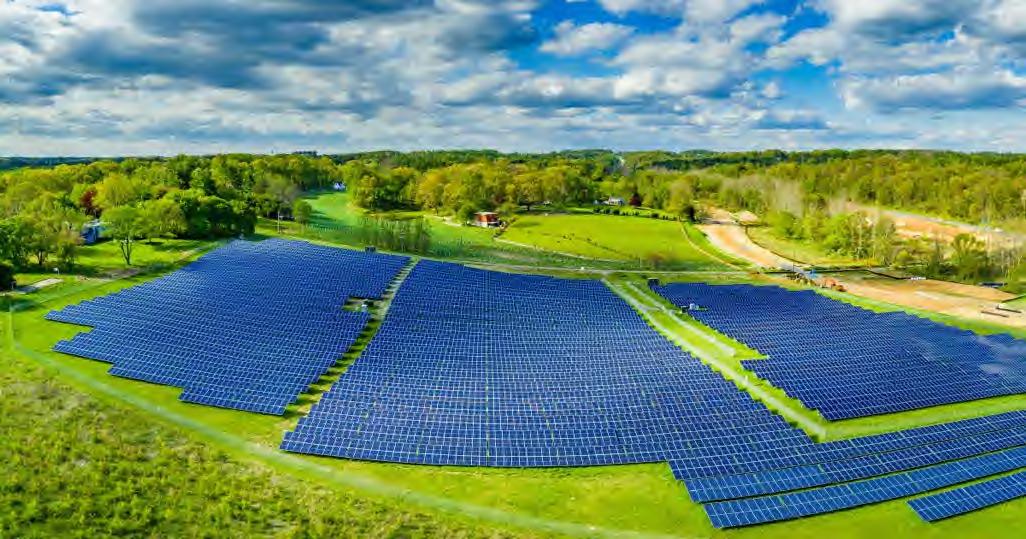
CROSSROADS SOLAR GRAZING CENTER
Morrow County, OH
The Crossroads PILOT in action. Creating jobs, increasing local and state revenues, and creating clean and domestic energy.
$846,000 construction jobs of clean energy of the construction workforce must come from Ohio residents 70%
annually to local schools and services
100+
FULL-TIME JOBS AND CAREER DEVELOPMENT
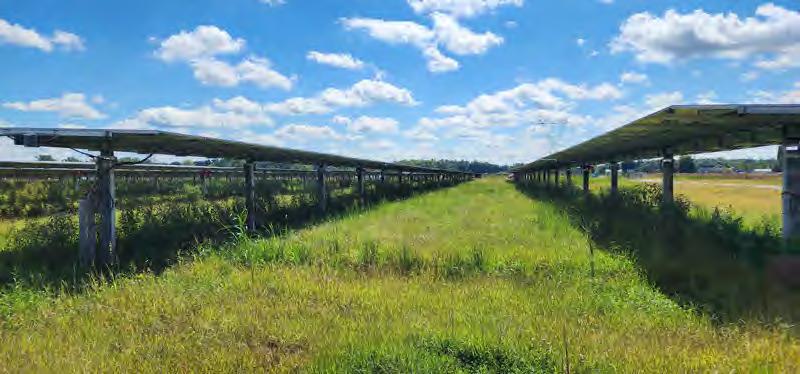
FARMLAND PRESERVATION
LASTING COMMUNITY PARTNERSHIP
LOCAL TRAINING
TRAINING PARTNERSHIP WITH LOCAL VOCATIONAL SCHOOL
REQUIREMENT TO MAINTAIN & IMPROVE INFRASTRUCTURE
EMS & FIRE TRAINING
THEDATAISCLEAR
Neighborsandcommunitymembersnearaprospoedsolarprojectare often understandably concerned about the potential it to affect nearby property values. These concerns are often amplified by misinformationpromotedbyprojectopponents.
Several studies examining actual data of nearby property sales before and after construction of utility-scale solar facilities have been conductedovertheyears. Noneofthesehasshownthatsolarfacilities like Crossroads sited in rural areas have had significant negative impactsonpropertyvaluesinthesurroundingarea.
Generally, a new land use may affect nearby property values if it has significant negative impacts on the surrounding area. For example, landfills may bring truck traffic and litter, and large-scale poultry operations may come with unwanted odors. Solar facilities are a highly passive use, with no significant long term impacts. Their operation generates no pollution, odor, dust, pipelines or waste disposal, and only minimal light, noise and traffic. Solar panels rotate tooslowlytobenoticedanddonotproduceelectricityatnight. They have a low physical profile and their appearance can be effectively enhancedwithsetbacksandlandscaping.
Although some people may not like the idea of a solar facility located near their property, property sales data clearly show that this preferencedoesnottranslatetoareductioninmarketvalue.
“Results
from our survey of residential home assessors show that the majority of respondents believe that proximity to solar installation has either no impact or a positive impact on home values.”
No statistically significant impact from nearby solar projects on property values.
Property values can actually increase near solar farms, likely due to the positive impact of increased local tax revenue/services.
Screening and setbacks can ensure that nearby property values are not negatively impacted.
American Society of Farm Managers and rural Appraisers Summary
Reviewed and summarized studies on solar facilities and property values
Found the studies generally show no negative impact, and sometimes a positive impact
University of Rhode Island Study
Analyzed 400,000 transactions near solar projects over the course of 15 years.
Found no negative impact on property values from solar farms located in rural areas.
CohnReznick Study
Examined sales of single-family homes and agricultural land near 9 solar facilities in Indiana and Illinois.
Found no negative impact on property values due to proximity to the 9 facilities.
Lawrence Berkley National Laboratory Study
Analyzed 1.8 million home sales near solar projects in six states
The study found on average a statistically insignificant impact, with the highest negative impact in the states with the highest population density (ex. N.J.).
The state with both the most solar installed (over 930,000 sales transactions, more than half of the dataset in the study) and the largest rural solar projects (like Ohio) actually showed a statistically insignificant positive property value impact from nearby solar projects.
FREQUENTLYASKED QUESTIONS
Didn’t the University of Texas Study find solar projects negatively impact property values?
No. The University of Texas Study asked property appraisers whether they thought nearby solar projects would negatively impact property values, and a majority of appraisers indicated that they did not believe so. The study in fact shows that only responses from appraisers who self-identify as having no experience in solar facilities thought there would be a negative impact. To quote the study: “Results from our survey of residential home assessors show that the majority of respondents believe that proximity to solar installation has either no impact or a positive impact on home values.”
Did a Georgia State University study find that solar hurts property values?
No. That study examined property value impacts of industrial, office, and retail development on urban homes in a large metropolitan area. The study did not study solar project impacts at all and did not examine impacts on rural property values.
How are property value impacts measured in these studies? Don’t real estate values change all the time for many reasons?
In order to isolate the potential impact of a nearby solar project on real estate values, researchers use a number of statistical tools designed to differentiate between normal real estate price fluctuations and those potentially caused by a nearby solar facility. One of these tools is called a Hedonic Price Model. Researchers use data on repeat sales of the same properties near a solar project both before and after the facility was built and compare that data to repeat sales of properties farther from the solar project. This allows researchers to isolate the differences in price due to distance from the solar project vs. the many other reasons real estate prices can change over time. Other tools, such as Paired Sales Analysis, can allow researchers to assess the value of specific homes near a solar facility based on the sale of comparable homes farther away to determine whether the sales price was different than the assessed value. Each of these tools help determine whether any difference in real estate value is caused by a nearby solar facility vs. other factors.
Do these studies suggest ways to minimize potential negative property value impacts from nearby solar facilities?
Yes. Although no study identified significant negative impacts from nearby solar projects in rural areas, several studies identified vegetative screening and setbacks from residences as key tools in minimizing potentially negative impacts. Crossroads will install vegetative screening and be designed to have substantial setbacks .
RESOURCES
“Solar’s Impact on Rural Property Values”, Feb 2021. American Society of Farm Managers & Rural Appraisers, available at: https://www.asfmra.org/blogs/asfmra-press/2021/02/16/solars-impact-onland-values
“Property Impact Study: Solar Farms in Illinois.” Mcleancounty.gov, Nexia International, 7 Aug. 2018. Available at: https://illinoissolar.org/resources/Documents/Large%20Scale%20Solar%20 Facts.pdf
“Study of Residential Market Trends Surrounding Six Utility-Scale Solar Projects in Texas,” June 2023. Real Property Analytics, available at: https://www.conservativetexansforenergyinnovation.org/wpcontent/uploads/2023/09/Analysis-of-Market-Trends-Surrounding-UtilityScale-Solar-Projects-Real-Property-Analytics.pdf
“Adjacent Property Values Solar Impact Study: A Study of Nine Existing Solar Farms,” March 2018. Available at: https://www.co.champaign.il.us/CountyBoard/ZBA/2018/180412_Meeting/1 80412_Adjacent%20Property%20Values%20Solar%20Impact%20Study%20 by%20CohnReznick.pdf
SOLARDECOMMISSIONING
Like all infrastructure, solar facilities have a limited operational life. The decommissioning of solar facilities is a natural phase in their lifecycle that ensures responsible land management and preservation of agricultural resources.
Decommissioning is essentially the construction process in reverse. Much of the material that comprises the facility, including increasingly the solar panels themselves, can be re-used or recycled. After decommissioning, the landowners will be able to return any of the farm fields to crop production should they choose to do so.
Decommissioning of solar facilities is practicable because they include very few foundations and most of the land within a solar facility is actually open ground. Solar facilities like Crossroads typically are scheduled to be decommissioned after the expected useful life of the panels (35-40 years).
Both state law and the solar leases between Crossroads and landowners have strict requirements regarding decommissioning of facility components and restoration of the land to agricultural conditions.
Modern solar facilities may be considered a temporary, albeit long-term, use of the land, in the sense that the systems can be readily removed from the site at the end of their productive life.”
Solar
“is a viable way to preserve land for potential future agricultural use.”
The solar facility is disconnected from the utility power grid.
Solar panels are disconnected, collected, and either shipped to another project, salvaged, or submitted to a collection and recycling program.
Aboveground and underground electrical cables are removed down to a depth of at least 3-feet and recycled off‐site by an approved recycling facility.
Metal piles that support solar panels and racking are removed and recycled off‐site by an approved metals recycler.
Electrical and electronic devices, including transformers and inverters, are removed and may be recycled off‐site by an approved recycler.
Any concrete foundations or footers (ex. under the inverters) are removed and may be recycled off‐site by a concrete recycler.
Fencing is removed and recycled off‐site by an approved recycler.
Interior project roads may remain onsite should the landowner choose to retain them, or be removed and the gravel repurposed either on‐ or off‐site.
A performance bond in favor of the State must be posted to guarantee the necessary funds to decommission a solar project at the end of its life.
State law requires that the cost estimate for the performance bond be accurate and conservative.
An Ohio-licensed professional engineer approved by the State must develop the cost estimate.
Despite the fact that the facility will contain many valuable components and materials, the value of those materials may not be accounted for in the cost estimate.
The cost estimate must be recalculated every 5 years, and the bond amount may be increased as needed.
As part of its OPSB Application, Crossroads will prepare a Preliminary Decommissioning Plan which will estimate decommissioning and restoration costs and the resulting bond amount.
RETURNTOFARMING
Solar facility construction will have only limited impact on the farm parcels that host it. A variety of efforts are undertaken through the design, construction, operations, and decommissioning process to maximize the project parcels’ future agricultural value and viability.
Drain tile mapping and preservation or restoration
The majority of the site will not be graded because most of the project area is relatively flat, and the racking systems can be installed to conform to moderate changes in slope.
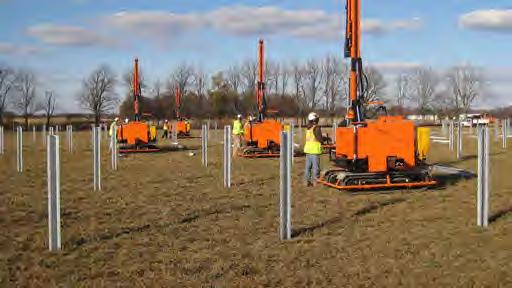
The racking systems that support the solar panels will be installed on steel piles driven directly into the ground about every 10 feet and without the use of concrete.
Topsoil will remain on site and will be moved only for limited grading, installing temporary laydown yards, building internal roads, limited equipment pads (ex. inverters), and the project substation, and trenching buried lines. Disturbed topsoil will be used to establish the vegetative ground cover for the project and will remain in place for cultivation
Projects like Crossroads must submit an enforceable and financially-backed decommissioning plan to the State prior to construction
The plan must ensure that the land can be returned to farming at the end of the useful life of the solar facility.
State law requires that decommissioning be completed and the land restored to its pre-construction condition within 12 months of when the facility ceases to operate.
A performance bond in favor of the State must be posted to guarantee the necessary funds to carry out the plan.
Decommissioning must include the physical removal of all components above and below ground down to a minimum depth of 3-feet to ensure compatibility with future farming activities, with the only possible exceptions being project roads that may be used in the future by the landowner.
RECYCLING DIDYOUKNOW?
Solar panels no longer producing enough energy for optimal commercial power generation can still generate some electricity for decades. For this reason, the solar panels from a decommissioned solar facility may be used for many years in other locations and applications.
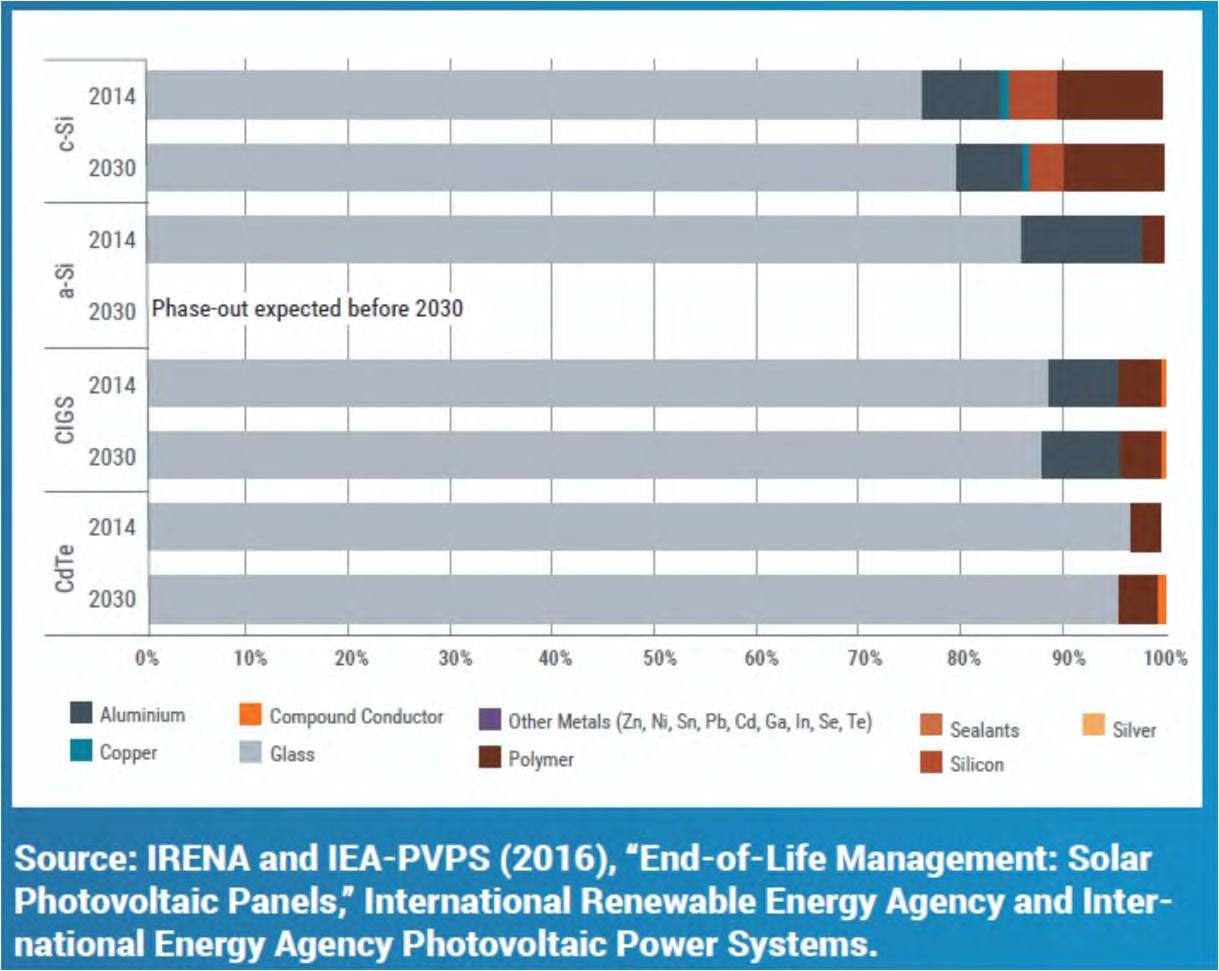
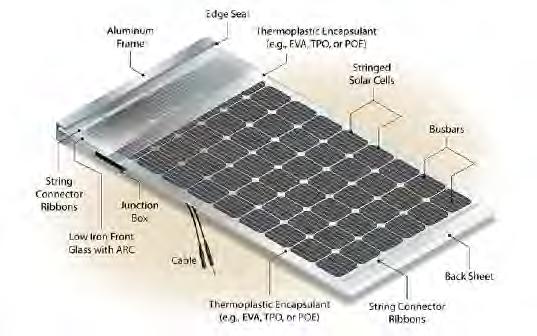
The vast majority of components of solar panels are recyclable. By weight, most solar panels are around 80 percent glass and aluminum which are easy components to recycle at general-purpose recycling centers. Solar panels also contain at least one rare or precious metal which may be recycled at the end of its useful life.
The majority of the other components of solar facilities also can be recycled, like metal racking, framing, copper wire, and other equipment
The largest U.S. solar manufacturer (which is Ohio-based) has recycling processes that recover over 90% of the semi-conducting material and more than 90% of the glass material for re-use. Increasingly, panels can be cost-effectively recycled. The recoverable value of glass, metal, and semi-conductor material from recycling panels is significant. By 2030 it is estimated to be $450 million per year nationwide. Economic analysis provides strong evidence that the scrap value of a solar facility far exceeds the cost to decommission it, making decommissioning a value-add at the system’s end of life in 30-40 years.
A study by the International Renewable Energy Agency estimated that $15 billion worth of raw materials may be recovered by 2050 when the first installed solar panels reach end-of-life.
The Solar Energy Industries Association (SEIA) sponsors a nationwide collection and recycling program that provides pre-screened and preferred pricing with recycling facilities who accept solar panels.
FREQUENTLYASKED QUESTIONS
What happens at the end of the useful life of the solar panels?
After the productive commercial life of the panels, which is 35-40 years, the solar project will be decommissioned and the land can be returned to roughly its current condition.
How can you guarantee that the solar project can be returned to crop farming after its operating life?
First, our solar leases include a contractual obligation to decommission and restore the ground at the end of a project's useful life. Second, the equipment has significant reuse and scrap value in excess of the cost of decommissioning (steel, copper, aluminum, and the panels themselves will have significant value in the future), so there is a strong economic incentive to decommission a facility that is no longer producing enough power. Finally, the State requires decommissioning and an associated performance bond to guarantee funds to carry it out.
What if the owner of a solar project goes bankrupt and abandons the project?
If an owner went bankrupt, it is very likely that a new owner would take over. Solar projects are expensive to build, but reliable and relatively inexpensive to operate. So, there are strong incentives to continue a solar project’s operations. In the event of abandonment, the same decommissioning procedures would be followed and fully financed with the performance bond.
What assurance is there that the owner will carry out the decommissioning?
State law requires that projects like Crossroads submit to the State an enforceable and financially-backed decommissioning plan and performance bond so that the land may be returned to farming at the end of the project’s useful life.
Can solar developers credit a solar project’s substantial salvage value when calculating the decommissioning bond amount?
No, state law does not permit consideration of salvage value in calculating the decommissioning cost of a solar project.
What measures are in place to ensure that land under a solar project can be returned to agricultural use decades from now?
Before construction begins, drain tile is mapped, and during construction it is either avoided, repaired or even improved to the extent that is needed to protect neighbors from drainage problems. Grading is limited due to the flat nature of the site, and topsoil will be preserved onsite. Removal of infrastructure and decompaction of impacted areas following decommissioning enable restoration of the site for agricultural use.
What happens to topsoil during construction, operations, and decommissioning?
During construction, topsoil is kept on site and is moved only for limited grading, installing temporary laydown yards, building internal roads, limited equipment pads (ex. inverters) and the project substation, and trenching buried lines. Disturbed topsoil is used to establish the native vegetative ground cover for the project which will remain in place over the life of the project. After decommissioning, the topsoil remains in place for future cultivation.
N.C. Clean Energy Technology Center, N.C. State University, “Balancing Agricultural Productivity with Ground-Based Solar Photovoltaic (PV) Development” (August 2017), p. 4, available at https://nccleantech.ncsu.edu/wp-content/uploads/2019/10/BalancingAgricultural-Productivity-with-Ground-Based-Solar-Photovoltaic-PVDevelopment-1.pdf.
International Renewable Energy Agency, “End-of-life management: Solar Photovoltaic Panels” (June 2016), available at https://www.irena.org/publications/2016/Jun/End-of-life-management-SolarPhotovoltaic-Panels
“Best Practices at the End of the Photovoltaic System Performance Period" (February 2021), available at https://www.nrel.gov/docs/fy21osti/78678.pdf
“End-of-Life Management for Solar Photovoltaics”, (accessed October 20, 2023) available at https://www.energy.gov/eere/solar/end-life-managementsolar-photovoltaics
Center for Rural Affairs, “Decommissioning Solar Energy Systems Resource Guide” (June 2022), available at https://www.cfra.org/sites/default/files/publications/Decommissioning%20sol ar%20energy%20systems%20WEB.pdf
SOLAR POWER AND GRID RELIABILITY
A diverse power grid is a more reliable power grid. This means that as Ohio adds more renewable energy to a grid that is primarily based on fossil fuels and nuclear power, we will see an increase in grid reliability, even when adding variable sources of power like windandsolar.
Diversity in the geographic location of generators also helps make the grid more stable. The idea is simple: If a power source at one location is not generating electricity at a given time, the odds are thatsourcesatotherlocationswillbe.
Numerous countries already get over 50% of their electricity from windandsolarwithgridreliabilitythatisevenbetterthanintheU.S.
Renewables are often criticized for being “variable,” but their variability is predictable. Fossil fuel resources, in contrast, often have unexpected outages, which pose a greater risk to the grid. Grid operators know when the sun will set — but they do not know when a critical component might break at a gas or coal power plant, or when severe weatheroraglobalcrisiswillsuddenlyimpactfossilfuelsupplies.
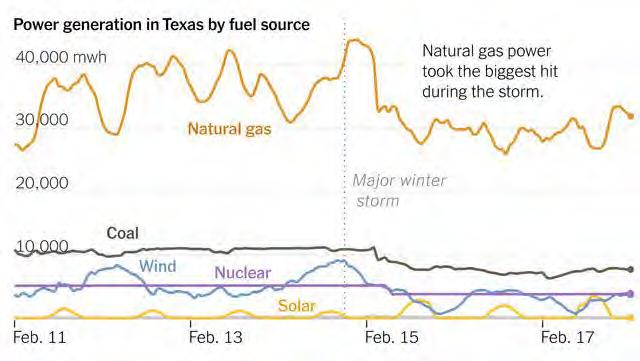
“While Texas had largely succeeded with that integration of wind in previous years with intelligent forecasting, the Texas freeze revealed that assumptions about the reliability of firm baseload power fueled by natural gas were too optimistic.”
Cascading risks: Understanding the 2021 winter blackout in Texas Energy Research & Social Science, V.77 July, 2021
During Winter Storm Uri in 2021 this big sudden drop in natural gas generation was the main driver of a grid collapse that cost Texas billions of dollars and hundreds of lives
MORE SOLAR, LOWER COSTS
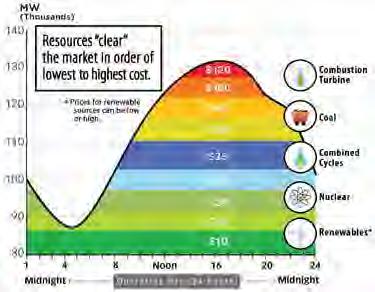
How Solar Power Helps Reduce Consumer Costs
Ohio’s grid operator, PJM, forecasts power demand daily and schedules generators to meet that forecasted electricity demand each day for the following day. Certain power generators (eg. fast-starting gas, oil-fired generators, hydroelectric plants, and increasingly battery storage facilities) that meet electricity demand at peak usage times of the day tend to provide the most expensive power.
PJM accepts offers from the lowest- to highest-priced generator until it meets the forecasted demand for electricity for each hour of every day. As more wind and solar are added to the grid, the $0 fuel cost means that renewables are almost always scheduled in the fuel mix during hours that they are expected to run.
Solar in particular produces power during some of the most expensive hours of the year (ex. on a hot July afternoon) which means that during those hours PJM can avoid the need to schedule a very expensive gas or oil peaking plant, which saves consumers money! (see below figure)
Did you know?
Renewables saved Texans nearly $1 billion per month in 2022 and a total of $28 billion over the last 12 years by offsetting more expensive generation, especially during peak hours.
SOLARPOWERCOSTDECLINES
The cost of producing electricity is largely a function of three factors: the upfront cost of the power plant
1. the ongoing cost of the fuel
3.
2. ongoing operating & maintenance costs
Since the cost of solar continues to steeply decline over time, sunshine is free, and operating and maintenance costs are relatively low, this means that the solar resource (eg. amount of sunlight per average day in kilowatt-hours per square meter (kWh/m2 per day) largely determines the cost of solarpowered electricity.
Ohio’s average solar resource is 4.65 kWh/m2 per day, higher than that of Germany, which gets over 12% of its power from solar and has an average solar resource of less than 4 kWh/m2 per day.
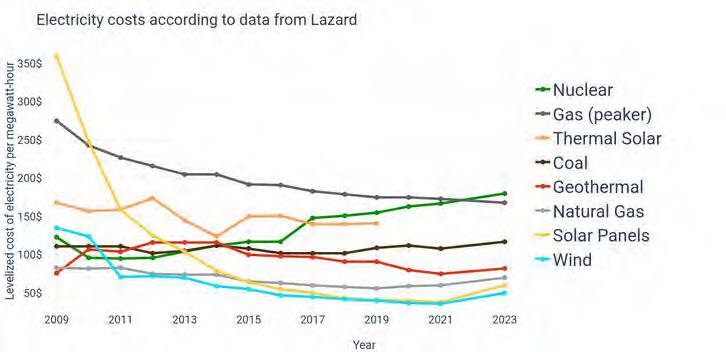
According to financial advisory firm Lazard’s “Levelized Cost of Energy Analysis” in 2023, solar power costs have
declined
more
than
80%
over the last decade, and solar facilities can now produce power cheaper than coal, nuclear, and gas peaker plants and are competitive with many baseload natural gas plants.
OHIOIMPORTSELECTRICITY
The state of Ohio is 4th in the nation for electricity consumptionbut10thinthenationforelectricityproduction. That means that, as a net electricity importer, Ohio’s homes and businesses send money out of state to pay for their electricityconsumption.
Ohio imports over 20% of its power from other states and Canada via the regional grid. That means that increasing electricity production in-state, especially during peak demandhours,offsetselectricitythatisbeingimportedfrom outside of Ohio, boosting our energy independence and helpingkeepmoreofOhio’sdollarsin-state.
HOWPOWERFLOWS
Imagine the electric grid as a giant water reservoir with water being added by a few individual sources and being removed by a great many users via many small pipes. The water being added at any location is most likely to flow first to the closest pipes, but will also mix with the rest of the water in the reservoir. This is true even if a user of water on one side of the reservoir is paying for water to be added on theoppositesideofthereservoir.
Like the reservoir analogy, the power from new solar projects located in Ohio first go to meet demand in the surrounding local grid, even if those projects have power purchase agreements with buyers that are not adjacent to the facility.
FREQUENTLYASKED QUESTIONS
Wasn’t the Texas grid collapse in 2021 caused by freezing wind farms?
According to the Texas grid operator ERCOT, while all generation types including wind farms were impacted by the freeze, the biggest contributor to Texas’s blackouts in 2021 were the combination of natural gas plant failuresandfrozennaturalgasfuelsupplyatthegaswellsandpipelines.
What is the significance of solar panel efficiency? And what is net capacity factor?
Commercial solar panels range between 18% and 23% efficiency, which is a measure of the amount of sunlight that hits a solar panel that is converted to electricity. The more efficient the solar panel, the less space required to produce power. The net capacity factor (NCF) refers to the % of a generator’s rated capacity that actually produces power over a year. Solar farms in Ohio have a ~20% NCF. Gas peakers have NCFs ~10-15% or less. Solar projects in Ohio use between 5 and 7 acres per MW of capacity, which can produce enoughelectricitytopower~120Ohiohomes.
Will this project increase my electricity costs?
Solar produces power at peak demand hours, which means that the grid can avoid the need to use much more expensive peaking resources during those hours, which saves utilities (and consumers) a lot of money. Estimates in Texas show that solar and wind saved Texas consumers ~$1 billion per month in2022!
Do I have to pay for upgrades made by the utility on account of this project?
No. Ohio is part of the PJM grid, and in PJM new projects entering the system pay for any upgrades required to connect to the grid. The high cost of upgrading the grid is a key reason why many projects that enter the PJM queuenevercomeonline.
Doesn't it take more energy to manufacture, install, and operate a solar facility than it ever produces?
No. The ratio of the net energy produced by any resource vs. the total energy it consumes is called the Energy Return on Investment (EROI). The EROI for solar PV is between 8 and 34 depending on the location and technology, which means that solar PV generators produce many times more energy thanittakestomanufacture,install,andoperateasolarfacility.
Isn’t solar only competitive because of government subsidies?
Allourenergysourcesaresubsidized,includingsolar. Solarprojectsreceivea 30% up-front federal tax credit. In contrast, coal, gas, and nuclear, which have been subsidized for many more decades than solar, continue to receive a wide range of both up-front and annual subsidies at virtually every level of government, in addition to imposing pollution costs on society that shows up as a tax on all of our pocketbooks (eg. on our health care bills). In fact, unsubsidized solar today is competitive or cheaper than unsubsidized coal, gas,andnuclear!
Three Myths About Renewable Energy and the Grid, Debunked: https://e360.yale.edu/features/three-myths-about-renewable-energyand-the-grid-debunked
The Solution to Grid Reliability? Go Bigger and Bolder on Renewables and Energy Storage: https://rmi.org/the-solution-to-grid-reliability-gobigger-and-bolder-on-renewables-and-energy-storage/
Texas winter 2021 near-collapse of the electric grid was largely a fossil fuel problem, not a renewable problem. Solar actually outperformed expectations while the natural gas system froze. https://www.youtube.com/watch?v=46PxZ6KyAXo
What Really Happened During the Texas Power Grid Outage? https://www.youtube.com/watch?v=08mwXICY4JM
Lazard Levelized Cost of Energy (v.16.0) https://www.lazard.com/media/2ozoovyg/lazards-lcoeplus-april2023.pdf
Corn Ethanol vs. Solar Land Use Comparison - Clean Wisconsin https://www.cleanwisconsin.org/wp-content/uploads/2023/01/CornEthanol-Vs.-Solar-Analysis-V3-9-compressed.pdf
What’s in a megawatt? https://www.seia.org/initiatives/whatsmegawatt
The Impact of Renewables in ERCOT, https://www.ideasmiths.net/wpcontent/uploads/2022/10/IdeaSmiths_CFT_ERCOT_RE_FINAL.pdf
Energy Return on Energy Invested (ERoEI) for photovoltaic solar systems in regions of moderate insolation: A comprehensive response, https://www.nrel.gov/docs/fy17osti/67901.pdf
Solarpanelsaremadealmostentirelyoftempered,shatter-resistant glass,metal,plasticsandasemi-conductingmaterialthatisthinner than a sheet of paper and fully encapsulated to keep out air and moisture.Theycontainnoliquidsthatcanspill.
DID YOU KNOW?
AccordingtotheOhioDepartmentof Health, there is no public health impactfromsolarpanelsusedinsolar facilities: solar panel design "ensures that the cells and solder are completely encapsulated and protected from rain and other elements that might corrode or damage them, and also means that the general public would not come into contact with any potential toxic elements contained in the panel unless...purposefullygroundintoafine dust.“
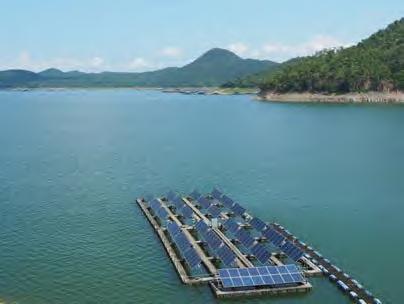
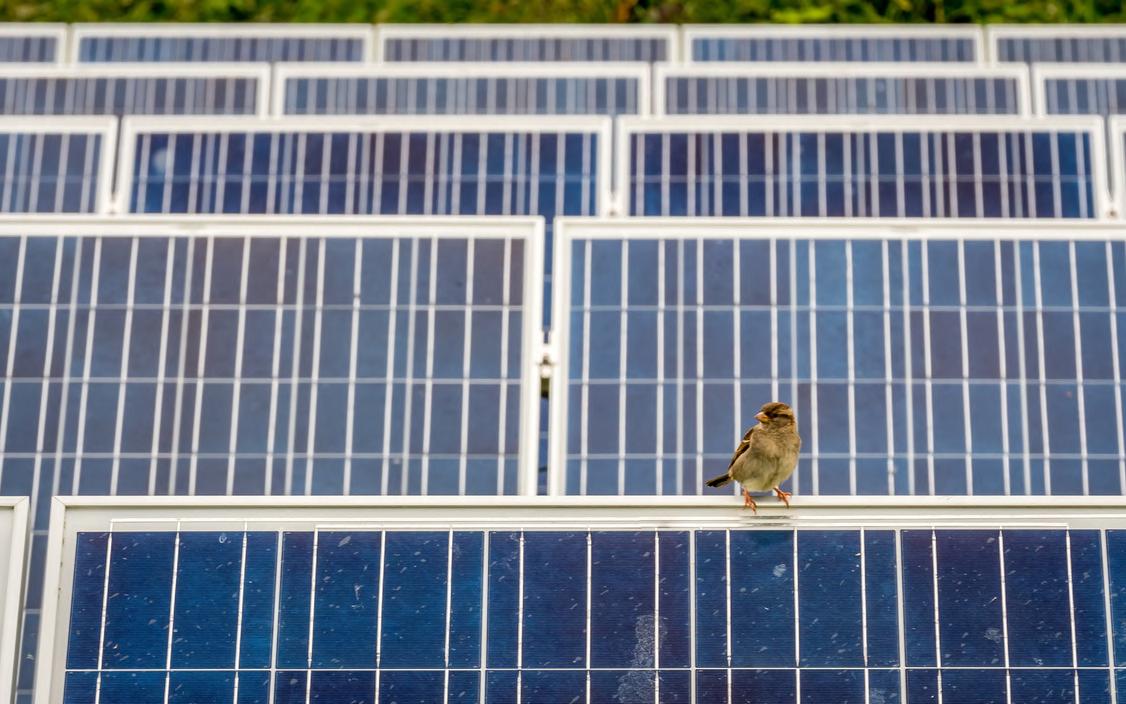
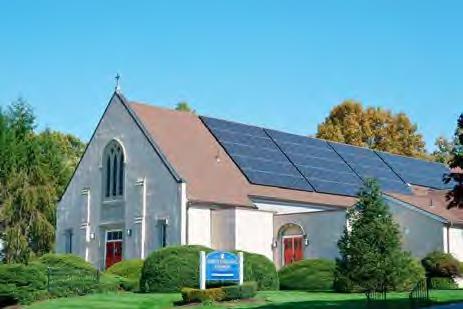
Solarpanelsaresosafethattheyare installed nationwide on millions of homes, schools, hospitals, barns, farms, churches, and businesses. There are even floating solar projects that are installed on drinking water reservoirs!
Del-Co Water, a prominent central Ohio water utility, is constructing a floating solar installation on its water supply reservoir in Delaware, Ohio.
Solar panels are made mostly of recyclable materials such as aluminum and glass, and even the semi-conducting material in them is recyclable. Additionally, solar panels no longer producing enough energy for optimal commercial power generation can still generate electricity for decades and may be used for years in other locations and applications.
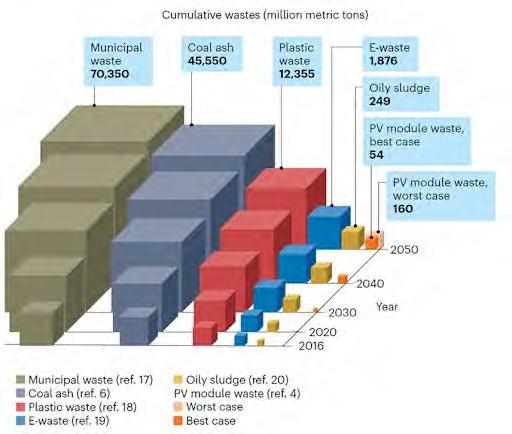
If and when solar panels ultimately become a waste product, it is important to understand the nature of future solar waste in context:
Globally, we produce and manage approximately the same mass of coal ash per month as the amount of solar module waste we expect to produce over the next 35 years. Compared another way, globally we will generate up to 440-1,300 times more mass of municipal waste than solar module waste by 2050.
By transitioning away from fossil fuels, a substantial reduction in waste mass and toxicity is possible
Source: “Unfounded concerns about photovoltaic module toxicity and waste are slowing decarbonization” (October 2023), Journal Nature
FREQUENTLYASKED QUESTIONS
What happens when a solar farm is damaged by hail?
Solar panels are encased in shatter-resistant glass and are rated to withstand golf-ballsized hail without breaking. Solar cells also are encapsulated between two layers of tough plastic to keep out air and moisture. This is the same material that has been used for decades to give car windshields their great strength and stability. Just like car windshields may crack but remain intact, solar panels generally remain intact despite powerful impacts. A solar panel damaged by hail or other flying objects generally will not shatter into small pieces of debris, but will remain in one piece. Any damaged solar panelswillberemoved,properlyrecycled,reconditioned,orappropriatelylandfilled.
What if a solar project is struck by a tornado?
Although solar farms are designed to withstand high winds, few structures can withstandadirecthitbyatornado.In2015,atornadostruckasolarfarmonpubliclandin California, damaging tens of thousands of solar panels. Over 85% of the damaged solar panels were successfully recycled, however, and sampling of soil and panel pieces from theeventshowednoindicationofsoilcontamination.
Don’t solar panels contain lead?
Some solar panels use an extremely small amount of lead as a solder, but because solar panels are encapsulated, waterproof and suspended in the air, the lead does not make contactwiththeground. Incontrast,asingleshotgunshellhastwicetheamountoflead asatypicalsolarpanel.
What is the EPA’s Toxic Characteristic Leaching Procedure (TCLP)?
The federal Environmental Protection Agency (EPA)’s TCLP test, is used to indicate whether waste products have the potential to leach any chemicals when subjected to the intense pressures of landfill disposal. For solar panels, such leach tests create conditions that are much more extreme than solar facility operating conditions and typically involve chopping up solar panels into tiny pieces, submerging them in an acidic solvent, then agitating the solvent for some period of time to see if any toxins leach out. Solar panels routinely pass the test and show no risk of leaching. Actual field conditions thatinvolveabrokensolarpanelandrainfallarefarlesslikelythantherigorousTCLPtest toresultinanyleaching.
Will Crossroads Solar utilize solar panels that pass TCLP?
Yes. Crossroads will use solar panels that are, for disposal purposes, classified as nonhazardous waste under applicable U.S. EPA tests (such as TCLP). This commitment meansthatthesolarpanels,ifnotrecycled,aresafeenoughintheeyesoftheU.S.EPAto bedisposedofinaregularlandfillalongwithhouseholdgarbage.
How long do solar panels last? How long are their warranties?
The long-term durability and performance demonstrated over decades of solar panel deployment worldwide as well as the results of accelerated lifetime testing has helped lead to an industry standard 25-year power production warranty for solar panels. However,solarpanelscanlastfordecadeslongerthanthat,andsomeoftheearliestsolar panelscommerciallymanufacturedover50yearsagoarestillinoperationtoday.
RESOURCES
“Solar Farm Photovoltaics Summary and Assessments” (April 2022), Ohio Department of Health, available at https://odh.ohio.gov/know-ourprograms/health-assessment-section/media/summary-solarfarms.
North Carolina State University, “Health and Safety Impacts of Solar Photovoltaics” (May 2017), available at: https://content.ces.ncsu.edu/health-andsafety-impacts-of-solar-photovoltaics
“Unfounded concerns about photovoltaic module toxicity and waste are slowing decarbonization” (October 2023), available at: https://www.nature.com/articles/s41567-023-02230-0
P. Sinha and A. Wade, “Assessment of Leaching Tests for Evaluating Potential Environmental Impacts of PV Module Field Breakage,” IEEE Journal of Photovoltaics, vol. 5, pp. 1710–1714, Nov 2015, Table I, available at: https://ieeexplore.ieee.org/document/7356394
“Heavy Metals and Pesticides Toxicity in Agricultural Soil and Plants: Ecological Risks and Human Health Implications“ (March 2021), available at: https://www.ncbi.nlm.nih.gov/pmc/articles/PMC7996329/
“One-of-a-kind solar project underway in Delaware County” https://www.nbc4i.com/news/local-news/delaware-county/one-of-a-kind-solarproject-underway-in-delaware-county/
See https://youtu.be/4T6VbzC889k and https://youtu.be/hR0dHl58zwE for videos that demonstrate solar panels’ ability to withstand impacts without shattering.
“Solar Panel Recycling Market to Achieve Exponential Growth” https://www.greentechlead.com/solar/solar-panel-recycling-market-toachieve-exponential-growth-coherentmi-report-45244#google_vignette
SOLAR PROJECTS ARE QUIET
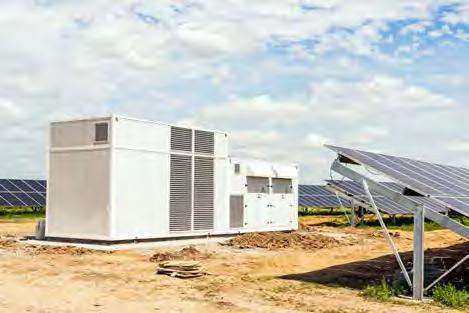
Once constructed, solar facilities are extremely quiet, with few moving parts and maintenance traffic comparable to farming activity. Solar facilities do not generate electricity at night, when it is most important to nearby households. Most solar project noise comes from the project substation, the inverters, and the small electric “tracker” motors that slowlyrotatethepanelsthroughouttheday.
Theprojectsubstationissitedatasinglepointandsetbacktoavoidnoise impacts, and the trackers generally cannot be heard outside the fence. Inverters, which manage the electricity produced by the solar panels, are centrally located within the fence so that any significant noise dissipates beforeitaffectsneighbors.
Unlike some utility-scale solar projects operating today, Crossroads will be designed to further reduce any inverter noise impact by locating inverters no closer than 500 feet from neighboring homes. Because sound dissipates rapidly with distance from the source of the sound, this large setback addresses most concerns. Planted vegetative buffers will further minimizenoise.
INVERTER NOISE
Crossroadsistakingspecificstepsto ensure that inverter noise does not impactneighboringresidences.
Crossroads will retain an acoustic engineer to conduct a Noise Impact Assessment, comparing expected noise from project equipment to existing sound levels to ensure minimal impacts for nearby residences. The assessment will be publicly available and part of the project'spermitapplication."
If an inverter is found to produce more noise than allowed, Crossroads will mitigate the noise with retrofits suchasnoisedampenersoracoustic barriers.
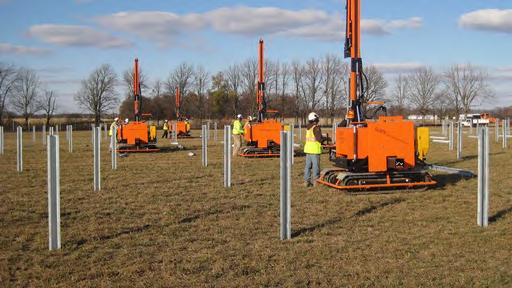
SOLAR CONSTRUCTION NOISE
Like any large construction project, constructionofasolarprojectwillcreate somenoise.Noisewillbelessthanmany construction jobs and noise at any particular location will be limited because the site is large, construction activitieswillnotbeconcentratedinone areaforlong,andconstructionhoursare limited by the State. Small pile drivers usedtodrivethepilesforthepanelsinto place will create a rapid and repeating “pinging” noise over a few months, but such noise near any particular location acrossthesitewouldlastonlyafewdays.
FREQUENTLYASKED QUESTIONS
I have seen videos of solar projects with loud inverters. How is Crossroads different? Some operating solar projects were not designed with large inverter setbacks and did not plant robust vegetative screening buffers that can help muffle noise. Crossroads is not only committed to a minimum 500-foot setbacks from inverters to homes, but is also committing to measurable noise mitigation in the event an inverter creates more noise than expected. Finally, the sound from inverter videos may not be a reliable indicator of the actual sound and are subject to manipulation.
Do solar projects make noise at night that a neighbor could hear?
No. Solar projects only produce electricity during the daytime. Inverters are loudest on hot sunny days when they are processing the most electricity and their cooling fans run. They are virtually silent at night.
How long does project construction last? What is the noisiest part of the process?
Solar project construction typically lasts 12-18 months. The noisiest part is when small pile drivers install the vertical steel piles into the ground, which creates a “pinging” noise over a few months. Also, pile driving only occurs in a particular area over a very short period of time.
Is there a lot of traffic noise during project operations?
No. One reason why solar projects make quiet neighbors is the limited need for operations and maintenance presence. The primary maintenance activity on a solar site is landscape maintenance and grass mowing, which is relatively infrequent in any one location and likely will involve less traffic noise to active farming. Crossroads also plans to use sheep for maintaining some of its grass ground cover, which will further reduce noise vs. active mowing or crop harvesting.
StudybyN.C.StateUniversity
Guidance on Post - Construction Stormw ater Management for Solar Panel Fields
Large arrays of ground-mounted, elevated solar or photovoltaic (PV) panels are often install ed with vegetated pervious ground around, between, and under them. In this case, i mpervious surface disconnection may be an effective approach to managing post-construction stormwater runoff shed from the PV panels . This fact sheet describes how those pervious areas can be used to manage the water quality volume (WQv) required in the Ohio EPA NPDES construction stormwater general permit as impervious surface disconnection. Refer to Chapter 2.1 of Ohio EPA’s Rainwater and Land Development manual 1 for detailed design guidance on this practice
Runoff reduction volume credits in Rainwater and Land Development Chapter 2.11 define the disconnection length (L) as illustrated in Figure 1 necessary to manage the WQv generated by the PV panel row. To simplify the credit calculation, Table 1 expresses L as a factor of the horizontal coverage of the PV panel (WPanel) and a corresponding ratio of WPanel to the open gap between the panel rows (WGap) Table 1 applies to disconnection areas meeting the conditions that follow Note the mean daily position determines the WPanel of tracking PV panels.
Table 1: s implified impervious s urface disconnection to manage the WQv.
Conditions Required to Use Impervious Surface Disconnection
The following conditions are required to manage the WQv generated by PV panels solely by impervious surface disconnection.
1. Establish a cover of dense, deep- rooting v egetation.
Vegetation plays two key roles in stormwater management – it protects soil from surface erosion and its root action develops a soil structure that promotes water storage, uptake, and infiltration. Unless alternative agricultural us es are planned, a vegetation plan must, at a minimum, specify 1) a seed mix of deep-rooting forbs and grasses (non-turf type) appropriate for the regional climate and site conditions, 2) dates and procedures for seeding and seed bed preparation, 3) temporary stabilization measures, and 4) a maintenance plan where activities that may cause soil compaction will be infrequent.
The plan should address the short-term establishment period (first two years). Certain plants may take considerable time to fully establish, leaving a finished or near-finished site exposed to erosion and the proliferation of weeds, both of which may be difficult to subsequently fix. Include rapidly establishing species in the permanent seed mix or supplement a temporary (annual) cover that will not interfere with the long-term vegetation plan. If feasible, consider seeding prior to installation as a measure to help control erosion during construction and expedite a permanent cover.
W Panel
W Gap
Disconnection Length (L)
Runoff Flow Path
Guidance on Post-Construction Stormwater Management for Solar Panel Fields
The plan must specify deep-rooting grasses and forbs compatible with the PV panel height. Ohio EPA recommends selecting from the species listed in Appendix A of the Ohio Department of Natural Resources’ Recommended Requirements for Proposed Solar Energy Facilities in Ohio available at: ohiodnr.gov/static/documents/real- estate/ODNR Recommended Requirements for Proposed Solar Energy Facilities in Ohio.pdf
2. Ensure post- construction soils are in good hydrologic condition.
Impervious surface disconnection spreads runoff over pervious area in good hydrologic condition to promote infiltration. Soil in good hydrologic condition has not been compacted and/or stripped of topsoil through grading, excavation, and the operation of equipment. The Stormwater Pollution Prevention Plan (SWP3) must specify measures to minimize severe soil degradation so that proper establishment of deep-rooted plants can be relied on to continuously restore soil structure and add organic matter through vigorous root action Limit grading to localized areas and require topsoil removal and replacement at them Where feasible, direct construction traffic to stabilized access roads.
The clay soils prevalent in Ohio are prone to rutting and compaction by equipment operated in wet conditions . This destroy s soil structure which can be difficult to repair. If work on very wet soils cannot be restricted, limit the equipment axel load to 6 tons (Duiker, 2004) and/or specify decompaction measures in the SWP3. A field cultivator or other implement is recommended to loosen compacted soils while smoothing soil for seedbed preparation and weed control.
3. Establish non- erosive flow over the disconnection length.
Runoff from PV panels must fall and disperse without producing accelerated erosion or concentrated flow. A stone spl ash pad or similar measure may be placed under a static drip edge to protect the dissipate energy and spread flow. Additional level spreaders and energy dissipaters are recommended on average slopes greater than five percent (Maryland, 2013).
Limitations on Impervious Surface Disconnection
Impervious surface disconnection cannot be used to manage the WQv for PV panels installed over gravel or other hard surfaces , where structural support (piling) will disrupt sheet flow, or where stormwater is to be collected in swales, ditches, or storm sewers. Standard post-construction stormwater management practices listed in permit tables 4a and 4b and detailed in Chapter 2 of the Rainwater and Land Development manual are more appropriate in these instances
Impervious Surface Disconnection in the Stormwater Pollution Prevention Plan
Include typical section drawings (similar to Figure 1) in the Stormwater Pollution Prevention Plan (SWP3) to demonstrate compliance. The SWP3 must also address the post-construction stormwater management of associated roads (paved or gravel) and buildings. Standard post-construction stormwater management practices are recommended for large substations. Ensure the SWP3 complies with all conditions of the general permit.
1. Available at: epa.ohio.gov/divisions-and-offices/surface-water/guides -manuals/rainwater-and-land-development
References
Cook, L. and R. McCuen. 2013. Hyd rologic Response of Solar Farms. J. Hydrologic Engineering. 18(5):536-54. American Society of Civil Engineers. Reston, VA.
Duiker, S. 2004. Avoiding Soil Compaction. Pennsylvania State University.
Maryland Department of the Environment. 2013. Stormwater Design Guidance – Solar Panel Installation
North Carolina Department of Environmental Quality. 2018. Stormwater Design Manual, E- 6 Solar Farms
Ohio Environmental Protection Agency . 2018. General Permit Authorization for Storm Water Discharges Associated with Construction Activity under the National Pollutant Discharge Elimination System . Ohio EPA Permit Number OHC000005. April 23, 2018
Pennsylvania Department of Environmental Protection, Bureau of Clean Water. 2019. Chapter 102 Permitting for Solar Panel Farms, Frequently Asked Questions January 2, 2019.
Contact
For more information, contact: Wesley Sluga at wesley.sluga@epa.ohio.gov or (614) 644-2141 or Justin Reinhart at justin.reinhart @epa.ohio.gov or (614) 705-1149.
Health and Safety Impacts of Solar Photovoltaics
The increasing presence of utility-scale solar photovoltaic (PV) systems (sometimes referred to as solar farms) is a rather new development in North Carolina’s landscape. Due to the new and unknown nature of this technology, it is natural for communities near such developments to be concerned about health and safety impacts. Unfortunately, the quick emergence of utility-scale solar has cultivated fertile grounds for myths and half-truths about the health impacts of this technology, which can lead to unnecessary fear and conflict.
Photovoltaic (PV) technologies and solar inverters are not known to pose any significant health dangers to their neighbors. The most important dangers posed are increased highway traffic during the relative short construction period and dangers posed to trespassers of contact with high voltage equipment. This latter risk is mitigated by signage and the security measures that industry uses to deter trespassing. As will be discussed in more detail below, risks of site contamination are much less than for most other industrial uses because PV technologies employ few toxic chemicals and those used are used in very small quantities. Due to the reduction in the pollution from fossil-fuel-fired electric generators, the overall impact of solar development on human health is overwhelmingly positive This pollution reduction results from a partial replacement of fossil-fuel fired generation by emission-free PV-generated electricity, which reduces harmful sulfur dioxide (SO2), nitrogen oxides (NOx), and fine particulate matter (PM2.5) Analysis from the National Renewable Energy Laboratory and the Lawrence Berkeley National Laboratory, both affiliates of the U.S. Department of Energy, estimates the health-related air quality benefits to the southeast region from solar PV generators to be worth 8.0 ¢ per kilowatt-hour of solar generation. 1 This is in addition to the value of the electricity and suggests that the air quality benefits of solar are worth more than the electricity itself
Even though we have only recently seen large-scale installation of PV technologies, the technology and its potential impacts have been studied since the 1950s. A combination of this solar-specific research and general scientific research has led to the scientific community having a good understanding of the science behind potential health and safety impacts of solar energy. This paper utilizes the latest scientific literature and knowledge of solar practices in N.C. to address the health and safety risks associated with solar PV technology. These risks are extremely small, far less than those associated with common activities such as driving a car, and vastly outweighed by health benefits of the generation of clean electricity.
This paper addresses the potential health and safety impacts of solar PV development in North Carolina, organized into the following four categories:
(1) Hazardous Materials
(2) Electromagnetic Fields (EMF)
(3) Electric Shock and Arc Flash
(4) Fire Safety
1. Hazardous Materials
One of the more common concerns towards solar is that the panels (referred to as “modules” in the solar industry) consist of toxic materials that endanger public health. However, as shown in this section, solar energy systems may contain small amounts of toxic materials, but these materials do not endanger public health. To understand potential toxic hazards coming from a solar project, one must understand system installation, materials used, the panel end-of-life protocols, and system operation. This section will examine these aspects of a solar farm and the potential for toxicity impacts in the following subsections:
(1.2) Project Installation/Construction (1.2) System Components
1.2.1 Solar Panels: Construction and Durability
1.2.2 Photovoltaic technologies
(a) Crystalline Silicon
(b) Cadmium Telluride (CdTe)
(c) CIS/CIGS
1.2.3 Panel End of Life Management
1.2.4 Non-panel System Components (1.3) Operations and Maintenance
1.1 Project Installation/Construction
The s ystem installation, or construction, process does not require toxic chemicals or processes. The site is mechanically cleared of large vegetation, fences are constructed, and the land is surveyed to layout exact installation locations. Trenches for underground wiring are dug and support posts are driven into the ground. The solar panels are bolted to steel and aluminum support structures and wired together Inverter pads are installed, and an inverter and transformer are installed on each pad. Once everything is connected, the system is tested, and only then turned on.
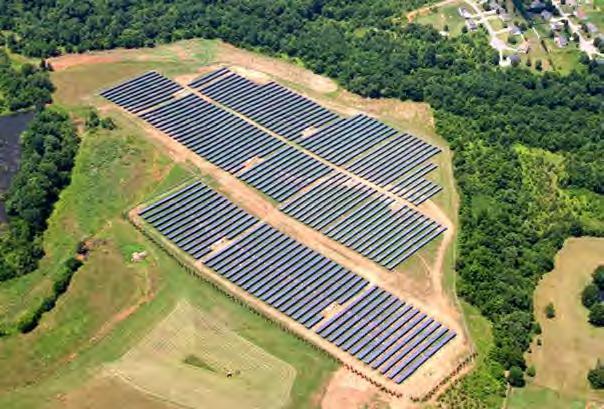
Figure 1: Utility-scale solar facility (5 MWAC) located in Catawba County. Source: Strata Solar
1.2 System Components
1.2.1 Solar Panels: Construction and Durability
Solar PV panels typically consist of glass, polymer, aluminum, copper, and semiconductor materials that can be recovered and recycled at the end of their useful life. 2 Today there are two PV technologies used in PV panels at utility-scale solar facilities, silicon, and thin film. As of 2016, all thin film used in North Carolina solar facilities are cadmium telluride (CdTe) panels from the US manufacturer First Solar, but there are other thin film PV panels available on the market, such as Solar Frontier’s CIGS panels. Crystalline silicon technology consists of silicon wafers which are made into cells and assembled into panels, thin film technologies consist of thin layers of semiconductor material deposited onto glass, polymer or metal substrates. While there are differences in the components and manufacturing processes of these two types of solar technologies, many aspects of their PV panel construction are very similar. Specifics about each type of PV chemistry as it relates to toxicity are covered in subsections a, b, and c in section 1.2.2; on crystalline silicon, cadmium telluride, and CIS/CIGS respectively. The rest of this section applies equally to both silicon and thin film panels.
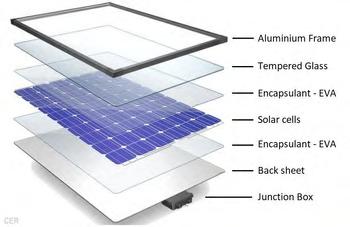
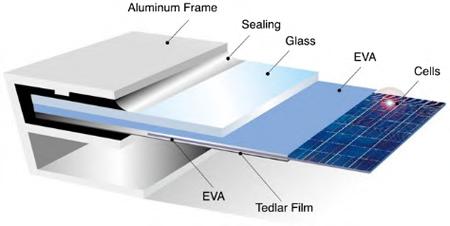
Figure 2: Components of crystalline silicon panels. The vast majority of silicon panels consist of a glass sheet on the topside with an aluminum frame providing structural support Image Source: www.riteksolar.com.tw
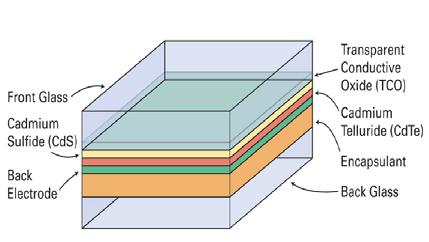
Figure 3: Layers of a common frameless thin-film panel (CdTe). Many thin film panels are frameless, including the most common thin-film panels, First Solar’s CdTe. Frameless panels have protective glass on both the front and back of the panel. Layer thicknesses not to scale. Image Source: www.homepower.com
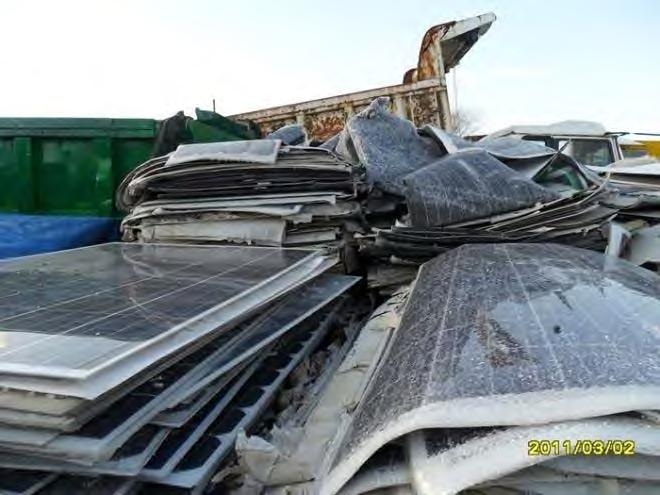
To provide decades of corrosion-free operation, PV cells in PV panels are encapsulated from air and moisture between two layers of plastic. The encapsulation layers are protected on the top with a layer of tempered glass and on the backside with a polymer sheet Frameless modules include a protective layer of glass on the rear of the panel, which may also be tempered. The plastic ethylene-vinyl acetate (EVA) commonly provides the cell encapsulation. For decades, this same material has been used between layers of tempered glass to give car windshields and hurricane windows their great strength. In the same way that a car windshield cracks but stays intact, the EVA layers in PV panels keep broken panels intact (see Figure 4). Thus, a damaged module does not generally create small pieces of debris; instead, it largely remains together as one piece.
Figure 4: The mangled PV panels in this picture illustrate the nature of broken solar panels; the glass cracks but the panel is still in one piece. Image Source: http://img.alibaba.com/photo/115259576/broken_solar_panel.jpg
PV panels constructed with the same basic components as modern panels have been installed across the globe for well over thirty years. 3 The long-term durability and performance demonstrated over these decades, as well as the results of accelerated lifetime testing, helped lead to an industrystandard 25- year power production warranty for PV panels. These power warranties warrant a PV panel to produce at least 80% of their original nameplate production after 25 years of use. A recent SolarCity and DNV GL study reported that today’s quality PV panels should be expected to reliably and efficiently produce power for thirty-five years. 4
Local building codes require all structures, including ground mounted solar arrays, to be engineered to withstand anticipated wind speeds, as defined by the local wind speed requirements. Many racking products are available in versions engineered for wind speeds of up to 150 miles per hour, which is significantly higher than the wind speed requirement anywhere in North Carolina. The strength of PV mounting structures were demonstrated during Hurricane Sandy in 2012 and again during Hurricane Matthew in 2016. During Hurricane Sandy, the many large-scale solar facilities in New Jersey and New York at that time suffered only minor damage. 5 In the fall of 2016, the US and Caribbean experienced destructive winds and torrential rains from Hurricane Matthew, yet one leading solar tracker manufacturer reported that their numerous systems in the impacted area received zero damage from wind or flooding. 6
In the event of a catastrophic event capable of damaging solar equipment, such as a tornado, the system will almost certainly have property insurance that will cover the cost to cleanup and repair the project. It is in the best interest of the system owner to protect their investment against such risks. It is also in their interest to get the project repaired and producing full power as soon as possible. Therefore, the investment in adequate insurance is a wise business practice for the system owner For the same
reasons, adequate insurance coverage is also generally a requirement of the bank or firm providing financing for the project.
1.2.2 Photovoltaic (PV) Technologies
a. Crystalline Silicon
This subsection explores the toxicity of silicon-based PV panels and concludes that they do not pose a material risk of toxicity to public health and safety. Modern crystalline silicon PV panels, which account for over 90% of solar PV panels installed today, are, more or less, a commodity product. The overwhelming majority of panels installed in North Carolina are crystalline silicon panels that are informally classified as Tier I panels. Tier I panels are from well-respected manufacturers that have a good chance of being able to honor warranty claims. Tier I panels are understood to be of high quality, with predictable performance, durability, and content. Well over 80% (by weight) of the content of a PV panel is the tempered glass front and the aluminum frame, both of which are common building materials. Most of the remaining portion are common plastics, including polyethylene terephthalate in the backsheet, EVA encapsulation of the PV cells, polyphenyl ether in the junction box, and polyethylene insulation on the wire leads. The active, working components of the system are the silicon photovoltaic cells, the small electrical leads connecting them together, and to the wires coming out of the back of the panel. The electricity generating and conducting components makeup less than 5% of the weight of most panels. The PV cell itself is nearly 100% silicon, and silicon is the second most common element in the Earth's crust. The silicon for PV cells is obtained by high-temperature processing of quartz sand (SiO2) that removes its oxygen molecules. The refined silicon is converted to a PV cell by adding extremely small amounts of boron and phosphorus, both of which are common and of very low toxicity
The other minor components of the PV cell are also generally benign; however, some contain lead, which is a human toxicant that is particularly harmful to young children. The minor components include an extremely thin antireflective coating (silicon nitride or titanium dioxide), a thin layer of aluminum on the rear, and thin strips of silver alloy that are screen-printed on the front and rear of cell. 7 In order for the front and rear electrodes to make effective electrical contact with the proper layer of the PV cell, other materials (called glass frit) are mixed with the silver alloy and then heated to etch the metals into the cell. This glass frit historically contains a small amount of lead (Pb) in the form of lead oxide. The 60 or 72 PV cells in a PV panel are connected by soldering thin solder-covered copper tabs from the back of one cell to the front of the next cell. Traditionally a tin-based solder containing some lead (Pb) is used, but some manufacturers have switched to lead-free solder. The glass frit and/or the solder may contain trace amounts of other metals, potentially including some with human toxicity such as cadmium However, testing to simulate the potential for leaching from broken panels, which is discussed in more detail below, did not find a potential toxicity threat from these trace elements. Therefore, the tiny amount of lead in the grass frit and the solder is the only part of silicon PV panels with a potential to create a negative health impact. However, as described below, the very limited amount of lead involved and its strong physical and chemical attachment to other components of the PV panel means that even in worst-case scenarios the health hazard it poses is insignificant.
As with many electronic industries, the solder in silicon PV panels has historically been a leadbased solder, often 36% lead, due to the superior properties of such solder. However, recent advances in lead-free solders have spurred a trend among PV panel manufacturers to reduce or remove the lead in their panels. According to the 2015 Solar Scorecard from the Silicon Valley Toxics Coalition, a group that tracks environmental responsibility of photovoltaic panel manufacturers, fourteen companies (increased from twelve companies in 2014) manufacture PV panels certified to meet the European Restriction of
Hazardous Substances (RoHS) standard. This means that the amount of cadmium and lead in the panels they manufacture fall below the RoHS thresholds, which are set by the European Union and serve as the world’s de facto standard for hazardous substances in manufactured goods 8 The Restriction of Hazardous Substances (RoHS) standard requires that the maximum concentration found in any homogenous material in a produce is less than 0.01% cadmium and less than 0.10% lead, therefore, any solder can be no more than 0.10% lead. 9
While some manufacturers are producing PV panels that meet the RoHS standard, there is no requirement that they do so because the RoHS Directive explicitly states that the directive does not apply to photovoltaic panels 10 The justification for this is provided in item 17 of the current RoHS Directive: “The development of renewable forms of energy is one of the Union’s key objectives, and the contribution made by renewable energy sources to environmental and climate objectives is crucial. Directive 2009/28/EC of the European Parliament and of the Council of 23 April 2009 on the promotion of the use of energy from renewable sources (4) recalls that there should be coherence between those objectives and other Union environmental legislation. Consequently, this Directive should not prevent the development of renewable energy technologies that have no negative impact on health and the environment and that are sustainable and economically viable.”
The use of lead is common in our modern economy. However, only about 0.5% of the annual lead consumption in the U.S. is for electronic solder for all uses; PV solder makes up only a tiny portion of this 0.5%. Close to 90% of lead consumption in the US is in batteries, which do not encapsulate the pounds of lead contained in each typical automotive battery. This puts the lead in batteries at great risk of leaching into the environment. Estimates for the lead in a single PV panel with lead-based solder range from 1.6 to 24 grams of lead, with 13g (less than half of an ounce) per panel seen most often in the literature 11 At 13 g/panel 12 , each panel contains one-half of the lead in a typical 12-gauge shotgun shell. This amount equates to roughly 1/750th of the lead in a single car battery. In a panel, it is all durably encapsulated from air or water for the full life of the panel. 14
As indicated by their 20 to 30-year power warranty, PV modules are designed for a long service life, generally over 25 years. For a panel to comply with its 25- year power warranty, its internal components, including lead, must be sealed from any moisture. Otherwise, they would corrode and the panel’s output would fall below power warranty levels. Thus, the lead in operating PV modules is not at risk of release to the environment during their service lifetime. In extreme experiments, researchers have shown that lead can leach from crushed or pulverized panels. 15, 16 However, more real-world tests designed to represent typical trash compaction that are used to classify waste as hazardous or nonhazardous show no danger from leaching. 17, 18 For more information about PV panel end-of-life, see the Panel Disposal section.
As illustrated throughout this section, silicon-based PV panels do not pose a material threat to public health and safety. The only aspect of the panels with potential toxicity concerns is the very small amount of lead in some panels. However, any lead in a panel is well sealed from environmental exposure for the operating lifetime of the solar panel and thus not at risk of release into the environment.
b. Cadmium Telluride (CdTe) PV Panels
This subsection examines the components of a cadmium telluride (CdTe) PV panel. Research demonstrates that they pose negligible toxicity risk to public health and safety while significantly reducing the public’s exposure to cadmium by reducing coal emissions As of mid-2016, a few hundred MWs of
cadmium telluride (CdTe) panels, all manufactured by the U.S. company First Solar, have been installed in North Carolina.
Questions about the potential health and environmental impacts from the use of this PV technology are related to the concern that these panels contain cadmium, a toxic heavy metal. However, scientific studies have shown that cadmium telluride differs from cadmium due to its high chemical and thermal stability. 19 Research has shown that the tiny amount of cadmium in these panels does not pose a health or safety risk. 20 Further, there are very compelling reasons to welcome its adoption due to reductions in unhealthy pollution associated with burning coal. Every GWh of electricity generated by burning coal produces about 4 grams of cadmium air emissions. 21 Even though North Carolina produces a significant fraction of our electricity from coal, electricity from solar offsets much more natural gas than coal due to natural gas plants being able to adjust their rate of production more easily and quickly. If solar electricity offsets 90% natural gas and 10% coal, each 5-megawatt (5 MWAC, which is generally 7 MWDC) CdTe solar facility in North Carolina keeps about 157 grams, or about a third of a pound, of cadmium out of our environment. 22, 23
Cadmium is toxic, but all the approximately 7 grams of cadmium in one CdTe panel is in the form of a chemical compound cadmium telluride, 24 which has 1/100th the toxicity of free cadmium. 25 Cadmium telluride is a very stable compound that is non-volatile and non-soluble in water. Even in the case of a fire, research shows that less than 0.1% of the cadmium is released when a CdTe panel is exposed to fire. The fire melts the glass and encapsulates over 99.9% of the cadmium in the molten glass. 27
It is important to understand the source of the cadmium used to manufacture CdTe PV panels. The cadmium is a byproduct of zinc and lead refining. The element is collected from emissions and waste streams during the production of these metals and combined with tellurium to create the CdTe used in PV panels. If the cadmium were not collected for use in the PV panels or other products, it would otherwise either be stockpiled for future use, cemented and buried, or disposed of. 28 Nearly all the cadmium in old or broken panels can be recycled which can eventually serve as the primary source of cadmium for new PV panels. 29
Similar to silicon-based PV panels, CdTe panels are constructed of a tempered glass front, one instead of two clear plastic encapsulation layers, and a rear heat strengthened glass backing (together >98% by weight). The final product is built to withstand exposure to the elements without significant damage for over 25 years. While not representative of damage that may occur in the field or even at a landfill, laboratory evidence has illustrated that when panels are ground into a fine powder, very acidic water is able to leach portions of the cadmium and tellurium, 30 similar to the process used to recycle CdTe panels. Like many silicon-based panels, CdTe panels are reported (as far back ask 1998 31) to pass the EPA’s Toxic Characteristic Leaching Procedure (TCLP) test, which tests the potential for crushed panels in a landfill to leach hazardous substances into groundwater 32 Passing this test means that they are classified as non-hazardous waste and can be deposited in landfills. 33, 34 For more information about PV panel end-of-life, see the Panel Disposal section.
There is also concern of environmental impact resulting from potential catastrophic events involving CdTe PV panels. An analysis of worst-case scenarios for environmental impact from CdTe PV panels, including earthquakes, fires, and floods, was conducted by the University of Tokyo in 2013. After reviewing the extensive international body of research on CdTe PV technology, their report concluded, “Even in the worst-case scenarios, it is unlikely that the Cd concentrations in air and sea water will exceed the environmental regulation values.” 35 In a worst-case scenario of damaged panels abandoned on the ground, insignificant amounts of cadmium will leach from the panels. This is because this scenario is
much less conducive (larger module pieces, less acidity) to leaching than the conditions of the EPA’s TCLP test used to simulate landfill conditions, which CdTe panels pass. 36
First Solar, a U.S. company, and the only significant supplier of CdTe panels, has a robust panel take-back and recycling program that has been operating commercially since 2005 37 The company states that it is “committed to providing a commercially attractive recycling solution for photovoltaic (PV) power plant and module owners to help them meet their module (end of life) EOL obligation simply, costeffectively and responsibly.” First Solar global recycling services to their customers to collect and recycle panels once they reach the end of productive life whether due to age or damage. These recycling service agreements are structured to be financially attractive to both First Solar and the solar panel owner. For First Solar, the contract provides the company with an affordable source of raw materials needed for new panels and presumably a diminished risk of undesired release of Cd. The contract also benefits the solar panel owner by allowing them to avoid tipping fees at a waste disposal site. The legal contract helps provide peace of mind by ensuring compliance by both parties when considering the continuing trend of rising disposal costs and increasing regulatory requirements
c. CIS/CIGS and other PV technologies
Copper indium gallium selenide PV technology, often referred to as CIGS, is the second most common type of thin-film PV panel but a distant second behind CdTe. CIGS cells are composed of a thin layer of copper, indium, gallium, and selenium on a glass or plastic backing. None of these elements are very toxic, although selenium is a regulated metal under the Federal Resource Conservation and Recovery Act (RCRA). 38 The cells often also have an extremely thin layer of cadmium sulfide that contains a tiny amount of cadmium, which is toxic The promise of high efficiency CIGS panels drove heavy investment in this technology in the past. However, researchers have struggled to transfer high efficiency success in the lab to low-cost full-scale panels in the field. 39 Recently, a CIGS manufacturer based in Japan, Solar Frontier, has achieved some market success with a rigid, glass-faced CIGS module that competes with silicon panels. Solar Frontier produces the majority of CIS panels on the market today. 40 Notably, these panels are RoHS compliant, 41 thus meeting the rigorous toxicity standard adopted by the European Union even thought this directive exempts PV panels. The authors are unaware of any completed or proposed utility-scale system in North Carolina using CIS/CIGS panels.
1.2.3 Panel End-of-Life Management
Concerns about the volume, disposal, toxicity, and recycling of PV panels are addressed in this subsection. To put the volume of PV waste into perspective, consider that by 2050, when PV systems installed in 2020 will reach the end of their lives, it is estimated that the global annual PV panel waste tonnage will be 10% of the 2014 global e-waste tonnage. 42 In the U.S., end-of-life disposal of solar products is governed by the Federal Resource Conservation and Recovery Act (RCRA), as well as state policies in some situations. RCRA separates waste into hazardous (not accepted at ordinary landfill) and solid waste (generally accepted at ordinary landfill) based on a series of rules. According to RCRA, the way to determine if a PV panel is classified as hazardous waste is the Toxic Characteristic Leaching Procedure (TCLP) test This EPA test is designed to simulate landfill disposal and determine the risk of hazardous substances leaching out of the landfill. 43, 44, 45 Multiple sources report that most modern PV panels (both crystalline silicon and cadmium telluride) pass the TCLP test. 46, 47 Some studies found that some older (1990s) crystalline silicon panels, and perhaps some newer crystalline silicon panels (specifics are not given about vintage of panels tested), do not pass the lead (Pb) leachate limits in the TCLP test. 48, 49
The test begins with the crushing of a panel into centimeter-sized pieces. The pieces are then mixed in an acid bath. After tumbling for eighteen hours, the fluid is tested for forty hazardous substances that all must be below specific threshold levels to pass the test. Research comparing TCLP conditions to conditions of damaged panels in the field found that simulated landfill conditions provide overly conservative estimates of leaching for field-damaged panels. 50 Additionally, research in Japan has found no detectable Cd leaching from cracked CdTe panels when exposed to simulated acid rain. 51
Although modern panels can generally be landfilled, they can also be recycled. Even though recent waste volume has not been adequate to support significant PV-specific recycling infrastructure, the existing recycling industry in North Carolina reports that it recycles much of the current small volume of broken PV panels. In an informal survey conducted by the NC Clean Energy Technology Center survey in early 2016, seven of the eight large active North Carolina utility-scale solar developers surveyed reported that they send damaged panels back to the manufacturer and/or to a local recycler. Only one developer reported sending damaged panels to the landfill.
The developers reported at that time that they are usually paid a small amount per panel by local recycling firms. In early 2017, a PV developer reported that a local recycler was charging a small fee per panel to recycle damaged PV panels. The local recycling firm known to authors to accept PV panels described their current PV panel recycling practice as of early 2016 as removing the aluminum frame for local recycling and removing the wire leads for local copper recycling. The remainder of the panel is sent to a facility for processing the non-metallic portions of crushed vehicles, referred to as “fluff” in the recycling industry. 52 This processing within existing general recycling plants allows for significant material recovery of major components, including glass which is 80% of the module weight, but at lower yields than PV-specific recycling plants Notably almost half of the material value in a PV panel is in the few grams of silver contained in almost every PV panel produced today. In the long-term, dedicated PV panel recycling plants can increase treatment capacities and maximize revenues resulting in better output quality and the ability to recover a greater fraction of the useful materials. 53 PV-specific panel recycling technologies have been researched and implemented to some extent for the past decade, and have been shown to be able to recover over 95% of PV material (semiconductor) and over 90% of the glass in a PV panel. 54
A look at global PV recycling trends hints at the future possibilities of the practice in our country. Europe installed MW-scale volumes of PV years before the U.S. In 2007, a public-private partnership between the European Union and the solar industry set up a voluntary collection and recycling system called PV CYCLE. This arrangement was later made mandatory under the EU’s WEEE directive, a program for waste electrical and electronic equipment. 55 Its member companies (PV panel producers) fully finance the association. This makes it possible for end-users to return the member companies’ defective panels for recycling at any of the over 300 collection points around Europe without added costs. Additionally, PV CYCLE will pick up batches of 40 or more used panels at no cost to the user. This arrangement has been very successful, collecting and recycling over 13,000 tons by the end of 2015. 56
In 2012, the WEEE Directive added the end-of-life collection and recycling of PV panels to its scope. 57 This directive is based on the principle of extended-producer-responsibility. It has a global impact because producers that want to sell into the EU market are legally responsible for end-of-life management. Starting in 2018, this directive targets that 85% of PV products “put in the market” in Europe are recovered and 80% is prepared for reuse and recycling.
The success of the PV panel collection and recycling practices in Europe provides promise for the future of recycling in the U.S. In mid-2016, the US Solar Energy Industry Association (SEIA) announced that they are starting a national solar panel recycling program with the guidance and support of many
leading PV panel producers. 58 The program will aggregate the services offered by recycling vendors and PV manufacturers, which will make it easier for consumers to select a cost-effective and environmentally responsible end-of-life management solution for their PV products. According to SEIA, they are planning the program in an effort to make the entire industry landfill-free. In addition to the national recycling network program, the program will provide a portal for system owners and consumers with information on how to responsibly recycle their PV systems.
While a cautious approach toward the potential for negative environmental and/or health impacts from retired PV panels is fully warranted, this section has shown that the positive health impacts of reduced emissions from fossil fuel combustion from PV systems more than outweighs any potential risk. Testing shows that silicon and CdTe panels are both safe to dispose of in landfills, and are also safe in worst case conditions of abandonment or damage in a disaster. Additionally, analysis by local engineers has found that the current salvage value of the equipment in a utility scale PV facility generally exceeds general contractor estimates for the cost to remove the entire PV system. 59, 60, 61
1.2.4 Non-Panel System Components (racking, wiring, inverter, transformer)
While previous toxicity subsections discussed PV panels, this subsection describes the non-panel components of utility-scale PV systems and investigates any potential public health and safety concerns The most significant non-panel component of a ground-mounted PV system is the mounting structure of the rows of panels, commonly referred to as “racking”. The vertical post portion of the racking is galvanized steel and the remaining above-ground racking components are either galvanized steel or aluminum, which are both extremely common and benign building materials. The inverters that make the solar generated electricity ready to send to the grid have weather-proof steel enclosures that protect the working components from the elements. The only fluids that they might contain are associated with their cooling systems, which are not unlike the cooling system in a computer. Many inverters today are RoHS compliant.
The electrical transformers (to boost the inverter output voltage to the voltage of the utility connection point) do contain a liquid cooling oil. However, the fluid used for that function is either a nontoxic mineral oil or a biodegradable non-toxic vegetable oil, such as BIOTEMP from ABB. These vegetable transformer oils have the additional advantage of being much less flammable than traditional mineral oils. Significant health hazards are associated with old transformers containing cooling oil with toxic PCBs. Transfers with PCB-containing oil were common before PCBs were outlawed in the U.S. in 1979. PCBs still exist in older transformers in the field across the country.
Other than a few utility research sites, there are no batteries on- or off-site associated with utilityscale solar energy facilities in North Carolina, avoiding any potential health or safety concerns related to battery technologies. However, as battery technologies continue to improve and prices continue to decline we are likely to start seeing some batteries at solar facilities. Lithium ion batteries currently dominate the world utility-scale battery market, which are not very toxic. No non-panel system components were found to pose any health or environmental dangers.
1.4 Operations and Maintenance – Panel Washing and Vegetation Control
Throughout the eastern U.S., the climate provides frequent and heavy enough rain to keep panels adequately clean. This dependable weather pattern eliminates the need to wash the panels on a regular basis Some system owners may choose to wash panels as often as once a year to increase production, but most in N.C. do not regularly wash any PV panels. Dirt build up over time may justify panel washing a few times over the panels’ lifetime; however, nothing more than soap and water are required for this activity.
The maintenance of ground-mounted PV facilities requires that vegetation be kept low, both for aesthetics and to avoid shading of the PV panels. Several approaches are used to maintain vegetation at NC solar facilities, including planting of limited-height species, mowing, weed-eating, herbicides, and grazing livestock (sheep). The following descriptions of vegetation maintenance practices are based on interviews with several solar developers as well as with three maintenance firms that together are contracted to maintain well over 100 of the solar facilities in N.C. The majority of solar facilities in North Carolina maintain vegetation primarily by mowing. Each row of panels has a single row of supports, allowing sickle mowers to mow under the panels. The sites usually require mowing about once a month during the growing season. Some sites employ sheep to graze the site, which greatly reduces the human effort required to maintain the vegetation and produces high quality lamb meat. 62
In addition to mowing and weed eating, solar facilities often use some herbicides Solar facilities generally do not spray herbicides over the entire acreage; rather they apply them only in strategic locations such as at the base of the perimeter fence, around exterior vegetative buffer, on interior dirt roads, and near the panel support posts Also unlike many row crop operations, solar facilities generally use only general use herbicides, which are available over the counter, as opposed to restricted use herbicides commonly used in commercial agriculture that require a special restricted use license. The herbicides used at solar facilities are primarily 2-4-D and glyphosate (Round-up®), which are two of the most common herbicides used in lawns, parks, and agriculture across the country. One maintenance firm that was interviewed sprays the grass with a class of herbicide known as a growth regulator in order to slow the growth of grass so that mowing is only required twice a year. Growth regulators are commonly used on highway roadsides and golf courses for the same purpose. A commercial pesticide applicator license is required for anyone other than the landowner to apply herbicides, which helps ensure that all applicators are adequately educated about proper herbicide use and application The license must be renewed annually and requires passing of a certification exam appropriate to the area in which the applicator wishes to work. Based on the limited data available, it appears that solar facilities in N.C. generally use significantly less herbicides per acre than most commercial agriculture or lawn maintenance services.
2. Electromagnetic Fields (EMF)
PV systems do not emit any material during their operation; however, they do generate electromagnetic fields (EMF), sometimes referred to as radiation. EMF produced by electricity is nonionizing radiation, meaning the radiation has enough energy to move atoms in a molecule around (experienced as heat), but not enough energy to remove electrons from an atom or molecule (ionize) or to damage DNA. As shown below, modern humans are all exposed to EMF throughout our daily lives without negative health impact Someone outside of the fenced perimeter of a solar facility is not exposed to significant EMF from the solar facility. Therefore, there is no negative health impact from the EMF
produced in a solar farm. The following paragraphs provide some additional background and detail to support this conclusion.
Since the 1970s, some have expressed concern over potential health consequences of EMF from electricity, but no studies have ever shown this EMF to cause health problems. 63 These concerns are based on some epidemiological studies that found a slight increase in childhood leukemia associated with average exposure to residential power-frequency magnetic fields above 0.3 to 0.4 µT (microteslas) (equal to 3.0 to 4.0 mG (milligauss)). µT and mG are both units used to measure magnetic field strength. For comparison, the average exposure for people in the U.S. is one mG or 0.1 µT, with about 1% of the population with an average exposure in excess of 0.4 µT (or 4 mG). 64 These epidemiological studies, which found an association but not a causal relationship, led the World Health Organization’s International Agency for Research on Cancer (IARC) to classify ELF magnetic fields as “possibly carcinogenic to humans”. Coffee also has this classification. This classification means there is limited evidence but not enough evidence to designate as either a “probable carcinogen” or “human carcinogen”. Overall, there is very little concern that ELF EMF damages public health The only concern that does exist is for long-term exposure above 0.4 µ T (4 mG) that may have some connection to increased cases of childhood leukemia. In 1997, the National Academies of Science were directed by Congress to examine this concern and concluded:
“Based on a comprehensive evaluation of published studies relating to the effects of power-frequency electric and magnetic fields on cells, tissues, and organisms (including humans), the conclusion of the committee is that the current body of evidence does not show that exposure to these fields presents a human-health hazard. Specifically, no conclusive and consistent evidence shows that exposures to residential electric and magnetic fields produce cancer, adverse neurobehavioral effects, or reproductive and developmental effects.” 65
There are two aspects to electromagnetic fields, an electric field and a magnetic field. The electric field is generated by voltage and the magnetic field is generated by electric current, i.e., moving electrons. A task group of scientific experts convened by the World Health Organization (WHO) in 2005 concluded that there were no substantive health issues related to electric fields (0 to 100,000 Hz) at levels generally encountered by members of the public. 66 The relatively low voltages in a solar facility and the fact that electric fields are easily shielded (i.e., blocked) by common materials, such as plastic, metal, or soil means that there is no concern of negative health impacts from the electric fields generated by a solar facility. Thus, the remainder of this section addresses magnetic fields. Magnetic fields are not shielded by most common materials and thus can easily pass through them. Both types of fields are strongest close to the source of electric generation and weaken quickly with distance from the source.
The direct current (DC) electricity produced by PV panels produce stationary (0 Hz) electric and magnetic fields. Because of minimal concern about potential risks of stationary fields, little scientific research has examined stationary fields’ impact on human health. 67 In even the largest PV facilities, the DC voltages and currents are not very high. One can illustrate the weakness of the EMF generated by a PV panel by placing a compass on an operating solar panel and observing that the needle still points north.
While the electricity throughout the majority of a solar site is DC electricity, the inverters convert this DC electricity to alternating current (AC) electricity matching the 60 Hz frequency of the grid. Therefore, the inverters and the wires delivering this power to the grid are producing non-stationary EMF, known as extremely low frequency (ELF) EMF, normally oscillating with a frequency of 60 Hz. This frequency is at the low-energy end of the electromagnetic spectrum. Therefore, it has less energy than
other commonly encountered types of non-ionizing radiation like radio waves, infrared radiation, and visible light.
The wide use of electricity results in background levels of ELF EMFs in nearly all locations where people spend time – homes, workplaces, schools, cars, the supermarket, etc. A person’s average exposure depends upon the sources they encounter, how close they are to them, and the amount of time they spend there. 68 As stated above, the average exposure to magnetic fields in the U.S. is estimated to be around one mG or 0.1 µT, but can vary considerably depending on a person’s exposure to EMF from electrical devices and wiring. 69 At times we are often exposed to much higher ELF magnetic fields, for example when standing three feet from a refrigerator the ELF magnetic field is 6 mG and when standing three feet from a microwave oven the field is about 50 mG. 70 The strength of these fields diminish quickly with distance from the source, but when surrounded by electricity in our homes and other buildings moving away from one source moves you closer to another. However, unless you are inside of the fence at a utility-scale solar facility or electrical substation it is impossible to get very close to the EMF sources. Because of this, EMF levels at the fence of electrical substations containing high voltages and currents are considered “generally negligible”. 71, 72
The strength of ELF-EMF present at the perimeter of a solar facility or near a PV system in a commercial or residential building is significantly lower than the typical American’s average EMF exposure. 73, 74 Researchers in Massachusetts measured magnetic fields at PV projects and found the magnetic fields dropped to very low levels of 0.5 mG or less, and in many cases to less than background levels (0.2 mG), at distances of no more than nine feet from the residential inverters and 150 feet from the utility-scale inverters. 75 Even when measured within a few feet of the utility-scale inverter, the ELF magnetic fields were well below the International Commission on Non-Ionizing Radiation Protection’s recommended magnetic field level exposure limit for the general public of 2,000 mG. 76 It is typical that utility scale designs locate large inverters central to the PV panels that feed them because this minimizes the length of wire required and shields neighbors from the sound of the inverter’s cooling fans. Thus, it is rare for a large PV inverter to be within 150 feet of the project’s security fence.
Anyone relying on a medical device such as pacemaker or other implanted device to maintain proper heart rhythm may have concern about the potential for a solar project to interfere with the operation of his or her device. However, there is no reason for concern because the EMF outside of the solar facility’s fence is less than 1/1000 of the level at which manufacturers test for ELF EMF interference, which is 1,000 mG. 77 Manufacturers of potentially affected implanted devices often provide advice on electromagnetic interference that includes avoiding letting the implanted device get too close to certain sources of fields such as some household appliances, some walkie-talkies, and similar transmitting devices. Some manufacturers’ literature does not mention high-voltage power lines, some say that exposure in public areas should not give interference, and some advise not spending extended periods of time close to power lines. 78
3. Electric Shock and Arc Flash Hazards
There is a real danger of electric shock to anyone entering any of the electrical cabinets such as combiner boxes, disconnect switches, inverters, or transformers; or otherwise coming in contact with voltages over 50 Volts. 79 Another electrical hazard is an arc flash, which is an explosion of energy that can occur in a short circuit situation. This explosive release of energy causes a flash of heat and a shockwave, both of which can cause serious injury or death. Properly trained and equipped technicians and electricians know how to safely install, test, and repair PV systems, but there is always some risk of
injury when hazardous voltages and/or currents are present. Untrained individuals should not attempt to inspect, test, or repair any aspect of a PV system due to the potential for injury or death due to electric shock and arc flash, The National Electric Code (NEC) requires appropriate levels of warning signs on all electrical components based on the level of danger determined by the voltages and current potentials. The national electric code also requires the site to be secured from unauthorized visitors with either a six-foot chain link fence with three strands of barbed wire or an eight-foot fence, both with adequate hazard warning signs.
4. Fire Safety
The possibility of fires resulting from or intensified by PV systems may trigger concern among the general public as well as among firefighters. However, concern over solar fire hazards should be limited because only a small portion of materials in the panels are flammable, and those components cannot self-support a significant fire. Flammable components of PV panels include the thin layers of polymer encapsulates surrounding the PV cells, polymer backsheets (framed panels only), plastic junction boxes on rear of panel, and insulation on wiring. The rest of the panel is composed of non-flammable components, notably including one or two layers of protective glass that make up over three quarters of the panel’s weight.
Heat from a small flame is not adequate to ignite a PV panel, but heat from a more intense fire or energy from an electrical fault can ignite a PV panel 80 One real-world example of this occurred during July 2015 in an arid area of California. Three acres of grass under a thin film PV facility burned without igniting the panels mounted on fixed-tilt racks just above the grass. 81 While it is possible for electrical faults in PV systems on homes or commercial buildings to start a fire, this is extremely rare. 82 Improving understanding of the PV-specific risks, safer system designs, and updated fire-related codes and standards will continue to reduce the risk of fire caused by PV systems.
PV systems on buildings can affect firefighters in two primary ways, 1) impact their methods of fighting the fire, and 2) pose safety hazard to the firefighters. One of the most important techniques that firefighters use to suppress fire is ventilation of a building’s roof. This technique allows superheated toxic gases to quickly exit the building. By doing so, the firefighters gain easier and safer access to the building, Ventilation of the roof also makes the challenge of putting out the fire easier. However, the placement of rooftop PV panels may interfere with ventilating the roof by limiting access to desired venting locations
New solar-specific building code requirements are working to minimize these concerns. Also, the latest National Electric Code has added requirements that make it easier for first responders to safely and effectively turn off a PV system. Concern for firefighting a building with PV can be reduced with proper fire fighter training, system design, and installation. Numerous organizations have studied fire fighter safety related to PV. Many organizations have published valuable guides and training programs. Some notable examples are listed below.
• The International Association of Fire Fighters (IAFF) and International Renewable Energy Council (IREC) partnered to create an online training course that is far beyond the PowerPoint click-andview model. The self-paced online course, “Solar PV Safety for Fire Fighters,” features rich video content and simulated environments so fire fighters can practice the knowledge they’ve learned. www.iaff.org/pvsafetytraining
• Photovoltaic Systems and the Fire Code: Office of NC Fire Marshal
• Fire Service Training, Underwriter's Laboratory
• Firefighter Safety and Response for Solar Power Systems, National Fire Protection Research Foundation
• Bridging the Gap: Fire Safety & Green Buildings, National Association of State Fire Marshalls
• Guidelines for Fire Safety Elements of Solar Photovoltaic Systems, Orange County Fire Chiefs Association
• Solar Photovoltaic Installation Guidelines, California Department of Forestry & Fire Protection, Office of the State Fire Marshall
• PV Safety & Firefighting, Matthew Paiss, Homepower Magazine
• PV Safety and Code Development: Matthew Paiss, Cooperative Research Network
Summary
The purpose of this paper is to address and alleviate concerns of public health and safety for utility-scale solar PV projects. Concerns of public health and safety were divided and discussed in the four following sections: (1) Toxicity, (2) Electromagnetic Fields, (3) Electric Shock and Arc Flash, and (4) Fire. In each of these sections, the negative health and safety impacts of utility-scale PV development were shown to be negligible, while the public health and safety benefits of installing these facilities are significant and far outweigh any negative impacts.
1 Wiser, Ryan, Trieu Mai, Dev Millstein, Jordan Macknick, Alberta Carpenter, Stuart Cohen, Wesley Cole, Bethany Frew, and Garvin A. Heath. 2016. On the Path to SunShot: The Environmental and Public Health Benefits of Achieving High Penetrations of Solar Energy in the United States. Golden, CO: National Renewable Energy Laboratory. Accessed March 2017, www.nrel.gov/docs/fy16osti/65628.pdf
2 IRENA and IEA-PVPS (2016), “End-of-Life Management: Solar Photovoltaic Panels,” International Renewable Energy Agency and International Energy Agency Photovoltaic Power Systems.
3 National Renewable Energy Laboratory, Overview of Field Experience – Degradation Rates & Lifetimes. September 14, 2015. Solar Power International Conference. Accessed March 2017, www.nrel.gov/docs/fy15osti/65040.pdf
4 Miesel et al. SolarCity Photovoltaic Modules with 35 Year Useful Life. June 2016. Accessed March 2017. http://www.solarcity.com/newsroom/reports/solarcity-photovoltaic-modules-35-year-useful-life
5 David Unger. Are Renewables Stormproof? Hurricane Sandy Tests Solar, Wind. November 2012. Accessed March 2017. http://www.csmonitor.com/Environment/Energy-Voices/2012/1119/Are-renewables-stormproof-Hurricane-Sandy-tests-solarwind & http://www.csmonitor.com/Environment/Energy-Voices/2012/1119/Are-renewables-stormproof-Hurricane-Sandytests-solar-wind
6 NEXTracker and 365 Pronto, Tracking Your Solar Investment: Best Practices for Solar Tracker O&M. Accessed March 2017. www.nextracker.com/content/uploads/2017/03/NEXTracker_OandM-WhitePaper_FINAL_March-2017.pdf
7 Christiana Honsberg, Stuart Bowden. Overview of Screen Printed Solar Cells. Accessed January 2017. www.pveducation.org/pvcdrom/manufacturing/screen-printed
8 Silicon Valley Toxics Coalition. 2015 Solar Scorecard. Accessed August 2016. www.solarscorecard.com/2015/2015SVTC-Solar-Scorecard.pdf
9 European Commission. Recast of Reduction of Hazardous Substances (RoHS) Directive. September 2016. Accessed August 2016. http://ec.europa.eu/environment/waste/rohs_eee/index_en.htm
10 Official Journal of the European Union, DIRECTIVE 2011/65/EU OF THE EUROPEAN PARLIAMENT AND OF THE COUNCIL of 8 June 2011 on the restriction of the use of certain hazardous substances in electrical and electronic equipment June 2011. Accessed May 2017. http://eur-lex.europa.eu/legalcontent/EN/TXT/PDF/?uri=CELEX:32011L0065&from=en
11 Giancarlo Giacchetta, Mariella Leporini, Barbara Marchetti. Evaluation of the Environmental Benefits of New High Value Process for the Management of the End of Life of Thin Film Photovoltaic Modules. July 2013. Accessed August 2016. www.researchgate.net/publication/257408804_Evaluation_of_the_environmental_benefits_of_new_high_value_process_for_ the_management_of_the_end_of_life_of_thin_film_photovoltaic_modules
12 European Commission. Study on Photovoltaic Panels Supplementing The Impact Assessment for a Recast of the Weee Directive. April 2011. Accessed August 2016.
14 The amount of lead in a typical car battery is 21.4 pounds. Waste 360. Chaz Miller. Lead Acid Batteries. March 2006. Accessed August 2016. http://waste360.com/mag/waste_leadacid_batteries_3
15 Okkenhaug G. Leaching from CdTe PV module material results from batch, column and availability tests. Norwegian Geotechnical Institute, NGI report No. 20092155-00-6-R; 2010
16 International Journal of Advanced Applied Physics Research. Renate Zapf-Gottwick1, et al. Leaching Hazardous Substances out of Photovoltaic Modules. January 2015. Accessed January 2016. www.cosmosscholars.com/phms/index.php/ijaapr/article/download/485/298
17 ibid
18 Parikhit Sinha, et al. Evaluation of Potential Health and Environmental Impacts from End-Of-Life Disposal of Photovoltaics, Photovoltaics, 2014. Accessed May 2016
19 Bonnet, D. and P. Meyers. 1998. Cadmium-telluride Material for thin film solar cells. J. Mater. Res., Vol. 13, No. 10, pp. 2740-2753
20 V. Fthenakis, K. Zweibel CdTe PV: Real and Perceived EHS Risks. National Center ofr Photovoltaics and Solar Program Review Meeting, March 24-26, 2003. www.nrel.gov/docs/fy03osti/33561.pdf. Accessed May 2017
21 International Energy Agency Photovoltaic Power Systems Programme. Life Cycle Inventories and Life Cycle Assessments of Photovoltaic Systems. March 2015. Accessed August 2016. http://iea-pvps.org/index.php?id=315
22 Data not available on fraction of various generation sources offset by solar generation in NC, but this is believed to be a reasonable rough estimate. The SunShot report entitled The Environmental and Public Health Benefits of Achieving High Penetrations of Solar Energy in the United States analysis contributes significant (% not provided) offsetting of coal-fired generation by solar PV energy in the southeast.
24 Vasilis Fthenakis. CdTe PV: Facts and Handy Comparisons. January 2003. Accessed March 2017. https://www.bnl.gov/pv/files/pdf/art_165.pdf
25 Kaczmar, S., Evaluating the Read-Across Approach on CdTe Toxicity for CdTe Photovoltaics, SETAC North America 32nd Annual Meeting, Boston, MA, November 2011. Available at: ftp://ftp.co.imperial.ca.us/icpds/eir/campo-verdesolar/final/evaluating-toxicity.pdf, Accessed May 2017
27 V. M. Fthenakis et al, Emissions and Encapsulation of Cadmium in CdTe PV Modules During Fires Renewable Progress in Photovoltaics: Research and Application: Res. Appl. 2005; 13:1–11, Accessed March 2017, www.bnl.gov/pv/files/pdf/abs_179.pdf
28 Fthenakis V.M., Life Cycle Impact Analysis of Cadmium in CdTe Photovoltaic Production, Renewable and Sustainable Energy Reviews, 8, 303-334, 2004. www.clca.columbia.edu/papers/Life_Cycle_Impact_Analysis_Cadmium_CdTe_Photovoltaic_productio n.pdf, Accessed May 2017
29 International Renewable Energy Agency. Stephanie Weckend, Andreas Wade, Garvin Heath. End of Life Management: Solar Photovoltaic Panels. June 2016. Accessed November 2016.
30 International Journal of Advanced Applied Physics Research. Renate Zapf-Gottwick1, et al. Leaching Hazardous Substances out of Photovoltaic Modules. January 2015. Accessed January 2016. www.cosmosscholars.com/phms/index.php/ijaapr/article/download/485/298
31 Cunningham D., Discussion about TCLP protocols, Photovoltaics and the Environment Workshop, July 23-24, 1998, Brookhaven National Laboratory, BNL-52557
32 Parikhit Sinha, et al. Evaluation of Potential Health and Environmental Impacts from End-Of-Life Disposal of Photovoltaics, Photovoltaics, 2014. Accessed May 2016
33 Practical Handbook of Photovoltaics: Fundamentals and Applications. T. Markvart and L. Castaner. Chapter VII-2: Overview of Potential Hazards. December 2003. Accessed August 2016. https://www.bnl.gov/pv/files/pdf/art_170.pdf
34 Norwegian Geotechnical Institute. Environmental Risks Regarding the Use and End-of-Life Disposal of CdTe PV Modules. April 2010. Accessed August 2016. https://www.dtsc.ca.gov/LawsRegsPolicies/upload/Norwegian-Geotechnical-InstituteStudy.pdf
35 First Solar. Dr. Yasunari Matsuno. December 2013. August 2016. Environmental Risk Assessment of CdTe PV Systems to be considered under Catastrophic Events in Japan. http://www.firstsolar.com/-/media/Documents/Sustainability/PeerReviews/Japan_Peer-Review_Matsuno_CdTe-PV-Tsunami.ashx
36 First Solar. Parikhit Sinha, Andreas Wade. Assessment of Leaching Tests for Evaluating Potential Environmental Impacts of PV Module Field Breakage 2015 IEEE
37 See p. 22 of First Solar, Sustainability Report. Available at: www.firstsolar.com/-/media/FirstSolar/Sustainability-Documents/03801_FirstSolar_SustainabilityReport_08MAR16_Web.ashx, Accessed May 2017
38 40 CFR §261.24 Toxicity Characteristic. May 2017. Accessed May 2017. https://www.ecfr.gov/cgi-bin/textidx?node=se40.26.261_124&rgn=div8
39 Office of Energy Efficiency & Renewable Energy. Copper Indium Gallium Diselenide. Accessed March 2017. https://www.energy.gov/eere/sunshot/copper-indium-gallium-diselenide
40 Mathias Maehlum. Best Thin Film Solar Panels – Amorphous, Cadmium Telluride or CIGS? April 2015. Accessed March 2017. http://energyinformative.org/best-thin-film-solar-panels-amorphous-cadmium-telluride-cigs/
41 RoHS tested certificate for Solar Frontier PV modules. TUVRheinland, signed 11.11.2013
42 International Renewable Energy Agency. Stephanie Weckend, Andreas Wade, Garvin Heath. End of Life Management: Solar Photovoltaic Panels. June 2016. Accessed November 2016. http://www.irena.org/DocumentDownloads/Publications/IRENA_IEAPVPS_End-of-Life_Solar_PV_Panels_2016.pdf
43 40 C.F.R. §261.10. Identifying the Characteristics of Hazardous Waste and for Listing Hazardous Waste. November 2016. Accessed November 2016 http://www.ecfr.gov/cgi-bin/textidx?SID=ce0006d66da40146b490084ca2816143&mc=true&node=pt40.26.261&rgn=div5#sp40.28.261.b
44 40 C.F.R. §261.24 Toxicity Characteristic. November 2016. Accessed November 2016. http://www.ecfr.gov/cgi-bin/textidx?SID=ce0006d66da40146b490084ca2816143&mc=true&node=pt40.26.261&rgn=div5#se40.28.261_124
45 International Renewable Energy Agency. Stephanie Weckend, Andreas Wade, Garvin Heath. End of Life Management: Solar Photovoltaic Panels. June 2016. Accessed November 2016. http://www.irena.org/DocumentDownloads/Publications/IRENA_IEAPVPS_End-of-Life_Solar_PV_Panels_2016.pdf
46 TLCP test results from third-party laboratories for REC, Jinko, and Canadian Solar silicon-based panels. Provided by PV panel manufacturers directly or indirectly to authors
47 Sinovoltaics, Introduction to Solar Panel Recycling, March 2014. Accessed October 2016. http://sinovoltaics.com/solarbasics/introduction-to-solar-panel-recycling/
48 Brookhaven National Laboratory. Vasilis Fthenakis, Regulations on Photovoltaic Module Disposal and Recycling. January 29, 2001.
49 Parikhit Sinha, et al. Evaluation of Potential Health and Environmental Impacts from End-Of-Life Disposal of Photovoltaics, Photovoltaics, 2014.
50 First Solar. Parikhit Sinha, Andreas Wade. Assessment of Leaching Tests for Evaluating Potential Environmental Impacts of PV Module Field Breakage. October 2015. Accessed August 2016. http://www.firstsolar.com//media/Documents/Sustainability/PVSC42-Manuscript-20150912 Assessment-of-Leaching-Tests-for-Evaluating-PotentialEnvironmental-Impa.ashx
51 First Solar. Dr. Yasunari Matsuno. December 2013. Environmental Risk Assessment of CdTe PV Systems to be considered under Catastrophic Events in Japan. http://www.firstsolar.com/-/media/Documents/Sustainability/PeerReviews/Japan_Peer-Review_Matsuno_CdTe-PV-Tsunami.ashx
52 Phone interview, February 3, 2016, TT&E Iron & Metal, Garner, NC www.ncscrapmetal.com/
53 Wen-His Huang, et al. Strategy and Technology To Recycle Water-silicon Solar Modules. Solar Energy, Volume 144, March 2017, Pages 22-31
54 International Renewable Energy Agency. Stephanie Weckend, Andreas Wade, Garvin Heath. End of Life Management: Solar Photovoltaic Panels. June 2016. Accessed November 2016. http://www.irena.org/DocumentDownloads/Publications/IRENA_IEAPVPS_End-of-Life_Solar_PV_Panels_2016.pdf
55 Official Journal of the European Union. Directive 2012/19/EU of the European Parliament and of the Council of 4 July 2012 on Waste Electrical and Electronic Equipment July 2012. Accessed November 2016. http://eurlex.europa.eu/legal-content/EN/TXT/?uri=celex%3A32012L0019
56 PV CYCLE. Annual Report 2015. Accessed November 2016. https://pvcyclepublications.cld.bz/Annual-Report-PVCYCLE-2015/6-7
57 Official Journal of the European Union. Directive 2012/19/EU of the European Parliament and of the Council of 4 July 2012 on Waste Electrical and Electronic Equipment. July 2012. Accessed November 2016. http://eurlex.europa.eu/legal-content/EN/TXT/?uri=celex%3A32012L0019
58 SEIA National PV Recycling Program: www.seia.org/seia-national-pv-recycling-program
59 RBI Solar, Decommissioning Plan submitted to Catawba County associated with permitting of a 5MW solar project in June 2016. Accessed April 2017. www.catawbacountync.gov/Planning/Projects/Rezonings/RZ2015-05_DecommissioningPlan.pdf
60 Birdseye Renewables, Decommissioning Plan submitted to Catawba County associated with permitting of a 5MW solar project in May 2015. Accessed April 2017. www.catawbacountync.gov/Planning/Projects/Rezonings/RZ201504_DecommissioningPlan.pdf
61 Cypress Creek Renewables, Decommissioning Plan submitted to Catawba County associated with permitting of a 5MW solar project in September 2016. Accessed April 2017. www.catawbacountync.gov/Planning/Projects/Rezonings/RZ201606decommission.pdf
62 Sun Raised Farms: http://sunraisedfarms.com/index.html
63 National Institute of Environmental Health Sciences and National Institutes of Health, EMF: Electric and Magnetic Fields Associated with Electric Power: Questions and Answers, June 2002
64 World Health Organization. Electromagnetic Fields and Public Health: Exposure to Extremely Low Frequency Fields. June 2007. Accessed August 2016. http://www.who.int/peh -emf/publications/facts/fs322/en/
65 Committee on the Possible Effects of Electromagnetic Fields on Biologic Systems, Natio nal Research Council, Possible Health Effects of Exposure to Residential Electric and Magnetic Fields, ISBN: 0-309-55671-6, 384 pages, 6 x 9, (1997) This PDF is available from the National Academies Press at: http://www.nap.edu/catalog/5155.html
66 World Health Organization. Electromagnetic Fields and Public Health: Exposure to Extremely Low Frequency Fields June 2007. Accessed August 2016. http://www.who.int/peh -emf/publications/facts/fs322/en/
67 World Health Organization. Electromagnetic Fields and Public Health: Static Electric and Magnetic Fields. March 2006. Accessed August 2016. http://www.who.int/peh-emf/publications/facts/fs299/en/
68 Asher Sheppard, Health Issues Related to the Static and Power-Frequency Electric and Magnetic Fields (EMFs) of the Soitec Solar Energy Farms, April 30, 2014. Accessed March 2017: www.sandiegocounty.gov/content/dam/sdc/pds/ceqa/Soitec-Documents/Final-EIR-Files/Appendix_9.0-1_EMF.pdf
69 Massachusetts Clean Energy Center. Study of Acoustic and EMF Levels from Solar Photovoltaic Projects. December 2012. Accessed August 2016.
70 Duke Energy Corporation. Frequently Asked Questions: Electric and Magnetic Fields. Accessed August 2016. https://www.duke-energy.com/about-energy/frequently_asked_questions.asp
71 National Institute of Environmental Health Sciences, Electric and Magnetic Fields Associate with the use of Electric Power: Questions and Answers, 2002. Accessed November 2016 www.niehs.nih.gov/health/materials/electric_and_magnetic_fields
72 Duke Energy Corporation. Frequently Asked Questions: Electric and Magnetic Fields. Accessed August 2016. https://www.duke-energy.com/about-energy/frequently_asked_questions.asp
73 R.A. Tell et al, Electromagnetic Fields Associated with Commercial Solar Photovoltaic Electric Power Generating Facilities, Journal of Occupational and Environmental Hygiene, Volume 12, 2015,- Issue 11. Abstract Accessed March 2016: http://www.tandfonline.com/doi/full/10.1080/15459624.2015.1047021
74 Massachusetts Department of Energy Resources, Massachusetts Department of Environmental Protection, and Massachusetts Clean Energy Center. Questions & Answers: Ground-Mounted Solar Photovoltaic Systems. June 2015. Accessed August 2016. http://www.mass.gov/eea/docs/doer/renewables/solar/solar-pv-guide.pdf
75 Ibid.
76 Ibid.
77 EMFs and medical devices, Accessed March 2017. www.emfs.info/effects/medical-devices/
78 ibid.
79 Damon McCluer. Electrical Construction & Maintenance: NFPA 70E’s Approach to Considering DC Hazards. September 2013. Accessed October 2016. http://ecmweb.com/safety/nfpa-70e-s-approach-considering-dc-hazards,
80 Hong-Yun Yang, et. al. Experimental Studies on the Flammability and Fire Hazards of Photovoltaic Modules, Materials. July 2015. Accessed August 2016. http://www.mdpi.com/1996 -1944/8/7/4210/pdf
81 Matt Fountain. The Tribune. Fire breaks out at Topaz Solar Farm. July 2015. Accessed August 2016. www.sanluisobispo.com/news/local/article39055539.html
82 Cooperative Research Network. Matthew Paiss. Tech Surveillance: PV Safety & Code Developments. October 2014. Accessed August 2016. http://www.nreca.coop/wp-content/uploads/2013/06/ts_pv_fire_safety_oct_2014.pdf
Published by the N.C. Clean Energy Technology Center at N.C. State University
LAZARD’S LEVELIZED COST OF ENERGY ANALYSIS VERSION 15.0
Introduction
Lazard’s Levelized Cost of Energy (“LCOE”) analysis addresses the following topics:
• Comparative LCOE analysis for various generation technologies on a $/MWh basis, including sensitivities for U.S. federal tax subsidies, fuel prices, carbon pricing and costs of capital
• Illustration of how the LCOE of onshore wind and utility-scale solar compare to the marginal cost of selected conventional generation technologies
• Historical LCOE comparison of various utility-scale generation technologies
• Illustration of the historical LCOE declines for wind and utility-scale solar technologies
• Illustration of how the LCOE of utility-scale solar and wind compare to those of gas peaking and combined cycle
• Comparison of capital costs on a $/kW basis for various generation technologies
• Deconstruction of the LCOE for various generation technologies by capital cost, fixed operations and maintenance expense, variable operations and maintenance expense and fuel cost
• Overview of the methodology utilized to prepare Lazard’s LCOE analysis
• Considerations regarding the operating characteristics and applications of various generation technologies
• Summary of assumptions utilized in Lazard’s LCOE analysis
• Summary considerations in respect of Lazard’s approach to evaluating the LCOE of various conventional and renewable energy technologies
Other factors would also have a potentially significant effect on the results contained herein, but have not been examined in the scope of this current analysis. These additional factors, among others, could include: capacity value vs. energy value; network upgrades, transmission, congestion or other integration-related costs; significant permitting or other development costs, unless otherwise noted; and costs of complying with various environmental regulations (e.g., carbon emissions offsets or emissions control systems). This analysis also does not address potential social and environmental externalities, including, for example, the social costs and rate consequences for those who cannot afford distributed generation solutions, as well as the long-term residual and societal consequences of various conventional generation technologies that are difficult to measure (e.g., nuclear waste disposal, airborne pollutants, greenhouse gases, etc.)
Levelized Cost of Energy Comparison—Unsubsidized Analysis
(3)
(4) Unless otherwise indicated, the analysis herein does not reflect decommissioning costs, ongoing maintenance-related capital expenditures or the potential economic impacts of federal loan guarantees or other subsidies.
(5) Represents the midpoint of the marginal cost of operating fully depreciated gas combined cycle, coal and nuclear facilities, inclusive of decommissioning costs for nuclear facilities. Analysis assumes that the salvage value for a decommissioned gas combined cycle or coal asset is equivalent to its decommissioning and site restoration costs. Inputs are derived from a benchmark of operating gas combined cycle, coal and nuclear assets across the U.S. Capacity factors, fuel, variable and fixed operating expenses are based on upper- and lower-quartile estimates derived from Lazard’s research. Please see page titled “Levelized Cost of Energy Comparison Renewable
versus Marginal
of Selected Existing Conventional Generation” for additional details.
(6) High end incorporates 90% carbon capture and storage. Does not include cost of transportation
Levelized Cost of Energy Comparison—Sensitivity to
The Investment Tax Credit (“ITC”) and Production Tax Credit (“PTC”) remain important components of the levelized cost of renewable energy generation technologies
Source: Lazard estimates.
Levelized Cost of Energy Comparison—Sensitivity to Fuel Prices
Variations in fuel prices can materially affect the LCOE of conventional generation technologies, but direct comparisons to “competing” renewable energy generation technologies must take into account issues such as dispatch characteristics (e.g., baseload and/or dispatchable intermediate capacity vs. those of peaking or intermittent technologies)
Source: Lazard estimates.
Levelized Cost of Energy Comparison—Sensitivity to Carbon Pricing
Carbon pricing is one avenue for policymakers to address carbon emissions via a market-based mechanism; a carbon price range of $20 – $40/Ton of carbon would increase the LCOE for certain conventional generation technologies to levels above those of onshore wind and utility-scale solar
Levelized Cost of Energy Comparison—Sensitivity to Cost of Capital
A key consideration in determining the LCOE values for utility-scale generation technologies is the cost, and availability, of capital(1); this dynamic is particularly significant for renewable energy generation technologies
Midpoint of Unsubsidized LCOE(2)
Source: Lazard estimates. Note: Analysis assumes 60% debt and 40% equity. Unless otherwise noted, the assumptions used in this
Levelized Cost of Energy Comparison—Renewable Energy versus Marginal Cost of Selected Existing Conventional Generation
Source: Lazard estimates.
Levelized Cost of Energy Comparison—Historical Utility-Scale Generation Comparison
Lazard’s unsubsidized LCOE analysis indicates significant historical cost declines for utility-scale renewable energy generation technologies driven by, among other factors, decreasing capital costs, improving technologies and increased competition
Selected Historical Mean Unsubsidized LCOE Values(1)
Source: Lazard estimates.
Levelized Cost of Energy Comparison—Historical Renewable Energy LCOE
In light of material declines in the pricing of system components and improvements in efficiency, among other factors, wind and utility-scale solar PV have exhibited dramatic LCOE declines; however, as these industries have matured, the rates of decline have diminished
Solar PV versus Gas Peaking and Wind versus CCGT—Global Markets(1)
Solar PV and wind have become increasingly competitive with conventional technologies with similar generation profiles; without storage, however, these resources lack the dispatch characteristics, and associated benefits, of such conventional technologies
Solar PV(2) versus Gas Peaker(3) Wind(4) versus Gas Combined Cycle(5)
Unsubsidized LCOE
Source: Lazard estimates.
Note: The analysis presented on this page assumes country-specific or regionally applicable tax rates.
(1) Equity IRRs are assumed to be 10.0% – 12.0% for Australia, 15.0% for Brazil and South Africa, 13.0% – 15.0% for India, 8.0% – 10.0% for Japan, 7.5% – 12.0% for Europe and 7.5% – 9.0% for the U.S. Cost of debt is assumed to be 5.0% – 5.5% for Australia, 10.0% – 12.0% for Brazil, 12.0% – 13.0% for India, 3.0% for Japan, 4.5% – 5.5% for Europe, 12.0% for South Africa and 4.0% –4.5% for the U.S.
(2) Low end assumes crystalline utility-scale solar with a single-axis tracker. High end assumes rooftop C&I solar. Solar projects assume illustrative capacity factors of 21% – 28% for the U.S., 26% –30% for Australia, 26% – 28% for Brazil, 22% – 23% for India, 27% – 29% for South Africa, 16% – 18% for Japan and 13% – 16% for Europe.
(3) Assumes natural gas prices of $3.45 for the U.S., $4.00 for Australia, $8.00 for Brazil, $7.00 for India, South Africa and Japan and $6.00 for Europe (all in U.S.$ per MMBtu). Assumes a capacity factor of 10% for all geographies.
(4) Wind projects assume illustrative capacity factors of 38% – 55% for the U.S., 29% – 46% for Australia, 45% – 55% for Brazil, 25% – 35% for India, 31% – 36% for South Africa, 22%
Japan and 33% – 38% for Europe.
(5) Assumes natural gas prices of $3.45 for the U.S., $4.00 for Australia, $8.00 for Brazil, $7.00 for India, South Africa and Japan and $6.00
Capital Cost Comparison
In some instances, the capital costs of renewable energy generation technologies have converged with those of certain conventional generation technologies, which coupled with improvements in operational efficiency for renewable energy technologies, have led to a convergence in LCOE between the respective technologies
Source: Lazard estimates.
Levelized Cost of Energy Components—Low End
Certain renewable energy generation technologies are already cost-competitive with conventional generation technologies; a key factor regarding the continued cost decline of renewable energy generation technologies is the ability of technological development and industry scale to continue lowering operating expenses and capital costs for renewable energy generation technologies
Levelized Cost of Energy Components—High End
Certain renewable energy generation technologies are already cost-competitive with conventional generation technologies; a key factor regarding the continued cost decline of renewable energy generation technologies is the ability of technological development and industry scale to continue lowering operating expenses and capital costs for renewable energy generation technologies
Levelized Cost of Energy Comparison—Methodology
Lazard’s LCOE analysis consists of creating a power plant model representing an illustrative project for each relevant technology and solving for the $/MWh value that results in a levered IRR equal to the assumed cost of equity (see subsequent “Key Assumptions” pages for detailed assumptions by technology)
Energy Resources—Matrix of Applications
Despite convergence in the LCOE of certain renewable energy and conventional generation technologies, direct comparisons must take into account issues such as location (e.g., centralized vs. distributed) and dispatch characteristics (e.g., baseload and/or dispatchable intermediate capacity vs. those of peaking or intermittent technologies)
• This analysis does not take into account potential social and environmental externalities or reliability-related considerations
Source: Lazard estimates.
Levelized Cost of Energy—Key Assumptions
Levelized Cost of Energy—Key Assumptions (cont’d)
Source: Lazard estimates.
Levelized Cost of Energy—Key Assumptions (cont’d)
Source:
Levelized Cost of Energy—Key Assumptions (cont’d)
Summary Considerations
Lazard has conducted this analysis comparing the LCOE for various conventional and renewable energy generation technologies in order to understand which renewable energy generation technologies may be cost-competitive with conventional generation technologies, either now or in the future, and under various operating assumptions. We find that renewable energy technologies are complementary to conventional generation technologies, and believe that their use will be increasingly prevalent for a variety of reasons, including to mitigate the environmental and social consequences of various conventional generation technologies, RPS requirements, carbon regulations, con tinually improving economics as underlying technologies improve and production volumes increase, and supportive regulatory frameworks in certain regions.
In this analysis, Lazard’s approach was to determine the LCOE, on a $/MWh basis, that would provide an after-tax IRR to equity holders equal to an assumed cost of equity capital. Certain assumptions (e.g., required debt and equity returns, capital structure, etc.) were identical for all technologies in order to isolate the effects of key differentiated inputs such as investment costs, capacity factors, operating costs, fuel costs (where relevant) and other important metrics. These inputs were originally developed with a leading consulting and engineering firm to the Power & Energy Industry, augmented with Lazard’s commercial knowledge where relevant. This analysis (as well as previous versions) has benefited from additional input from a wide variety of Industry participants and is informed by Lazard’s many client interactions on this topic.
Lazard has not manipulated the cost of capital or capital structure for various technologies, as the goal of this analysis is to compare the current levelized cost of various generation technologies, rather than the benefits of financial engineering. The results contained herein would be altered by different assumptions regarding capital structure (e.g., increased use of leverage) or the cost of capital (e.g., a willingness to accept lower returns than those assumed herein).
Key sensitivities examined included fuel costs, tax subsidies, carbon pricing and costs of capital. Other factors would also have a potentially significant effect on the results contained herein, but have not been examined in the scope of this current analysis. These additional factors, among others, could include: capacity value vs. energy value; network upgrades, transmission, congestion or other integration-related costs; significant permitting or other development costs, unless otherwise noted; and other costs of complying with various environmental regulations (e.g., carbon emissions offsets or emissions control systems). This analysis also does not address potential social and environmental externalities, including, for example, the social costs and rate consequences for those who cannot afford distributed generation solutions, as well as the long-term residual and societal consequences of various conventional generation technologies that are difficult to measure (e.g., nuclear waste disposal, airborne pollutants, greenhouse gases, etc.).
OHIO DEPARTMENT OF HEALTH
SOLAR FARM AND PHOTOVOLTAICS SUMMARY AND ASSESSMENTS
Prepared By: Health Assessment Section Bureau of Environmental Health and Radiation Protection Ohio Department of Health
Last Updated April 2022
Introduction
The Ohio Department of Health’s (ODH) role in the Ohio Power Siting Board has historically been to assess cases to determine whether the construction, alteration, operation, or decommissioning of any power-generating structure or facility will have an impact on the health and wellness of the public. ODH works in partnership with fellow state agencies, including the Ohio Department of Natural Resources (ODNR), which assesses ecological impacts, and the Ohio Environmental Protection Agency (OEPA), who is responsible for environmental licensing and regulation, to provide a robust, holistic assessment.
The purpose of this ODH document is to assess, based upon existing research, whether solar farms and photovoltaic technologies have the potential to cause harm to human health. ODH has developed this document at the request of the Ohio Power Siting Board in response to an increase in the construction of new solar power facilities in Ohio.
The determinations within this document were made based upon a review of literature available at the time of its original publication. As scientific information changes over time, and as photovoltaic technologies and the landscape of solar energy within Ohio changes, ODH will reevaluate these conclusions as needed. ODH did not conduct independent, peer-reviewed research to produce this document.
Crystalline Silicon
Photovoltaic (PV) technologies convert sunlight into energy using conductive materials. PV panels are also called solar panels.
A form of the element silicon known as crystalline silicon (c-Si) is the most common semi-conductor used in the construction of PV panels accounting for 95% of PV panels sold worldwide and is the secondmost ubiquitous element on Earth after oxygen. The c-Si used in PV panels is harvested through the processing of silica (SiO2, also known as silicon dioxide or sand) to remove the attached oxygen molecule. The refined c-Si is converted to a PV cell by processing further with small amounts of boron and phosphorus, which are not generally toxic to humans (NC Clean Energy Technology Center, 2017).
While c-Si itself is benign and non-toxic, there may be some toxic trace elements in c-Si-based PV panels. Particularly in older models, a tin-based solder containing a small amount of lead (Pb) may be used in the panels’ construction. Lead has long been known to be toxic to humans, and long-term exposures have been known to cause adverse neurological, renal, cardiovascular, hematological, immunological, reproductive, and developmental effects, especially in children (ATSDR, 2020). However, the amount of lead in a PV panel is generally very small (13 grams per panel, or roughly one-half of the lead contained in a typical 12-gauge shotgun shell or 1/750th of the lead contained in a single car battery), and many manufacturers have moved to using lead-free solder (NC Clean Energy Technology Center, 2017)
Additionally, because of the construction of c-Si-based PV panels, the general public is not likely to come into direct contact with the c-Si compound nor any of the solder from a solar farm. A typical c-Si-based PV panel consists of a nonreactive backing (typically aluminum), a lower layer of an encapsulant (typically a plastic acetate), the c-Si cells, an upper layer of encapsulant, and a thick sheet of glass, all
completely surrounded by an aluminum frame. This design ensures that the cells and solder are completely encapsulated and protected from rain and other elements that might corrode or damage them, and also means that the general public would not come into contact with any potential toxic elements contained in the panel unless the construction was purposefully ground into a fine dust (National Renewable Energy Laboratory [NREL], 2020).
No emissions of any kind can be generated when using PV panels under normal conditions (NREL, 2003). As an added layer of protection, most ground-mounted, large-scale arrays are enclosed by fencing to prevent the general public and trespassers from coming into contact with the installations, thus preventing unsafe situations (Massachusetts Department of Energy Resources [MassDEP] et al., 2015).
See below for discussion on PV End of Life Disposal and Storage
Summary and ODH Assessment: Information to date does not indicate a public health burden from the use of crystalline silicone (c-Si) in solar farms which are operating under normal conditions. Crystalline silicone itself is nontoxic to humans. While there may be some hazardous chemicals used in the construction of a PV panel, there is not likely to be a completed exposure pathway to the general public given the fact that these substances would be fully encapsulated by non-toxic, nonporous substances like glass and, therefore, are not likely to enter the environment. Fencing around large ground-mounted installations will help prevent contact from trespassers.
Cadmium Telluride
Cadmium telluride (CdTe) is used in thin-film solar cells which form PV panels. Thin-film solar cells are made by depositing a semiconductor material on a supporting material, such as glass or plastic. Although crystalline silicon is used in approximately 95% of PV panels sold today, CdTe is the secondmost common material, representing approximately 5% of the world market (Office of Energy Efficiency & Renewable Energy [EERE], n.d. b).
Cadmium, in pure elemental form, is a toxic heavy metal. Acute inhalation exposure to high levels of cadmium can damage the lungs. Eating food or drinking water contaminated with high levels of cadmium can lead to stomach irritation, vomiting, and diarrhea. Long-term exposure to lower levels of cadmium in air, food, or water leads to a buildup of cadmium in the kidneys and possible kidney damage or disease. Cadmium is classified as a carcinogen by the U.S. Department of Health and Human Services (DHHS) and by the International Agency for Research on Cancer (IARC), and as a probable carcinogen by the US EPA (Agency for Toxic Substances and Disease Registry [ATSDR], 2012a).
Cadmium telluride is an inorganic compound formed of cadmium and tellurium Limited data exists on CdTe toxicology, but it is known to be more stable and less soluble than pure cadmium and is likely less toxic than pure cadmium Additionally, due to CdTe’s high melting point, typical residential fires which burn in the range of 800°C – 900°C are not hot enough to vaporize CdTe which has a melting point of 1041°C with evaporation starting at 1050°C (NREL, 2003). This renders CdTe much more heat resistant than cadmium which has a melting point of approximately 321°C and a boiling point of approximately 675°C (ATSDR, 2012b)
As with c-Si-based panels, because of the construction of CdTe-based PV panels, the general public is not likely to come into direct contact with the CdTe compound from a solar farm. Most CdTe layers in PV panels are about 1 – 3 microns thick; approximately 3 to 9 g/m2 cadmium is contained in a typical CdTebased PV panel with an average of 7 g/m2 per panel, which is less cadmium than is found in a C-sized NiCd rechargeable battery (NREL, 2003). In addition to the amount of CdTe actually used in PV panels being relatively small, the surface containing CdTe is fully encapsulated or “sandwiched” between a nontoxic aluminum backing and thick glass (or plastic) panes (Office of EERE, n.d. a), meaning that direct contact with the cadmium compound is not possible unless a panel is purposely ground into a fine dust No emissions of any kind can be generated when using PV panels under normal conditions (NREL, 2003). As an added layer of protection, most ground-mounted, large-scale arrays are enclosed by fencing to prevent the general public and trespassers from coming into contact with the installations, thus preventing unsafe situations (MassDEP et al., 2015).
See below for discussion on PV End of Life Disposal and Storage.
Workers in PV panel production facilities and other industrial processes using CdTe are more likely to be exposed to cadmium and its compounds through contaminated air and by accidental ingestion from hand-to-mouth contact than the general public. The National Institutes of Health, in its Laboratory Chemical Safety Summary for CdTe, classifies CdTe as an irritant and issues the Warnings “Acute toxicity, oral”, “Acute toxicity, dermal”, and “Acute toxicity, inhalation” (NCBI, n.d.). Note: “Warning” and “Danger” are signal words used to indicate the relative level of severity of a hazard for a given chemical. “Warning” is considered to be less severe than “Danger” (Occupational Safety and Health Administration [OSHA], 2013).
Summary and ODH Assessment: Information to date does not indicate a public health burden from the use of cadmium telluride (CdTe) in solar farms operating under normal conditions While more information is needed to understand the toxicity of CdTe, there is not likely to be a completed exposure pathway to the general public given the fact that the small amount of CdTe used in the PV panels is fully encapsulated by non-toxic, nonporous substances like glass and, therefore, is not likely to enter the environment. Security measures such as fencing around large ground-mounted installations will help prevent contact from trespassers.
There is a higher health risk for workers in facilities that use CdTe for manufacturing or processing. Employers should follow OSHA and National Institute for Occupational Safety & Health (NIOSH) regulations for providing personal protective equipment to workers and for maintaining a healthy workplace.
Photovoltaics (PV) End of Life Disposal and Storage
An average PV panel will last for 20 to 30 years after initial installation, after which it will be decommissioned for reuse, recycling, or landfill disposal (MassDEP et al., 2015). For those indicated for landfill disposal, there is ongoing discussion about whether PV panels should be classified as hazardous or non-hazardous waste.
Internationally, to determine whether a PV panel should be classified as hazardous or non-hazardous waste, the results of leaching tests are heavily relied upon (International Renewable Energy Agency [IRENA], 2016). These tests are designed to observe how crushed or broken pieces of PV panels behave when submerged in a liquid for a defined period of type, after which the liquid can be tested to determine whether any toxic chemicals are “leaching” from the fragments into the liquid According to the Federal Resource Conservation and Recovery Act (RCRA), most modern PV panels pass a test known as the Toxic Characteristic Leaching Procedure (TCLP), a test designed to simulate landfill disposal and determine the risk of leaching of hazardous materials (e-CFR, 2021; NC Clean Energy Technology Center, 2017). Additional research from Japan has also indicated that, even following catastrophic events including earthquakes, fires, and tsunamis causing damage to PV panels, it is unlikely that cadmium leached from CdTe-based panels will cause increases in air and seawater levels high enough to exceed environmental regulation values (Matsuno, 2013).
However, it is possible that some types or brands of PV panels will be considered hazardous wastes while others will not. Some older silicon-based panels may have been produced using lead or hexavalent chromium. Simply knowing that the PV panel is crystalline silicone- or CdTe-based is not an indicator of whether or not the panel should be considered a hazardous waste without conducting testing (DEPARTMENT OF TOXIC SUBSTANCES CONTROL [DTSC], 2021).
As an alternative to disposing of PV panels in landfills, decommissioned panels may be either recycled or repaired/refurbished and reused. According to the National Renewable Energy Laboratory, reusing modules is conceivable, but practically and economically challenging, and recycling processes for thinfilm PV and crystalline silicon-based PV panels remains underdeveloped in the US. However, recycling PV panels allows for the recovery of both precious and toxic materials used in PV panels, including glass, metals and semiconductor materials which may lower the environmental burden of extracting and refining new mineral resources (NREL, 2019)
Summary and ODH Assessment: To prevent public health risks, ODH recommends that solar panel end of life disposal and storage plans be considered during the application and review process for new solar farms, and again during the decommissioning of solar farms. The determination of whether a solar panel is to be classified as hazardous or non-hazardous waste should be carried out on a case-by-case basis for each solar farm or array undergoing decommissioning.
Regardless of whether a panel marked for decommissioning is to be considered hazardous or nonhazardous, ODH recommends that retired panels marked for disposal be sent to an engineered landfill with various barriers and methods designed to prevent leaching of materials into soils and groundwater.
Both recycling and reusing panels (with or without repairing/refurbishing) will help to keep panels and potential hazardous materials out of landfills and creates less demand for the extraction and refining of new mineral resources which may have ecological and subsequent public health impacts. More research is needed to fully understand the benefits of recycling solar panels.
Heat
Recent studies have shown that large-scale solar arrays may increase surrounding ambient air temperatures by as much as 4°C* when compared to more distal air temperatures (Barron-Gafford, G. et al., 2016). This phenomenon is known as a photovoltaic heat island effect. These heat islands appear to be relatively localized to the solar arrays with temperatures cooling to ambient temperature around 300 meters from the perimeter of the array. Additionally, complete cooling of the array at night as well as the presence of buffers such as access roads and shade trees around the perimeter show some protective qualities against the heat island phenomenon (PV Environmental Research Center, 2013). Heat islands are less likely to occur with smaller solar arrays and single panel installations.
(*Note: The study where an increase of 4°C was observed was conducted in an arid desert region of Arizona, which receives significantly more sunlight and achieves higher ambient air temperatures annually than any region of Ohio, which is largely classified as a humid continental climate and receives significantly more rainfall annually, and thus more cloud cover and reduced sunlight Solar arrays in Ohio would not be likely to generate as much of a temperature increase due to these factors.)
Detriments from the heat island effect, if any, are more likely to be ecological in nature. ODH defers to the Ohio Department of Natural Resources and Ohio Environmental Protection Agency for ecological issues.
Summary and ODH Assessment: Information to date does not indicate a public health burden from heat generated by PV panels or from the heat island effect. ODH encourages sufficient setbacks of large-scale solar farms from residential structures to ensure any excess heat generated by PV arrays dissipates. The installation of perimeter access roads and shade trees may also provide some additional protective qualities.
Glare
Because the purpose of PV panels is to trap sunlight, and any sunlight reflected means it cannot be converted into energy, PV modules are purposefully designed to reduce glare using anti-reflective glass (NREL, 2018b). PV panels reflect only about 2 percent of incoming light, so glare from PV modules is rare, and pre-construction modeling can ensure that placement prevents glare. Any light reflected from PV panels will have a significantly lower intensity than glare from direct sunlight reflecting on water or window glass since the vast majority of the incoming light will have been absorbed (MassDEP et al., 2015).
Summary and ODH Assessment: Information to date does not indicate a public health burden from glare caused by solar farms which are operating under normal conditions. Research indicates that glare generated by solar farms is no more than that which is generated by windows and calm bodies of water.
ODH recommends that, when siting for the construction of a solar array, pre-construction modeling should be completed to ensure that the panels are placed such that glare is minimized for surrounding residents and businesses.
Noise
Some components of a solar farm produce noise.
The noisiest component of a solar farm is the inverter which generates a low buzzing sound as it converts the electrical current. PV panels equipped with trackers, which allow the panels to move to “track” the sun across the sky, may also make noise, although fixed panels without these trackers will not include this noise. At utility-scale sites, sound levels along the fenced boundary of solar arrays are generally at background levels with only a faint inverter hum audible. Any sound from the array and equipment is inaudible 50 feet from the boundary (Massachusetts Clean Energy Center [MassCEC], 2012). Studies performed in other cases have found that the cumulative sound produced by transformers and inverters in addition to onsite substations were still well below local restrictive nighttime noise standards (Department of Planning and Land Use [DPLU], 2011).
Some noise will occur during the construction phase of a new solar farm or solar array. This noise is expected to be typical construction noise (i.e., heavy machinery, land grading, etc.) and is temporary and unavoidable The noise generated during the construction of a solar array is expected to be much louder than the noise generated during its typical operation (DPLU, 2011).
Additionally, there may be some amount of noise generated by the upkeep and maintenance of a solar farm, but these are expected to be standard community levels of sound (i.e., lawnmowers, string trimmers or “weed whackers”, etc.) (NREL, 2018a).
Summary and ODH Assessment: Information to date does not indicate a public health burden from noise generated by the typical operation and maintenance of a solar farm. While some noise is anticipated and unavoidable, it is not expected to create off-site health issues.
The inclusion of setbacks from residential areas should help ensure any noise generated by the solar farm has reached ambient levels by the time it nears a residential structure.
ODH recommends that, during construction, operation, and maintenance, state and local construction noise and noise pollution ordinances should be adhered to.
Electromagnetic Fields (EMF)
Non-ionizing, low-frequency electromagnetic radiation, also known as an electromagnetic field (EMF) may be generated by certain components of solar farms, including power lines. However, based on available peer-reviewed literature to date, there are no known health risks that have been conclusively demonstrated to be caused by living near high-voltage power lines.
For more information about EMFs, review the separate document OHIO DEPARTMENT OF HEALTH ELECTROMAGNETIC FIELDS (EMF) SUMMARY AND ASSESSMENTS.
Summary and ODH Assessment: Information to date does not indicate a public health burden from EMFs generated by components, including power lines, at solar farms.
Battery Storage
Energy produced by photovoltaic technologies may be stored in batteries for later offsite use. There are a wide number of battery technologies available today, including lithium ion batteries, lead acid batteries, and sodium sulfur batteries. Toxicity of these batteries varies based upon their design and the chemicals used.
For more information about batteries, review the separate document OHIO DEPARTMENT OF HEALTH BATTERY ENERGY STORAGE SUMMARY AND ASSESSMENTS
Summary and ODH Assessment: Information to date does not indicate a public health burden from the use of most types of batteries under normal operating conditions. Additionally, fencing around large, ground-mounted installations will help prevent contact from trespassers. The toxicity of batteries varies based upon their chemical design and should be considered prior to disposal.
REFERENCES
AGENCY FOR TOXIC SUBSTANCES AND DISEASE REGISTRY (ATSDR). 2012a. Cadmium – ToxFAQs. U.S. Department of Health and Human Services. https://www.atsdr.cdc.gov/toxfaqs/tfacts5.pdf.
ATSDR. 2012b. Toxicological Profile for Cadmium. U.S. Department of Health and Human Services. https://www.atsdr.cdc.gov/toxprofiles/tp5.pdf
ATSDR. 2020. Toxicological Profile for Lead. U.S. Department of Health and Human Services. https://www.atsdr.cdc.gov/toxprofiles/tp13.pdf
BARRON-GAFFORD, G., et al. 2016. The Photovoltaic Heat Island Effect: Larger Solar Power Plants Increase Local Temperatures. University of Maryland. https://doi.org/10.1038/srep35070
DEPARTMENT OF PLANNING AND LAND USE (DPLU). 2011. Noise Assessment, Borrego 1 Solar Project MUP 3300-10-026, Environmental Review Number 10-050-01, APN 140-290-12. County of San Diego. https://www.sandiegocounty.gov/dplu/regulatory/docs/3300-10026_CEQA_PUBLIC_REVIEW_110526/3300-10-026-NR.pdf.
DEPARTMENT OF TOXIC SUBSTANCES CONTROL (DTSC). 2021. Managing Hazardous Waste, Solar Panel FAQs. State of California. https://dtsc.ca.gov/solar-panel-faqs/.
ELECTRONIC CODE OF FEDERAL REGULATIONS (e-CFR). 2021. Subpart B – Criteria for Identifying the Characteristics of Hazardous Waste and for Listing Hazardous Waste. Office of the Federal Register. https://www.ecfr.gov/cgi-bin/textidx?SID=ce0006d66da40146b490084ca2816143&mc=true&node=pt40.26.261&rgn=div5#sp40.2 8.261.b.
INTERNATIONAL RENEWABLE ENERGY AGENCY (IRENA). 2016. End-of-Life Management: Solar Photovoltaic Panels. https://irena.org/publications/2016/Jun/End-of-life-management-SolarPhotovoltaic-Panels
MASSACHUSETTS CLEAN ENERGY CENTER (MassCEC). 2012. Study of Acoustic and EMF Levels from Solar Photovoltaic Projects. Commonwealth of Massachusetts. https://files.masscec.com/research/StudyAcousticEMFLevelsSolarPhotovoltaicProjects.pdf
MASSACHUSETTS DEPARTMENT OF ENERGY RESOURCES (MassDEP) et al. 2015. Questions & Answers: Ground-Mounted Solar Photovoltaic Systems. Commonwealth of Massachusetts. https://www.mass.gov/doc/ground-mounted-solar-pv-guide/download.
MATSUNO, Y. 2013. Environmental Risk Assessment of CdTe PV Systems to be Considered Under Catastrophic Events in Japan. University of Tokyo. https://www.firstsolar.com/-/media/FirstSolar/Sustainability-Documents/Sustainability-Peer-Reviews/Japan_PeerReview_Matsuno_CdTe-PV-Tsunami.ashx.
NATIONAL CENTER FOR BIOTECHNOLOGY INFORMATION (NCBI). n.d. PubChem Compound Laboratory Chemical Safety Summary for CID 91501, Cadmium Telluride. National Institutes of Health. https://pubchem.ncbi.nlm.nih.gov/compound/Cadmium-telluride#datasheet=LCSS.
NATIONAL RENEWABLE ENERGY LABORATORY (NREL). 2003. CdTe PV: Real and Perceived EHS Risks. U.S. Department of Energy. https://www.nrel.gov/docs/fy03osti/33561.pdf.
Page 11 of 12
NREL. 2018a. Best Practices for Operation and Maintenance of Photovoltaic and Energy Storage Systems; 3rd Ed. U.S. Department of Energy. https://www.nrel.gov/docs/fy19osti/73822.pdf.
NREL. 2018b. Research and Analysis Demonstrate the Lack of Impacts of Glare from Photovoltaic Modules. U.S. Department of Energy. https://www.nrel.gov/state-localtribal/blog/posts/research-and-analysis-demonstrate-the-lack-of-impacts-of-glare-fromphotovoltaic-modules.html
NREL. 2019. PV Modules End of Life Management Setting the Stage. U.S. Department of Energy. https://www.epa.gov/sites/production/files/2019-08/documents/heath.pdf
NREL 2020. Crystalline Silicon Photovoltaic Module Manufacturing Costs and Sustainable Pricing: 1H 2018 Benchmark and Cost Reduction Road Map. U.S. Department of Energy. https://www.nrel.gov/docs/fy19osti/72134.pdf.
NC CLEAN ENERGY TECHNOLOGY CENTER. 2017. Health and Safety Impacts of Solar Photovoltaics. NC State University. https://nccleantech.ncsu.edu/wp-content/uploads/2018/05/Health-andSafety-Impacts-of-Solar-Photovoltaics-2017_white-paper.pdf.
OCCUPATIONAL SAFETY AND HEALTH ADMINISTRATION (OSHA). 2013. OSHA Brief, Hazard Communication Standard: Labels and Pictograms. U.S. Department of Labor. https://www.osha.gov/sites/default/files/publications/OSHA3636.pdf.
OFFICE OF ENERGY EFFICIENCY & RENEWABLE ENERGY (EERE). n.d. a. Cadmium Telluride. U.S. Department of Energy. https://www.energy.gov/eere/solar/cadmium-telluride
OFFICE OF EERE. n.d. b. Solar Photovoltaic Cell Basics. U.S. Department of Energy. https://www.energy.gov/eere/solar/solar-photovoltaic-cell-basics
PV ENVIRONMENTAL RESEARCH CENTER. 2013. Analysis of the Potential for a Heat Island Effect in Large Solar Farms. Columbia University. http://www.clca.columbia.edu/13_39th%20IEEE%20PVSC_%20VMF_YY_Heat%20Island%20Effe ct.pdf
MEASURING THE ECONOMIC IMPACTS OF UTILITY-SCALE SOLAR IN OHIO
Ohio University’s Voinovich School of Leadership and Public Affairs conducted a three-scenario economic impact analysis for utility-scale solar energy deployment in the state. Each scenario (Low, Moderate, Aggressive) represents the combination of multiple potential solar projects, sized greater than 50 megawatts (MW), to be constructed in Ohio on a staggered timeframe. Aggregate Lifespan Operations Phase Impacts
What is Economic Impact?
Total Impact Sum of Direct, Indirect, and Induced
Jobs Total Economic Impacts
For every direct construction or operations phase solar job
Multiplier Effect 1 additional job will be supported in the state economy
Lifespan = 40 Years
In the aggressive (7.5 GW) deployment scenario, the energy produced could power all of the households in Columbus, Ohio roughly four times over.
End-of-Life Management for Solar Photovoltaics: Recycling
SEIA PV Recycling Partner Network
SEIA’s PV Recycling Working Group has been actively seeking and developing recycling partners across the U.S since 2016. Over 95% of PV modules deployed in the U.S have been installed since 2012, and such modules will stay in service for more than 25+ years. Nonetheless some waste is generated when panels are damaged during production, shipment or installation, determined to be defective, by weather events, and for warranty-related claims.
SEIA’s National Recycling Program is preparing now for larger volumes of waste to come in future years. Already SEIA’s recycling partners have processed >4M pounds of PV modules and related equipment since the program launched.
While they offer specific benefits to SEIA members, the recyclers provide their services to interested installers, project and system owners, developers, distributors and other parties.
SEIA’s current partners have prior expertise in recycling glass, polymerics, aluminum, scrap metal, and electronics; all of which provide a good foundation for recycling PV modules, inverters, racking systems and other components of a PV system. Our current network partners offer and provide services to SEIA members and industry throughout the U.S. SEIA is continually working to find new partners in more geographies to make recycling more accessible in areas where solar is installed.
The graphic below shows where SEIA’s current partners are located and where we are in process of adding new partners. As we expand our network to more areas, we help partner companies to develop their processes and equipment for our technology. Overall, we aim to add 2-4 new partners yearly and for both new and existing partners to expand their collection and processing locations.
End-of-Life Management for Solar
Photovoltaic equipment and options for first end-of-life stages
Like many other durable products and construction materials, solar equipment can last for decades, particularly with proper maintenance. In some cases, PV modules can be reused or refurbished to have a ‘second life’ generating electricity. The other components of solar systems can also be handled responsibly. Inverters can be recycled as eWaste and racking equipment can be re-utilized with newer technology or recycled like other metals.
SEIA advises manufacturers, system and project owners to consider reuse, refurbishment and / or recycling of first end-of-life PV modules, inverters, racking equipment and associated components when possible.
While most PV panels produced today will have a useful life for decades, there is inevitable waste created during production, when panels are damaged during shipment or installation, determined to be defective, become obsolete or reach their end-of-life. High-value recycling can help minimize lifecycle impacts and recover valuable and energy-intensive materials, thereby increasing sustainability within the PV industry.
PV panels typically consist of glass, aluminum, copper, silver and semiconductor materials that can be successfully recovered and reused. By weight, more than 80 percent of a typical PV panel is glass and aluminum – both common and easy-to-recycle materials. Recycling of solar equipment is increasingly possible as more recyclers accept modules.
Research and development of PV-specific recycling equipment can optimize the recoverability and purity of reclaimed materials. The start-up and support of new organizations will help the industry extend the useful life of existing products while maintaining the quality and safety of the equipment. Working together with stakeholders from all these areas will help inform and develop policy appropriately so that end-of-life management solutions complement the deployment of solar.
SEIA and its members participate in research studies and projects, white papers, collaborative programs and present information, findings and research at stakeholder meetings, conferences and events to keep industry and others updated on our progress in developing end-of-life solutions.
The Solar Industry & U.S. Veterans
Veterans in the Work Force
The Solar Foundation’s 2018 National Solar Jobs Census found the solar industry employed 19,019 veterans throughout the United States, or 7.8% of all solar workers in the nation. This is more than the 6.6% veteran employment percentage of overall workers in the economy.1 Many of these jobs are in the areas of installation, production, manufacturing, sales or management throughout a number of solar companies. While this number is above the national percentage for industry, there is significant room for growth.
SEIA’s Commitment
Since 2015, SEIA has been working to address the challenge that too many of our veterans face at home: finding employment after active duty service. This encouraged the industry to do more for the men and women who serve in our armed forces by promoting more employment opportunities for veterans within the solar industry. SEIA has been taking active steps towards promoting veteran jobs and solar job training for our veterans.
Challenges Facing Veterans
Although there is a push for more veteran job growth within the solar industry, to do this means tackling various challenges that make the transition from active duty to civilian life difficult. The skills that many who have served in the armed forces acquire through their military service can easily be applied to the solar industry. Being able to translate those skills onto a resume or during an interview, however, is a different matter that many veterans struggle with when looking for work post service.
Many veterans learn crafts and technical skills that can benefit the solar industry during their time in active duty. However, veterans also have workforce assets beyond strictly technical skills. The training that veterans receive during their service enables them to both operate on their own and effectively coordinate as part of a team. This, along with their accumulated leadership skills, make many veterans perfect fits for work in the solar industry. It takes a team effort to raise and mount just one panel onto a rooftop, let alone multiple in an array. This is where solar training programs come into play.
“
SEIA has been taking active steps towards promoting veteran jobs and solar job training for our veterans.
The Solar Industry & U.S. Veterans
Solar Programs
Solar training programs allow veterans to receive training in the practical skills needed to work in the solar industry, which can give them an edge when applying for jobs. Through these programs, veterans will gain experience and knowledge of solar energy technologies and solar installation. This coupled with learning how to translate their skills and experiences into assets that will draw company’s attention make for an impressive combination for securing jobs within the industry. Currently there are a number of solar-industry specific programs aimed at integrating veterans into solar jobs. A few well-known initiatives include:
Solar Ready Vets - The Solar Ready Vets program, originally funded by the U.S. Department of Energy Solar Energy Technologies Office, consists of a 6-week training program for service members on military bases before they are discharged. It is an immersion program where they are taught the basics of solar installation, project management, and other industry necessities. The program now runs independently at 10 military bases.2
Solar Opportunities and Readiness - The new U.S. Department of Energy-funded Solar Opportunities and Readiness3 program takes the training a step further to introduce solar-trained, transitioning veterans to available career opportunities directly with the solar industry at job fair events. Launching in late 2019, this program is managed by The Solar Foundation and includes SEIA and The U.S. Chamber of Commerce (Hiring Our Heroes) as partners.
Troops to Solar - This GRID Alternatives program, founded in 2015, is a project funded by a $750,000 grant over the course of a three-year life cycle. The program trains veterans and active duty service members in hands-on solar installation experience and utilizes GRID Alternatives’ connections within the industry to advance in their careers. While it is nearing the end of its term, this program provides a model for others to continue to train veterans for jobs in the solar industry. By the time the program runs its course, it will have trained 1,000 veterans for solar jobs.4
1 The Solar Foundation, 2018 Solar Jobs Census, www.thesolarfoundation.org/national
2 Department of Energy, Solar Ready Vets, energy.gov/eere/sunshot/solar-ready-vets and The Solar Foundation, thesolarfoundation.org/solar-ready-vets2/
3 Department of Energy, Solar Opportunities and Readiness (National Solar Jobs Accelerator), energy.gov/eere/solar/seto-fy2018-workforce-initiatives
4 GRID Alternatives, Troops to Solar Initiative, http://www.gridalternatives.org/programs/workforce-development/troops-solar-initiative
5 Veterans in Solar Jobs by Sector Graph taken from the Solar Foundation’s Veterans In Solar: Securing America’s Energy Future Report, 2014.
Solar & Multiuse Farming
Co-locating Utility-scale Solar with Livestock & Pollinators
Solar development and agricultural use can exist not only side-by-side, but increasingly are found together.
• A farmer can add solar to their property and get steady income from a land or rooftop array
• Solar energy facilities can also collaborate with local farms and bee-keeping organizations to incorporate pollinator friendly plants and bee hives onto their sites.
• Responsible solar development could improve soil health, retain water, nurture native species, produce food, and provide even lower-cost energy to local communities
• Sheep farmers have opportunities to contract for vegetation management of solar sites and thus increase farm viability
Benefits to Farmers
According to a study conducted by Cornell University in 20183 and a study from the National Renewable Energy Laboratory in 2016,4 co-location and solar grazing bring net positive benefits for farmers, in the form of hundreds of dollars per acre each year in additional income, and solar sites, through increased energy production and reduced maintenance expenses.
Farming is an extremely low-margin, competitive industry. If a farmer can add solar to their property and get steady income from a land or rooftop array, it can enable them to keep their farm.1 Steady income from solar projects means that farmers are less vulnerable to fluctuations in market prices on their products. Especially for larger solar projects, local government and communities benefit from collected taxes and localized spending.
“Solar grazing” is a method of vegetation control for solar sites that utilizes livestock, primarily sheep.2 While solar grazing is currently in pilot phases on various sites, it is increasing in popularity. Solar companies can contract with local farmers, resulting in a relationship that is financially beneficial for both farmers and solar developers. Properly installed systems are benign to nearby animals. 34
2 Various livestock, and sheep in particular, may be sensitive to the preexisting mineral contents of the soil, and proper soil testing should always be done prior to grazing.
3 Kochendoerfer, N. Hain, L., Thonney, M.L. (2018) The Atkinson Center for a Sustainable Future at Cornell University https://www.solargrazing.org
Solar energy facilities can also collaborate with local farms and bee-keeping organizations to incorporate pollinator friendly plants and bee hives onto their sites There are many benefits to combining solar facilities with pollinator habitats:5
• Using one large solar field or perimeter screening area is akin to planting thousands of backyard pollinator gardens, which ultimately increases the productivity of farmland for miles around the facility.
• Planting native pollinator habitats reduces waste water runoff, and pollinator-friendly vegetation management practices, including minimal use of pesticides, results in more stable bee populations, benefiting farmers in the surrounding area.
Solar Projects Can Improve Biodiversity
Solar farms can support a greater diversity of plants as well as greater numbers of butterflies and bees, particularly under management which focuses on optimizing biodiversity when compared to equivalent agricultural land. This increase in plant and invertebrate availability may lead to more opportunities for foraging birds in terms of invertebrate prey and seed availability.6 When joint solar and vegetation designs are developed together, the benefits achieved can be maximized.7
Solar Installations Could Be Win-Win-Win for Food, Water, and Renewable Energy
Responsible solar development could improve soil health, retain water, nurture native species, produce food, and provide even lower-cost energy to local communities. The Department of Energy’s (DOE) Innovative Site Preparation and Impact Reductions on the Environment (InSPIRE) project brings together researchers from DOE's National Renewable Energy Laboratory (NREL), Argonne National Laboratory, universities, local governments, environmental and clean energy groups, and industry partners to better understand how to maximize local benefits.8
At several InSPIRE sites, local beekeepers and university and national laboratory researchers are tracking their bees' visits to the pollinator-friendly vegetation under the solar panels. The goal is to determine how vegetation at solar sites can benefit insect populations and to understand the extent to which pollinator-friendly solar installations can boost crop yields at surrounding farms.
6 Montag, H., Parker, G., Clarkson, T. (April 2016). The Effects of Solar Farms on Local Biodiversity: A Comparative Study.
7 Macknick, J., NREL (June 2016) Overview of opportunities for co-location of agriculture and solar PV
8 https://www.nrel.gov/news/features/2019/beneath-solar-panels-the-seeds-of-opportunity-sprout.html and https://openei.org/wiki/InSPIRE
Photo: SouthHill Community Energy
Photo Credit: Pine Gate Renewables, North Carolina
Solar’s Impact on Rural Property Values
By ASFMRA
Press posted 02-15-2021 10:23 PM 0 RECOMMEND
The difference that experience makes when it comes to the perceived and actual impacts of solar on nearby property values.
In recent years, publicity surrounding solar farms has gained the attention of property owners and appraisers. As with any large-scale development, the change represented by utility-scale solar can be cause for concern. Naysayers express worries involving impacts to viewshed, drainage problems, the idea of replacing productive agricultural lands with an industrial use, and more. Much of this worry comes back to one thing: the potential impact on property values.
A recently completed study from the University of Rhode Island looked at 400,000 transactions in New England over the course of 15 years, finding that suburban residential property values suffered negative impacts when nearby solar farms replaced resources perceived as scarce, such as green space. On the other hand, this same study found no associated impact on property values for solar farms located in rural areas.
Meanwhile, a survey by the University of Texas at Austin asked 37 appraisers a series of questions about property value impacts based upon proximity to utility-scale solar projects. On average, the surveyed appraisers believed that there was a negative relationship between solar farms and nearby property values, though the appraisers with strong negative opinions also answered “No” when asked whether they had prior experience assessing property located near large solar installations. Dr. Varun Rai, who led the study, stated that the results "suggest that experience assessing near a solar installation is associated with a much less negative estimate of impact.” He also noted that “the median and mode of all estimates of impact was zero, suggesting negative estimates from a few respondents were pulling down the mean.”
Patricia McGarr, who serves as the National Director of CohnReznick Advisory's Valuation Practice, has conducted a number of property value impact studies involving solar, and spoke on the subject at the ASFMRA Illinois Chapter’s Annual Meeting in 2019. McGarr’s studies found no consistent negative impact on residential property value that could be attributed to nearby solar farms. She also asserted that township and county assessors have tremendous amounts of data that point in the same direction.
McGarr referenced the 1,000-acre “North Star” solar project located in Chisago County, Minnesota. There, the county assessor found no adverse impact on nearby property values, noting, "It seems conclusive valuation hasn’t suffered.”
McGarr has attended many public hearings on proposed solar developments and listened to residents taking issue with the idea of putting good farm land out of production and potential impacts to viewsheds and drainage tiles. “Owners of transitional ag lands, or lands that are in the path of development, are concerned about any changes that could have future impacts on sale values,” she explained.
But McGarr believes solar developers are addressing these issues. It's now common practice for developers to include vegetative screening as a visual buffer between solar farms and adjacent properties to account for aesthetic concerns. In regards to drainage, developers are “conducting drainage tile studies and being vigilant […] so that they don’t reroute the drainage.”
“Solar is an interim use,” McGarr added. “There are no contaminants and the land sits fallow, allowing the soil quality to improve. It’s not like you’re paving things over.”
Donald Fisher, ARA, served six years as Chair of the ASFMRA's National Appraisal Review Committee and 19 years as Chair of the Editorial Committee. Donald is the Executive Vice President of CNY Pomeroy Appraisers, and has done several market studies examining the impact of solar on surrounding residential values.
“Most of the locations were in either suburban or rural areas, and all of those studies found either a neutral impact or, ironically, a positive impact, where values on properties after the installation of solar farms went up higher than time trends,” he explained.
According to Fisher, solar development has begun to compete with rural residential development and Concentrated Animal Feeding Operation (CAFO) farmers seeking new acreage. “In certain markets,” he said, “the solar developers are paying as much as rural residential developers and CAFO farmers.”
Howard Halderman, AFM, President and CEO of Halderman Real Estate and Farm Management, attended a recent solar talk hosted by the Indiana Chapter of the ASFMRA. Halderman’s takeaway was that properties immediately adjacent to a solar farm may see a negative impact, but tactics to hide the solar farm from view could help offset those effects.
Halderman believes that other rural properties would likely see no impact, and farmers and landowners should even consider possible benefits. “In some cases, farmers who rent land to a solar company will insure the viability of their farming operation for a longer time period. This makes them better long-term tenants or land buyers so one can argue that higher rents and land values will follow due to the positive economic impact the solar leases offer,” he explained.
Rich Kirkland, who owns Kirkland Appraisals in Raleigh, North Carolina, began exploring solar a little over a decade ago, or as he puts it, “right around the whole recession period, when solar really began to take off around here.”
Since then, Kirkland has prepared property value impact studies for solar developers in 19 states, performing nearly 100 matched-pair analyses along the way. In a large majority of those comparisons, he observed a -5% to 5% difference in square-foot sales prices, a range that he describes as statistically insignificant.
“If you take all of those matched-pairs and average them out, you’ll find a difference of about 1%. That’s not enough to make a claim on,” he says.
Similar to Halderman, Kirkland believes that issues can arise if a solar development is situated too close to a property, or if nothing is done to conceal it from view. However, he concluded, “In rural and suburban areas, I’m not finding any consistent negative impact from solar farms as long as there’s at least 100 feet between the [solar] farm and the property, and enough landscaping to hide the panels.”