1_Mykolaiv Concept Masterplan: Detailed Analysis and Assessment
ENHANCING
URBAN PLANNING
IN THE CITY OF MYKOLAIV
CONCEPT MASTERPLAN
OUTPUT 1
DETAILED ANALYSIS AND DAMAGE ASSESSMENT
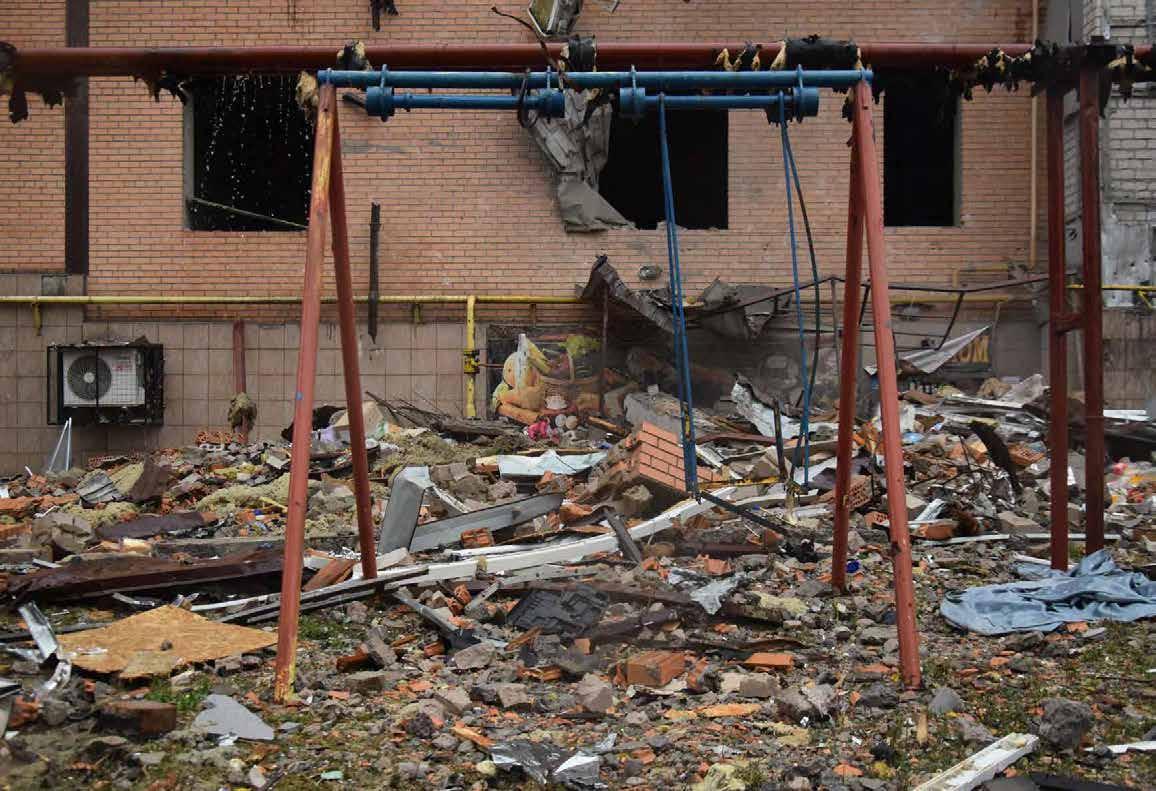
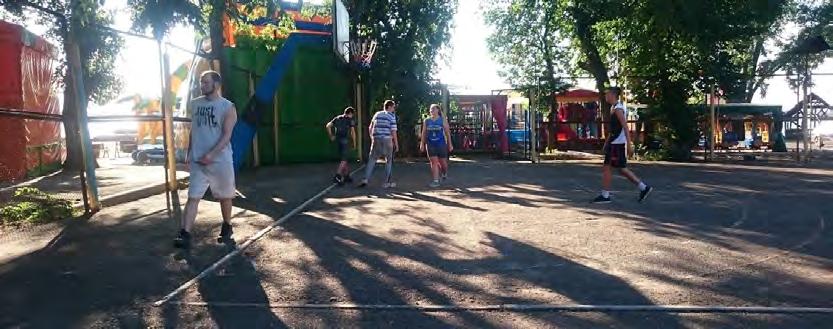
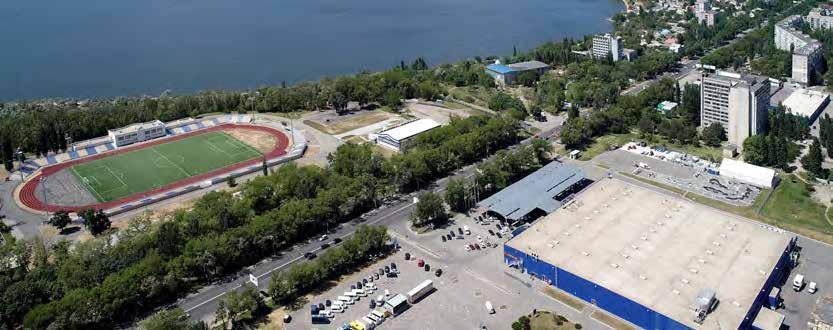
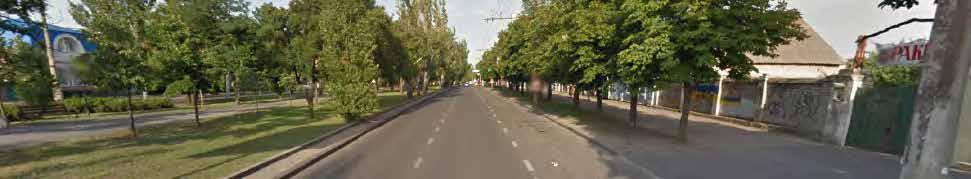
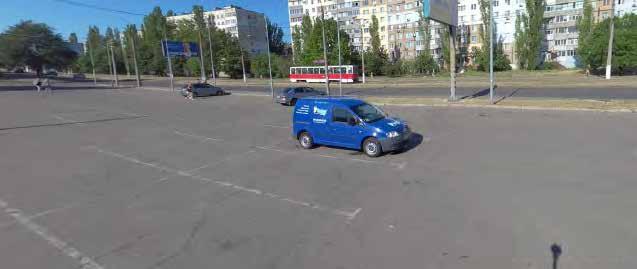
Photo: Alexander Minyaylo
Photo: Alexander Minyaylo
ENHANCING
URBAN PLANNING IN THE CITY OF MYKOLAIV
CONCEPT MASTERPLAN OUTPUT 1 DETAILED ANALYSIS AND DAMAGE ASSESSMENT
This publication was developed within the UN4UkrainianCities Projectentitled "Development Pilot Porjects to support implementation of the reconstruction Master Plan for the city of Mykolaiv, Ukraine."
This project is implemented by UNECE, funded by the German Federal Ministry for Economic Cooperation and Development (BMZ) and supported by the Deutsche Gesellschaft für Internationale Zusammenarbeit (GIZ).
CHAPTER 1 /
Introduction
CHAPTER 2 /
2
1
Quantitative
Micro-Scale
CHAPTER 3 /
3
Benchmarks:
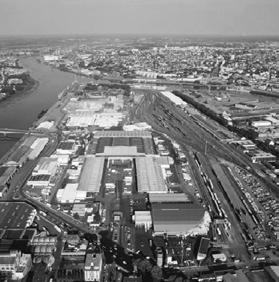
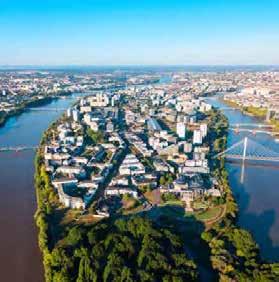
Benchmarks: Cities Facing a Population Shrink
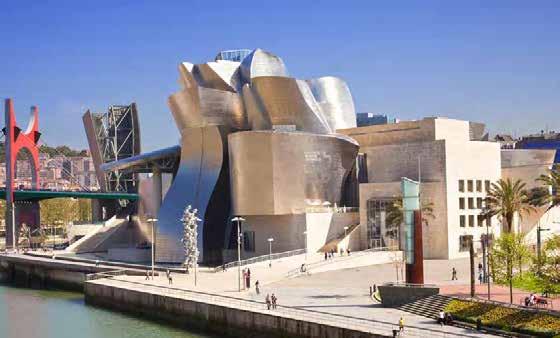
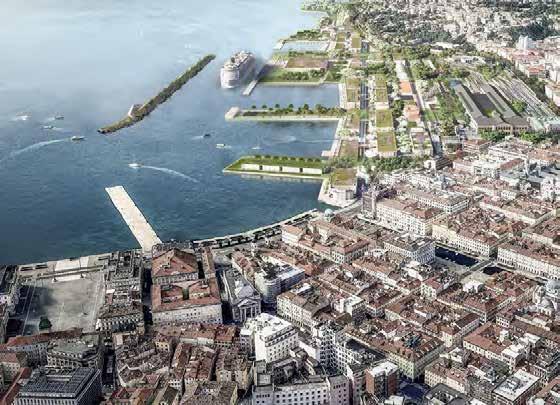
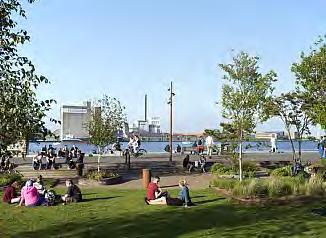
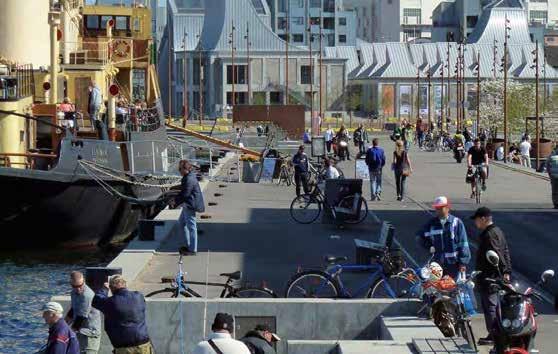
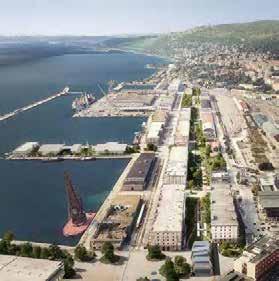
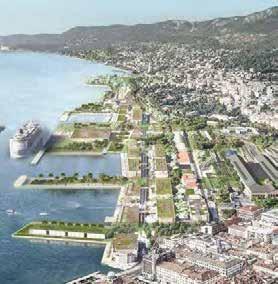
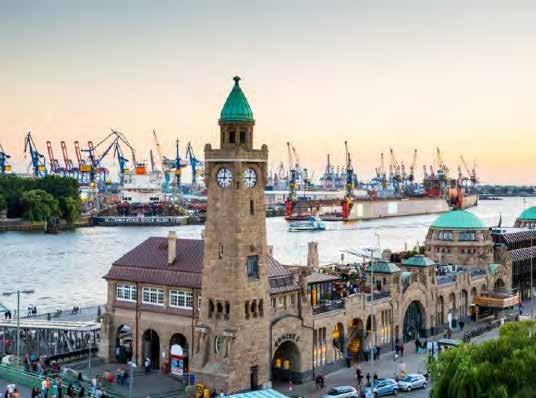
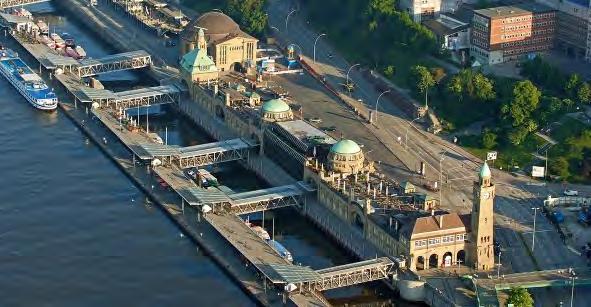
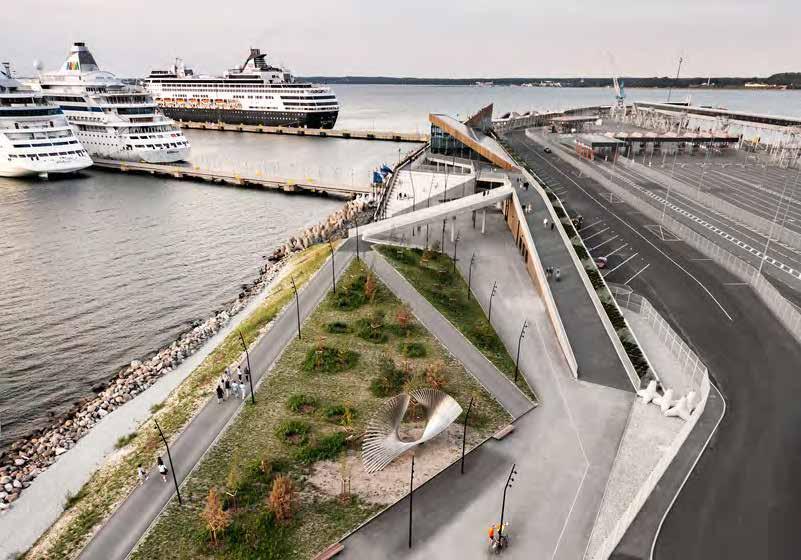
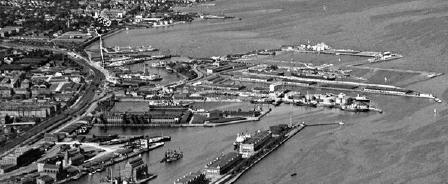
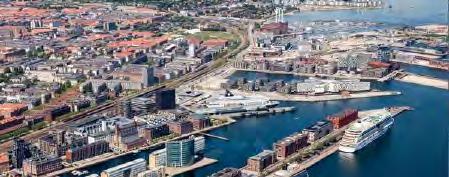
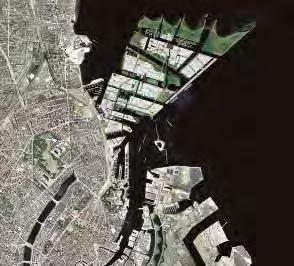
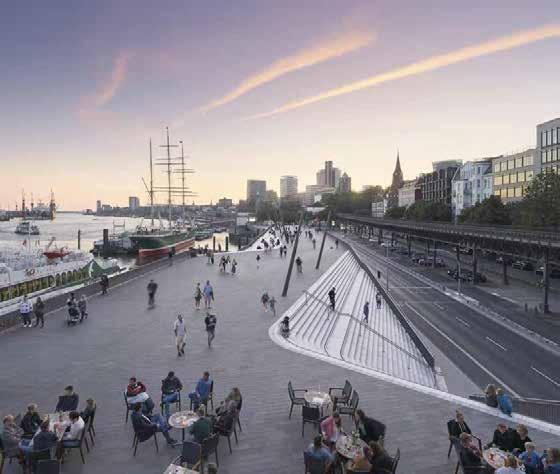
Benchmarks: Port Cities
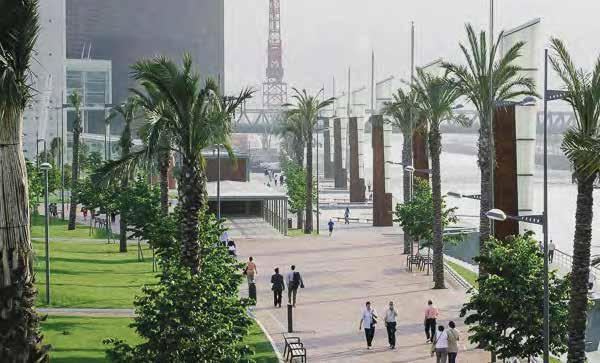
Benchmarks: Landscape Strategies /
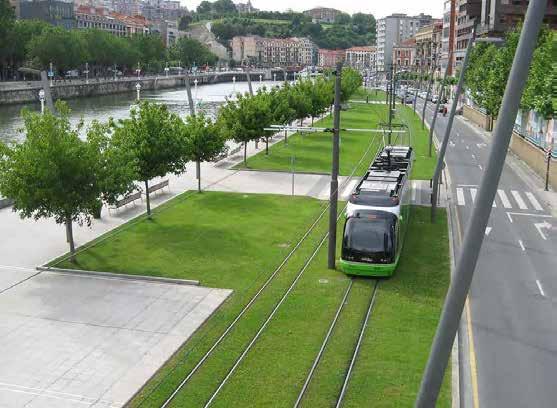
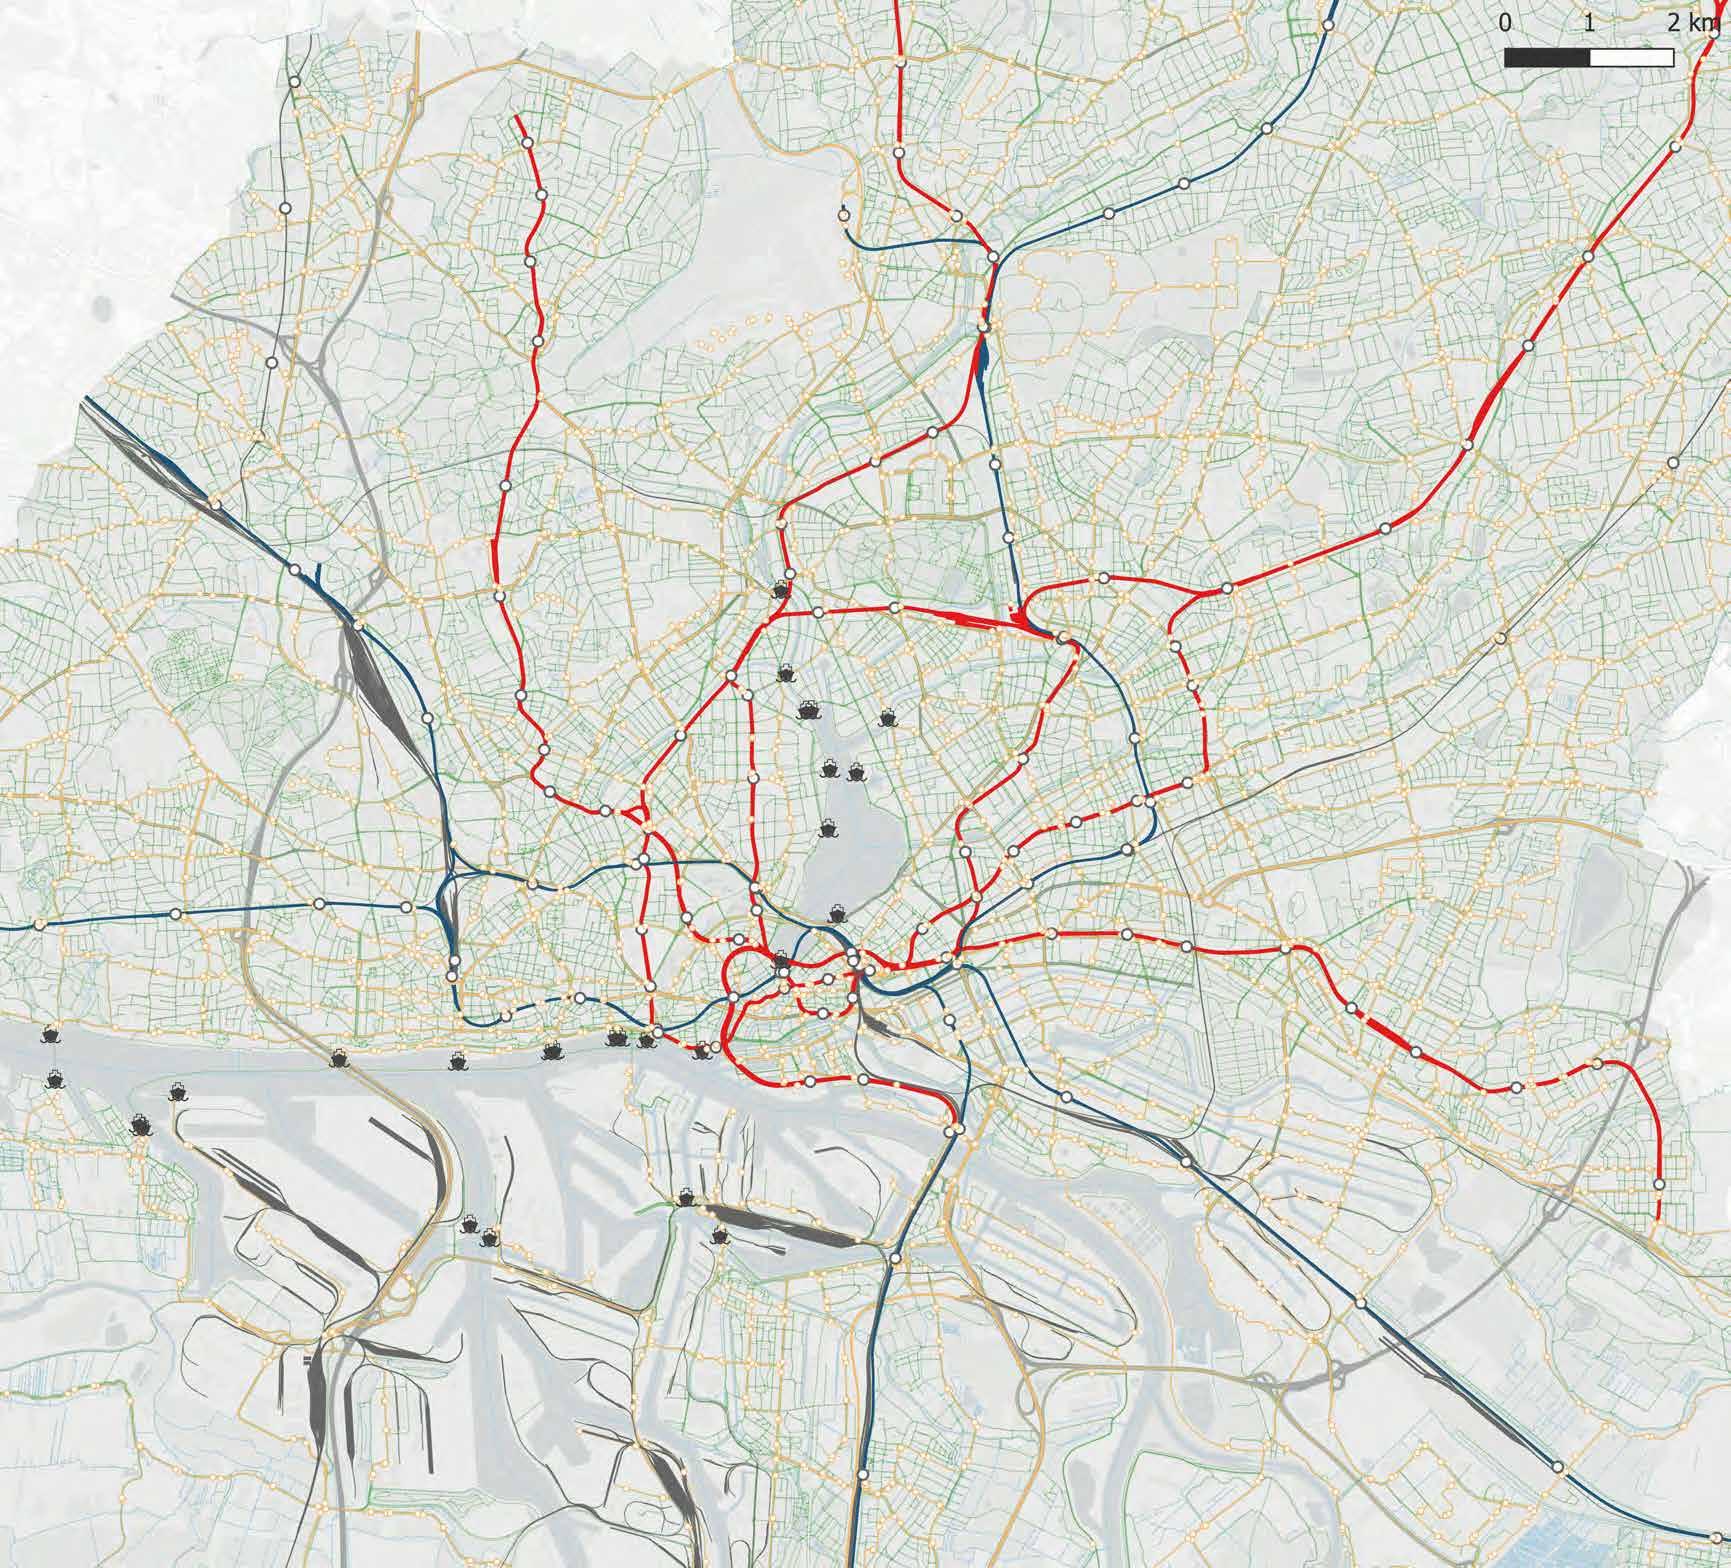
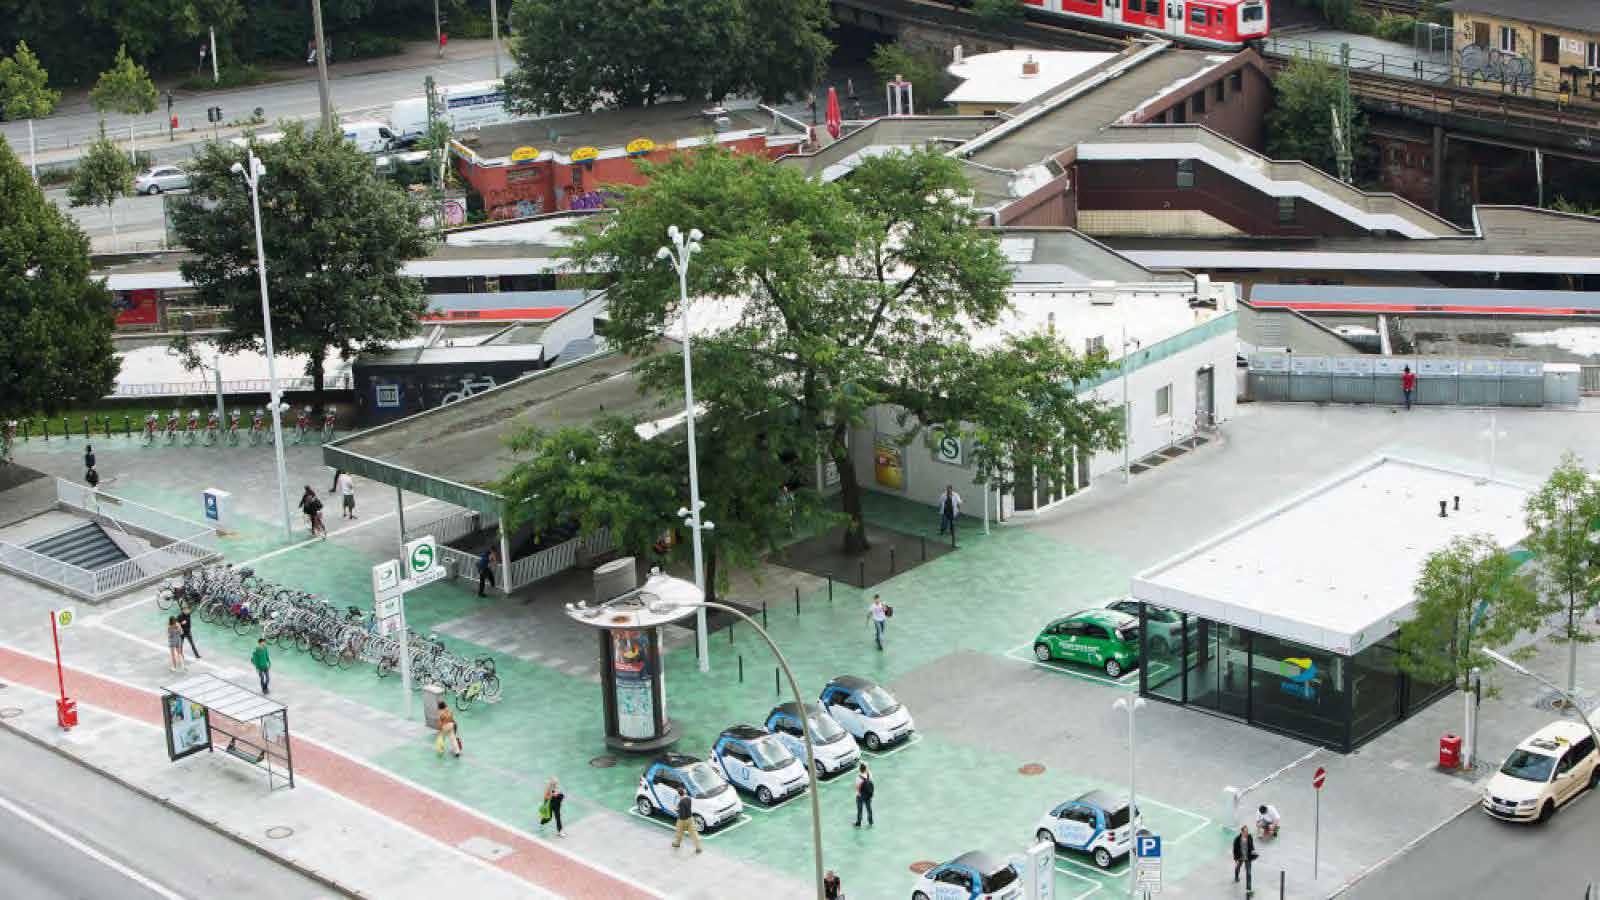
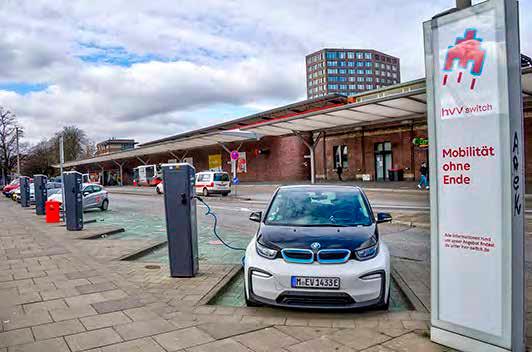
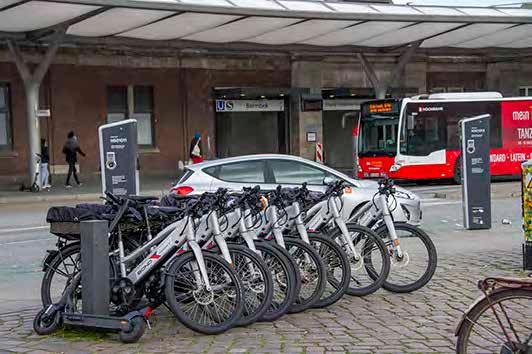
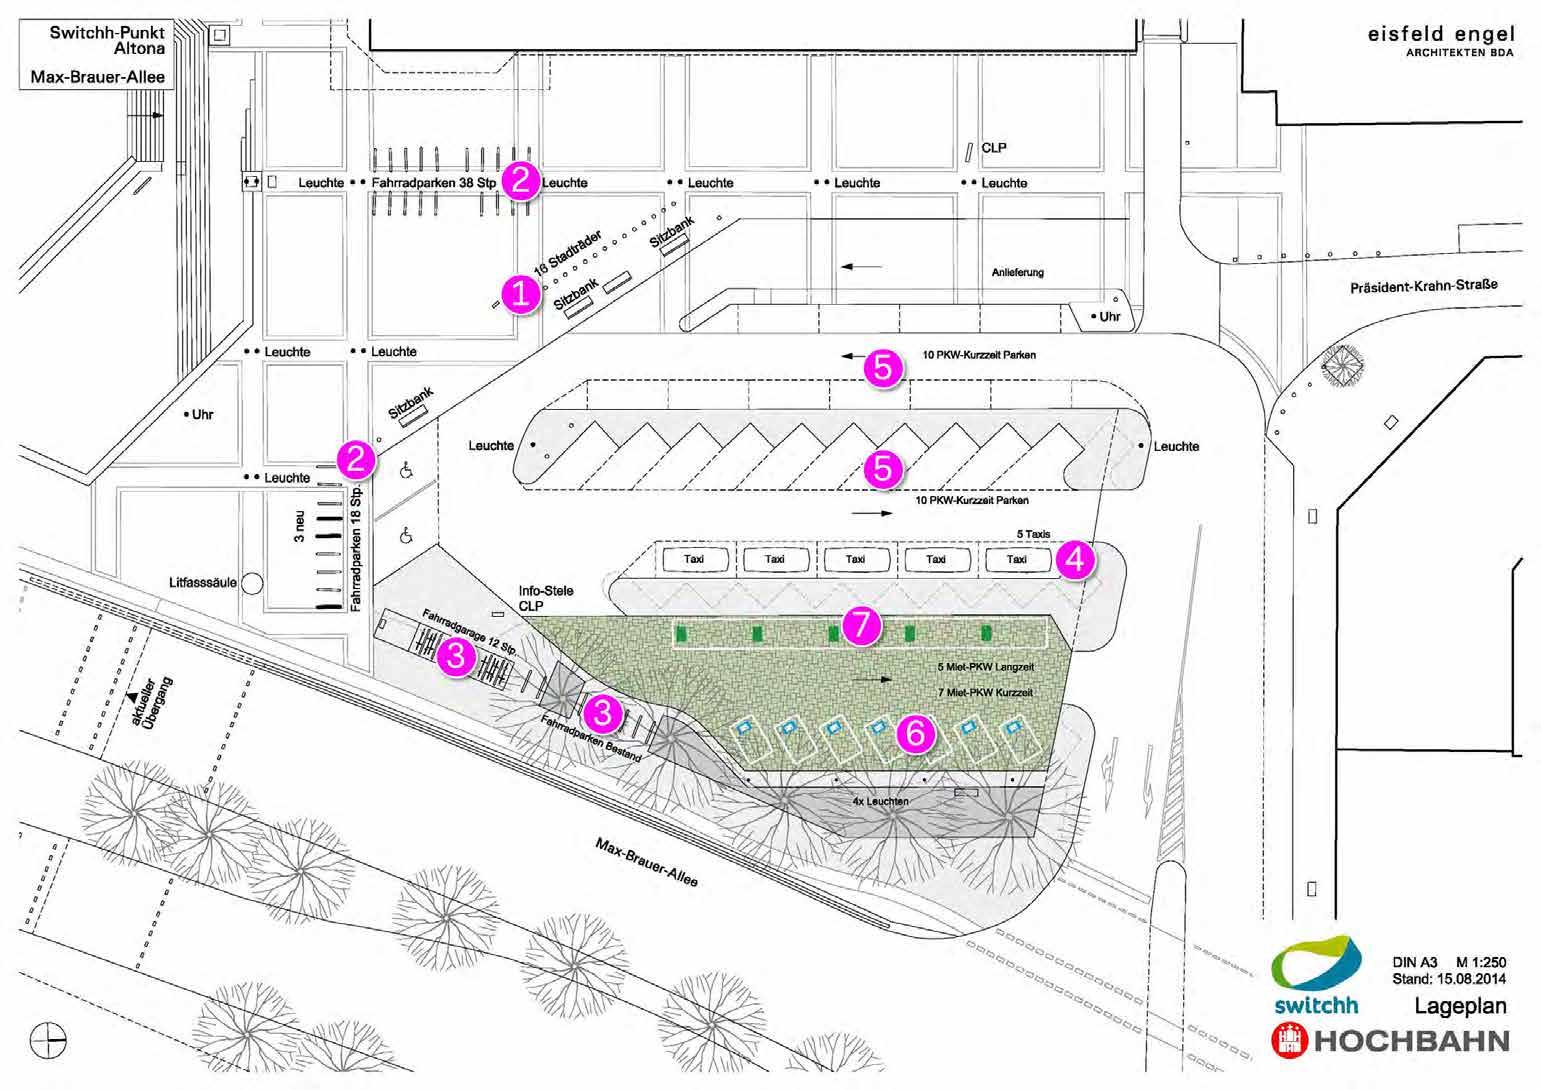
Benchmarks: Sustainable Mobility /
CHAPTER 4 /
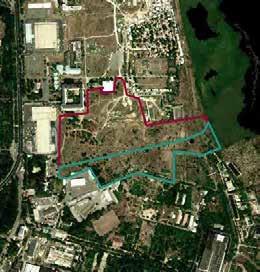
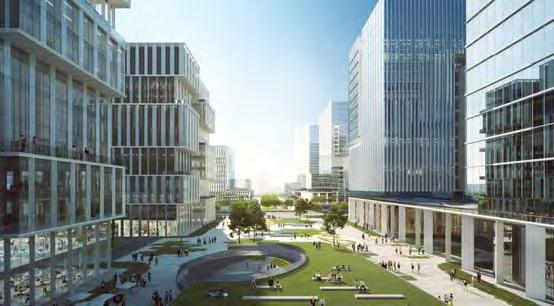
Pilot Projects: Innovation District Site Selection
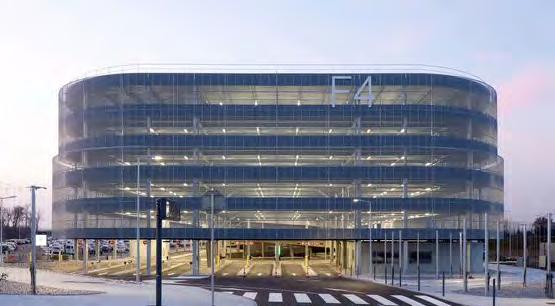
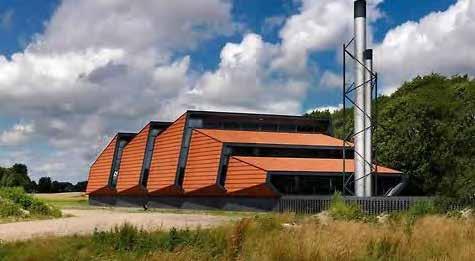
Pilot projects: Five Benchmark Developments
Innovation District: Benchmarking and lessons
Innovation District - Site
CHAPTER 7 /
7
Community Engagement
Enhancing Urban Planning in the city of Mykolaiv: Concept
Executive Summary
The Oneworks Foundation has been appointed to lead a multidisciplinary team, with the purpose of developing a sustainable vision for the City of Mykolaiv.
Spanning from demographic projections to landscape and traffic strategies, these studies will pave the road for "building back better", and support the Municipality in addressing criticalities as well exploiting opportunities, while engaging with the local community.
This report summarises months of analysis on the city pre-conflict and current conditions. As a first step in the development of a concept master plan for the city, this document will be followed by further studies that will guide subsequent phases of the rebuilding process.
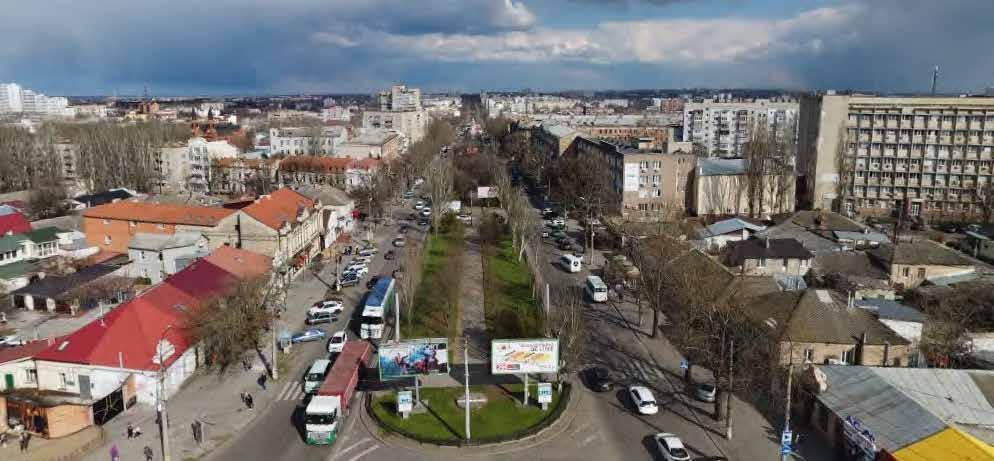
Photo: Alexander Minyaylo
Introduction
Вступ
Enhancing Urban Planning in the city of Mykolaiv: Concept Masterplan
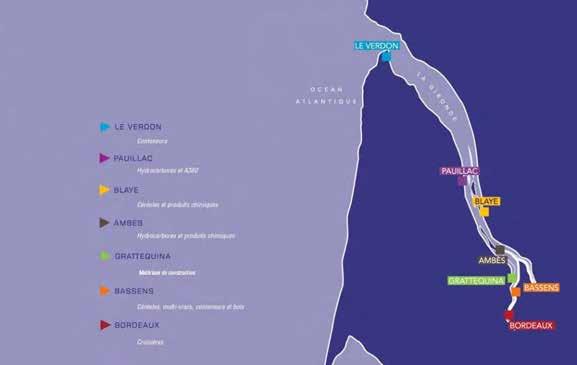
Mykolaiv: a key access point to the Black Sea Миколаїв:
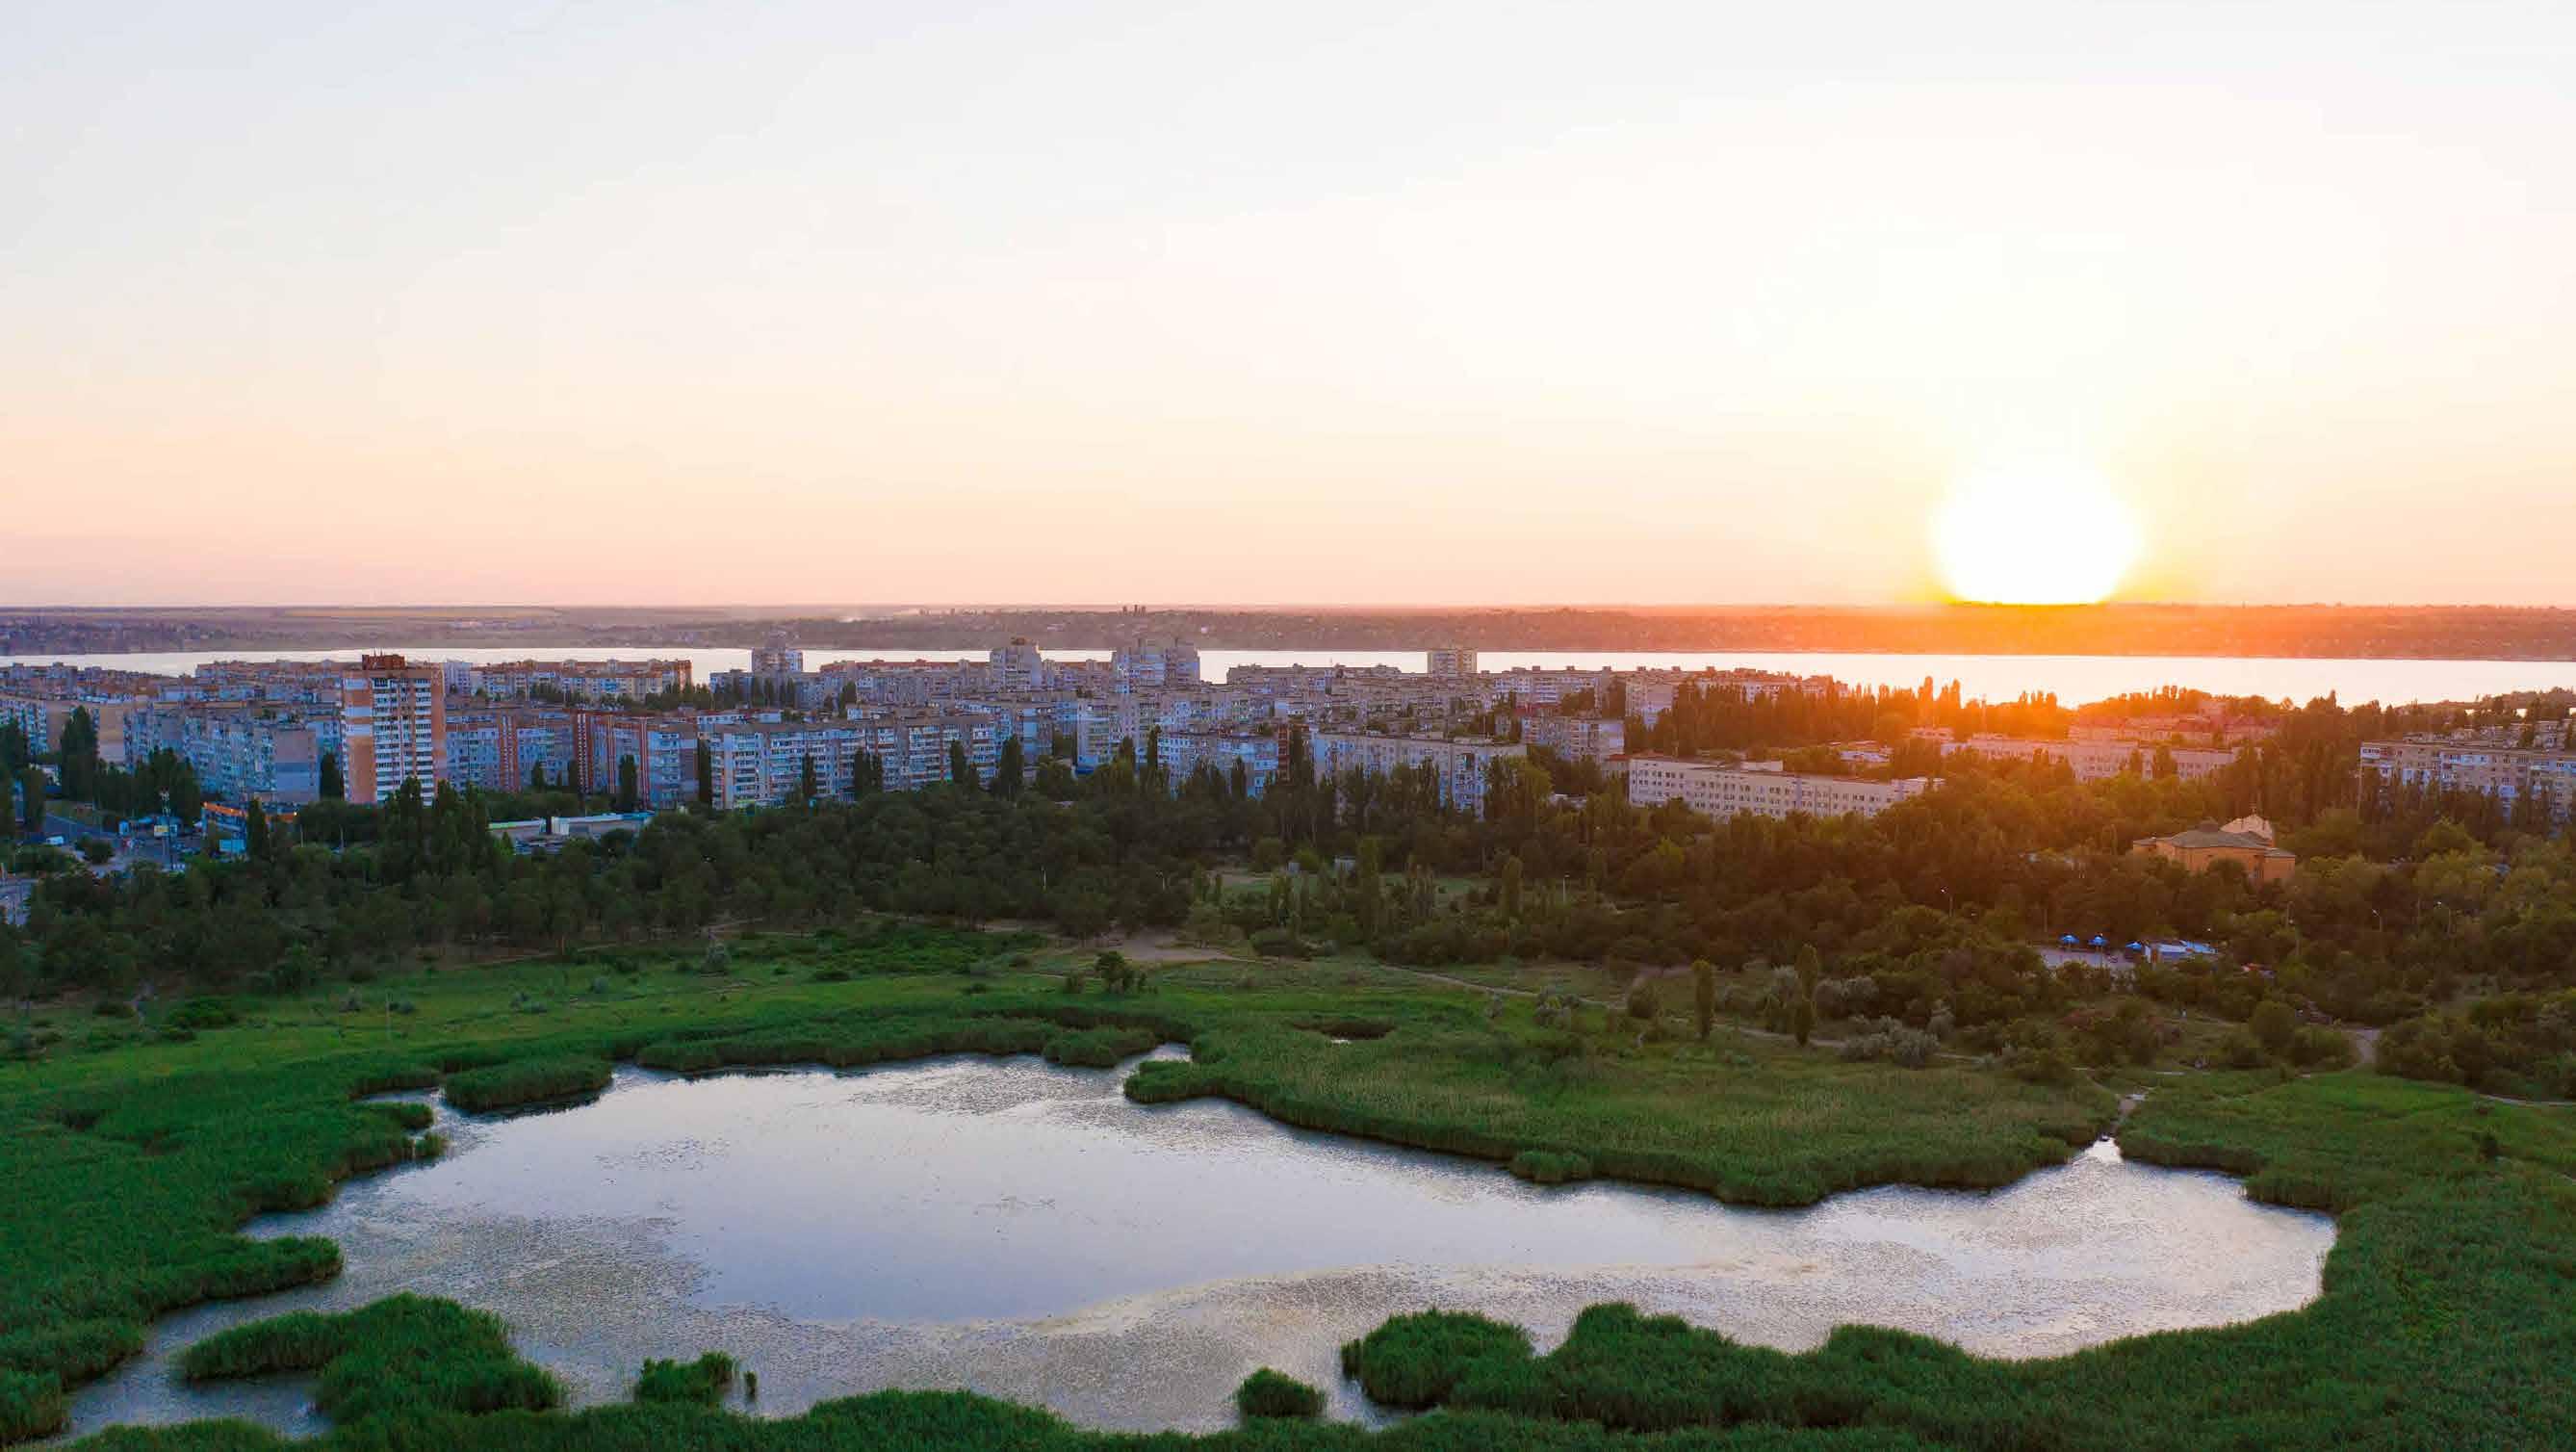
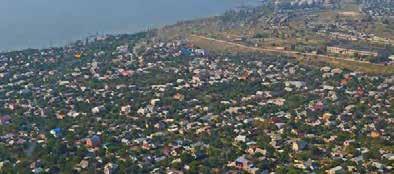
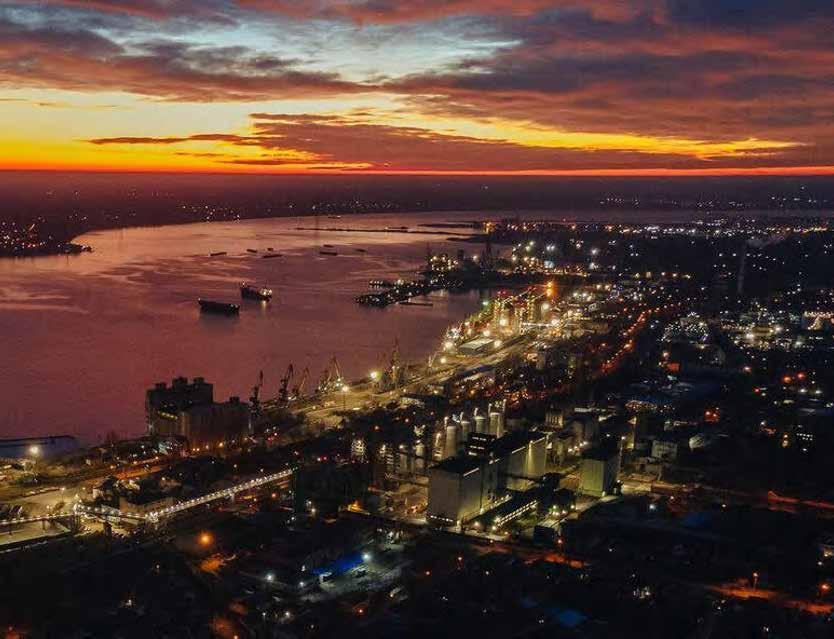
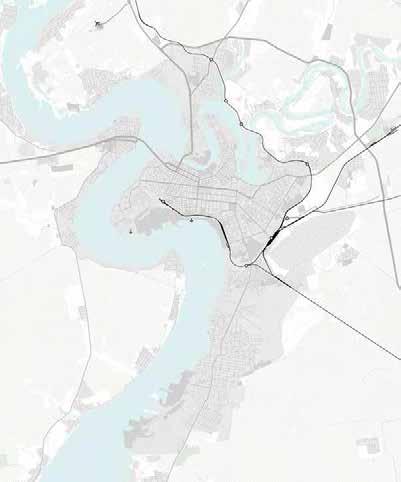
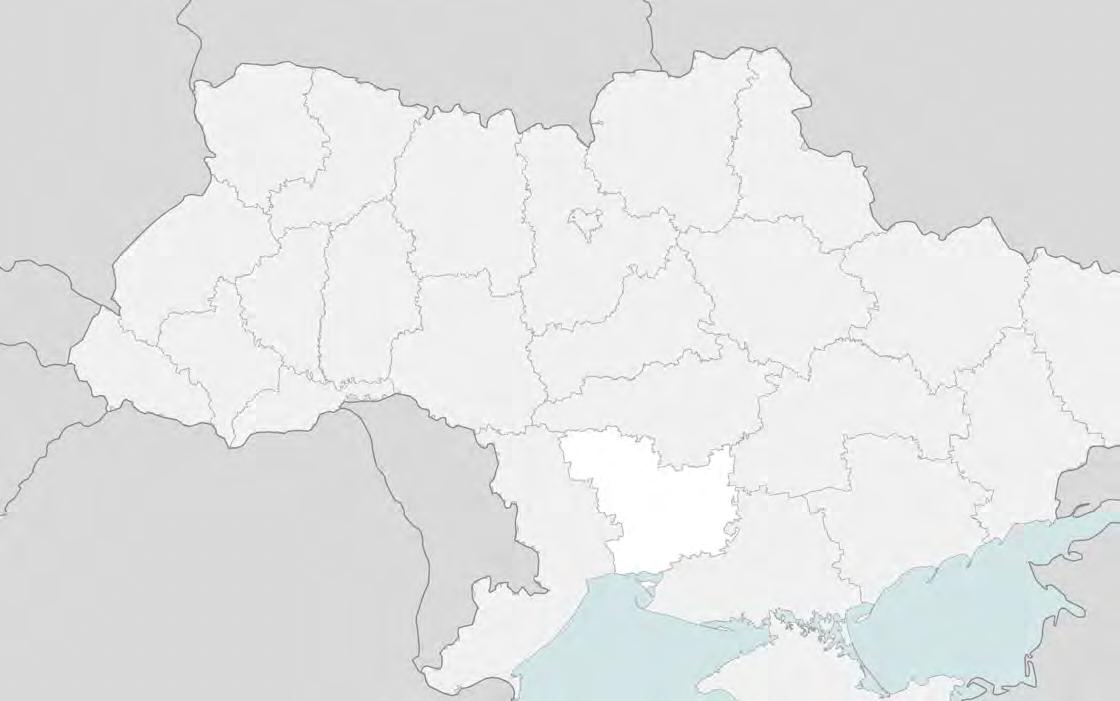
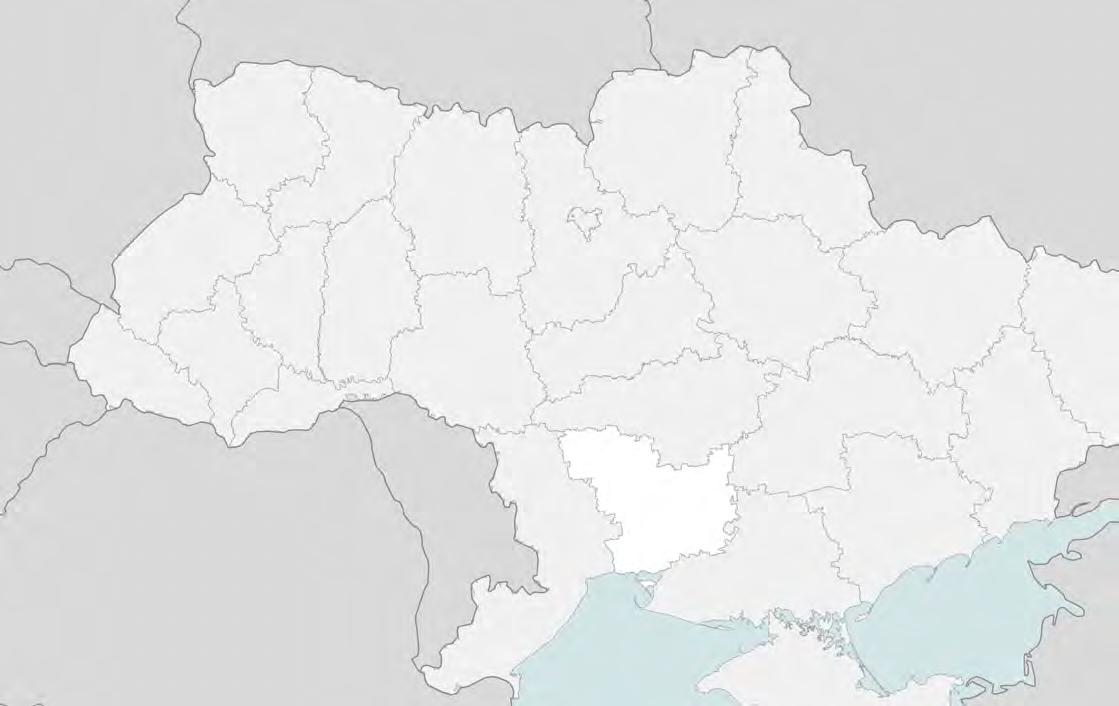
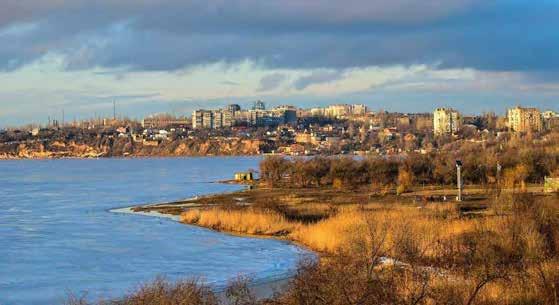
Located in southern Ukraine, in its pre-conflict condition Mykolaiv had more than 450,000 inhabitants, and as such was the ninth largest city in Ukraine.
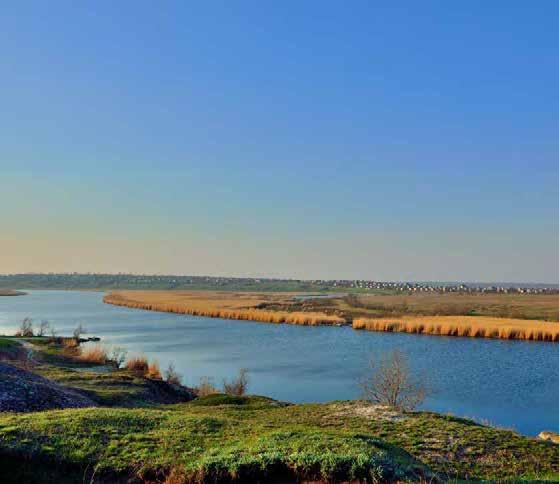
The city lies along the estuary of the Southern Bug River, in close proximity to the Black Sea.
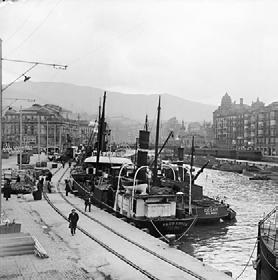
Mykolaiv was founded in 1789 as a naval base, after the Russian annexation of the Black Sea coast. In 1862, a commercial harbor was opened, and in 1873 a railway was built to serve the port.
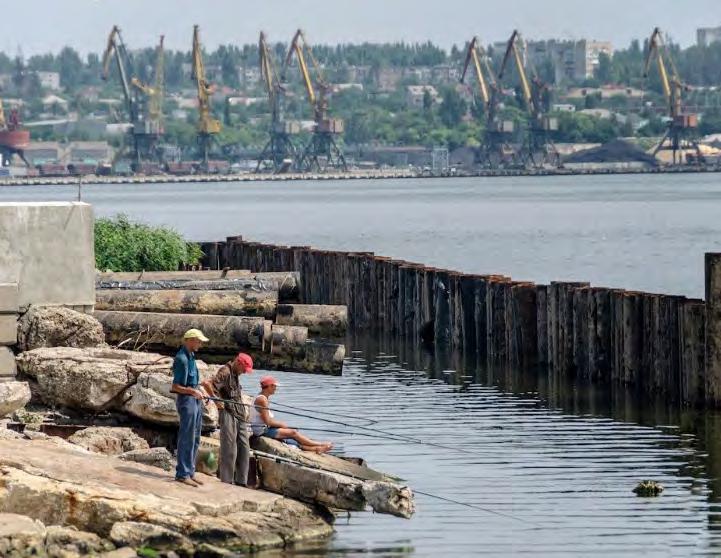
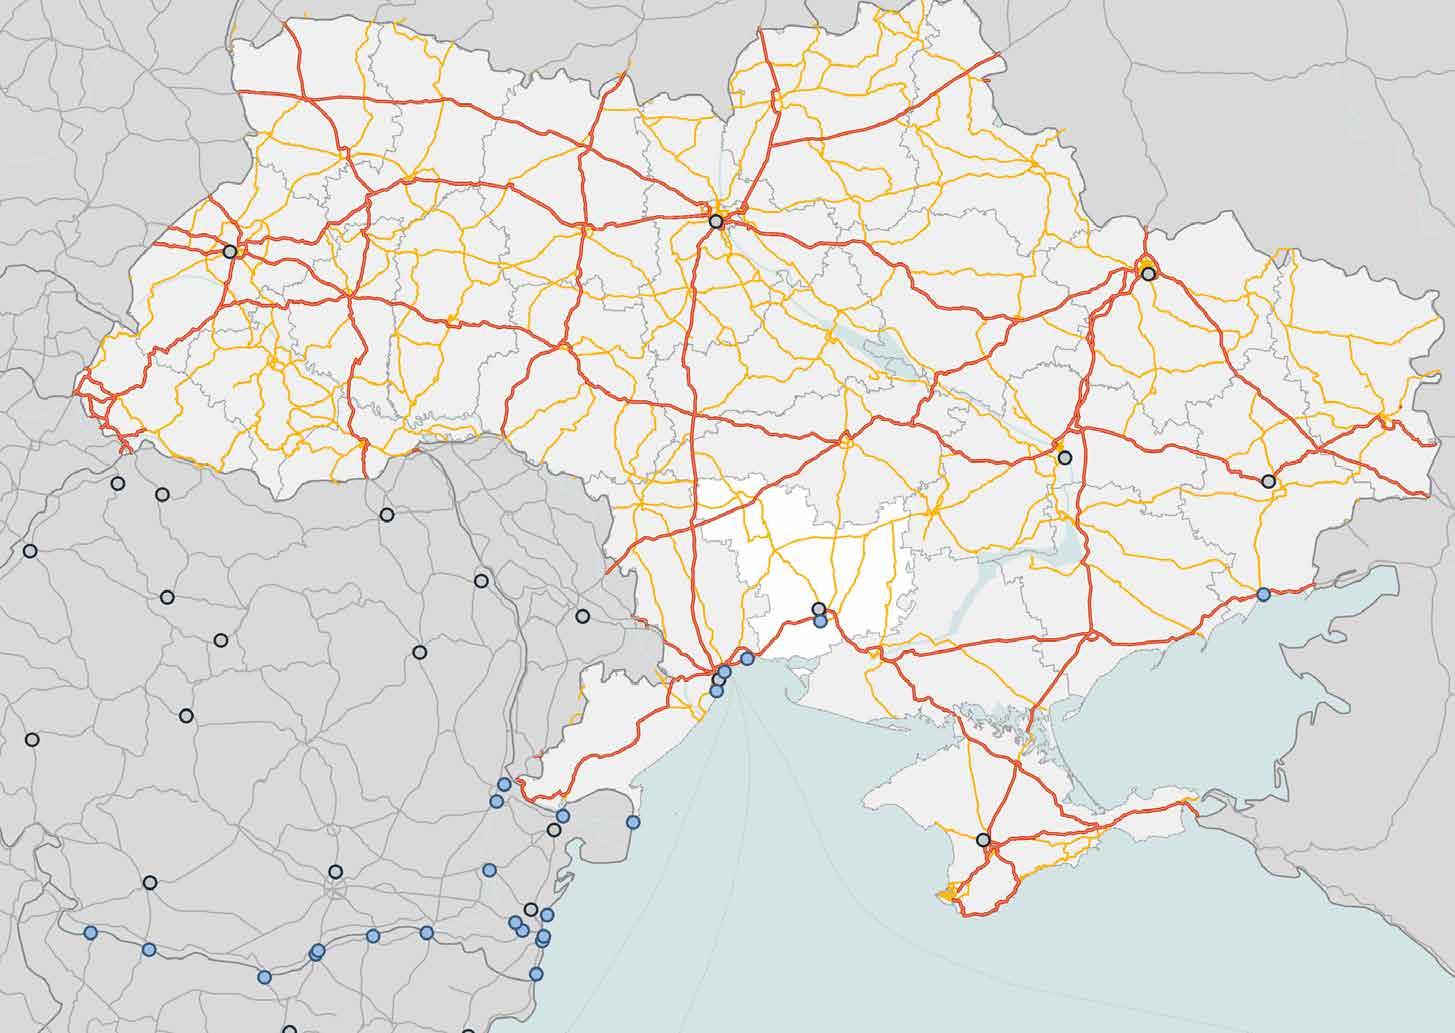
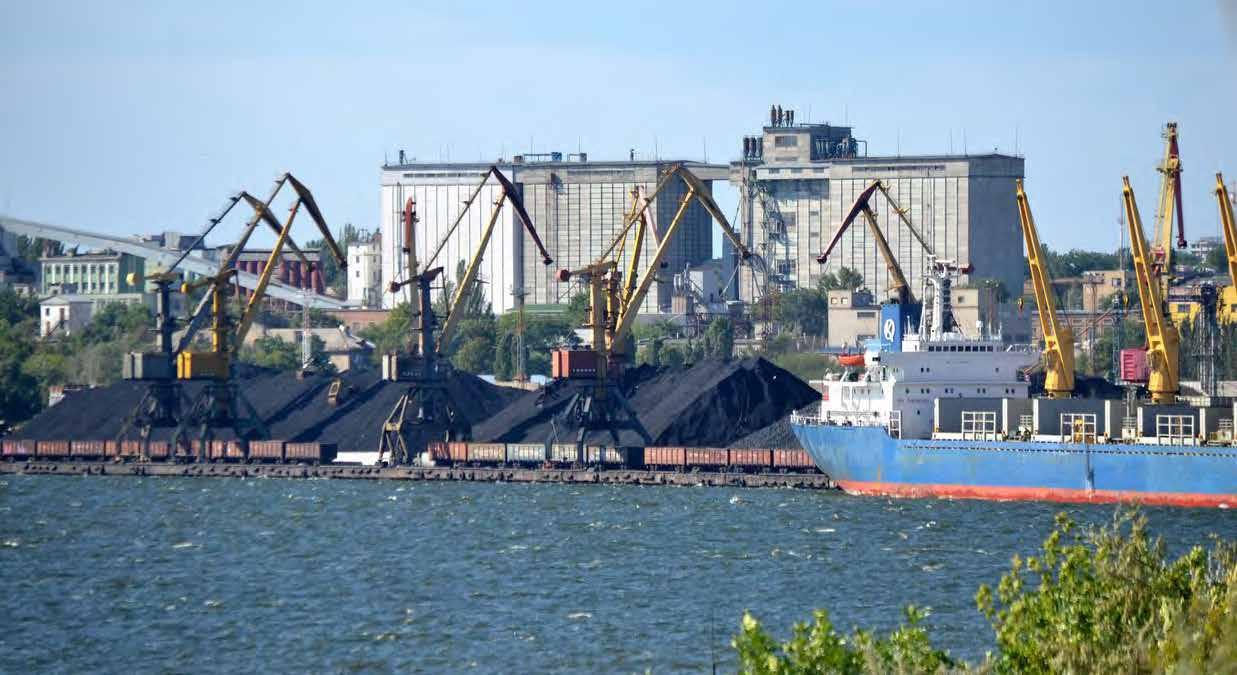
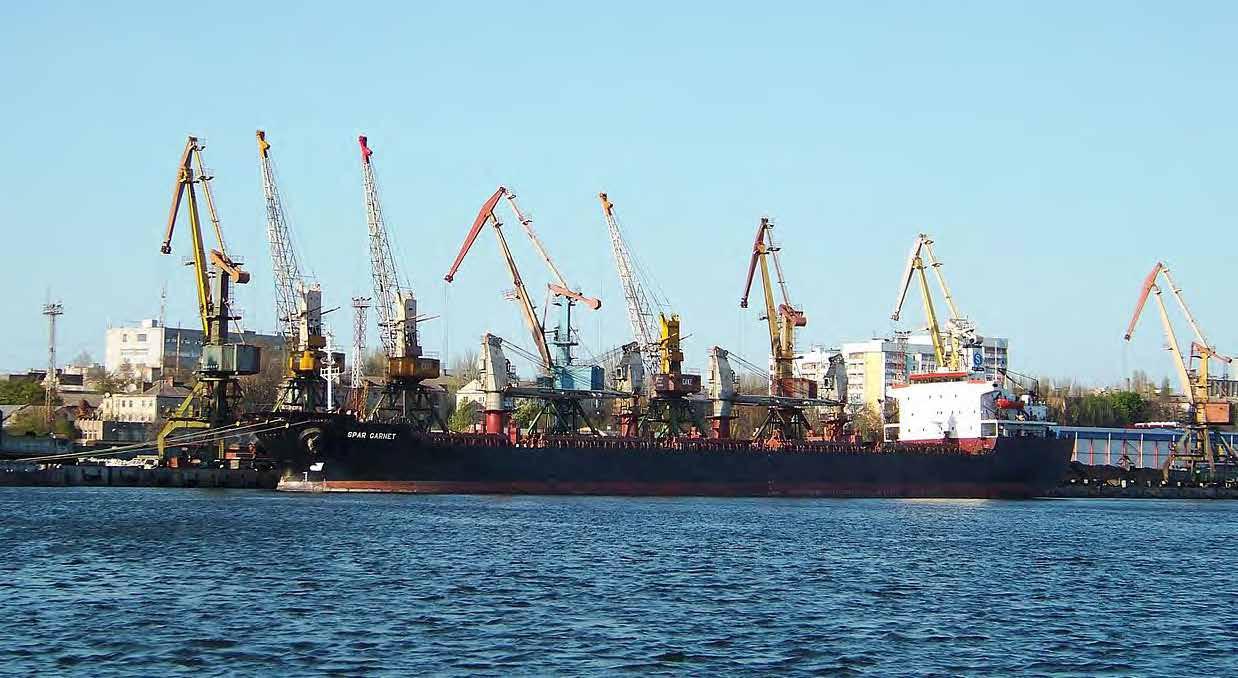
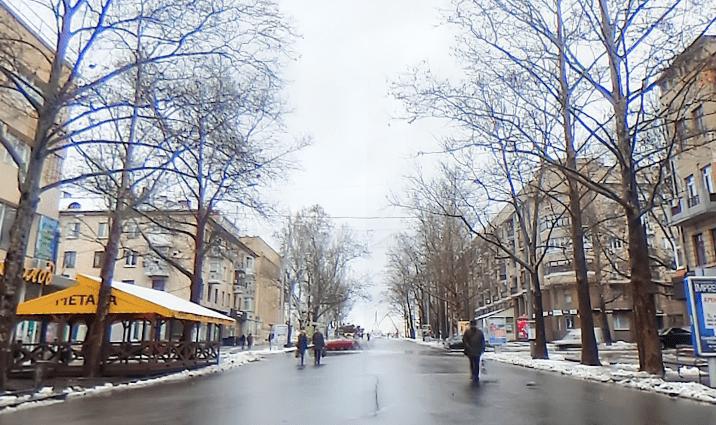
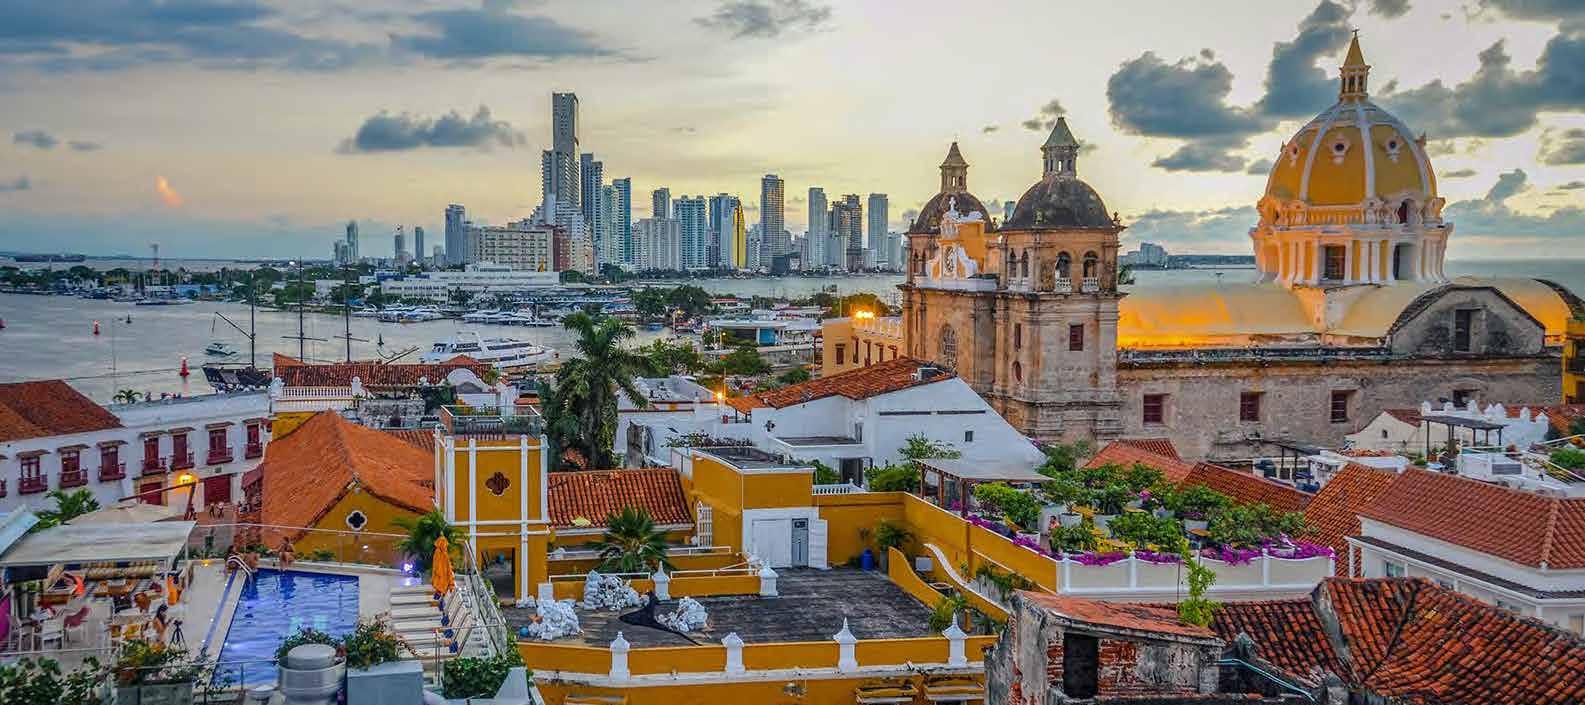
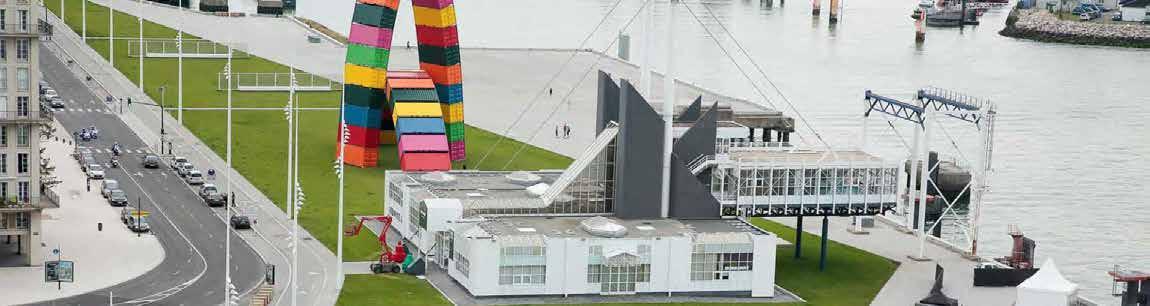
Today, Mykolaiv is one of the most important Ukrainian Black Sea ports, serving the Southern regions. Its location along the estuary of the Southern Bug River makes it a strategic access point to the Black Sea. This position will continue to be a driving force in the future, for both commercial and touristic purposes.
Its adjacency to the Bug River makes the Mykolaiv region one of the largest naval regions of Ukraine, facilitating connections with Mediterranean countries, the Middle East and Asia. The access to the Black Sea and the largest river basins of the country set favorable conditions for the development of water transport (sea, river) and determines the prospects for attracting investment in the development of recreational and industrial potential of the region.
This strategic position has also made Ukraine one of the member countries of the Charter of the Black Sea Economic Cooperation Organisation, whose main purpose is multilateral political (maintaining political stability) and economic (trade development) cooperation to establish a dynamic interaction and network of trust.
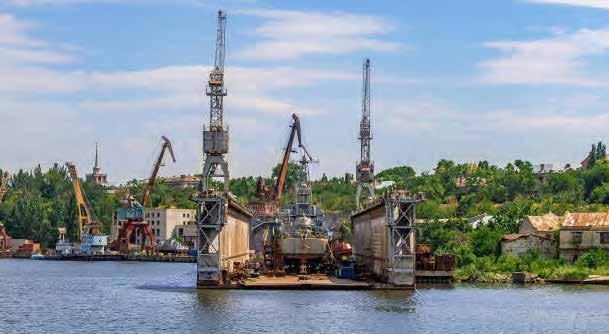
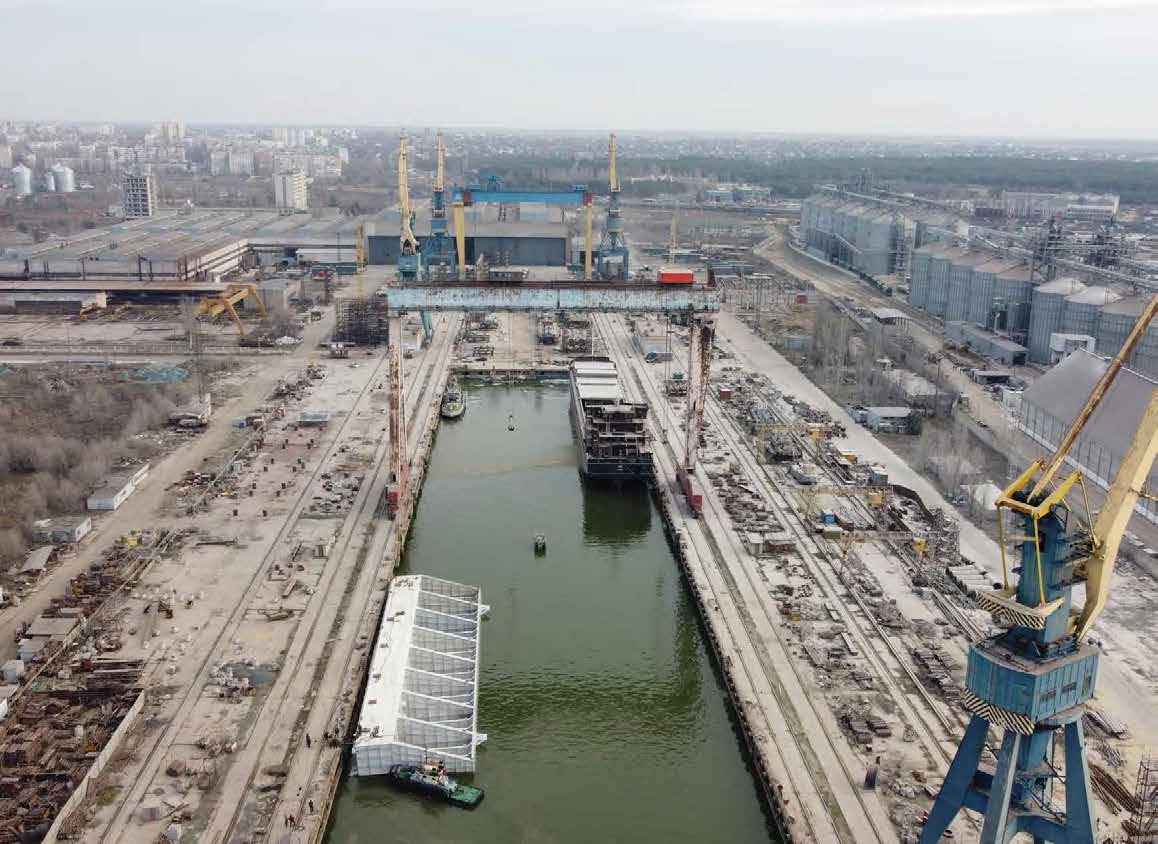
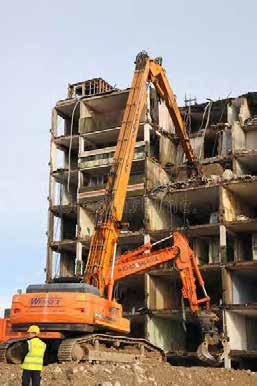
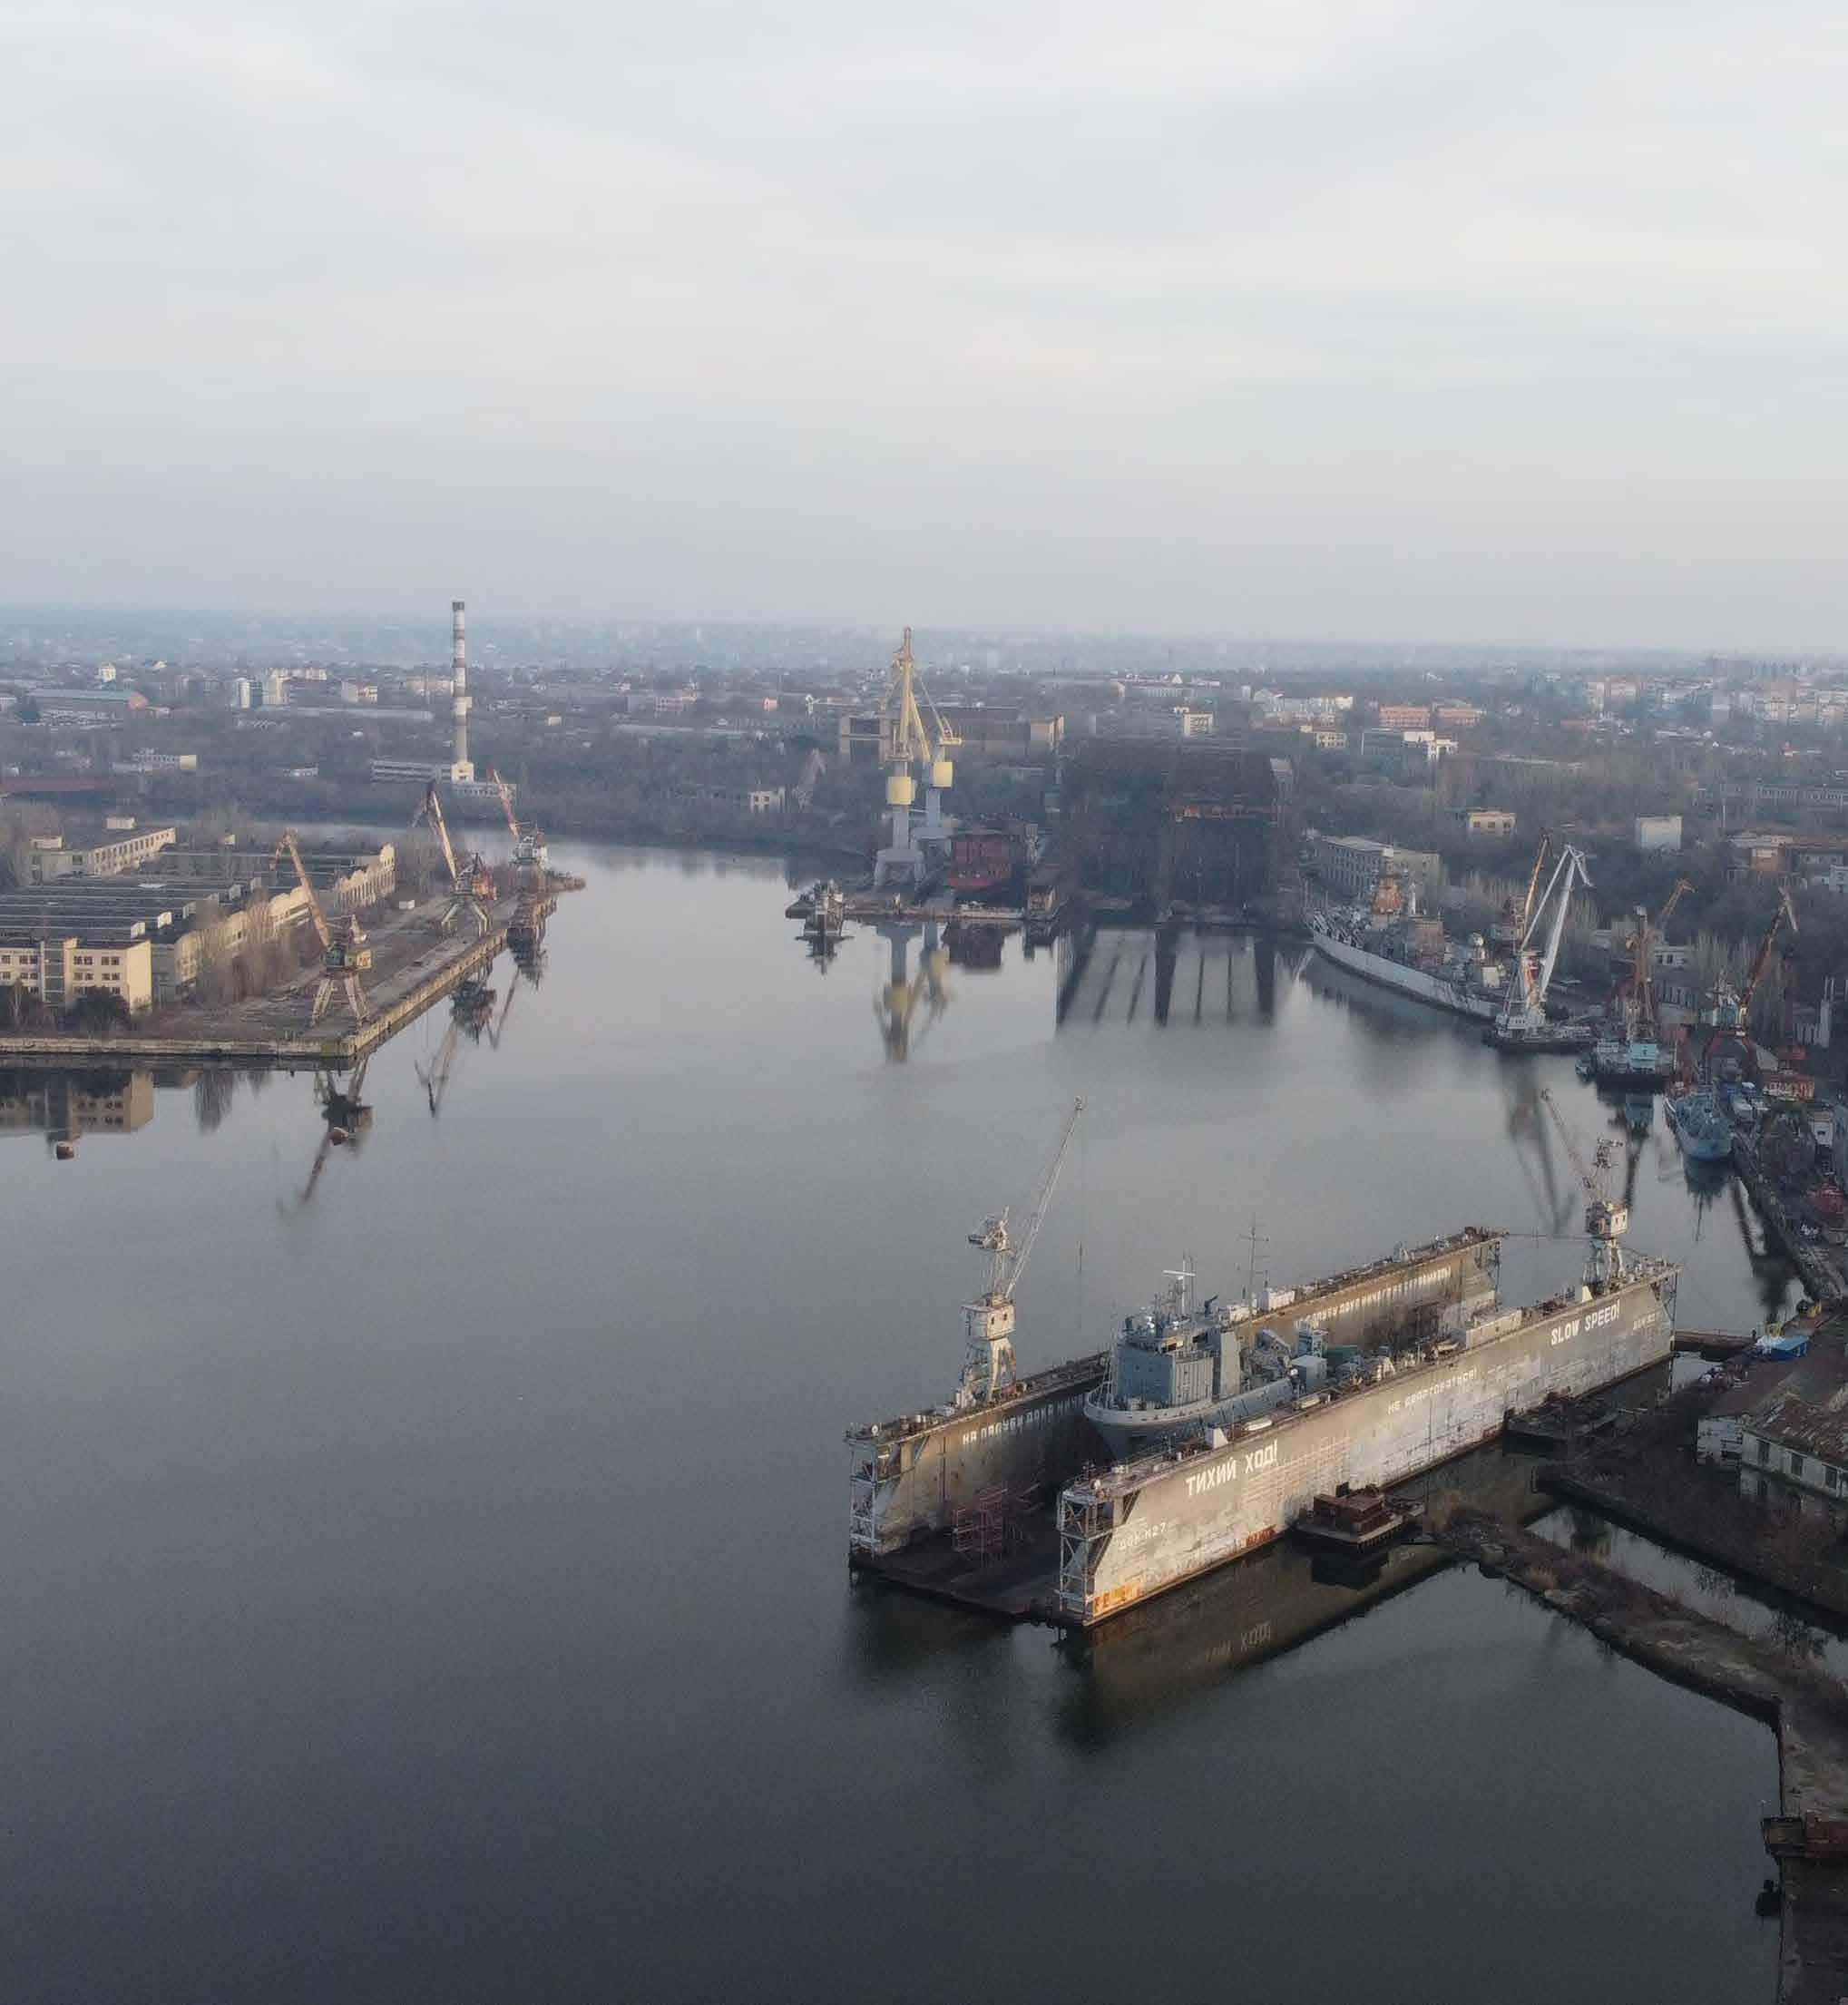
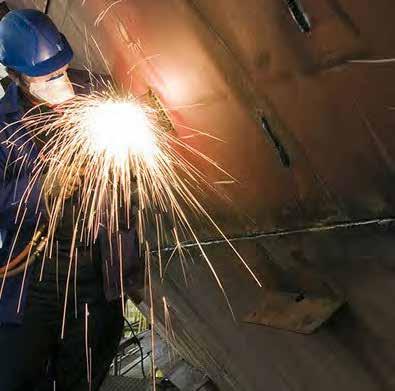
As one of the largest shipbuilding centres of Ukraine, Mykolaiv can count on three large state-run shipbuilding plants, which are able to build and supply any kind of ships. Tankers, dry cargo carriers, reefer ships, trawlers, and warships of different types are all produced at the "Chernomorsky shipbuilding plant", "61 Communars Shipbuilding plant" and "Ocean" dockyards.
The city has also a wide range of other engineering and consumergoods industries, such as an alumina-processing plant, which was built in the 1970s in the suburb of Zhovtneve. Advanced engineering and metal-working hubs service the shipbuilding and energy machine building industries with skilled labour and knowhow. These industries provide about 50% of the total Ukrainian shipbuilding production, more than 90% in manufacturing of gas turbines and the production of aluminium oxide.
MYKOLAIV HISTORY
1789: Mykolaiv is founded.
End of 18th century: the Russian architect Ivan Yehorovich Starov develops a plan for Mykolaiv, with straight streets and districts of a regular shape.
1856: The Treaty of Paris is signed, requiring Russia to remove all its ships from the Black Sea coast.
1862: Mykolaiv's commercial port is opened, and becomes very successful.
1860s: Mykolaiv boasts over 77,000 inhabitants, nine churches, schools for women and for navigators, steampowered mills, tobacco factories, iron foundries, a brewery, and even a meteorological station.
End of 19th century: Mykolaiv's port comes third after St.Petersburg and Odessa in terms of volume of trade with foreign countries.
1920: Soviet power is established in Mykolaiv.
1941- 1944 (WW2): Mykolaiv is occupied by German forces.
Post WW2: Mykolaiv becames one of the shipbuilding centres of the USSR.
2022: Mykolaiv is invaded by Russian troops. The Ukranian counter-offensive frees the region by the end of the year.
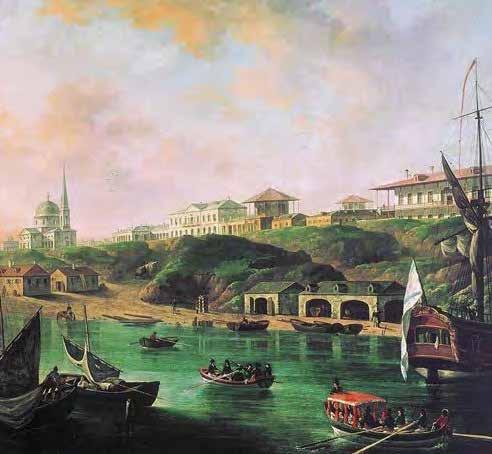
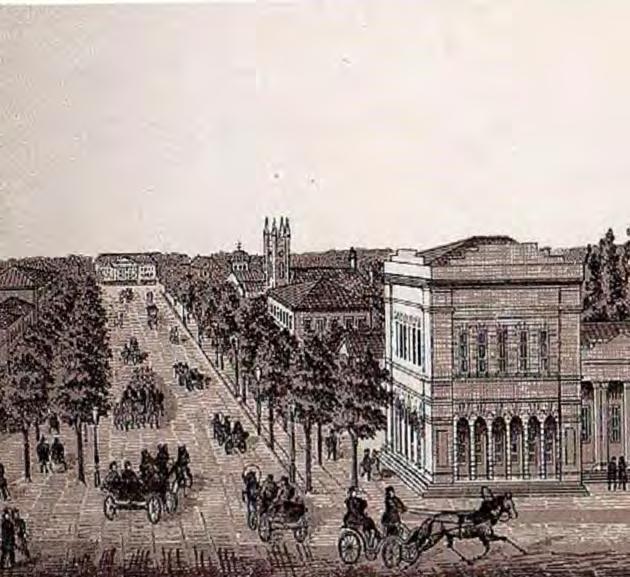
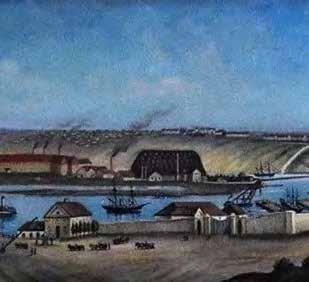
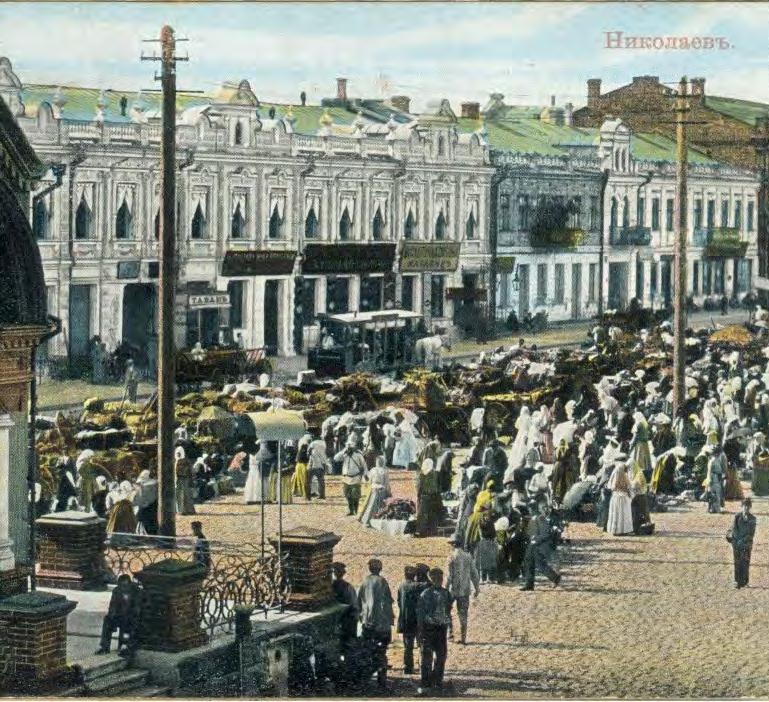
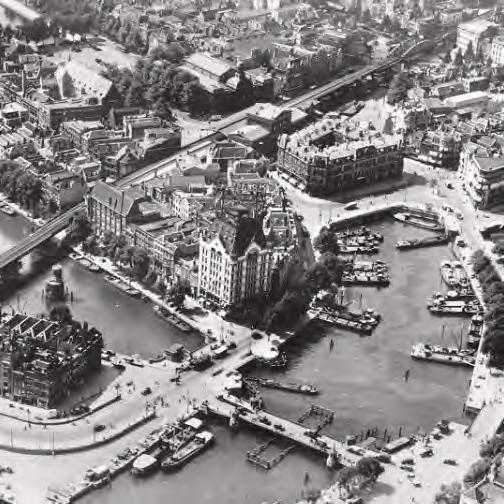
Mykolaiv city, 1900s
Mykolaiv city, 1799 /
1799
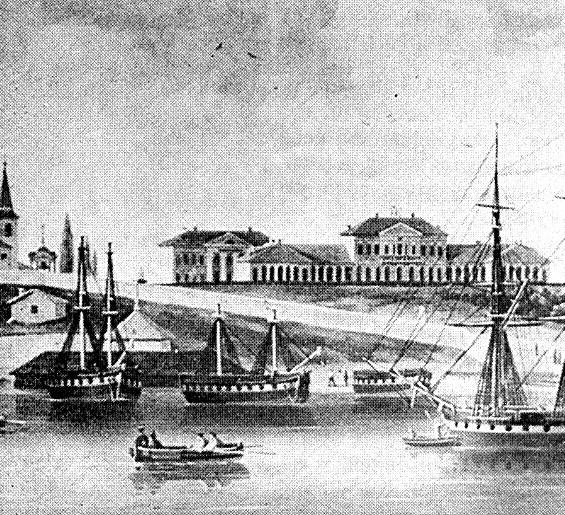
Mykolaiv city, 1841
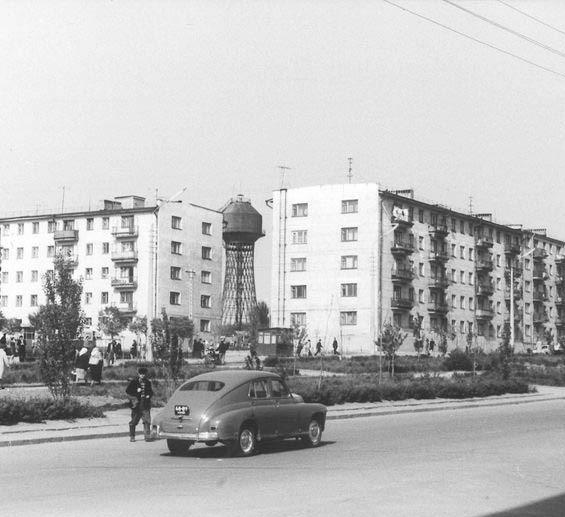
Mykolaiv city, 1960s
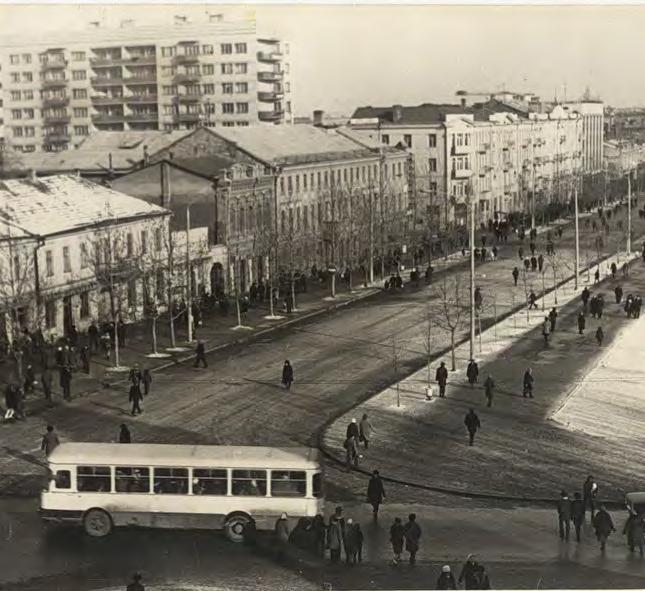
Mykolaiv city, 1970s
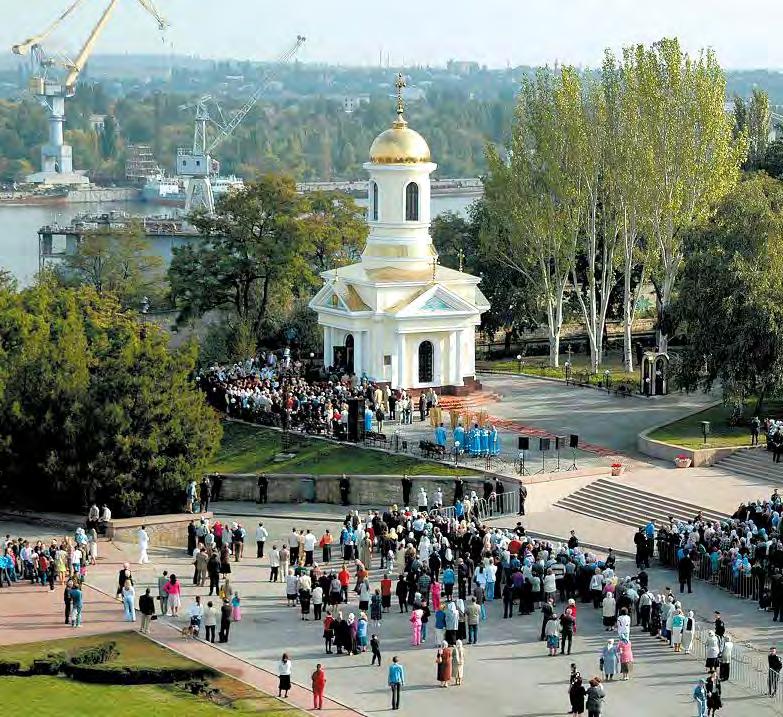
Mykolaiv city, 2020s /
Mykolaiv city,
Mykolaiv
History & Urban Development
The historical development of the city was greatly influenced by the local geography, as both location and landscape played a key role.
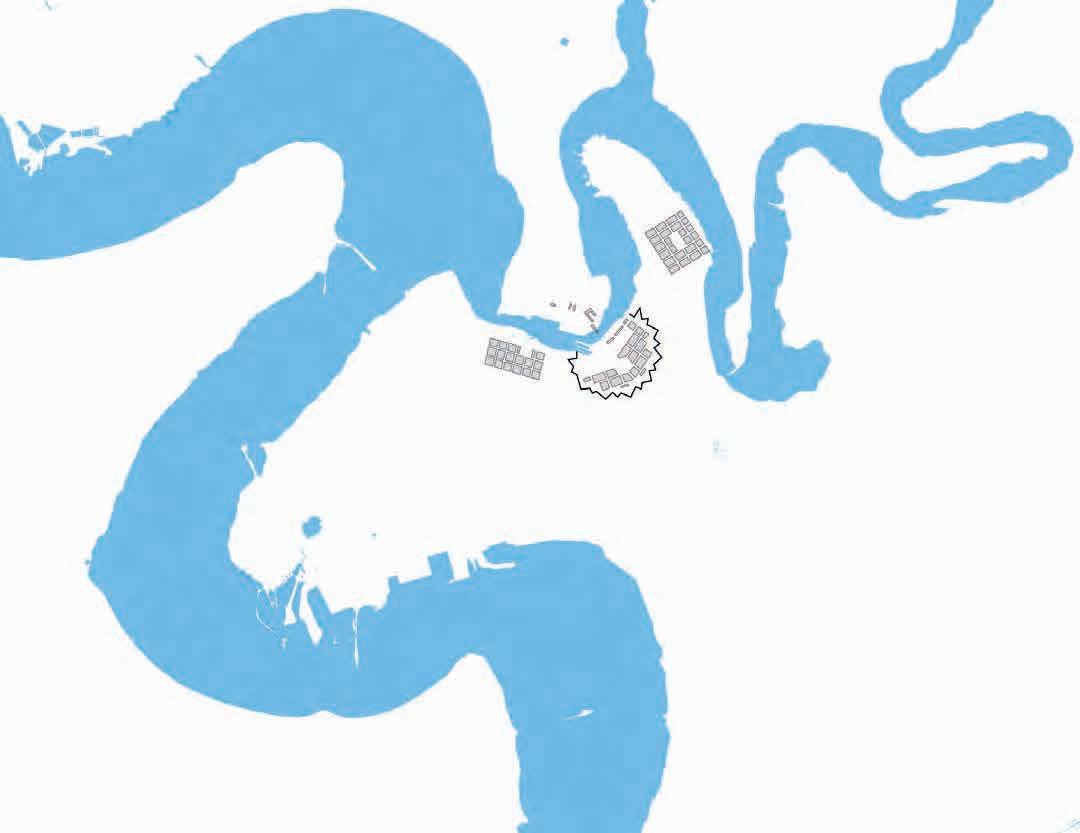
Nestled between the South Bug River and the Inhul River, the core of the city was initially intended as a fortress city. This idea was dismissed at the beginning of the 19th century, when the city plan allowed the urban area to expand within a regular grid.
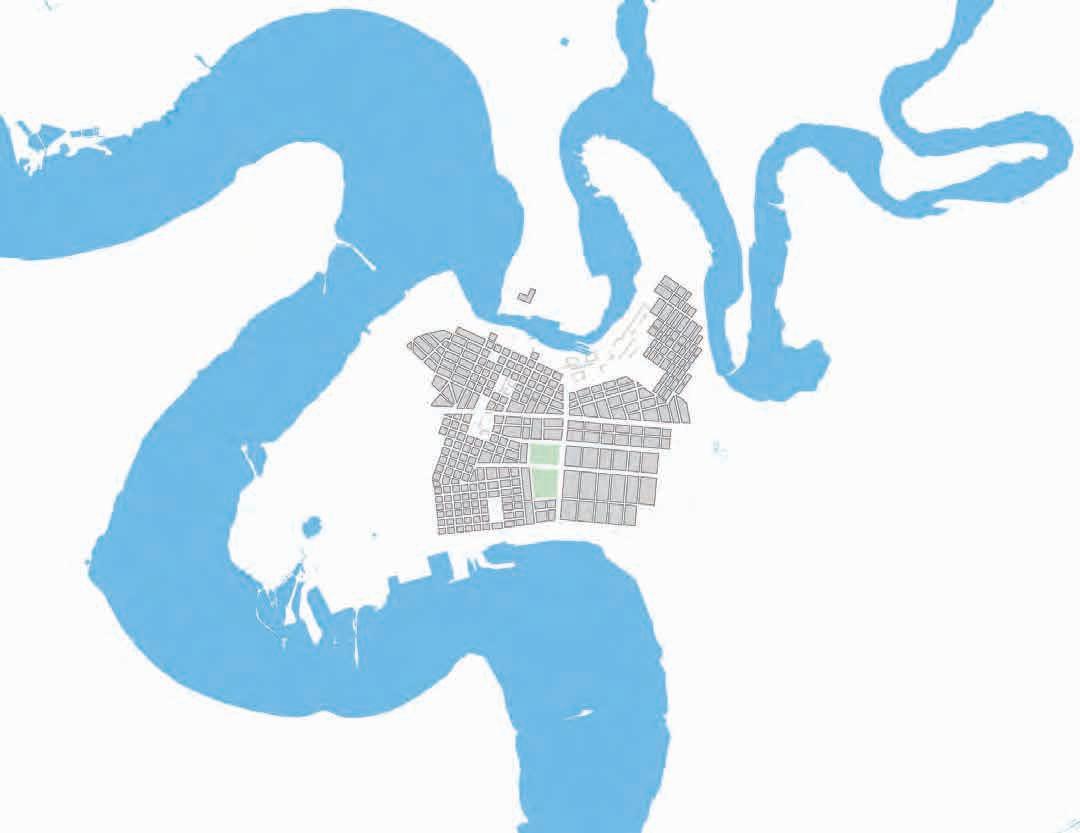
As Mykolaiv's ports were opened to foreign ships to incentivize the economy and facilitate the arrival of new citizens, economic progress and socio-economic development in the late 1800s allowed the city to spread towards the south and west.
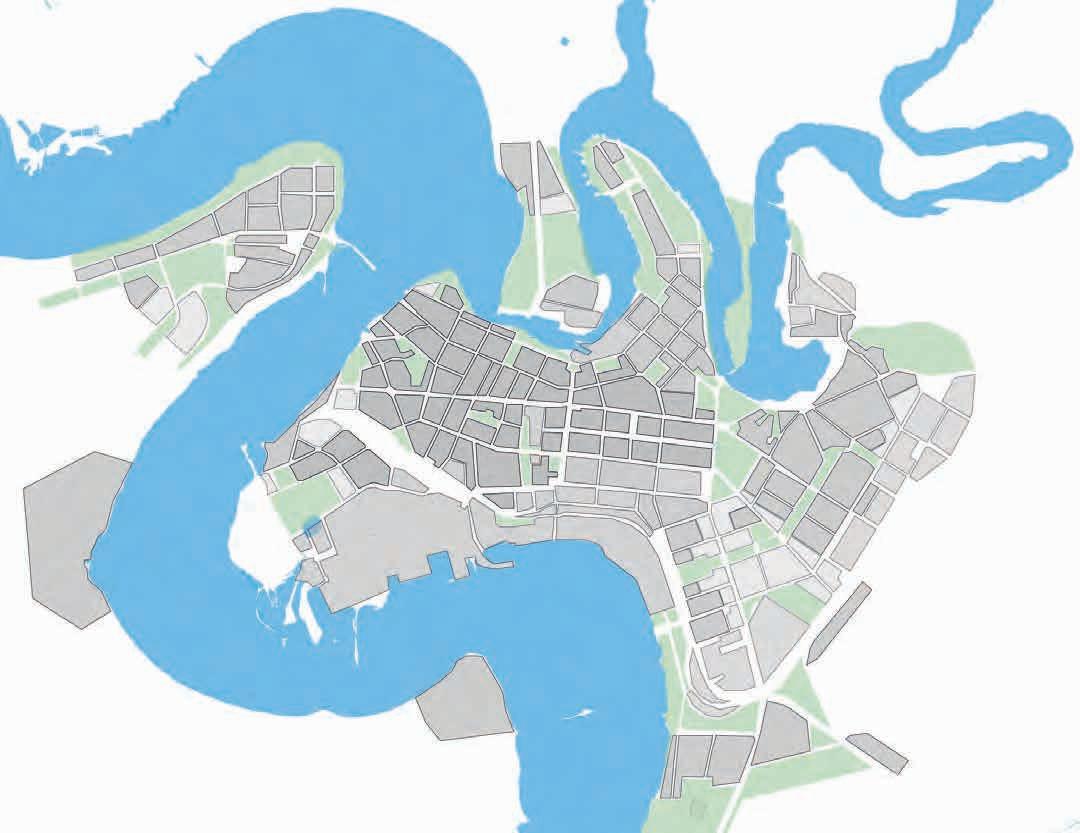
The city's urban settlement as seen today is the result of a large re-construction effort which started after the city was liberated from the German troops in 1944 and lasted for the following two decades.
Mykolaiv City Extents, 1789
1789
Mykolaiv City Extents, 1837
Mykolaiv City Extents, 1965
Enhancing Urban Planning in the city of Mykolaiv: Concept
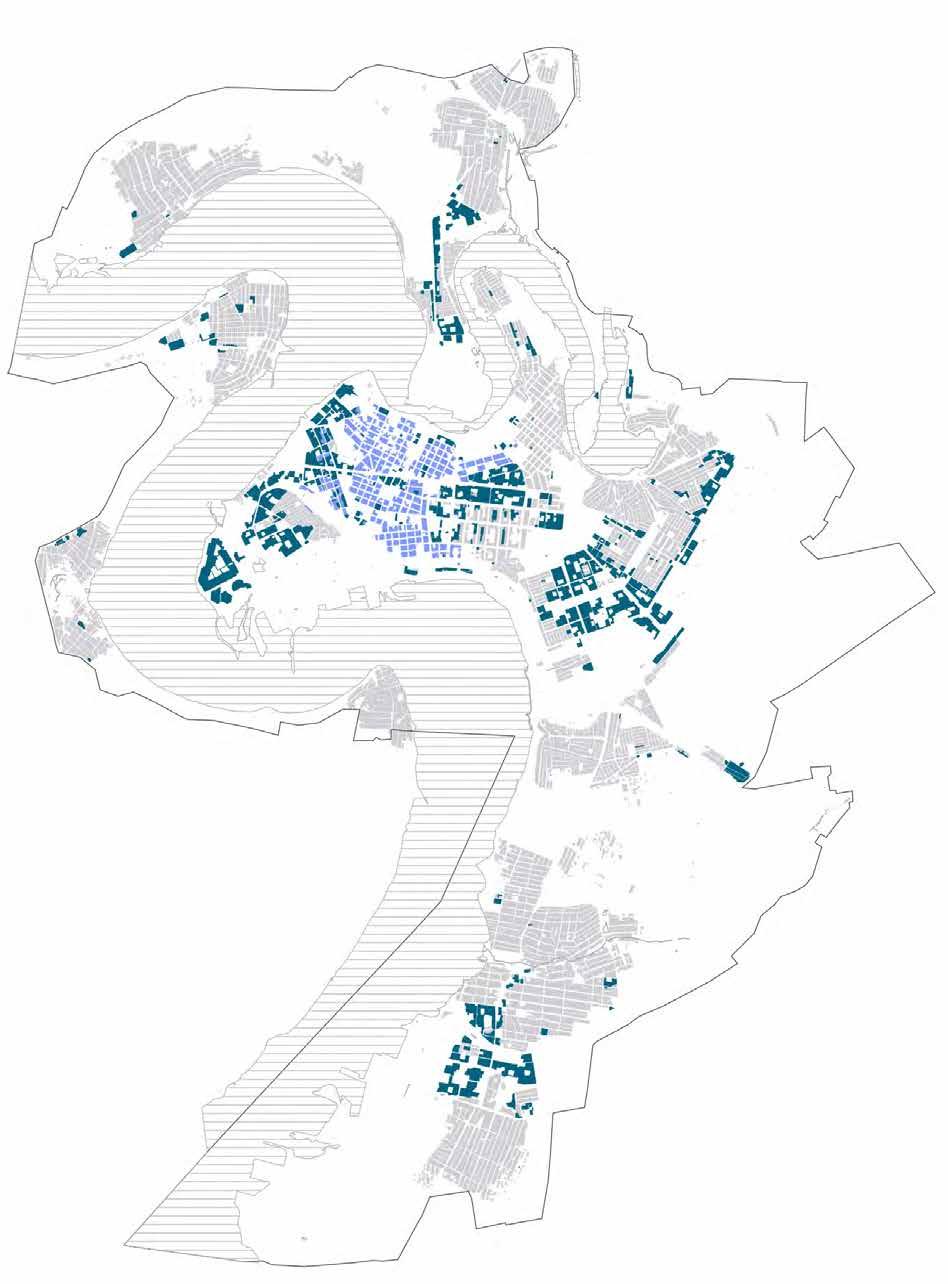
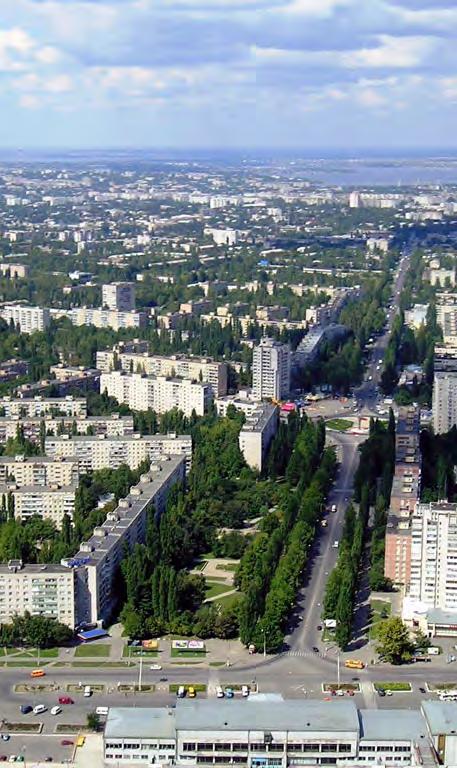
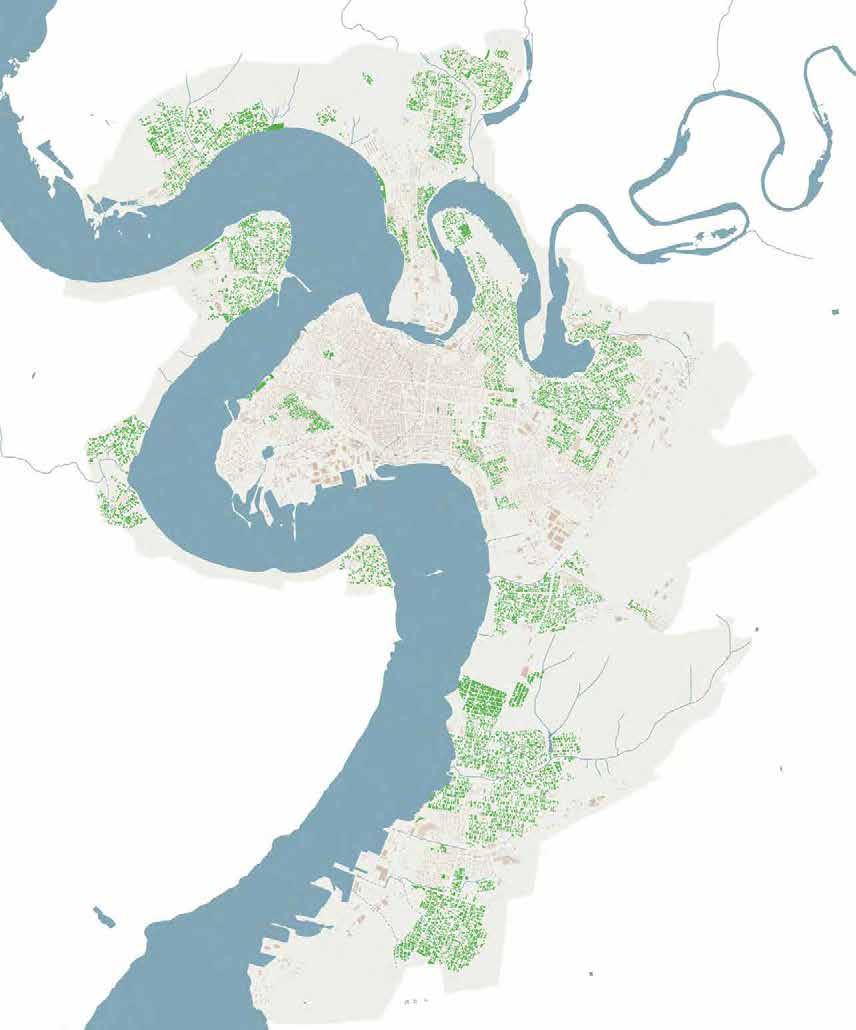
Mykolaiv as a Post Socialist City
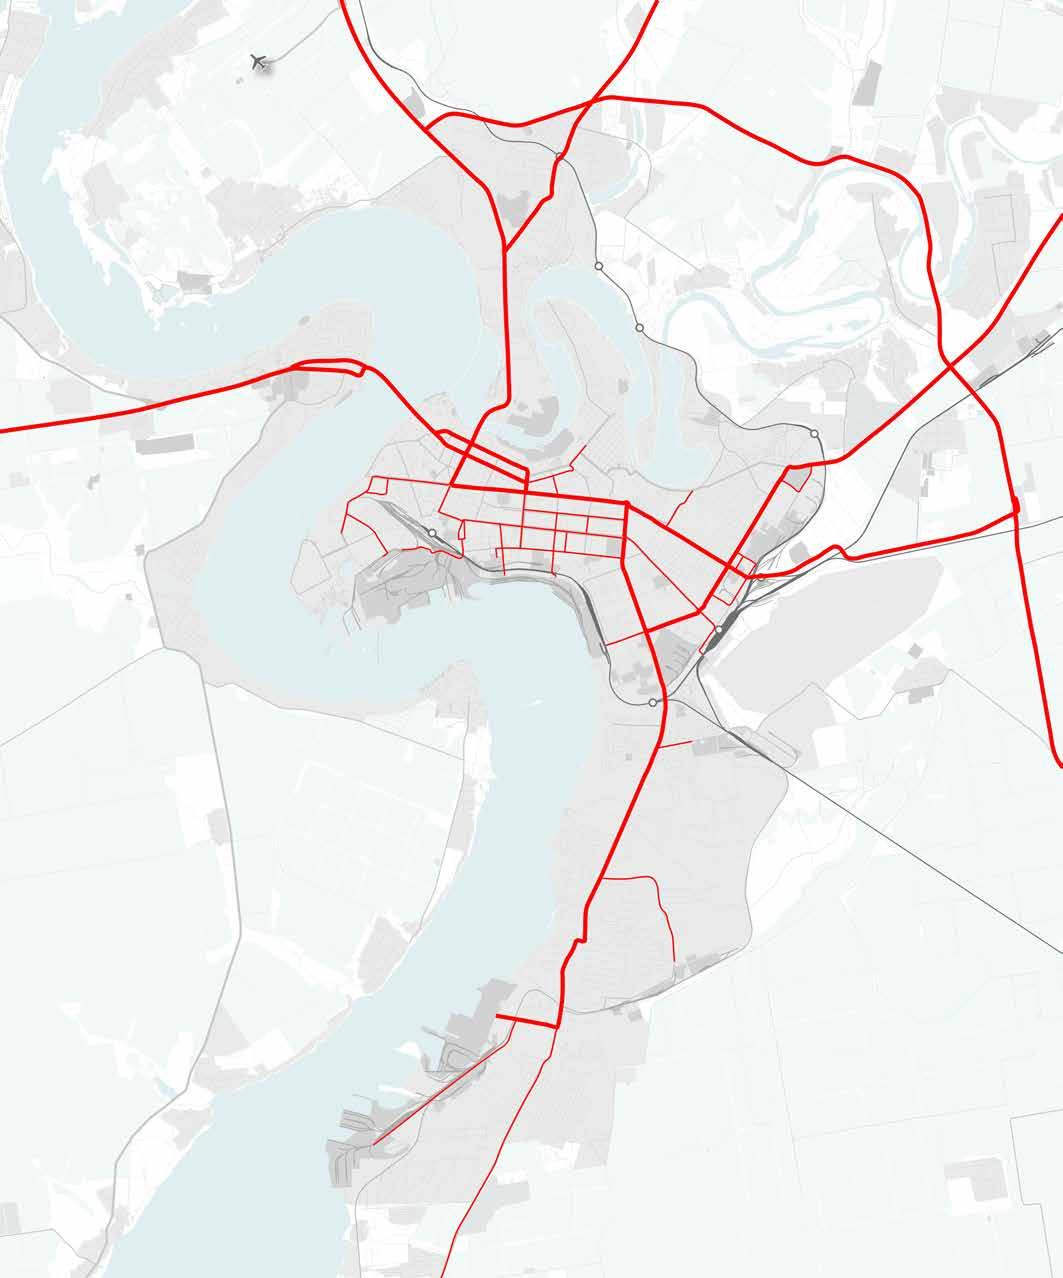
Over the years, the territorial development of the city has been morphed by both natural and artificial elements: besides the rivers, the railway, access roads to production zones and air transport facilities have caused the creation of urban clusters, with the presence of significant industrial and special uses creating fractions in the urban fabric.
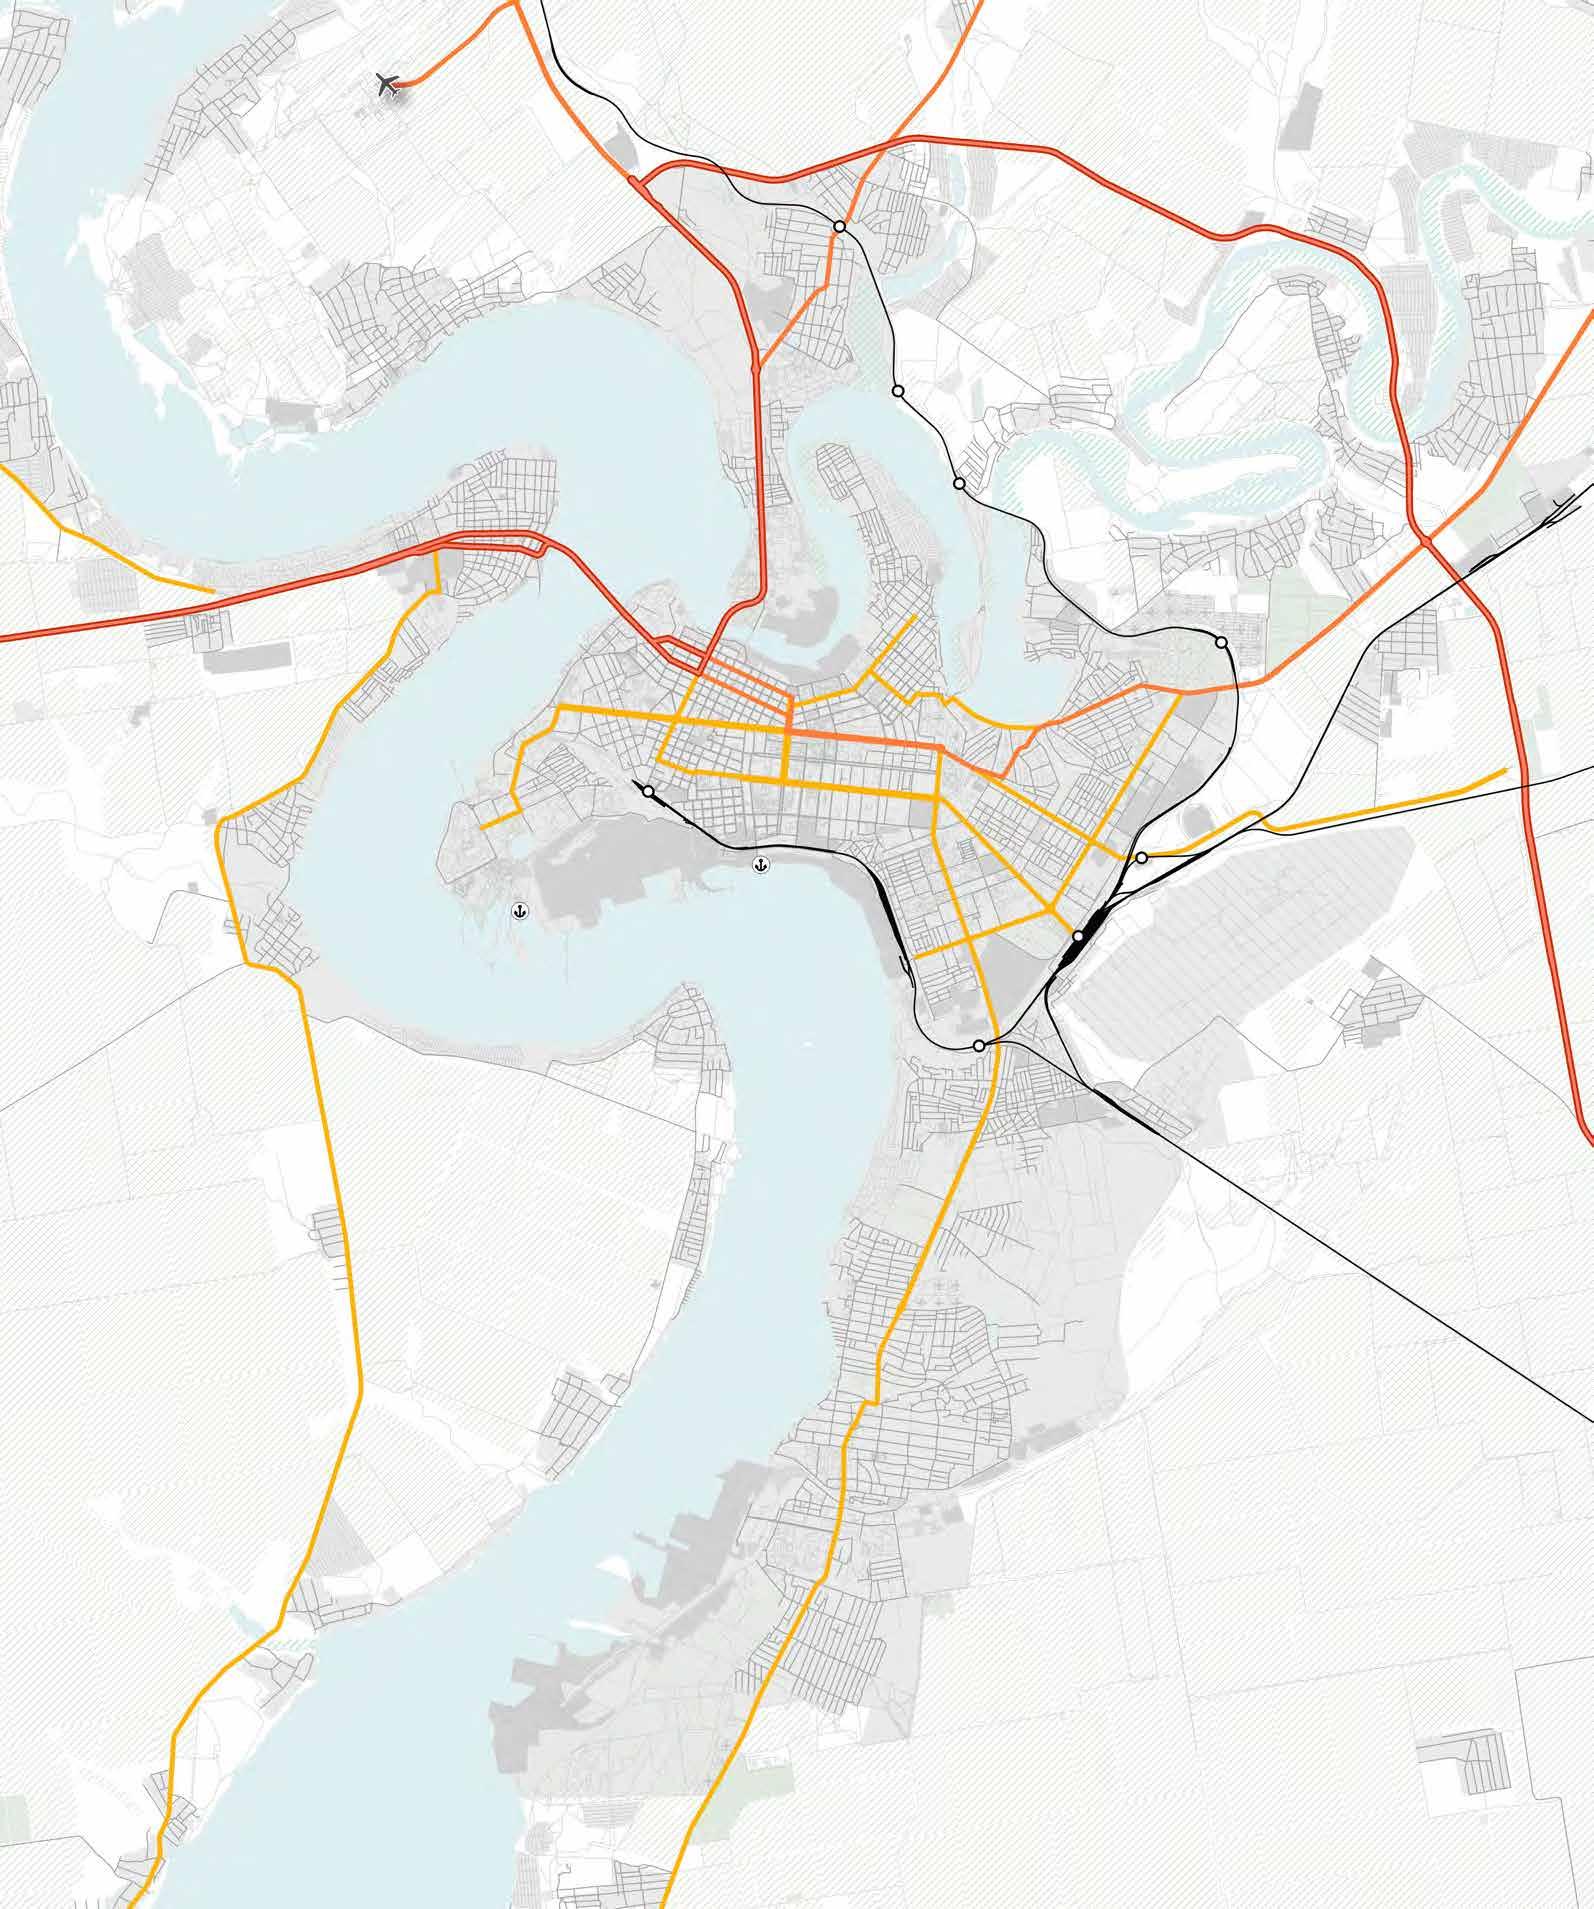
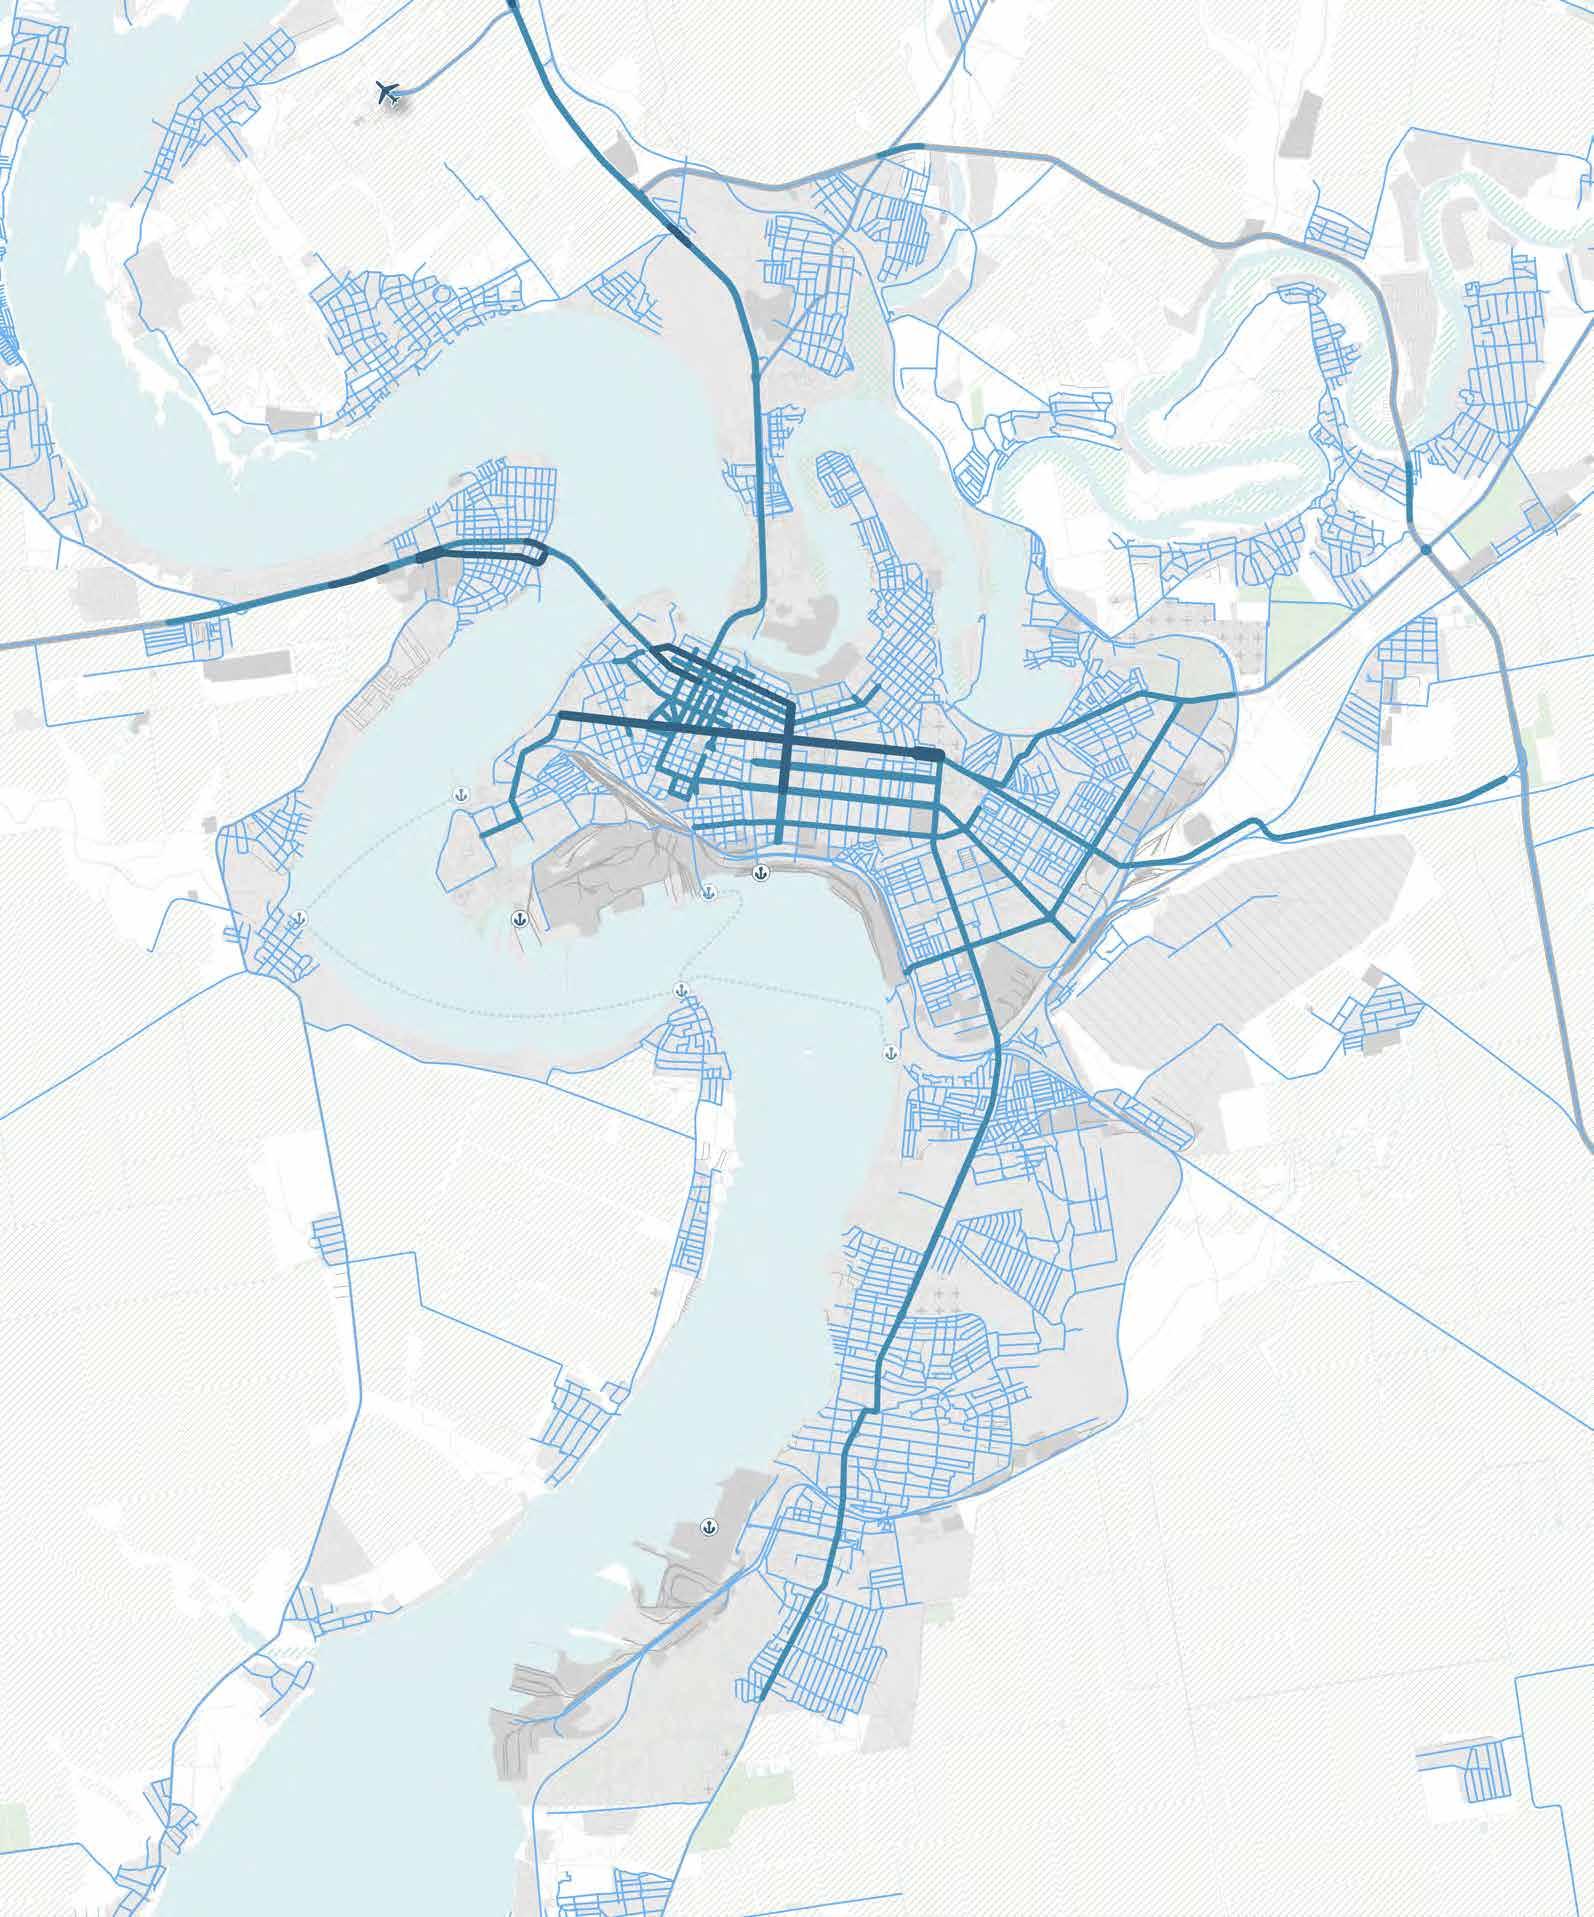
The city stretches unevenly from north to south, and presents a fragmented planning structure. Linear-nodal urban hubs are formed mainly along the main highways of the city, and the city planning and extension is highly determined by the road and public transport networks. In particular, the traditional rectangular grid prevails due to the existing street network layout.
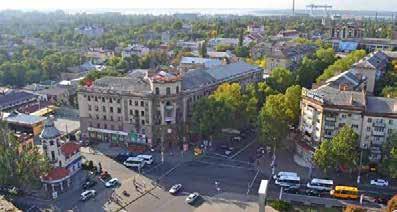
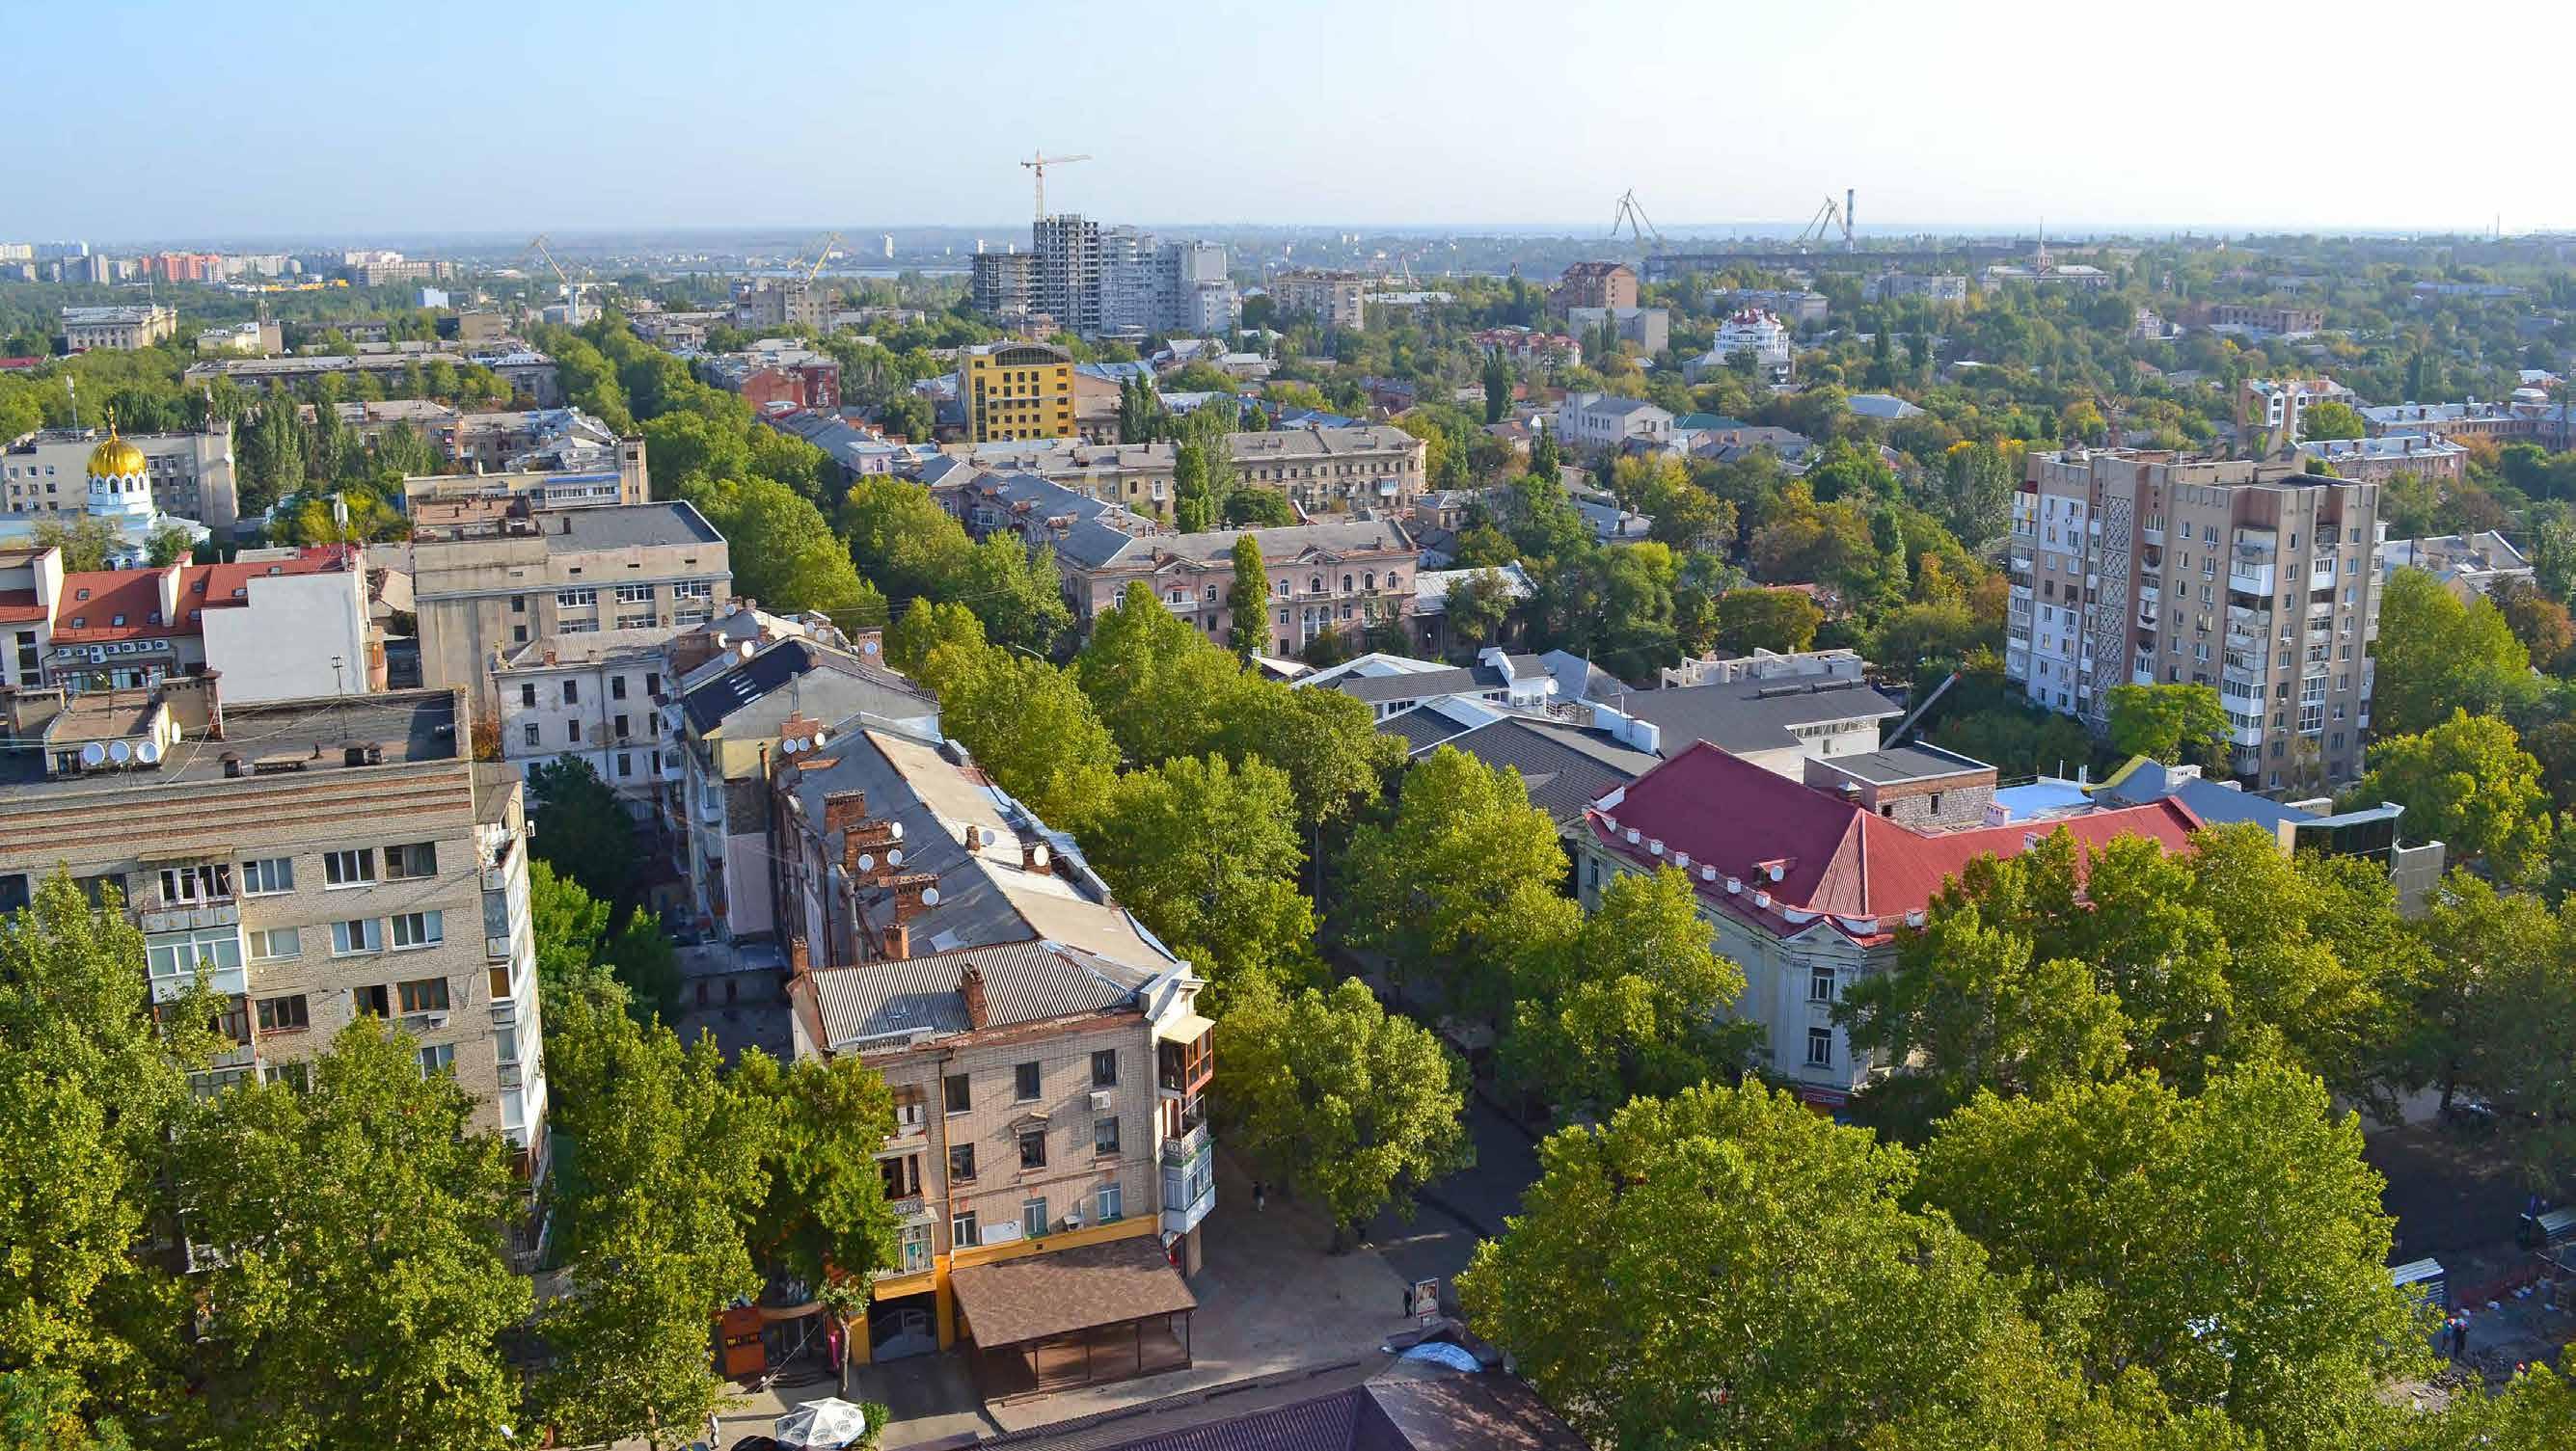
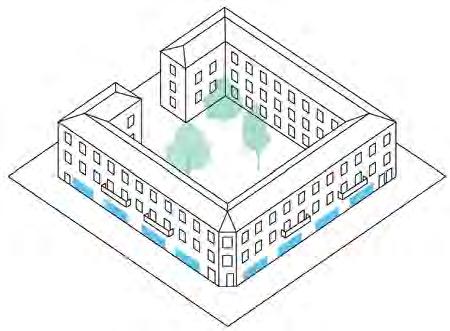
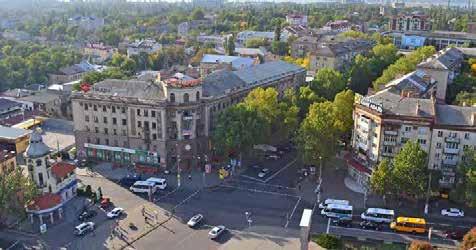
The city centre presents a compact urban fabric and combines several land uses, including administrative, cultural, educational, and commercial zones. This area hosts both public buildings and historical, mixed-use buildings including residential dwellings, which in some cases are outdated or dilapidated.
Manufacturing, warehouses and utility enterprises are scattered throughout the city. The largest industrial zones are located in the central, eastern, and southern parts of the city. Due to the naval vocation of the city, a significant amount of production areas are located alond coastal areas.
Large parts of the city are occupied by garden and "dacha associations" (summer cottages).
The urban blue-green network includes the coastal areas of the South Bug, Ingul, Buzky estuary and the territories of the Nature Reserve Fund.
The current oversized road network and underutilised green spaces offer future opportunities for multimodal systems and densification, with the aim of promoting a more vibrant and compact urban environment.
Mykolaiv Districts
The city today includes four districts:
- Tsentral'nyi: the historical core of the city to the North; - Zavods'kyi: to the West, partially including the city centre;
- Inhulskyi: to the East, mainly residential.
- Korabel'nyi to the South, mainly residential.
Positive and negative aspects for each are sammarised in the map to the right.
Tsentral’nyi
Inhulskyi
Zavods’kyi
Residential Buildings
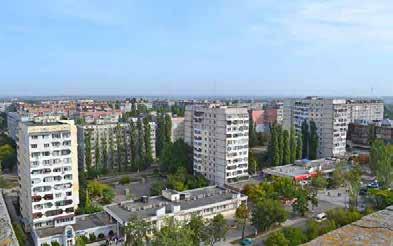
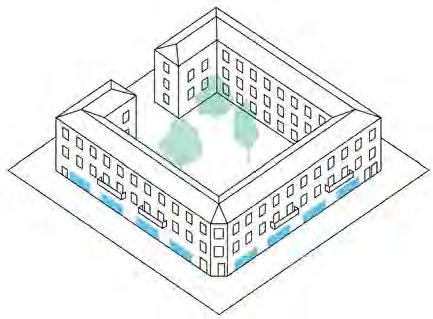
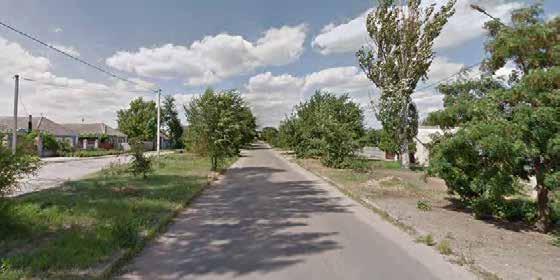
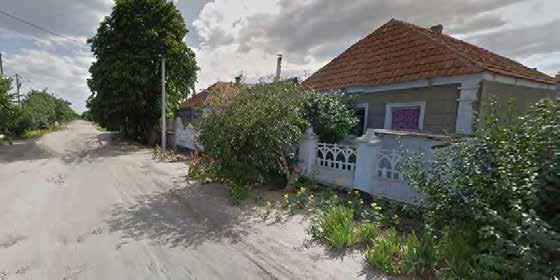
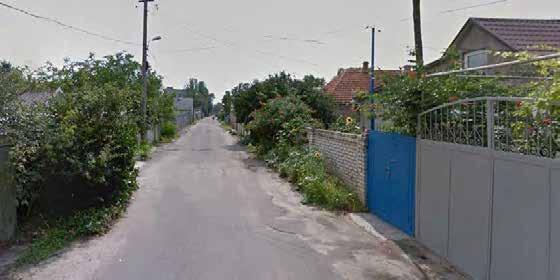
Overall, the residential stock includes mainly three building typologies:
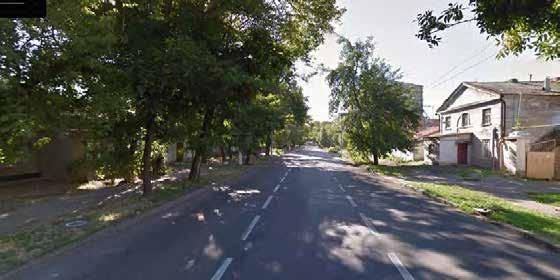
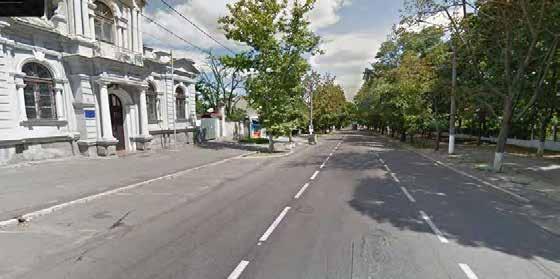
- Historical buildings: low-rise (2-4 storeys) mixed use buildings in the city centre;
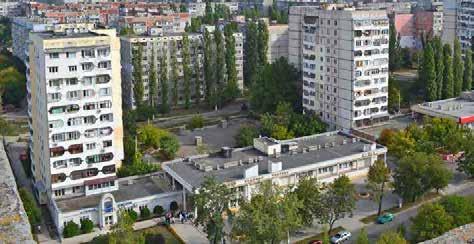
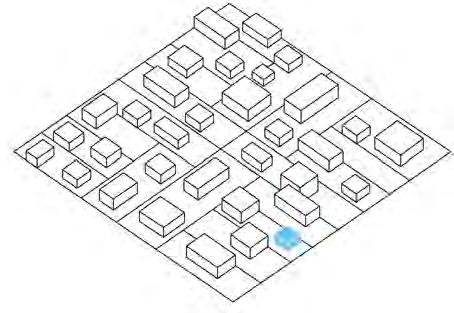
- Soviet blocks: mid-rise (5-9 storeys) apartment buildings in the expansion areas, clustered in micro-districts;
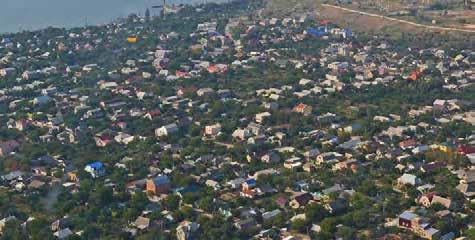
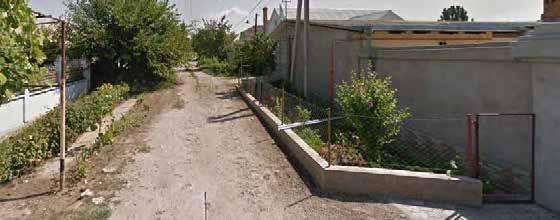
- Post-Soviet single-family homes: 1-2 storeys "manorial houses" on the outskirts of the city, resulting mainly in unplanned sprawl.
Further expansion of residential areas is currently possible only to the South and North, although with certain height restrictions.
Photo by Evgen Gomonjuk
CHAPTER 2 | РОЗДІЛ 2
Urban Fabric and Damage Assessment
Introduction Вступ
The following studies are based on the Damage Assessment database provided by the municipality on August 29, 2023. A comparison between the pre- and post-conflict conditions is addressed in three main sections within this chapter. Firstly, an analysis at the urban scale is provided, to understand how macro categories of land uses were more or less affected by the conflict.
Secondly, a more in depth analysis based on the recorded level of damage shows estimated effects on population, buildings, and community facilities. This analysis was carried out by crossreferencing recorded information regarding different types of damage, as per available data.
Finally, a series of reconstruction interventions that could be considered as high priority are highlighted, as suggested by the Mykolaiv Municipality and local task force.
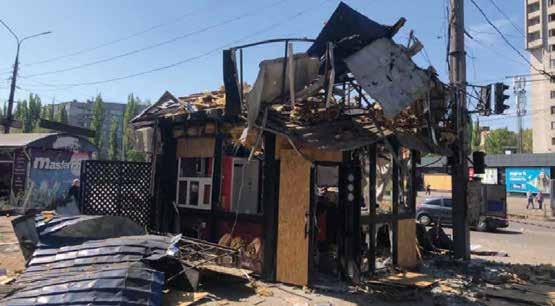
Photo by Sergey Ovcharyshyn
Macro-Scale Damage Assessment
Оцінка на макрорівні
Methodology Методологія
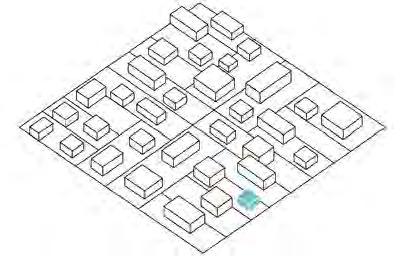
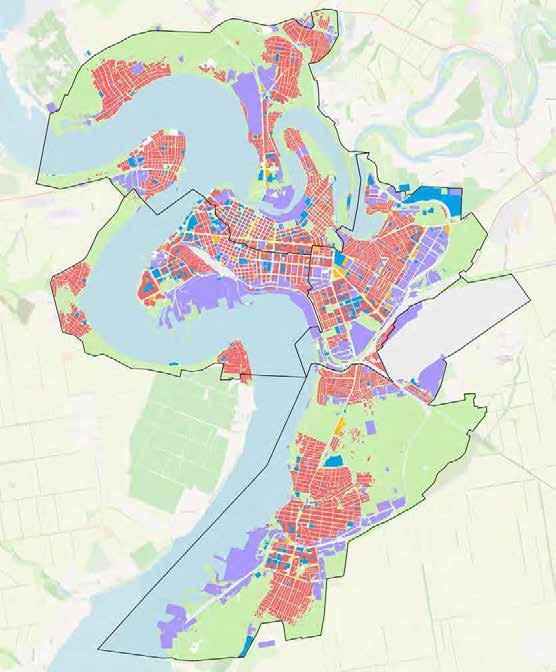
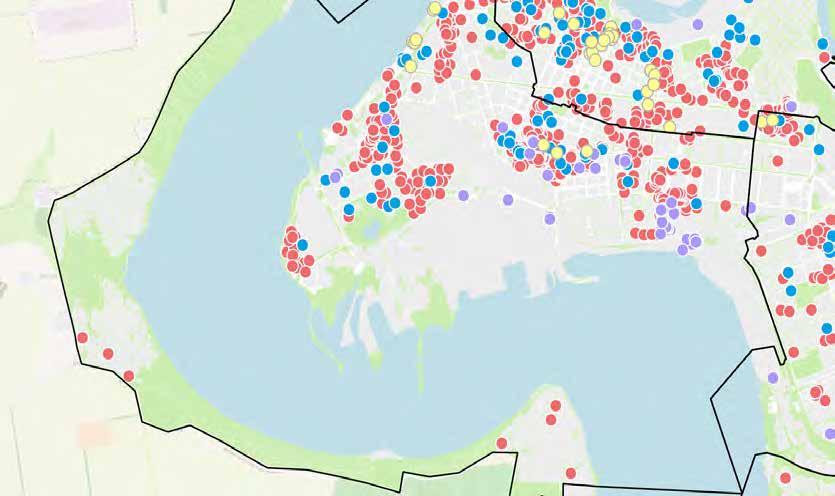
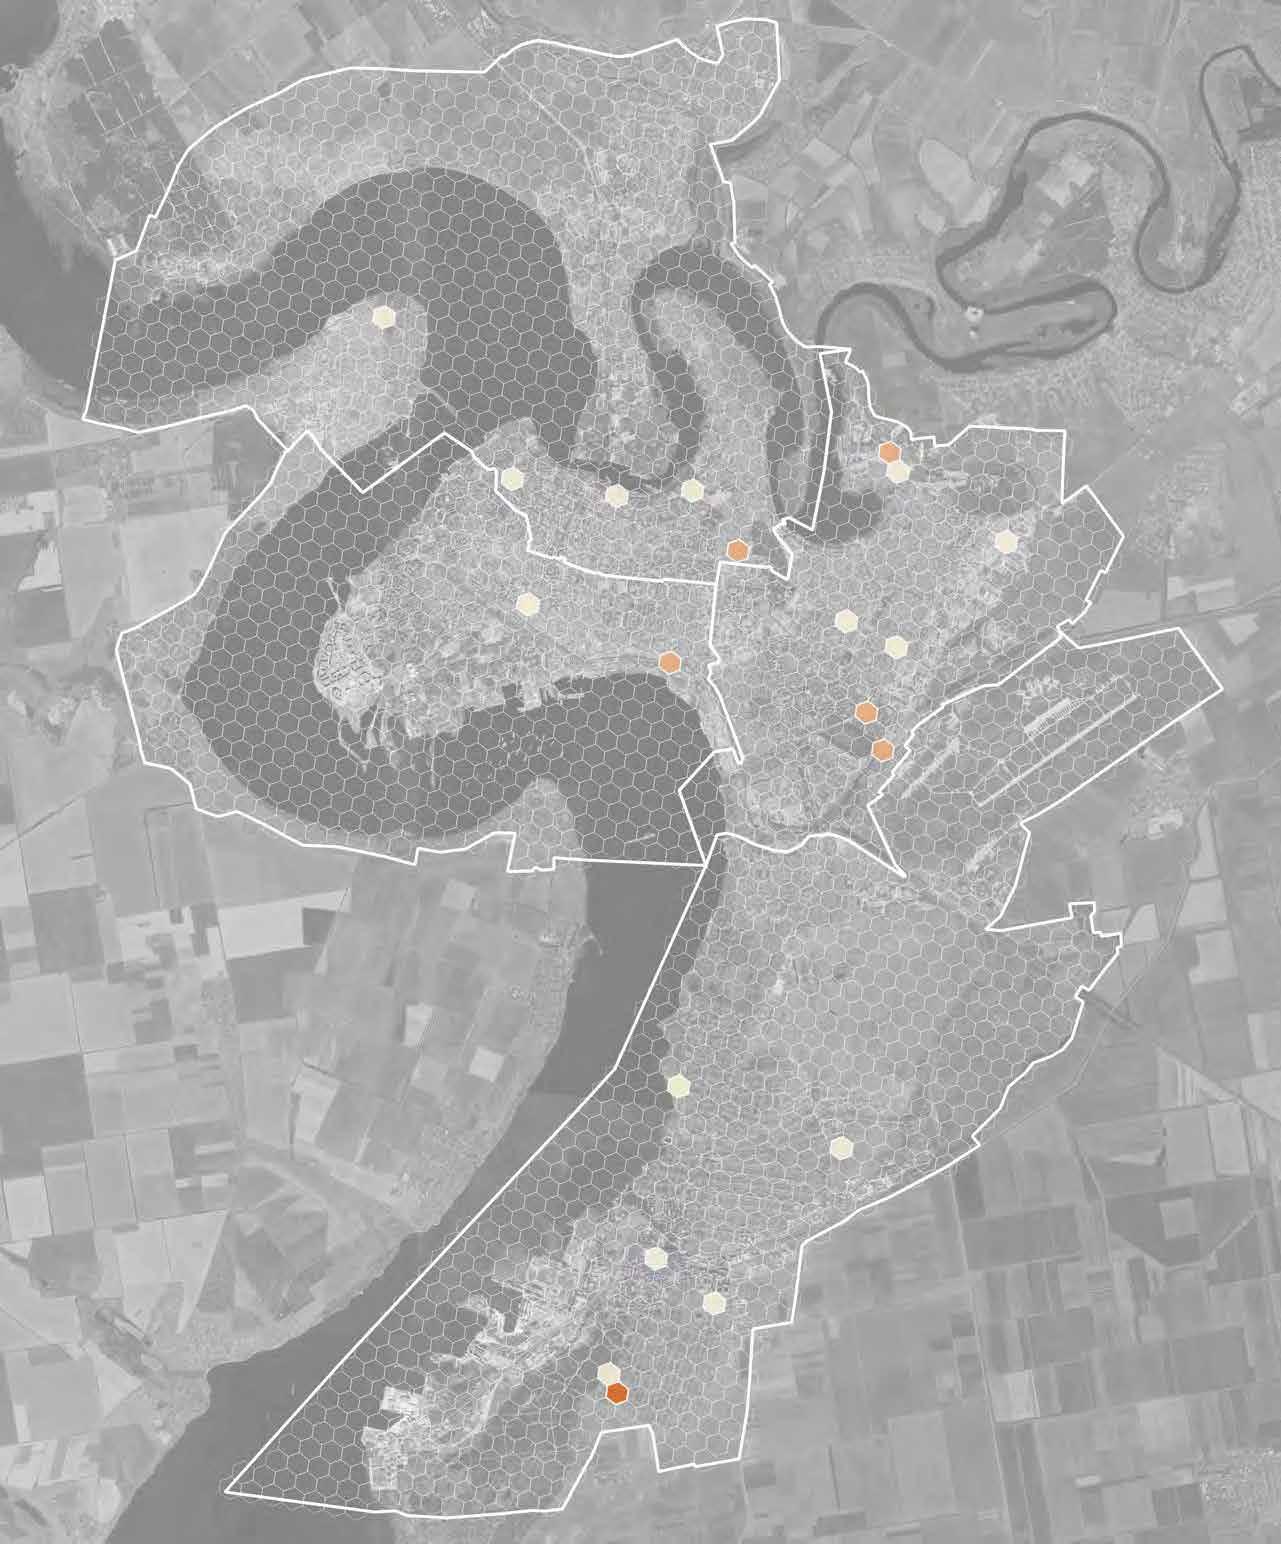
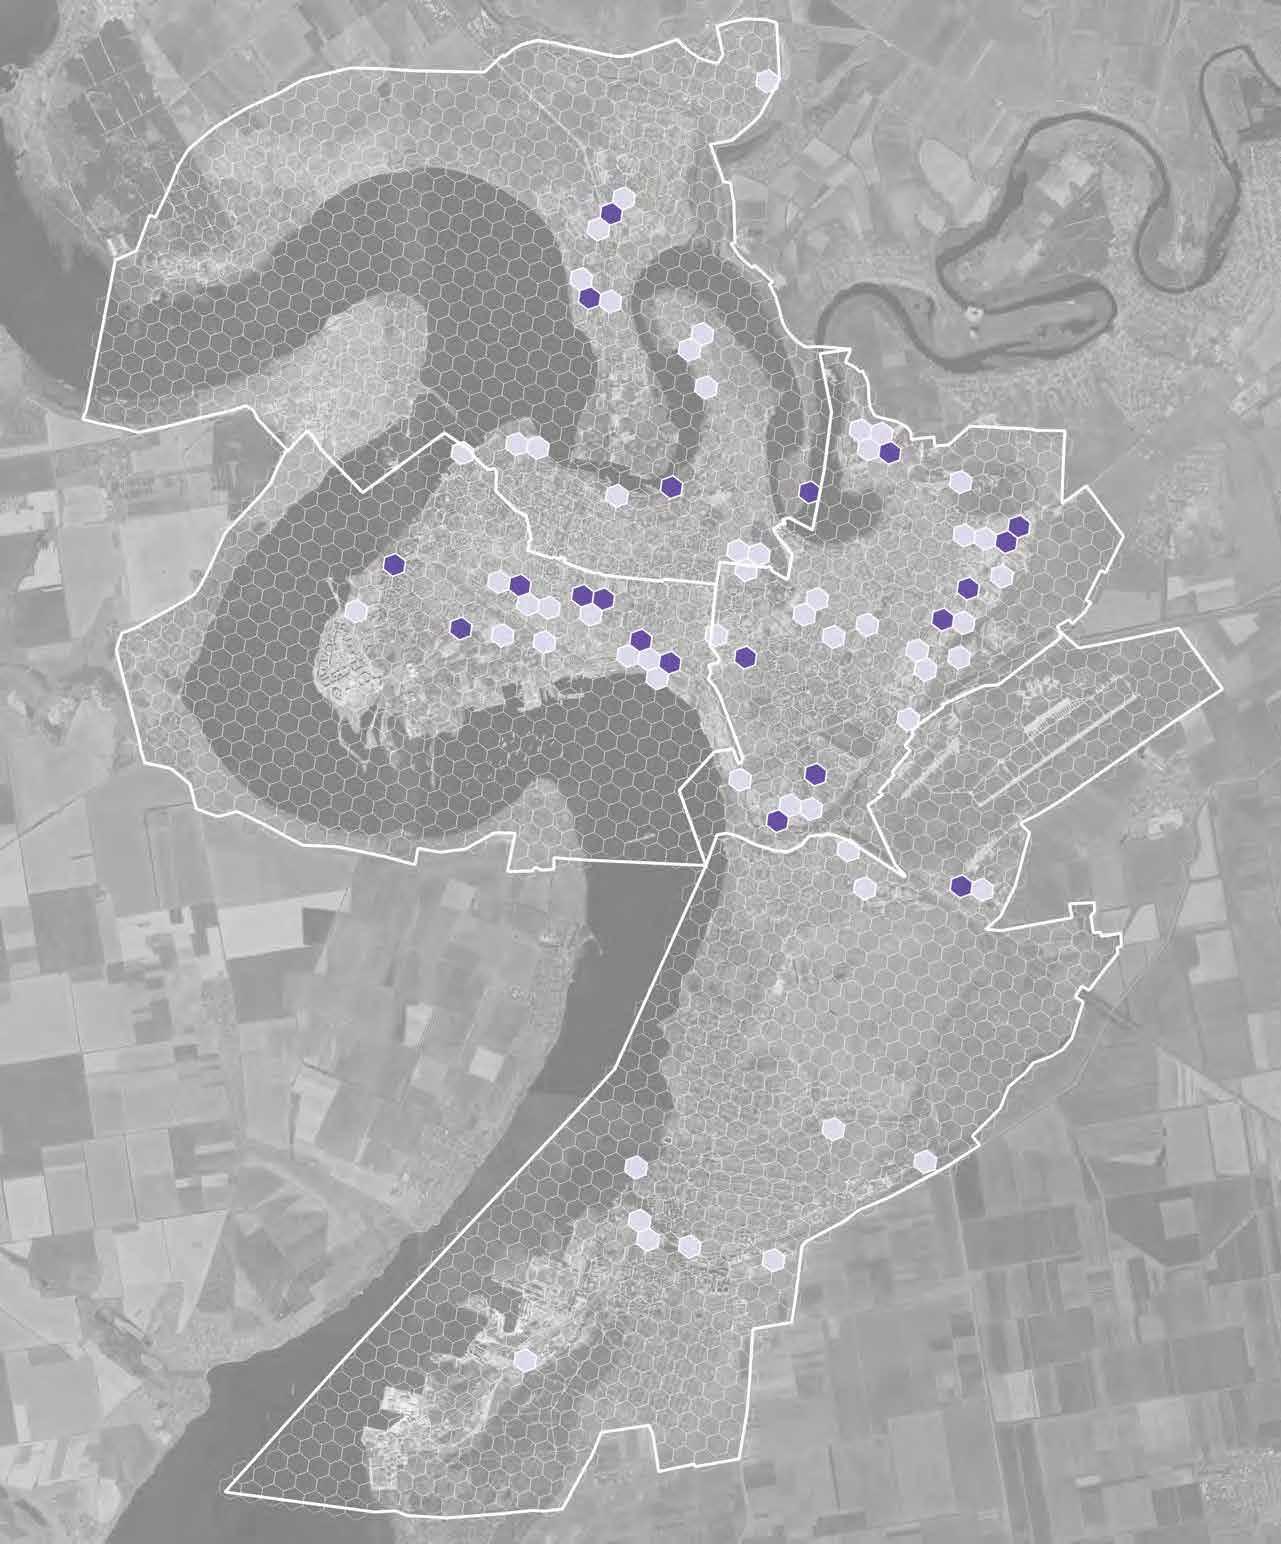
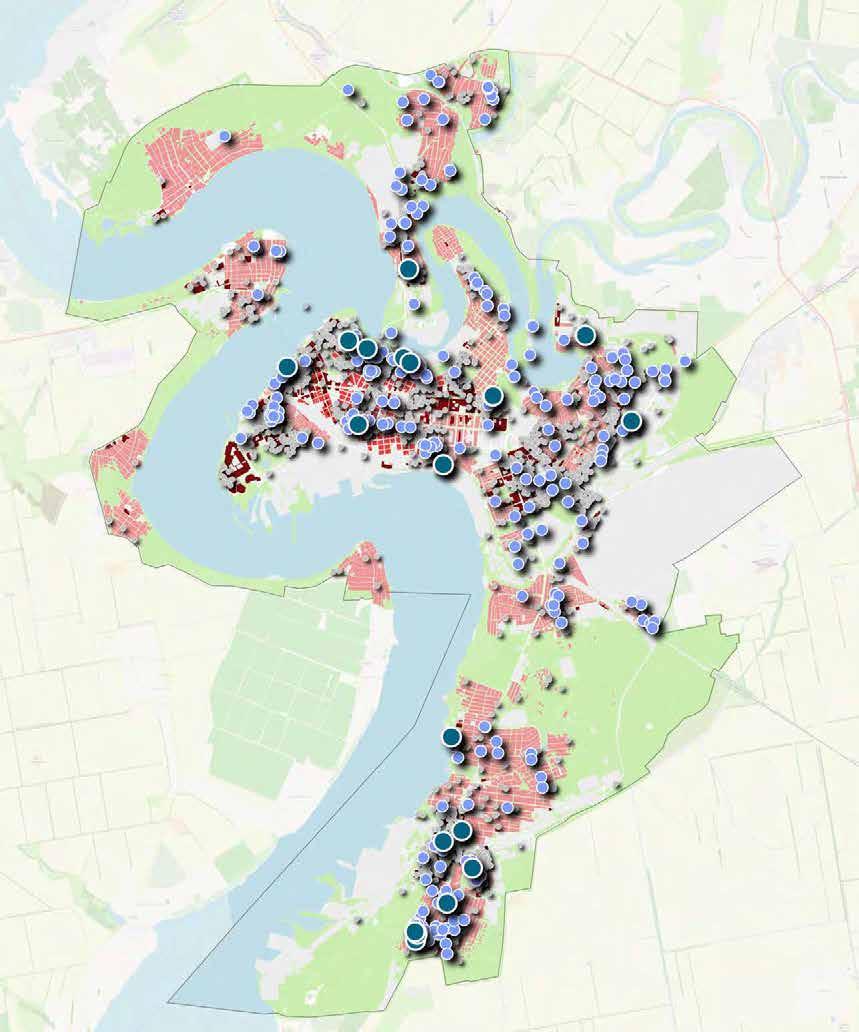
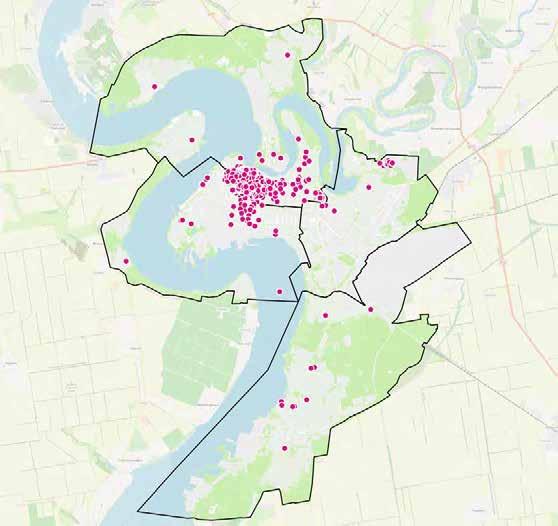
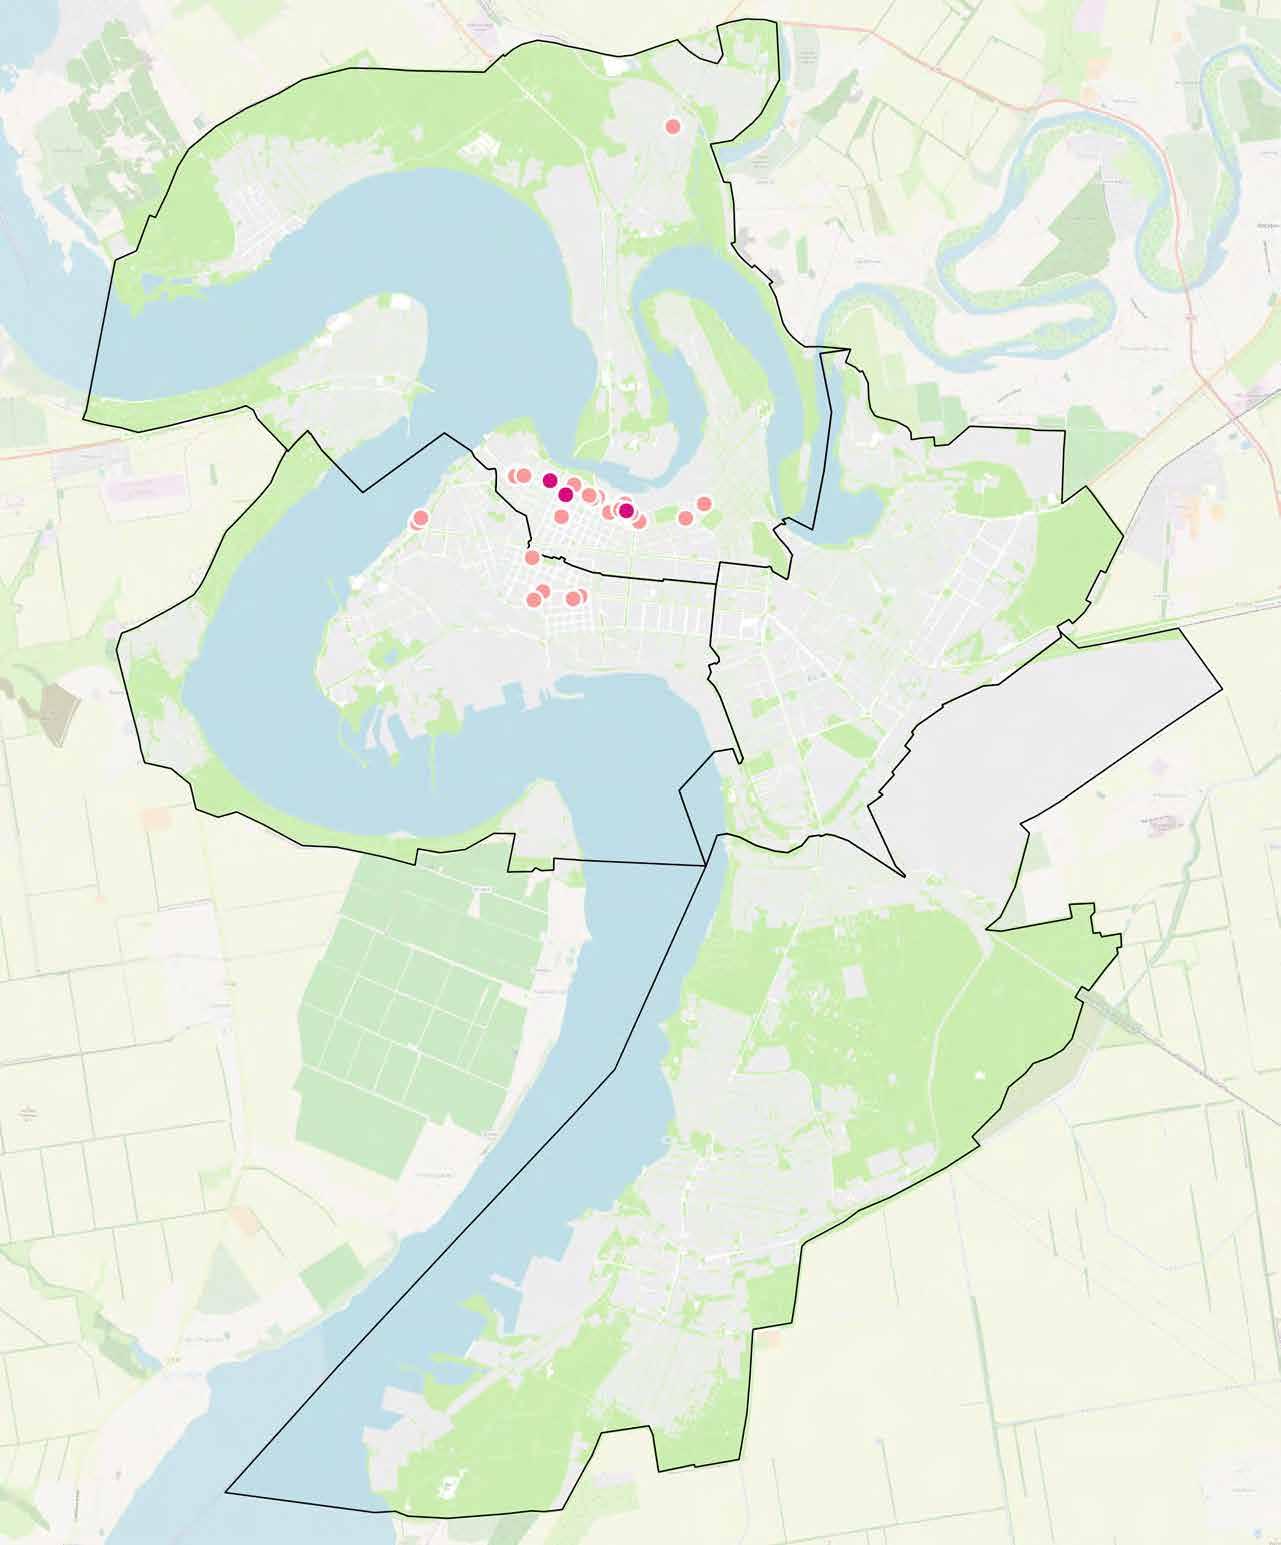
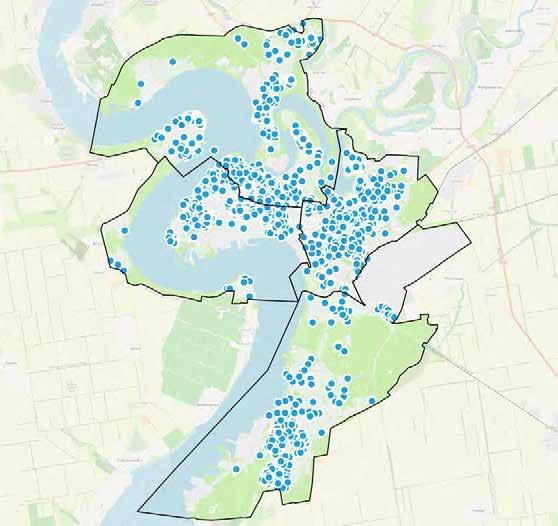
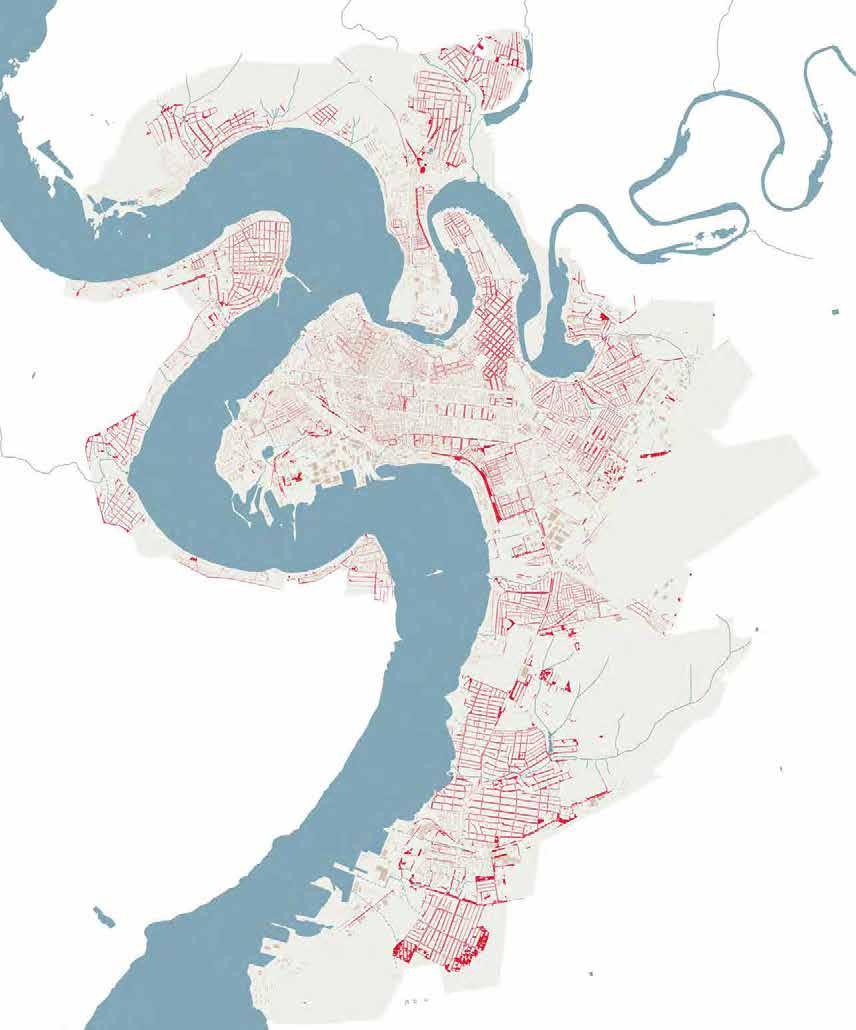
The received damage assessment database included two elements: 'points' containing information on the level of damage of individual objects, and 'polygons' that helped identify damaged buildings but provided less detailed information compared to the point data.
To better understand damage density and intensity and to conduct initial city-scale analyses, point data were aggregated into a spatial base. This is a standard Geographic Information System (GIS) operation that facilitates trend and cluster identification, streamlines processes, and simplifies visualization.
A regular grid was chosen as the spatial base due to its ability to support fine-grained analysis without being influenced by irregular building shapes and sizes. As a standard spatial data format in GIS analysis and mapping, this expedites the analysis process and ensures standardized results.
While the regular square (fishnet) grid is commonly used, the hexagonal grid is more suitable for point aggregation analysis. Hexagons mitigate sampling bias resulting from grid edge effects. Moreover, rectangular grids can draw attention to straight, unbroken, parallel lines that may obscure underlying data patterns. Hexagons tend to break up such lines, making data patterns with curvature more evident and accessible. Lastly, a hexagonal grid is less prone to distortion by the earth's curvature compared to a fishnet grid; this appears to be particularly relevant for a project at city scale
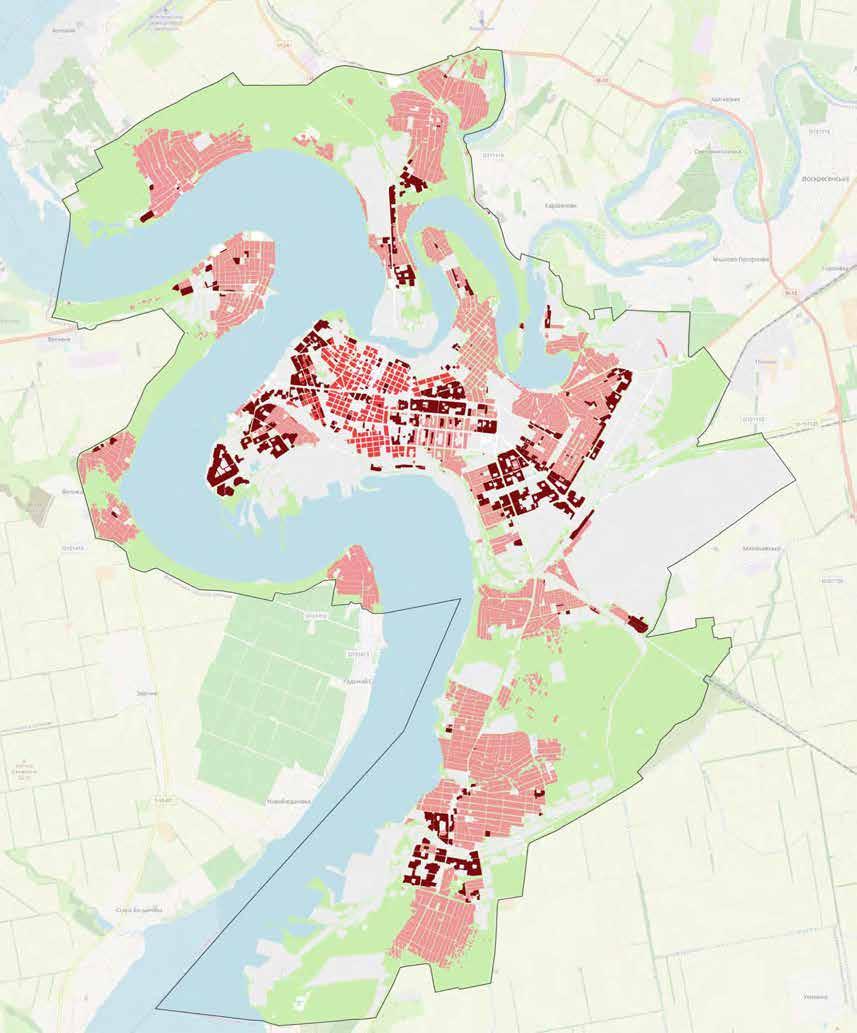
Damage analysis through a regular grid
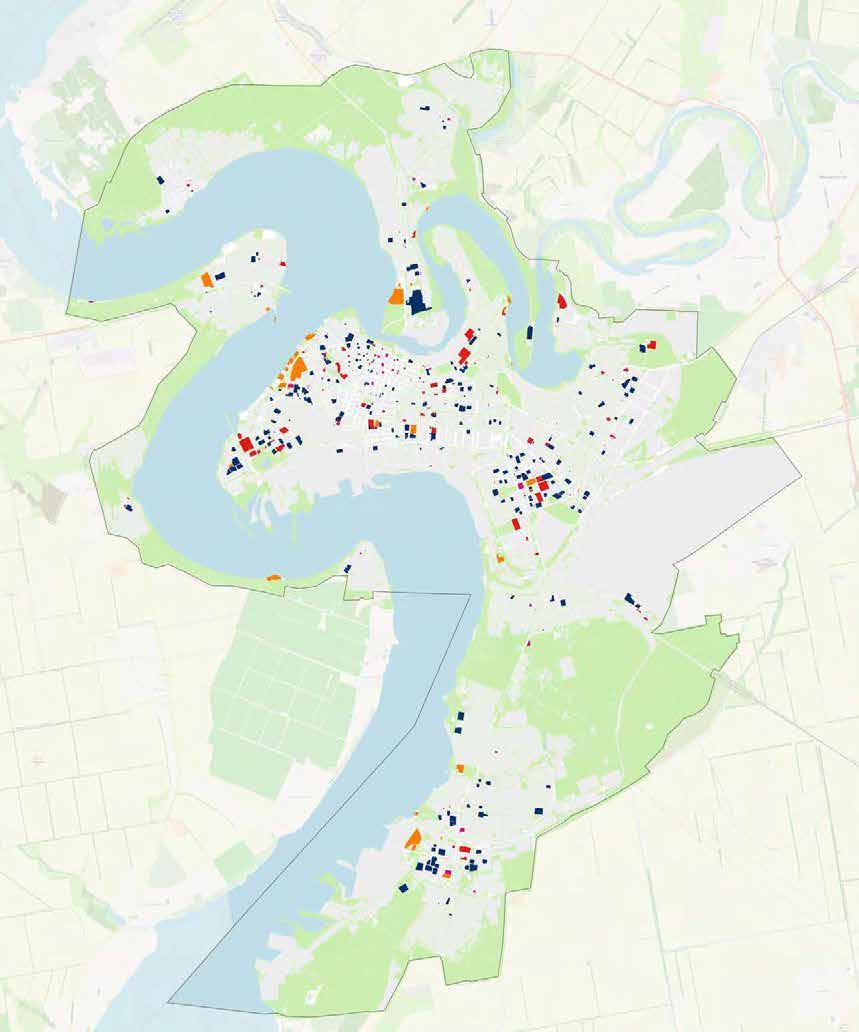
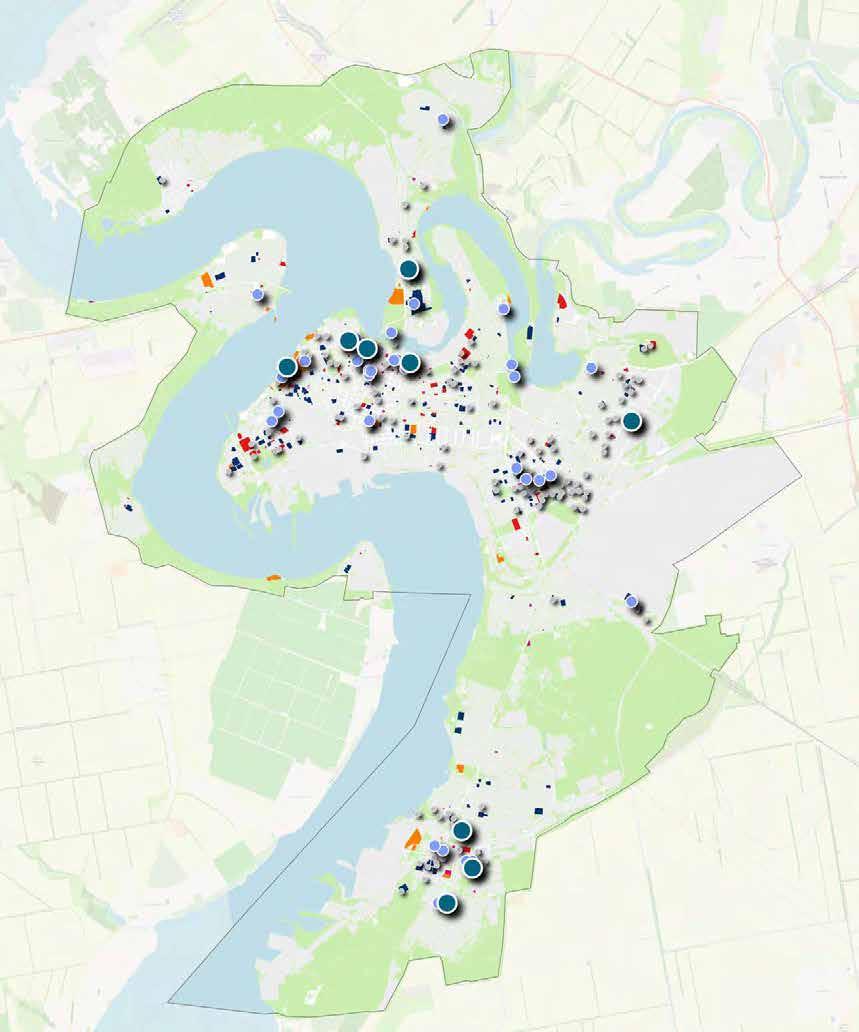
Damage analysis per urban block
ZAVODSKYI DISTRICT*
In the data collection process, it's important to note that the project team and volunteers found it relatively easier to gather information about damaged objects in central areas, where even minor damages were detectable. Furthermore, as conveyed by the Municipality representatives during a meeting on December 15th 2022, military zones were excluded from the damage assessment due to their inaccessibility. As a result, the total assessment for industrial areas may underestimate the actual extent of damage.
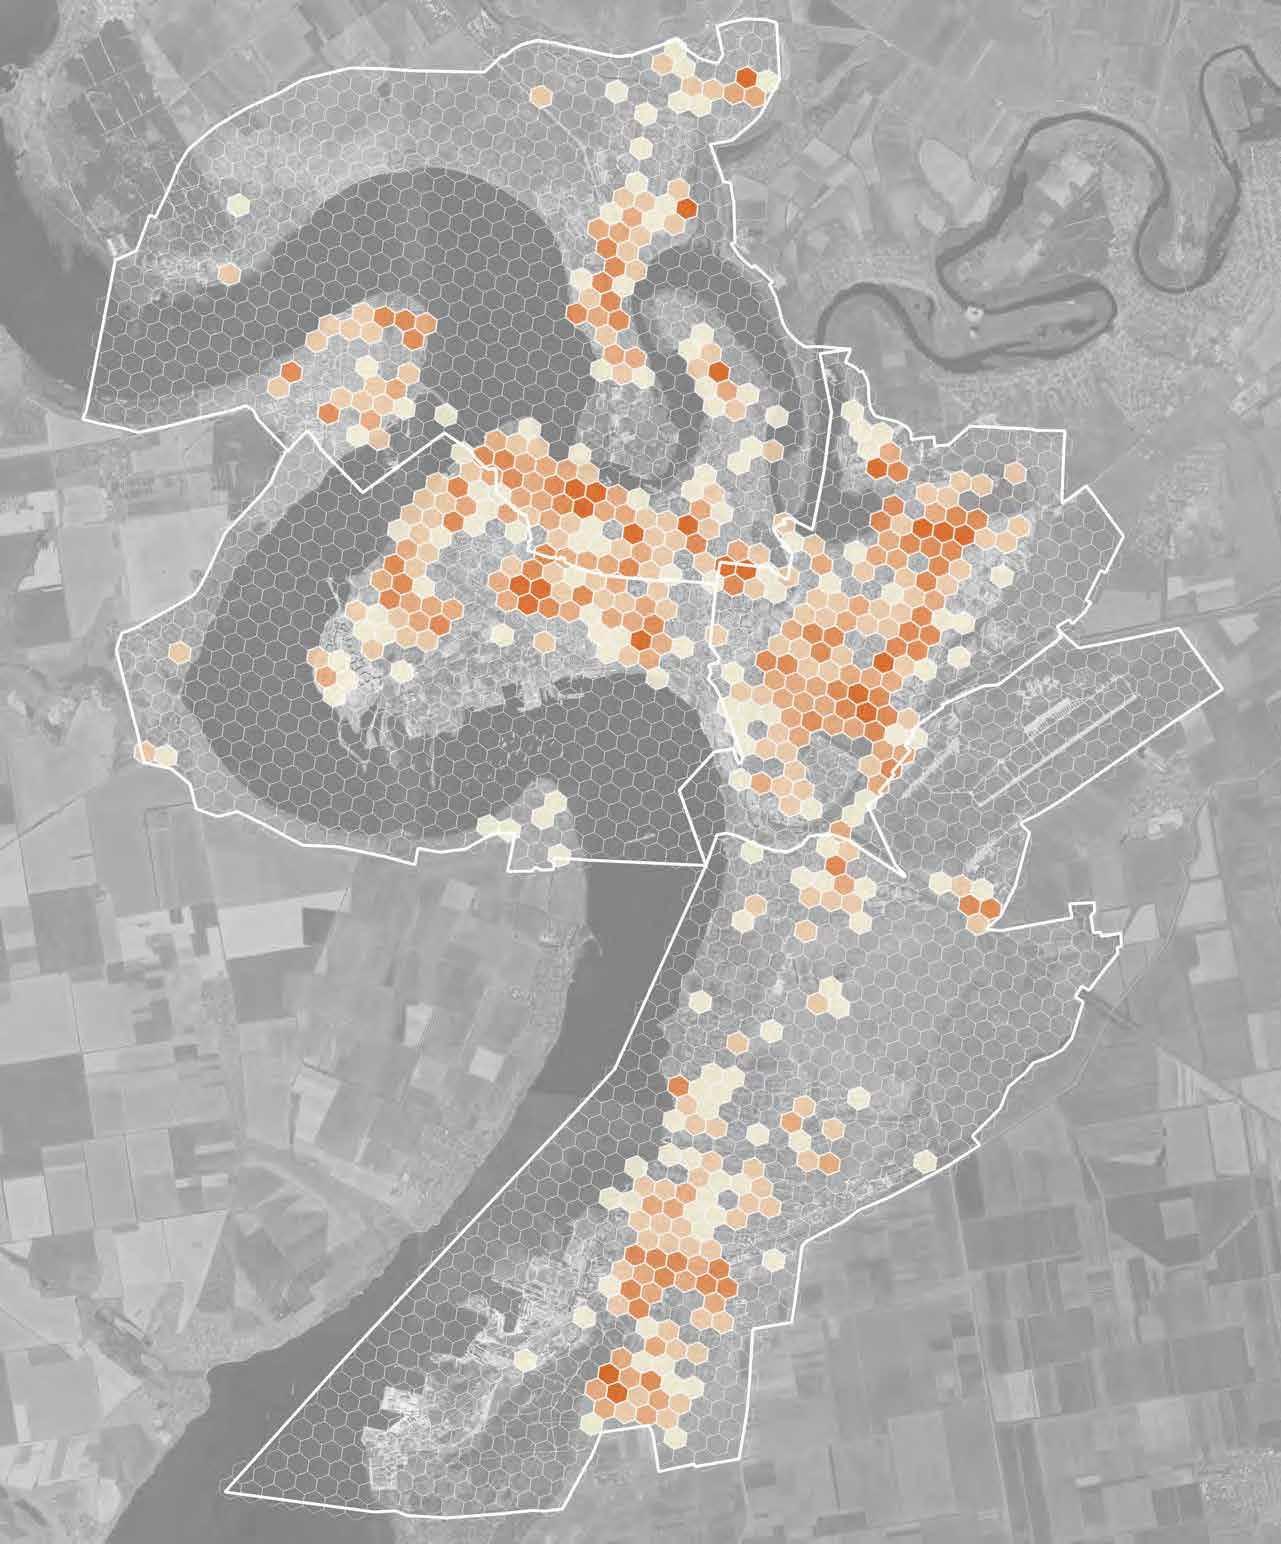
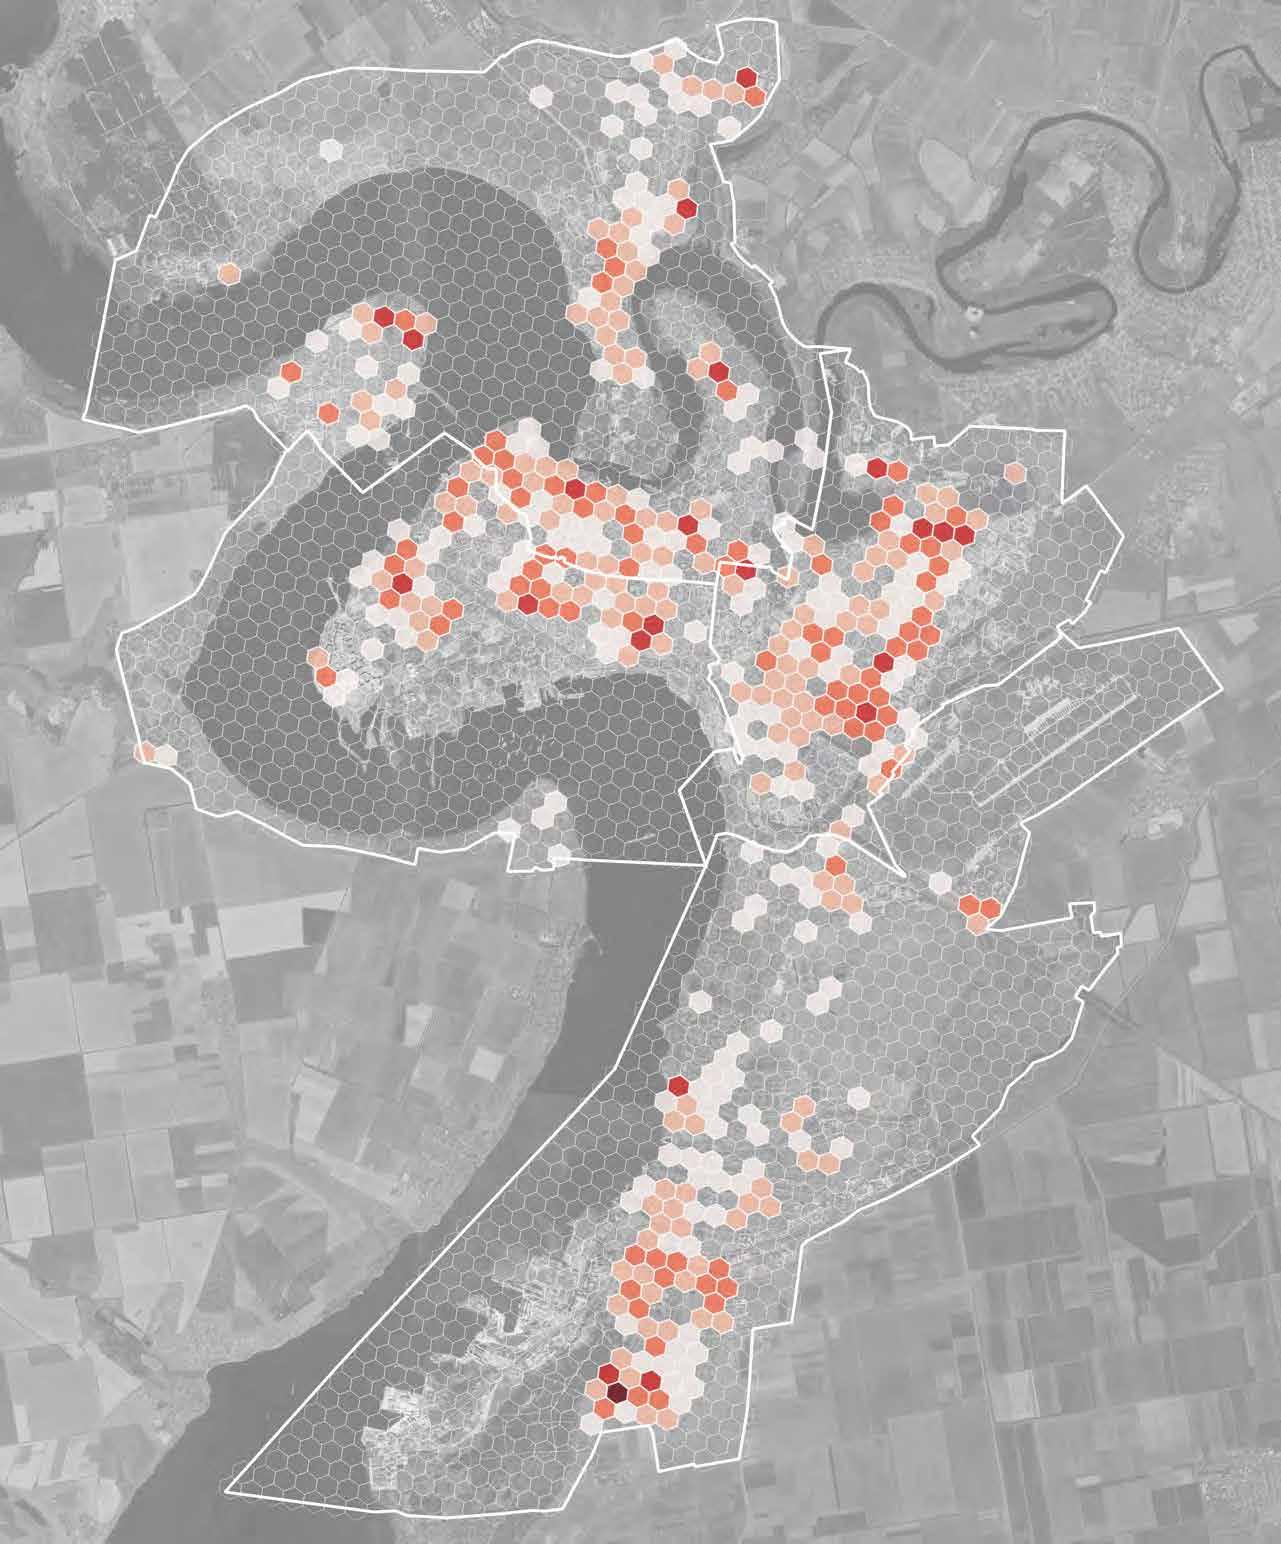
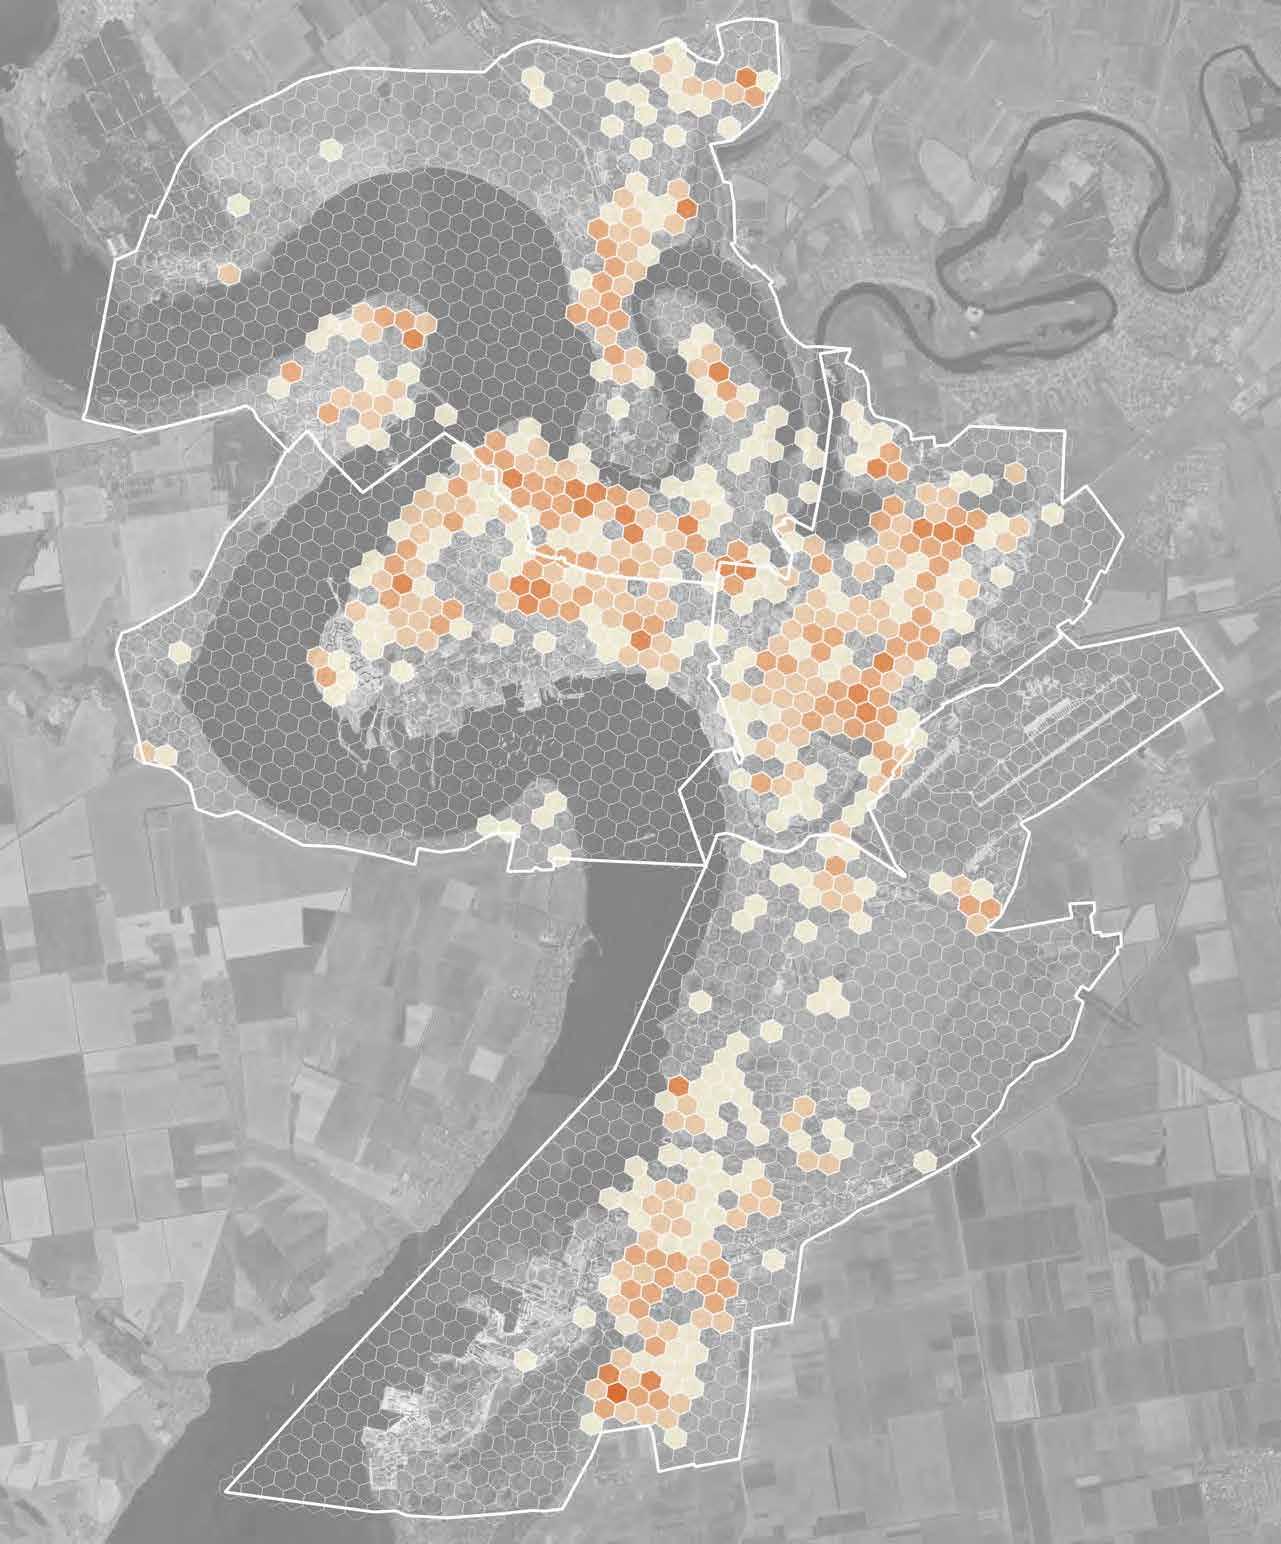
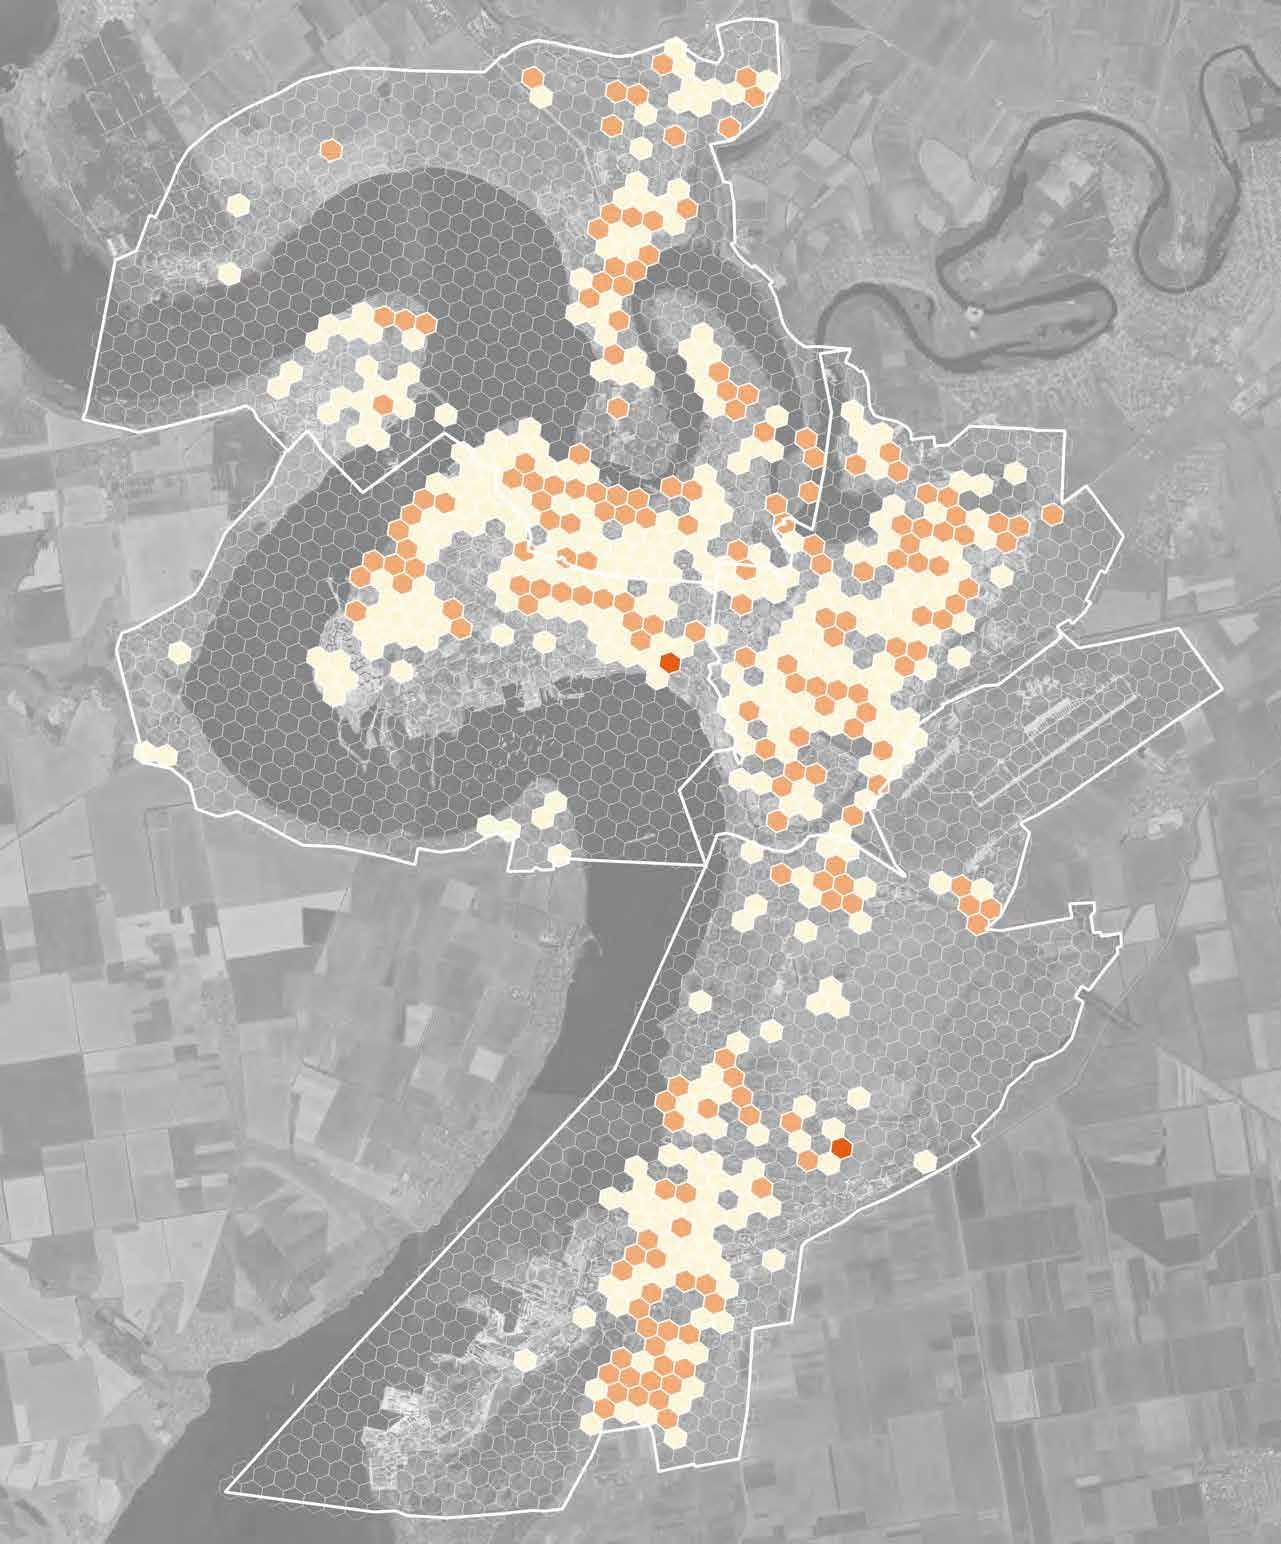
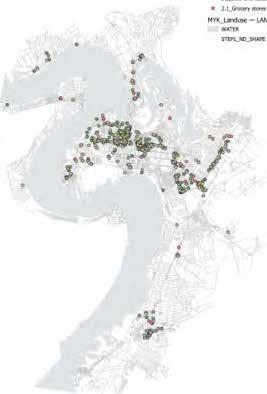
The Macro Scale Damage Assessment was based on the analysis of hits within each hexagonal grid cell. By overlapping this information with the 2019 (pre-conflict) land use data, it was possible to estimate the damage caused to four macro land use categories: residential, commercial, industrial and community facilities.
In order to assess the damage impact on the four primary land use category, several key indicators were taken into account:
• Square Meters (sqm) of Damages: representing land area as opposed to built up area. This limitation arises from the constraints of the available database.
• Most Common Cause of Damage: Identifying the prevailing reasons for damage.
• District with the Highest Concentration of Damage: Pinpointing the geographical areas where damage is most concentrated.
• Average damage intensity: each damage point contains a percentage that express the level of destruction
• Density of Hits: Indicates the number of damage incidents per individual grid cell.
• Main Category of Damage: Damage points are categorized as Category I (low), II (medium), or III (high) based on the intensity of the impact.
• Square Meters (sqm) of Damage per Cell: This measurement is linked to individual grid cells.
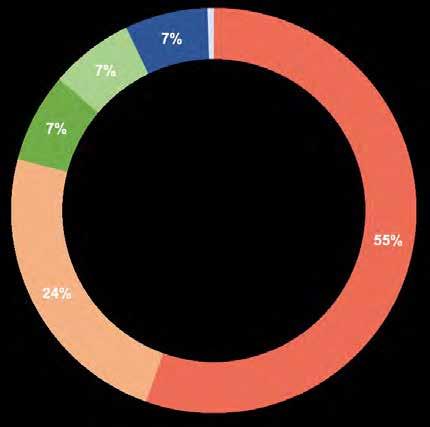
These indicators collectively contribute to a comprehensive understanding of the damage assessment and its implications across different areas and categories. The residential built environment bore the brunt of the impact, with an estimated damage extent of approximately 200,000 sqm.
The following section illustrates the results of the Macro Scale Analysis per land use type.
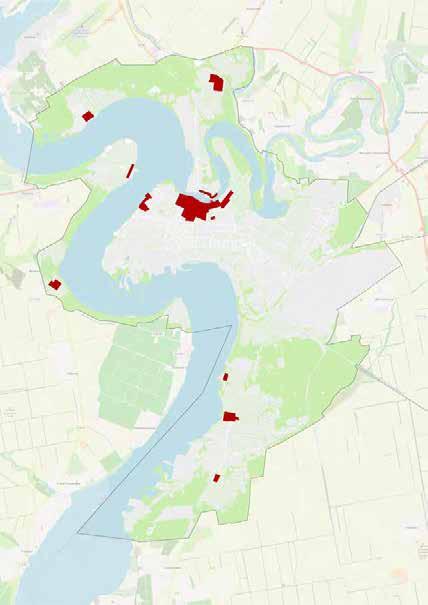
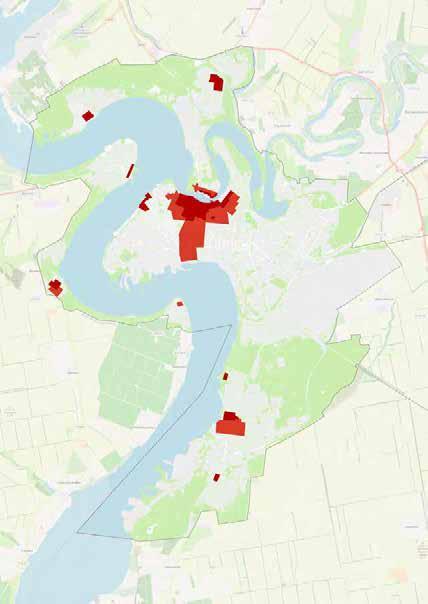
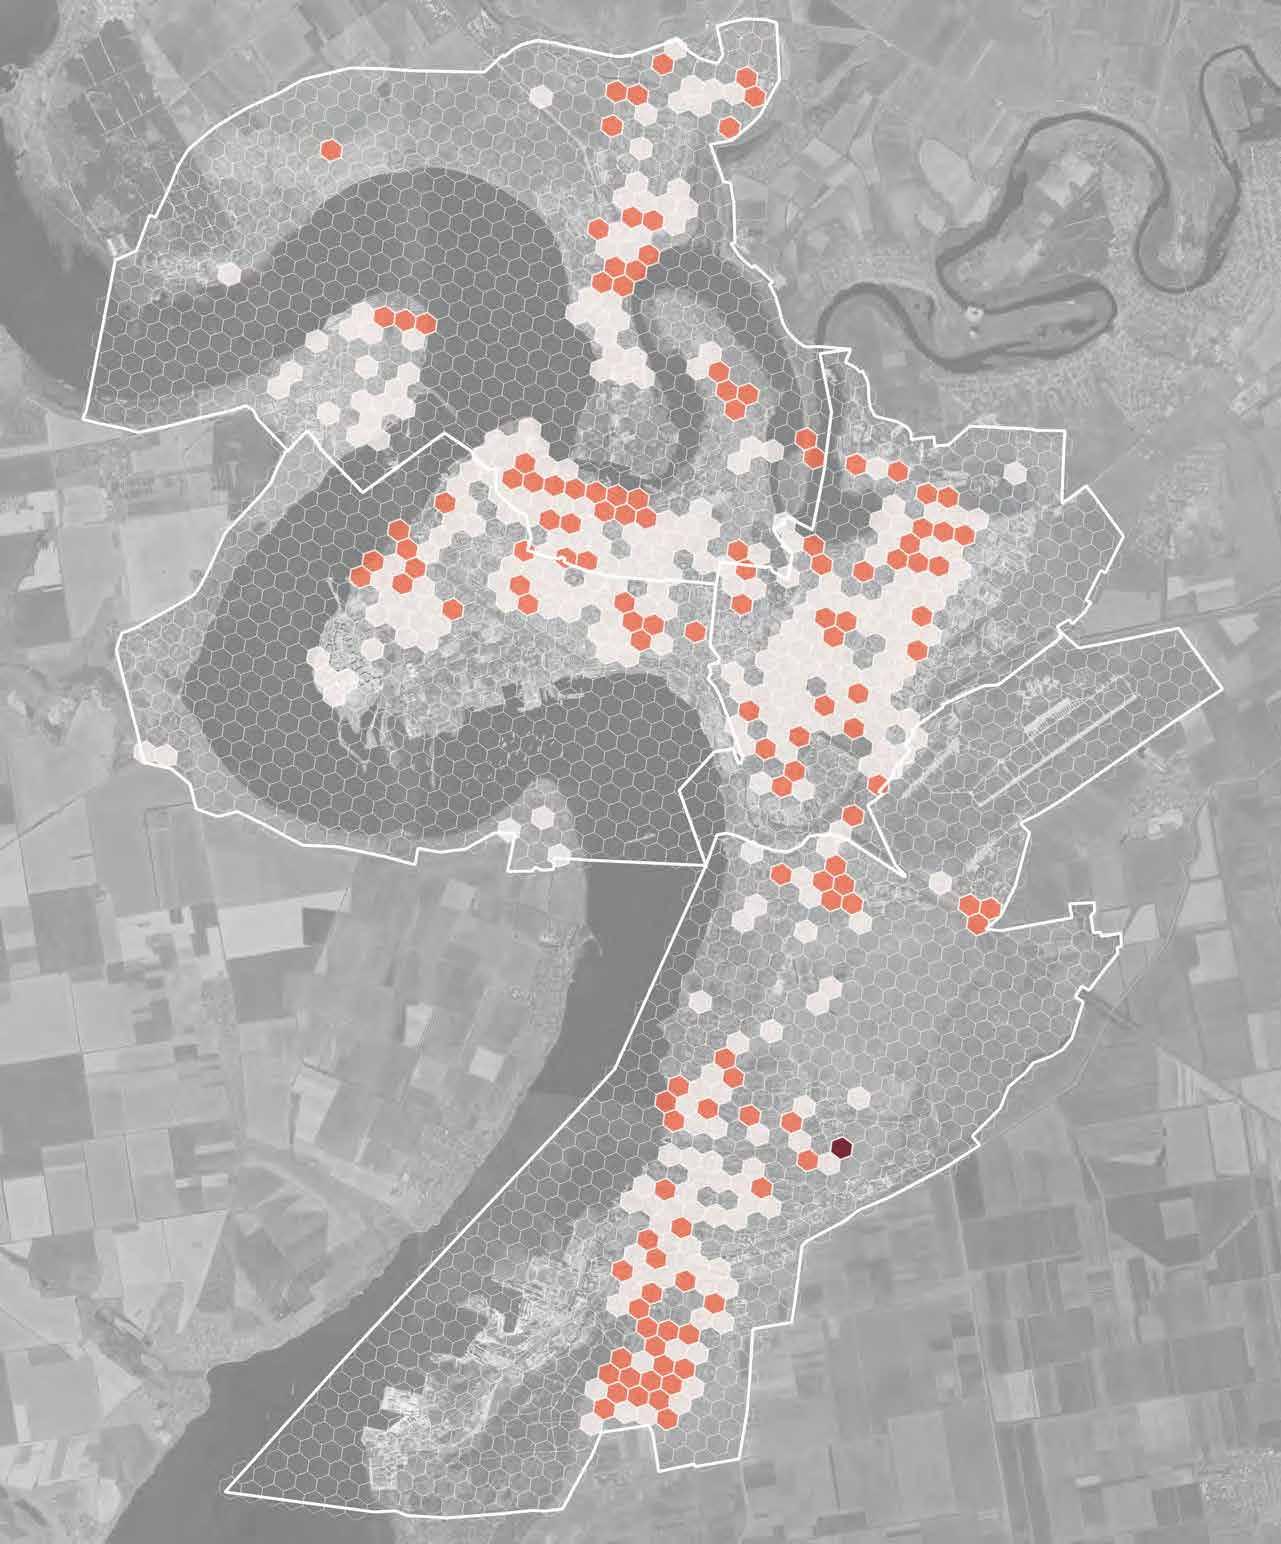
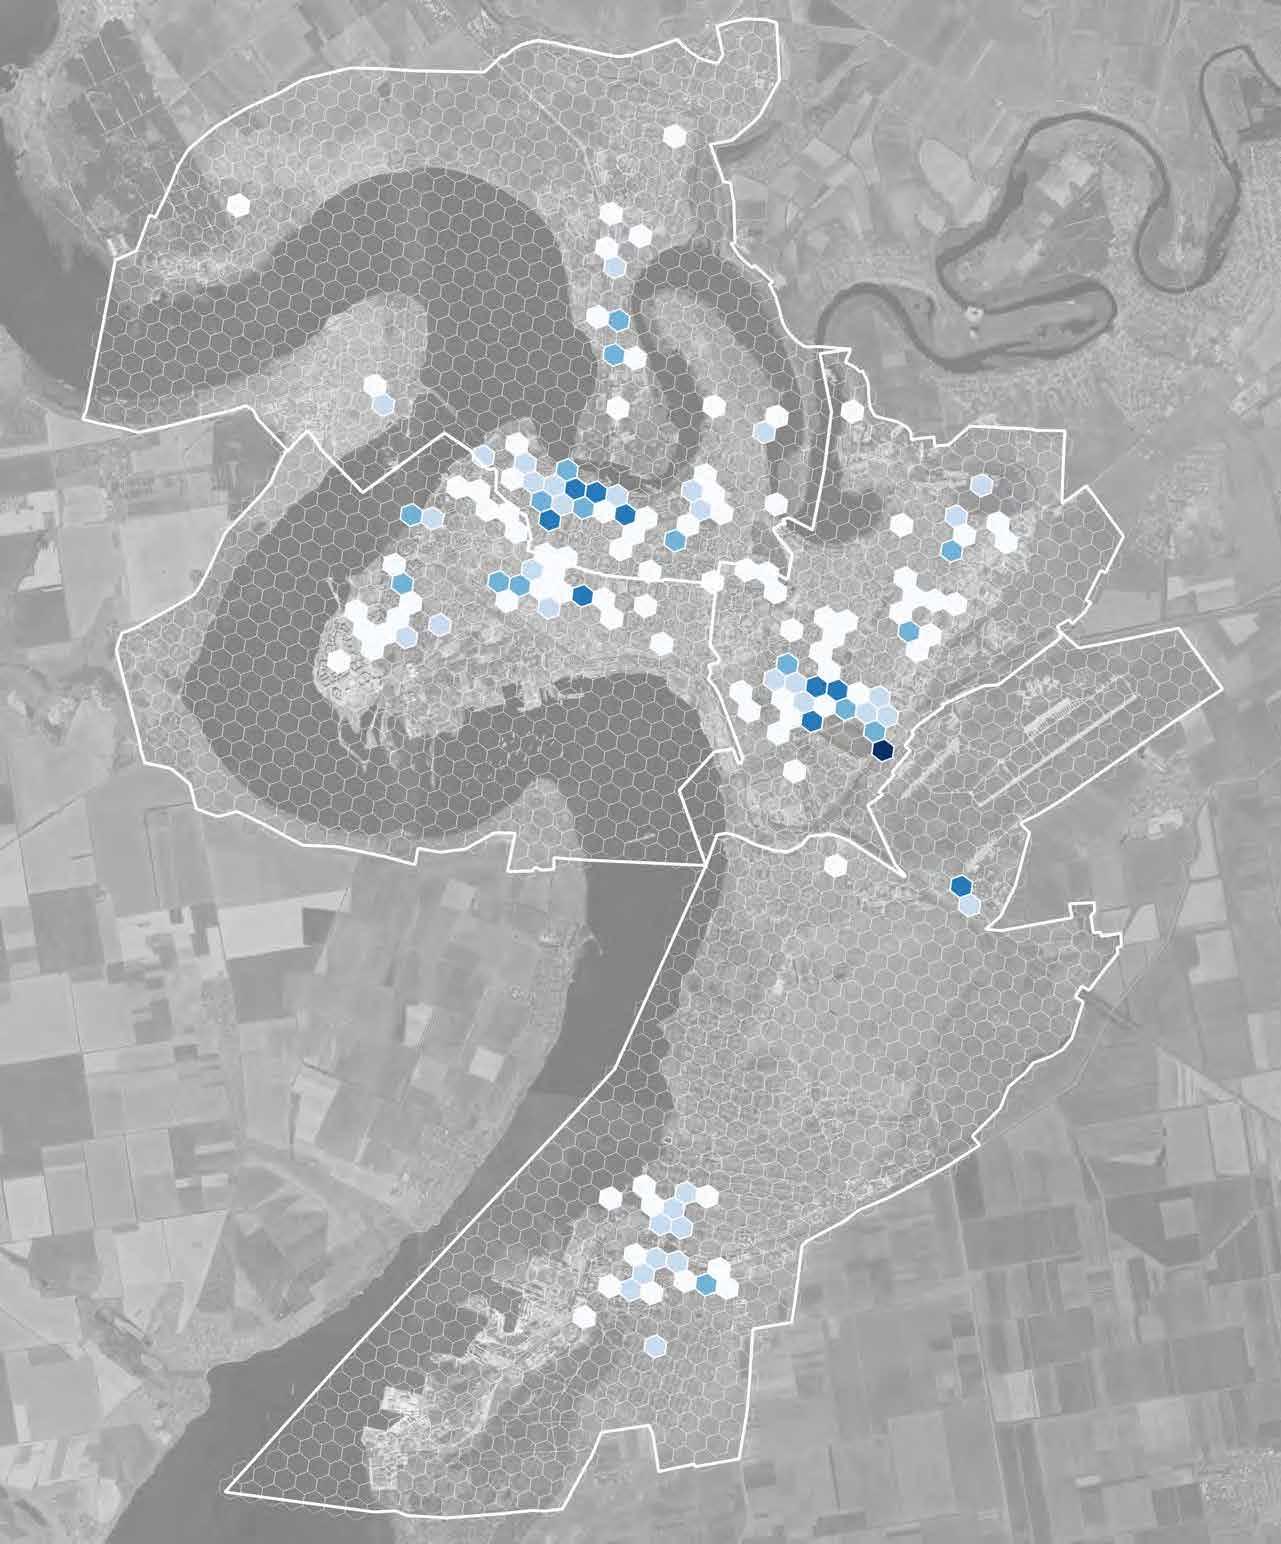
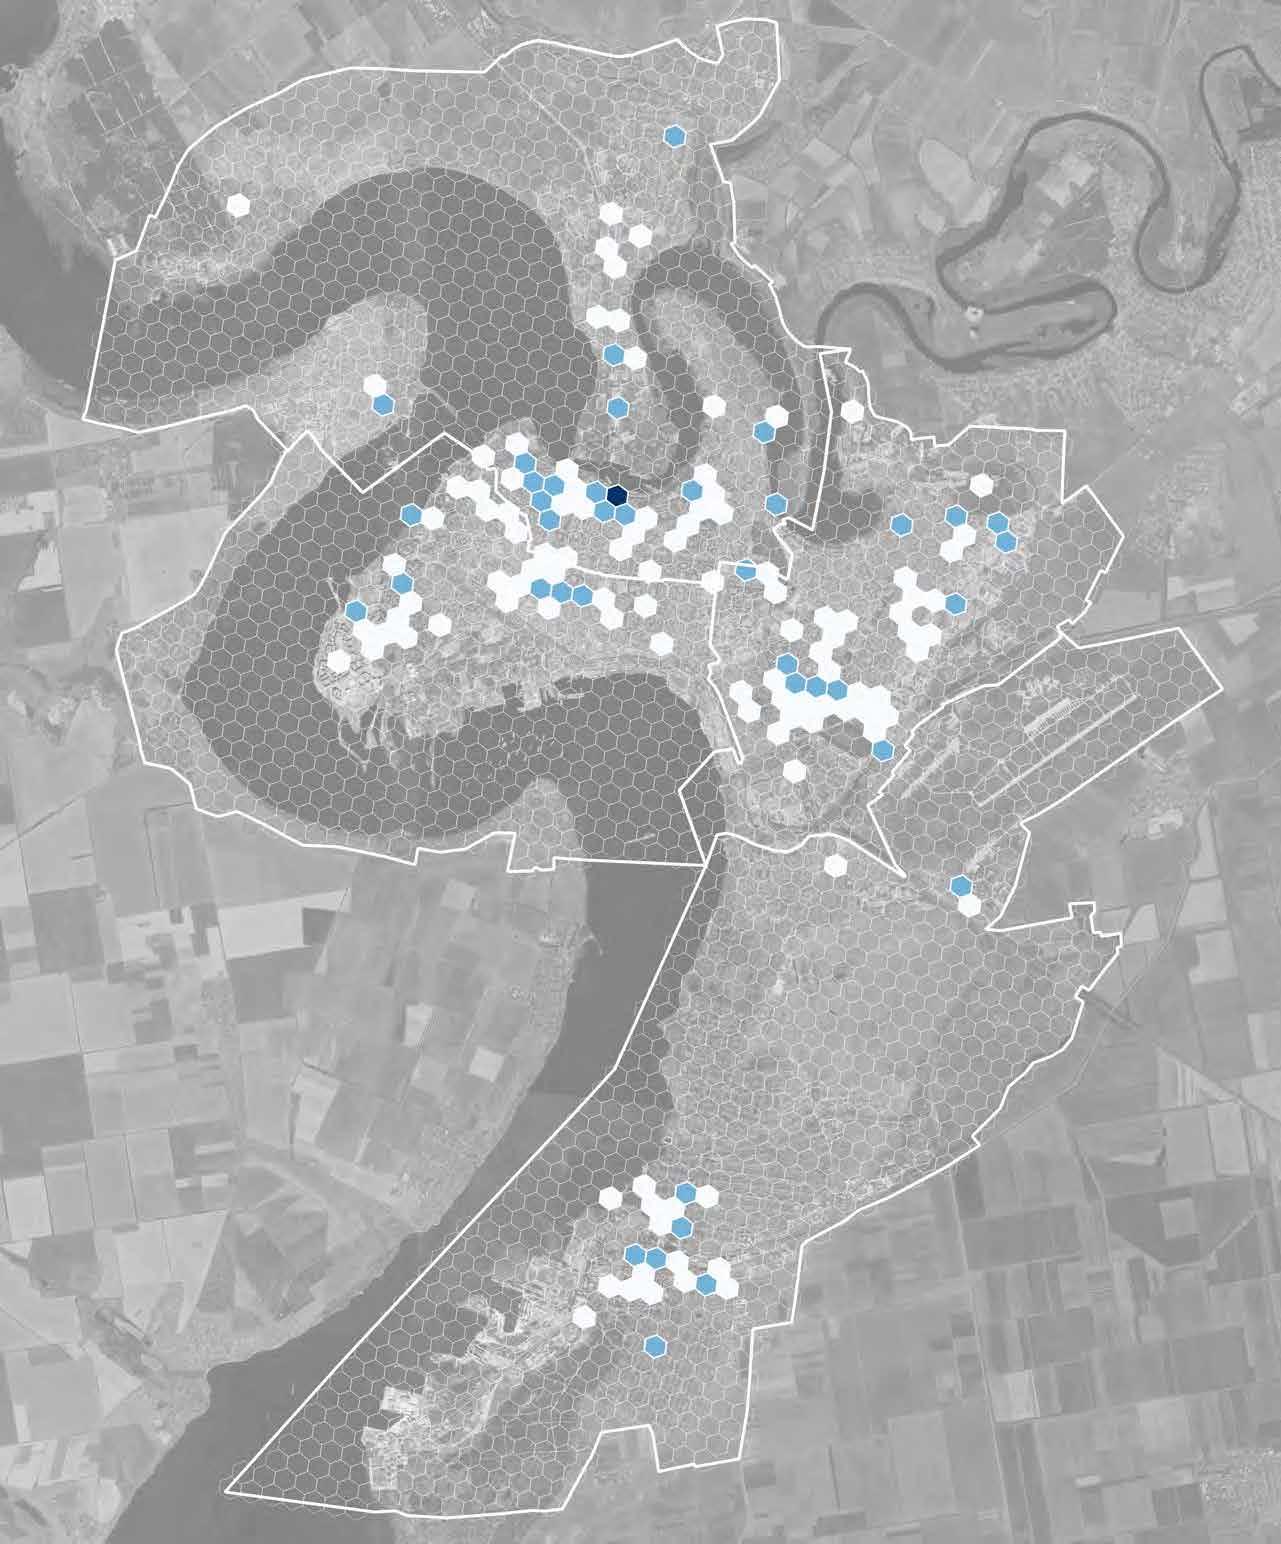
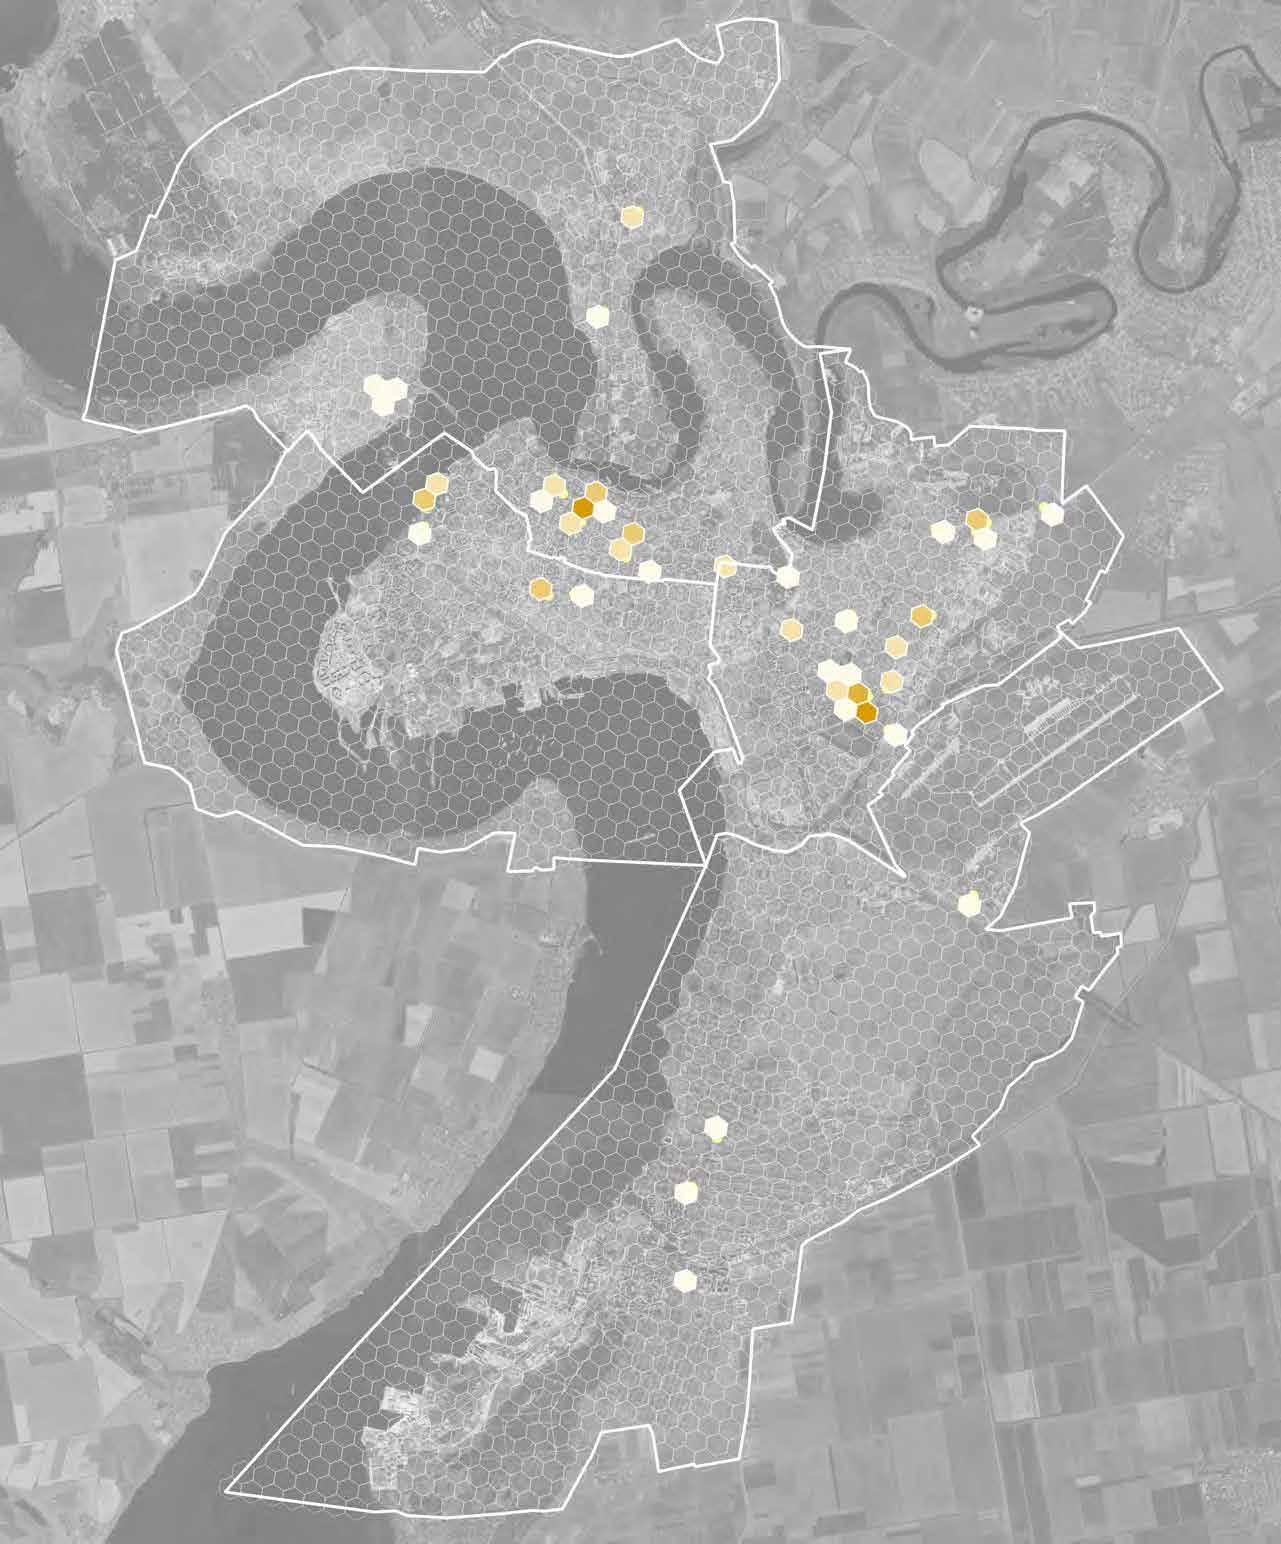
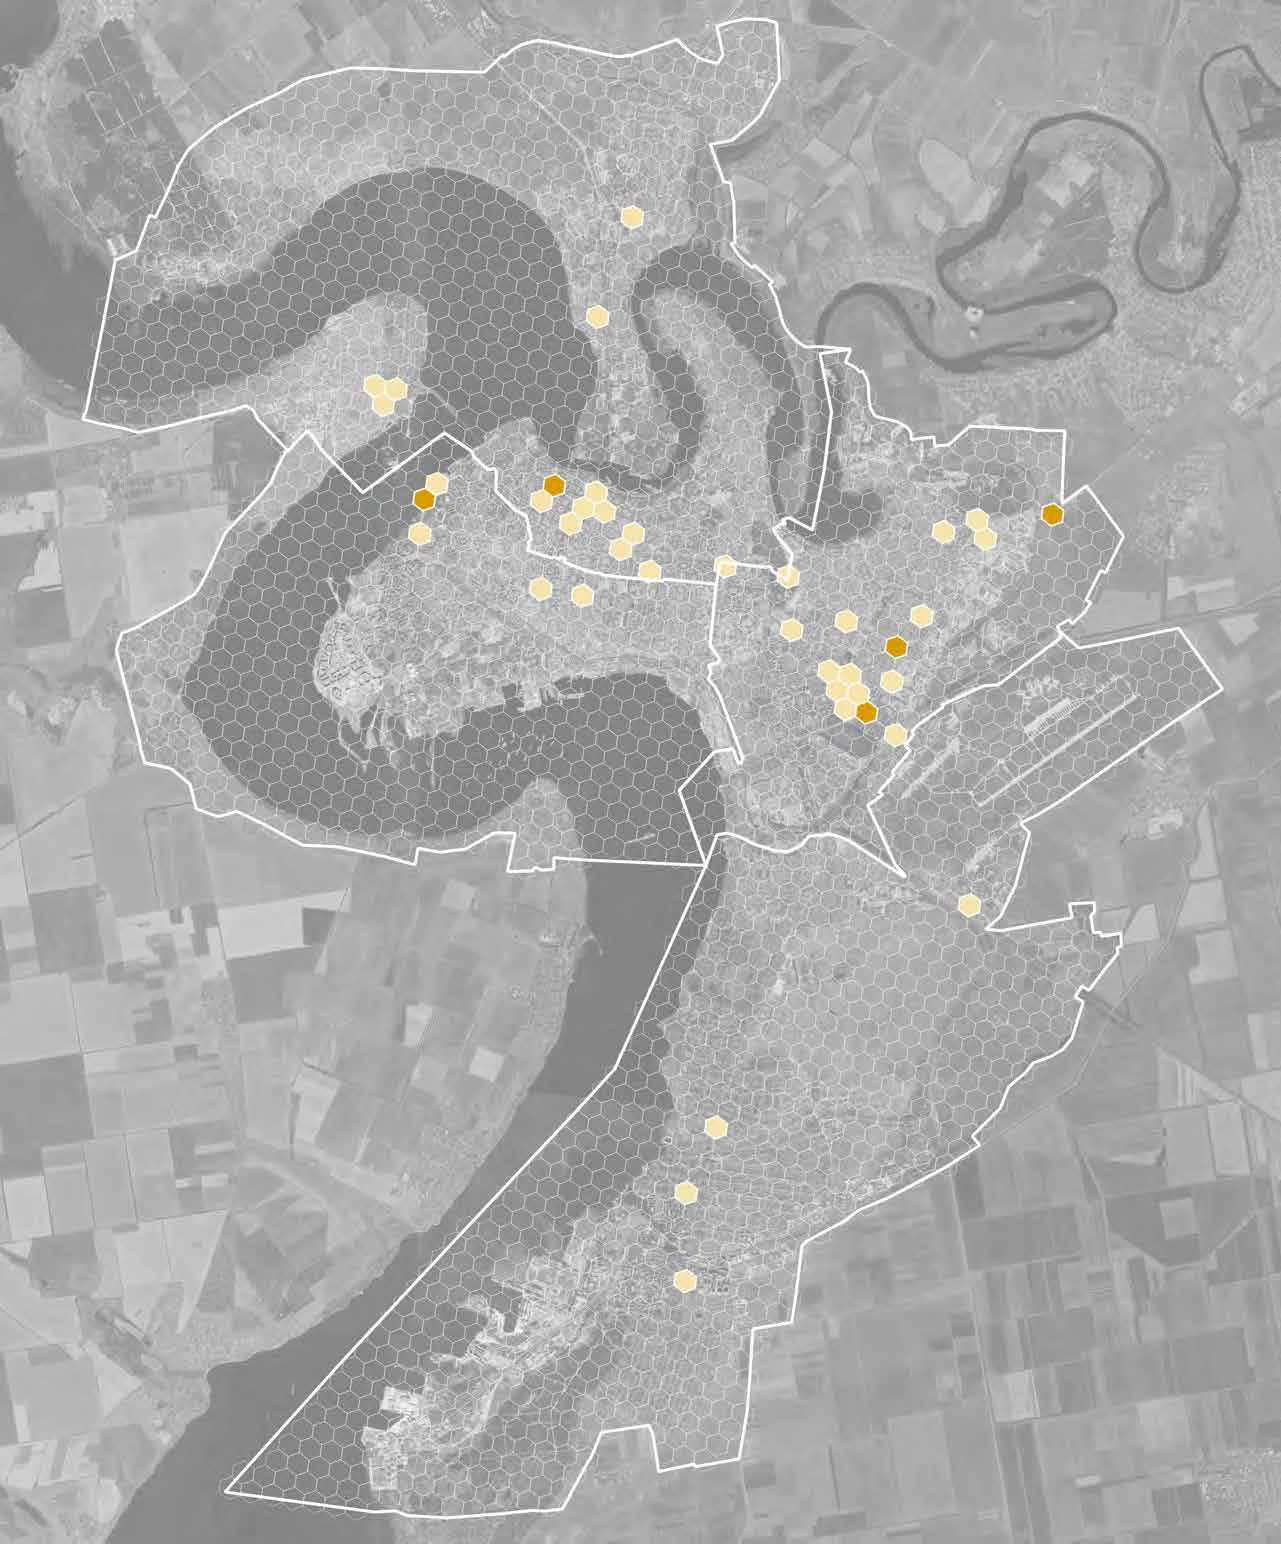
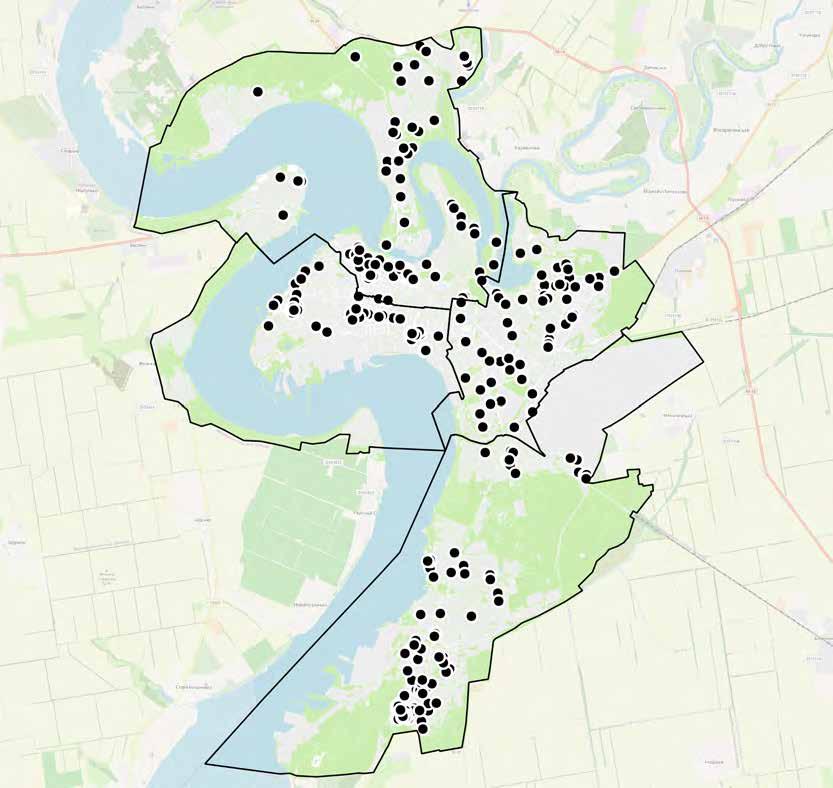
Three categories of damages were identified:III (high), II (medium) and I (low).
The number of hits was mapped based on the average damage intensity within the exagonal grid.
The analysis includes also average damage intensity, total damaged area, the most common damage causes, and the district with the highest concentration of damaged objects.
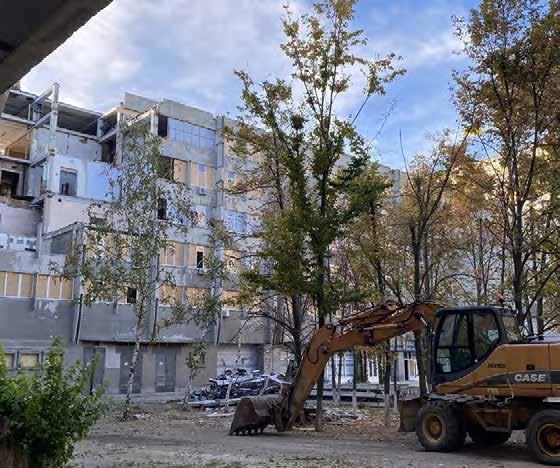
Damage category 3
Damages are classified into three distinct categores.
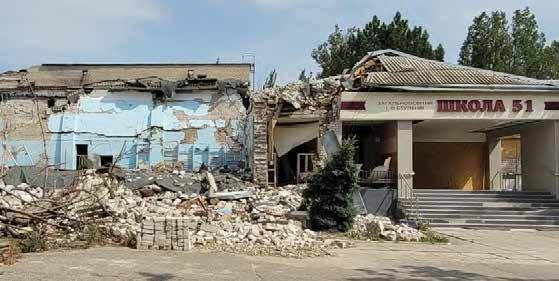
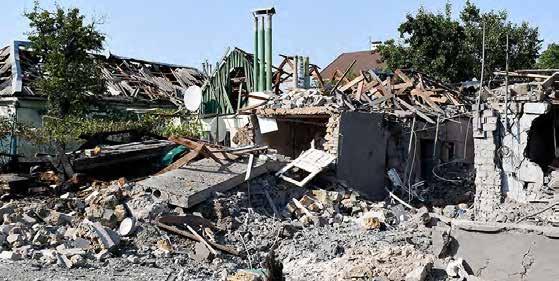
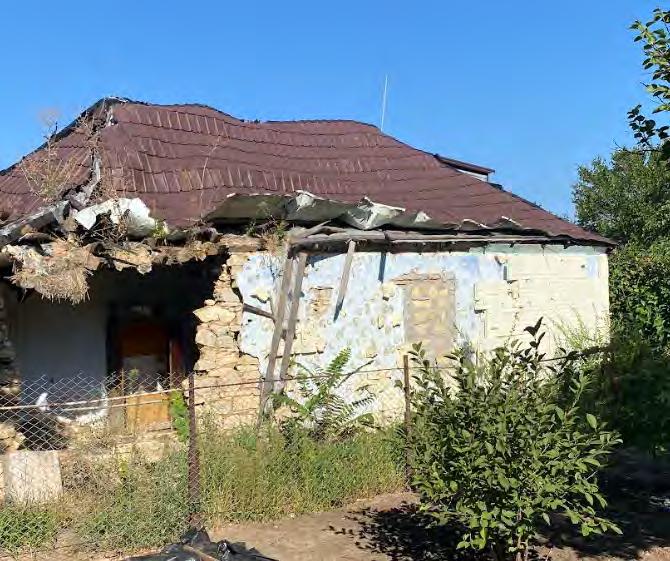
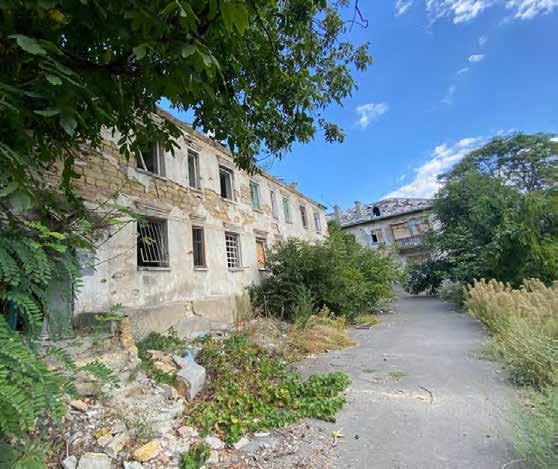
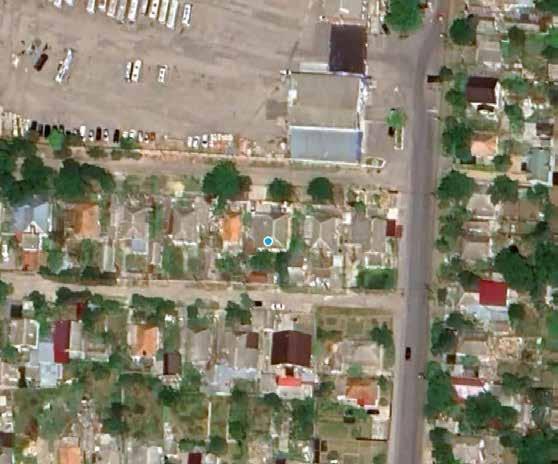
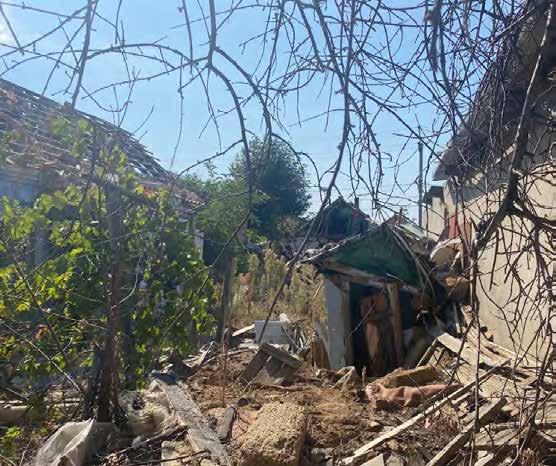
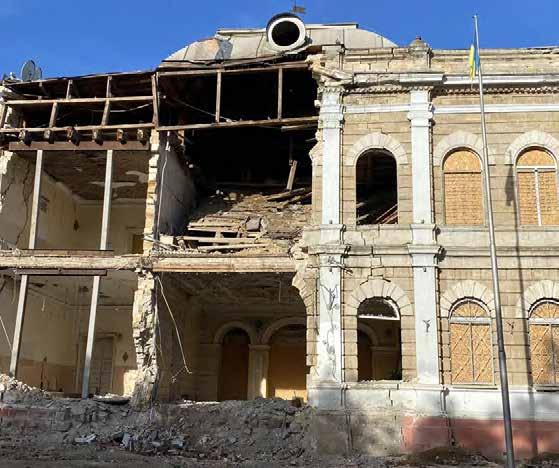
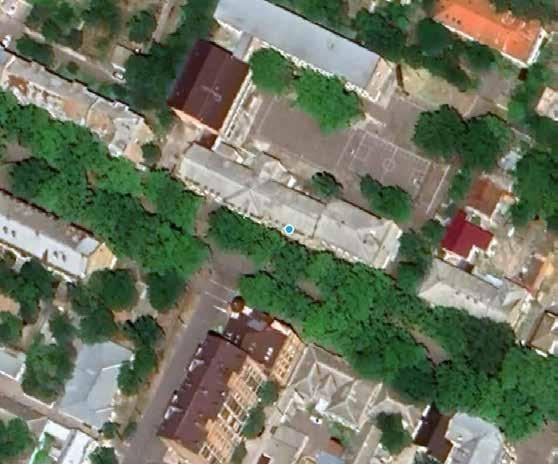
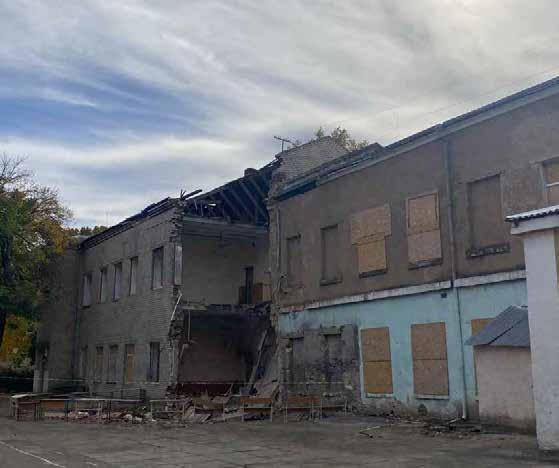
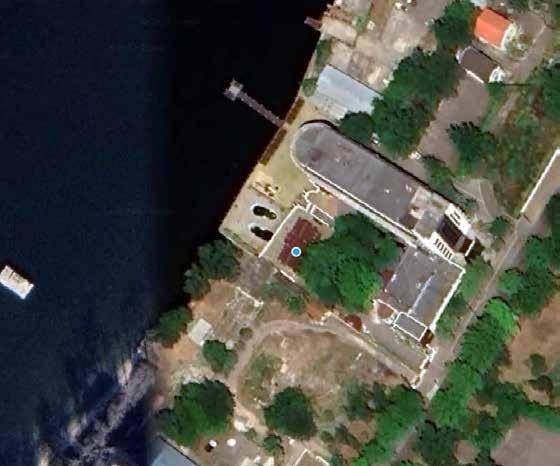
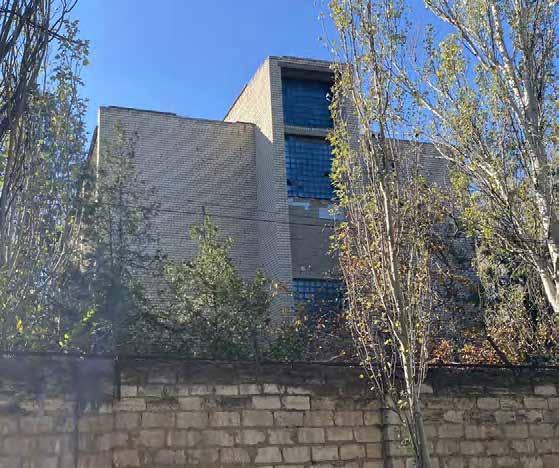
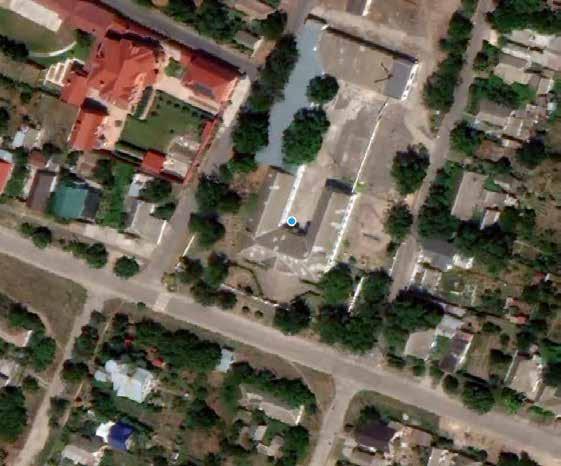
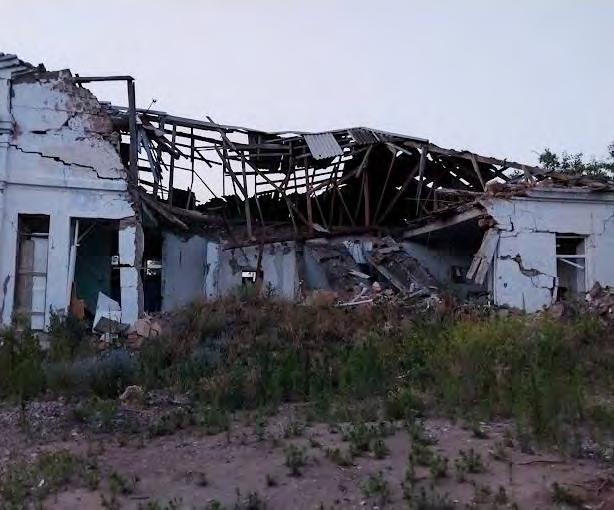
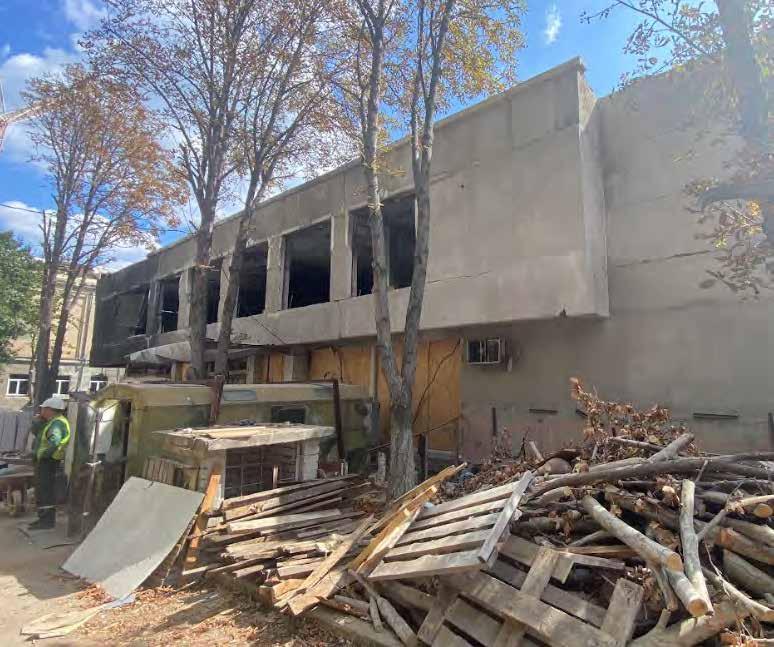
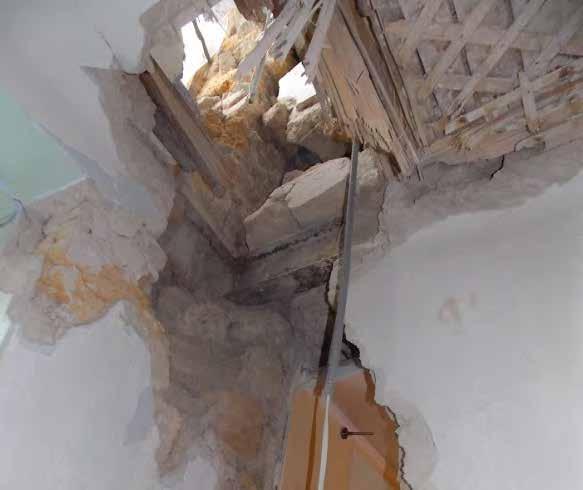
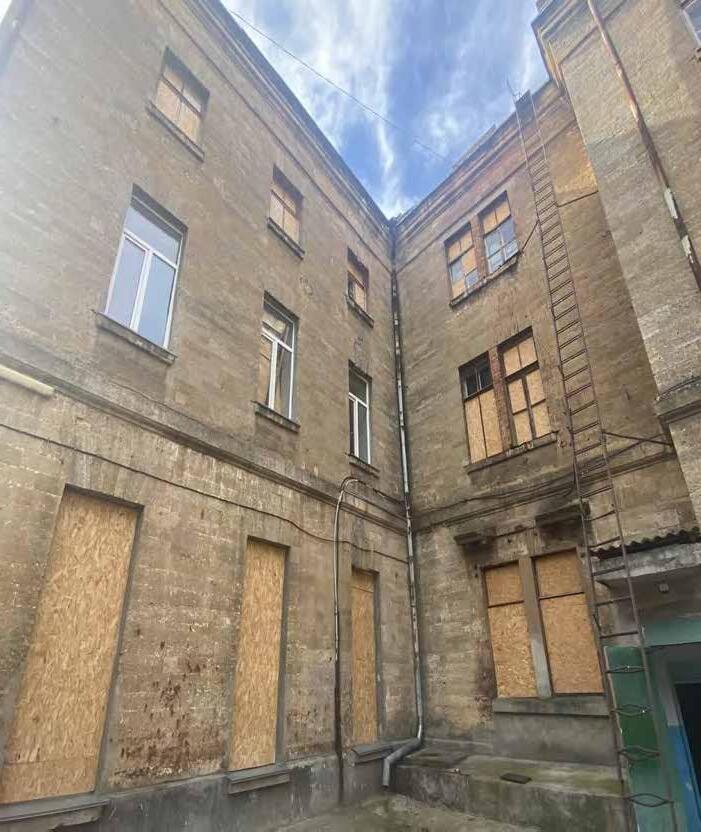
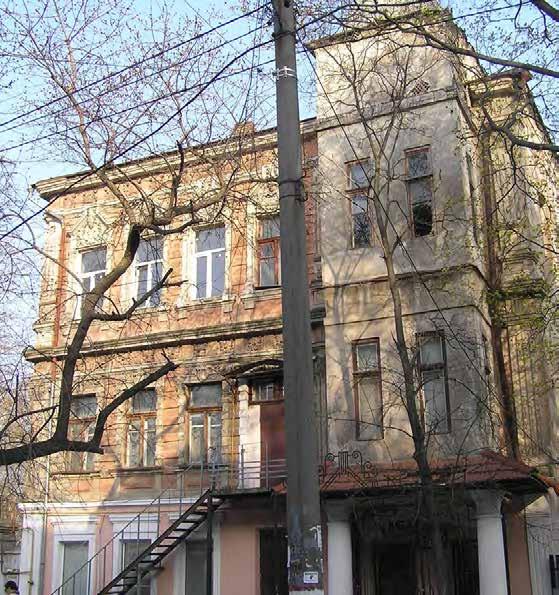
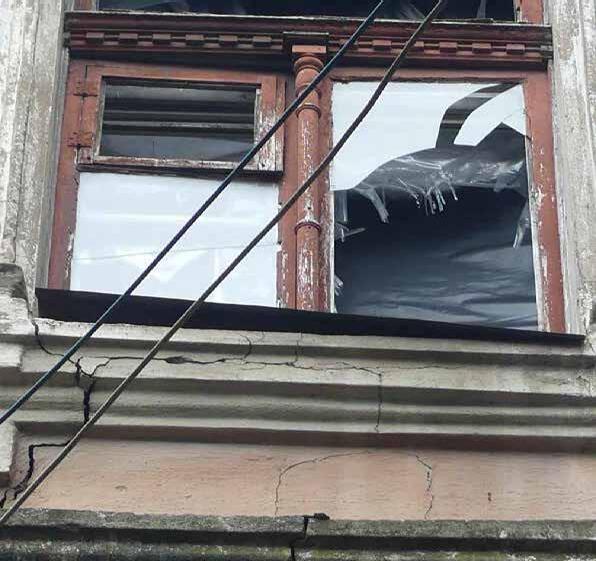
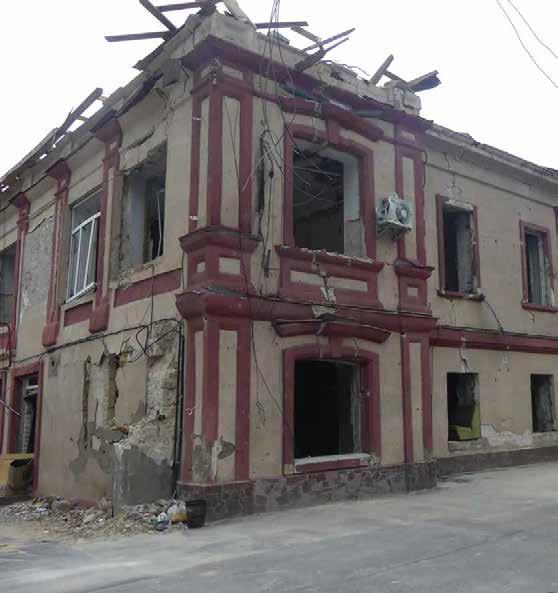
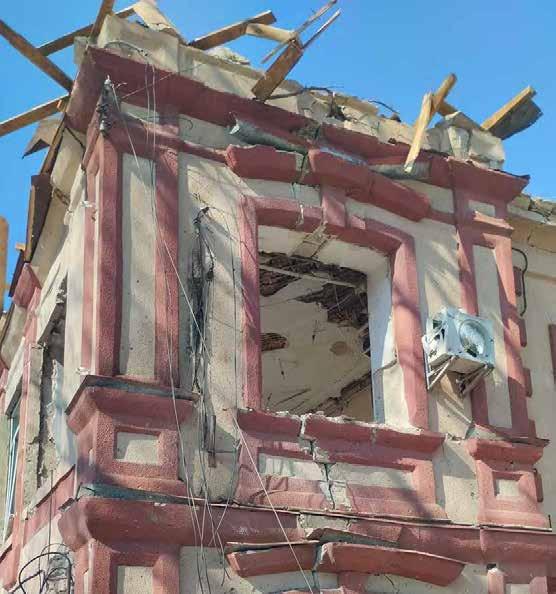
Damage category 3 concerns buildings that cannot be restored.
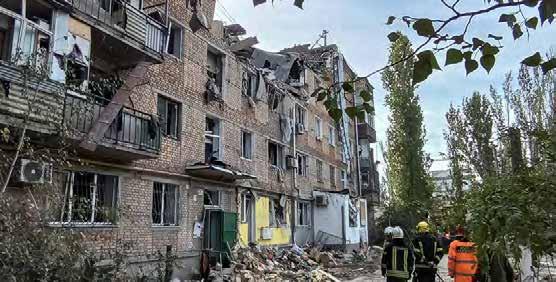
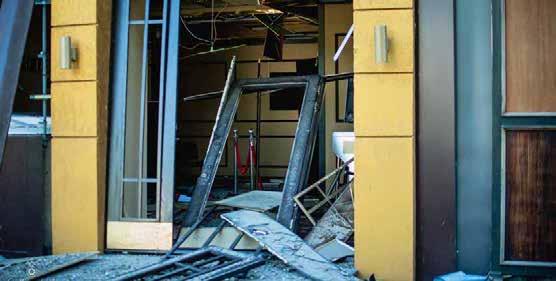
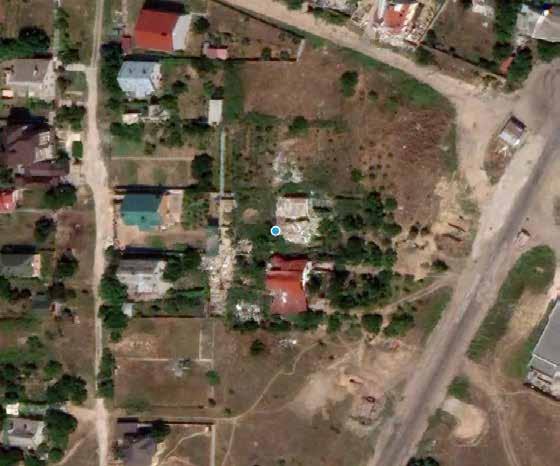
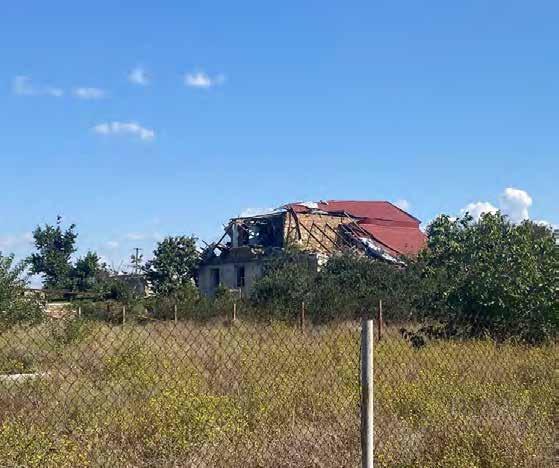
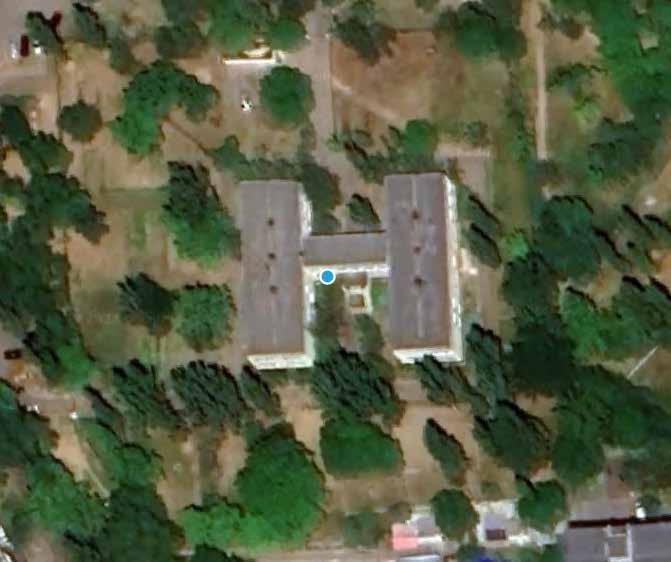
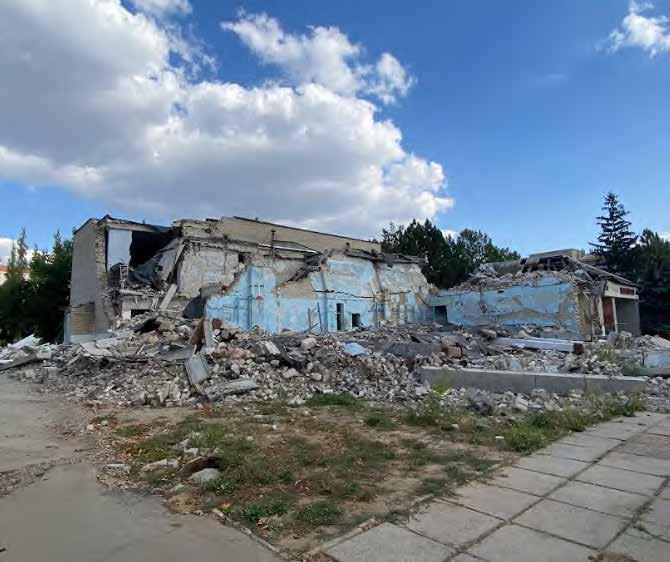
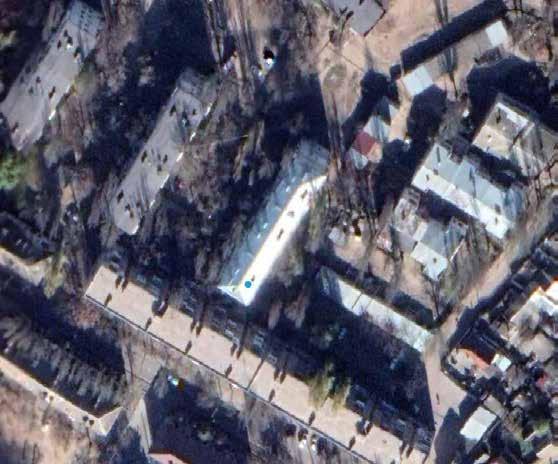
There are a total of 29 such buildings across the city, with 10 of them situated in the Inhulskyi district. The associated destruction percentage is 100%, confirming that these structures are in a critical state, as depicted in the accompanying photograph below.
DAMAGE
INHULSKYI
DISTRICT
Building subject to Category III damage
Photo provided by the municipality
TSENTRAL'NYI
ZAVODS'KYI
INHULS'KYI
KORABEL'NYI
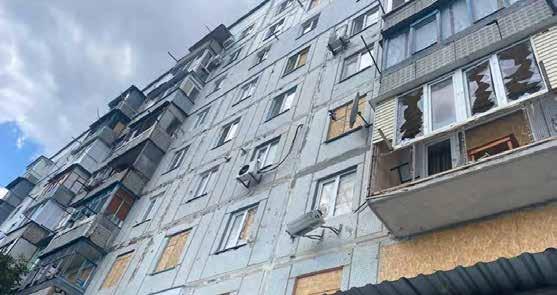
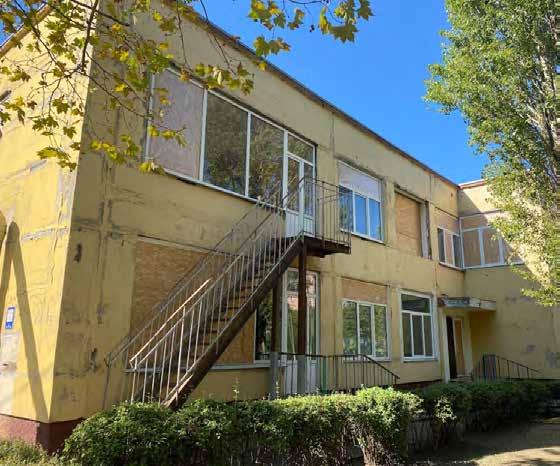
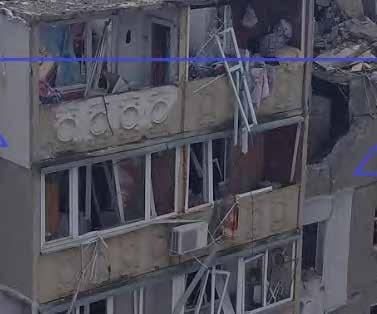
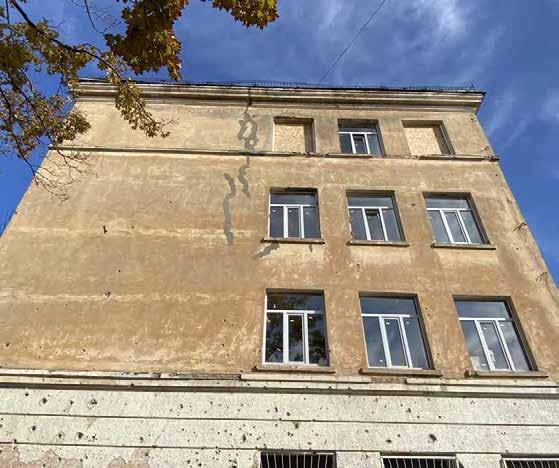
Damage category 2
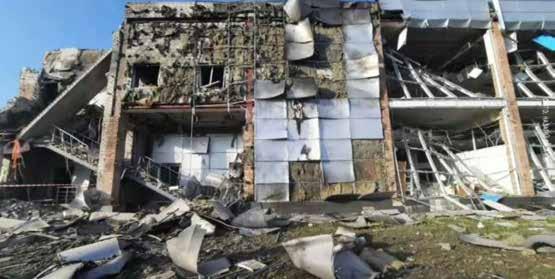
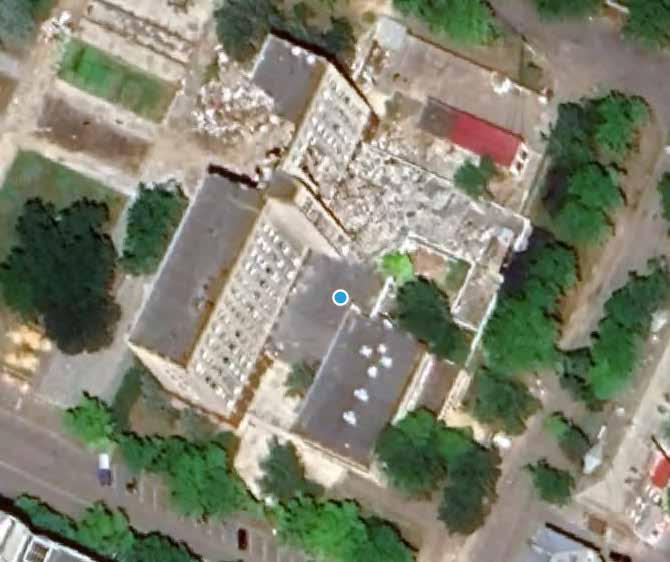
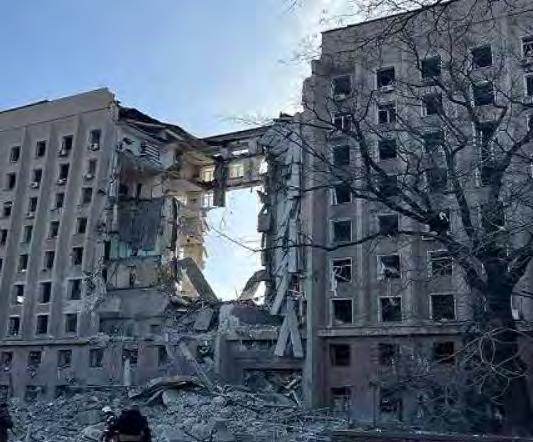
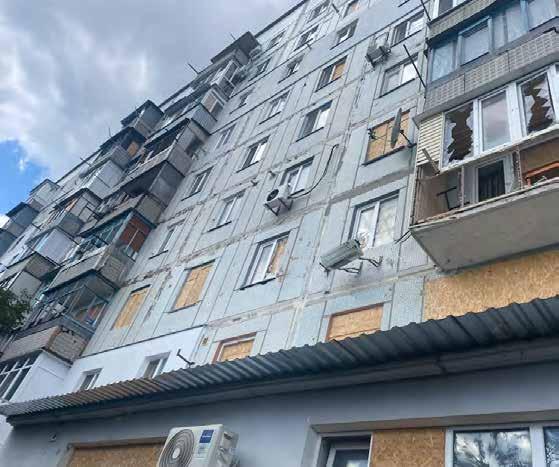
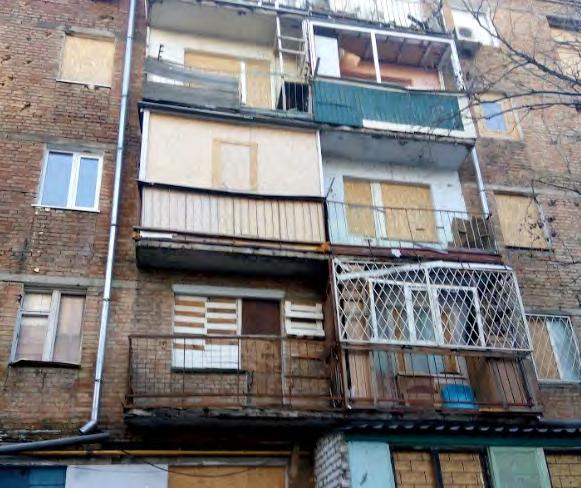
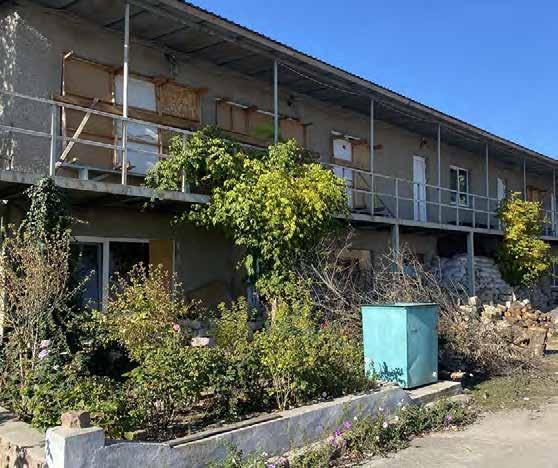
Category II is linked to damages primarily affecting building façades, which do not jeopardize the overall structural integrity of the building.
The destruction percentage varies between 20% and 80%, with the majority of cases hitting the top end of the spectrum.
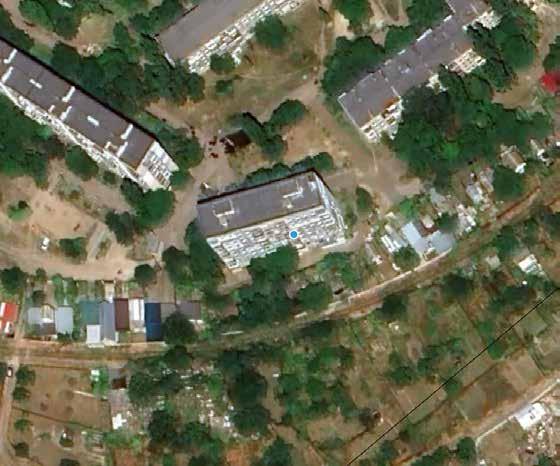
This category accounts for 361 registered damage points, with a significant concentration in the Korabel'nyi district.
125,157
MOST COMMON DAMAGE CAUSE
KORABEL'NYI [139]
DISTRICT WITH THE HIGHEST CONCENTRATION OF DAMAGED
Building subject to Category II damage
KORABEL'NYI
Urban Fabric Comprehensive Assessment
Building with category II damages | Photos provided by the municipality
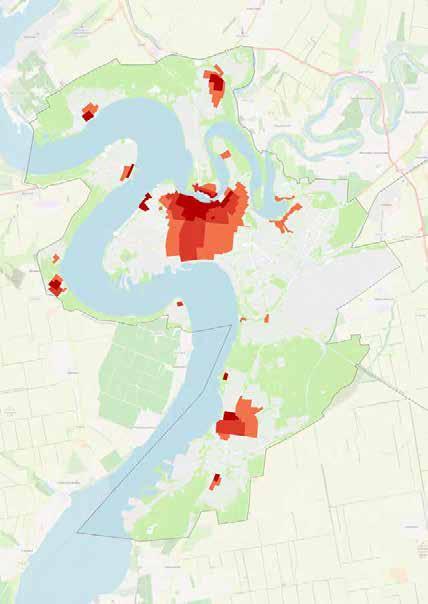
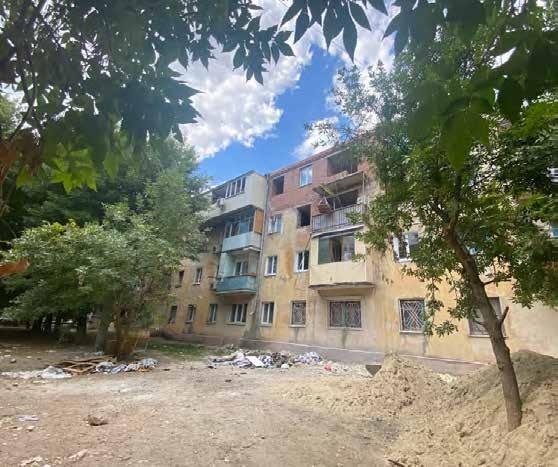
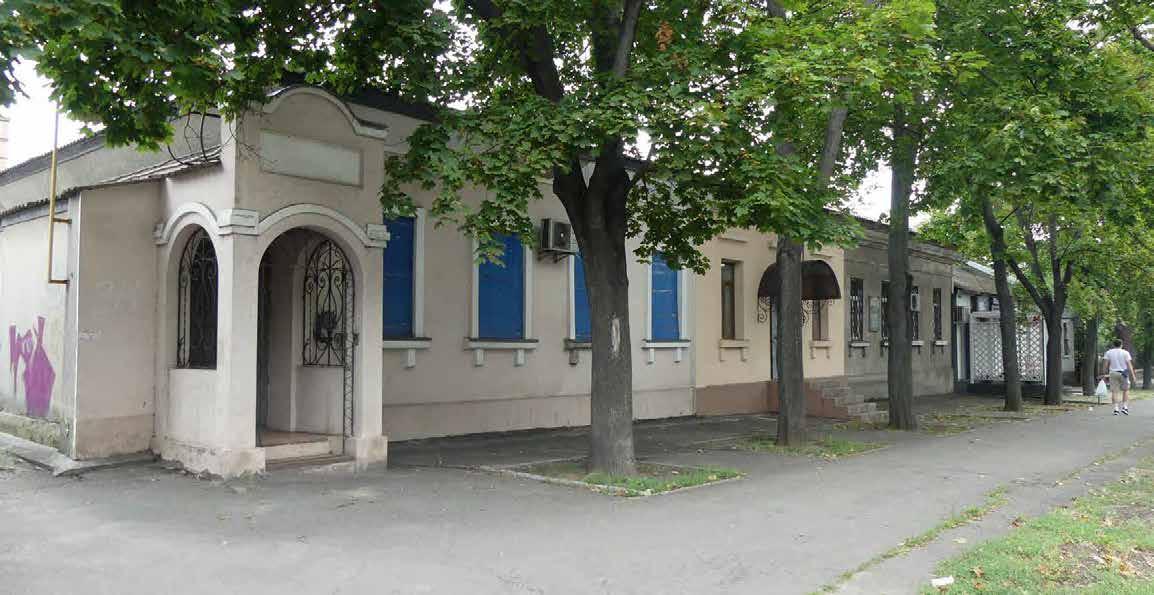
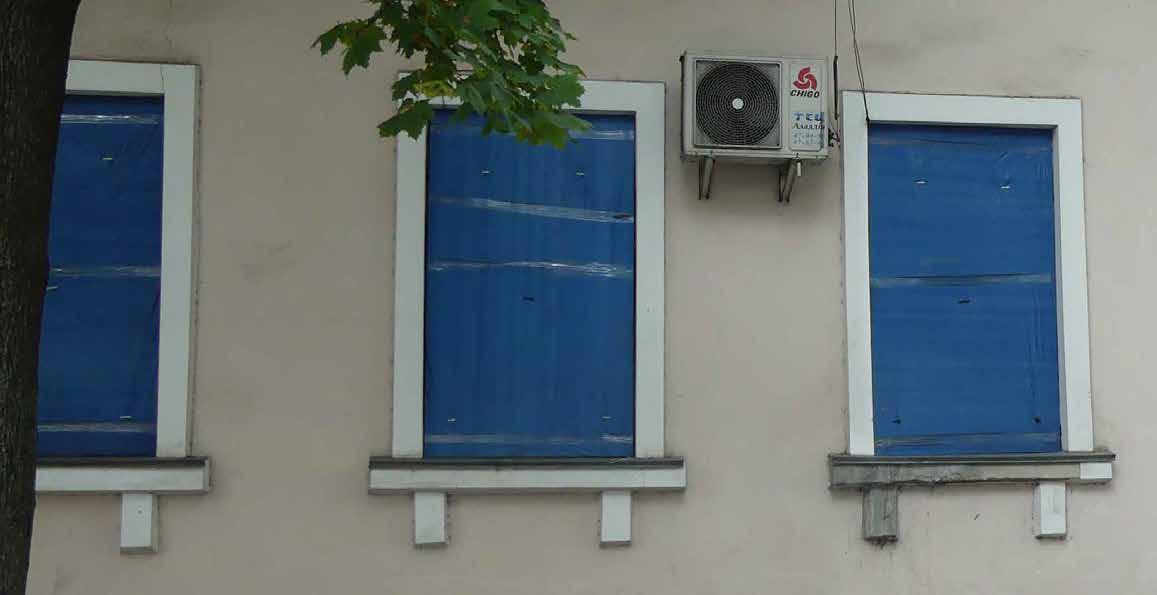
Damage category 1
Category I encompasses minor damages, primarily affecting doors and windows, and hence, easily repairable. However, the overall number of damages is considerably high, with a total of 2,506 recorded throughout Mykolaiv, peaking at 804 damages within the Tsentral'nyi district.
2,506
DAMAGE POINTS REGISTERED
227,752
Building subject to Category I damage
ZAVODS'KYI
INHULS'KYI
KORABEL'NYI
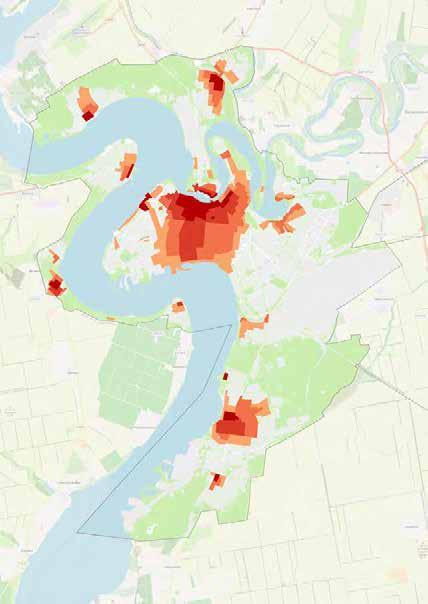
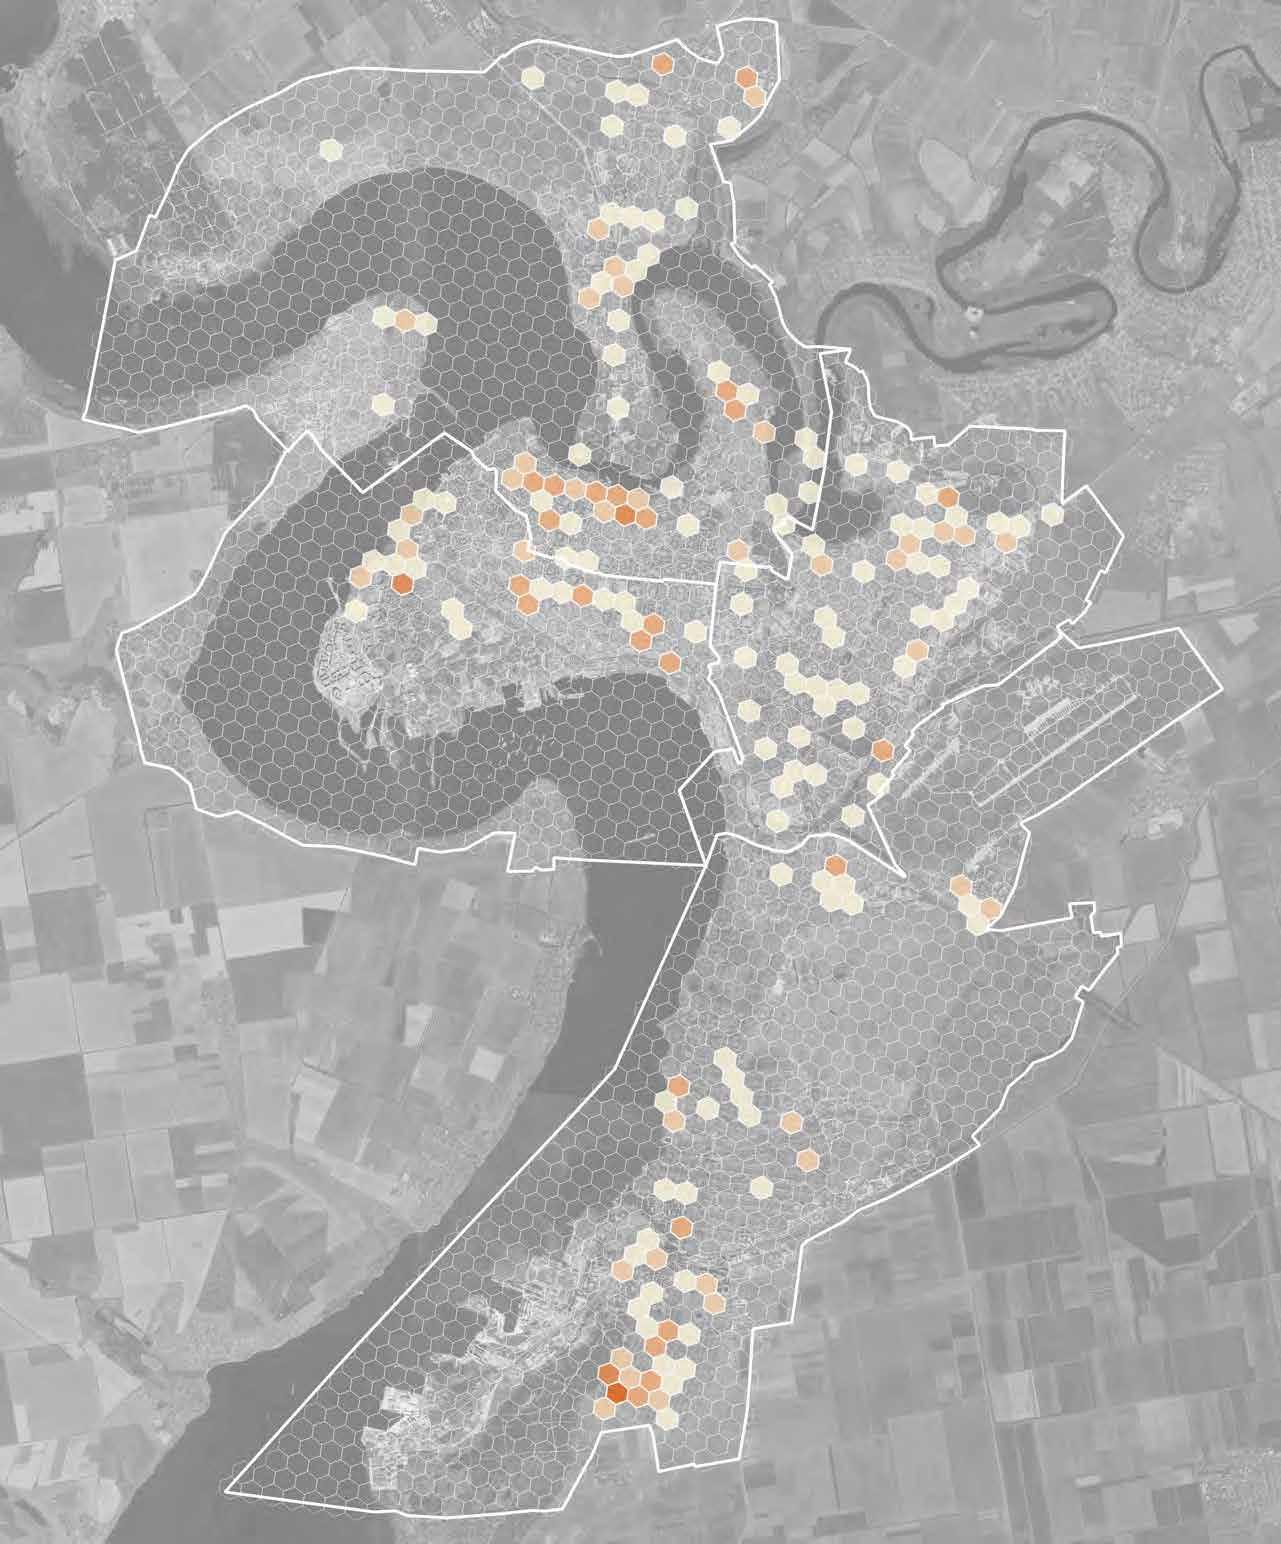
Residential areas
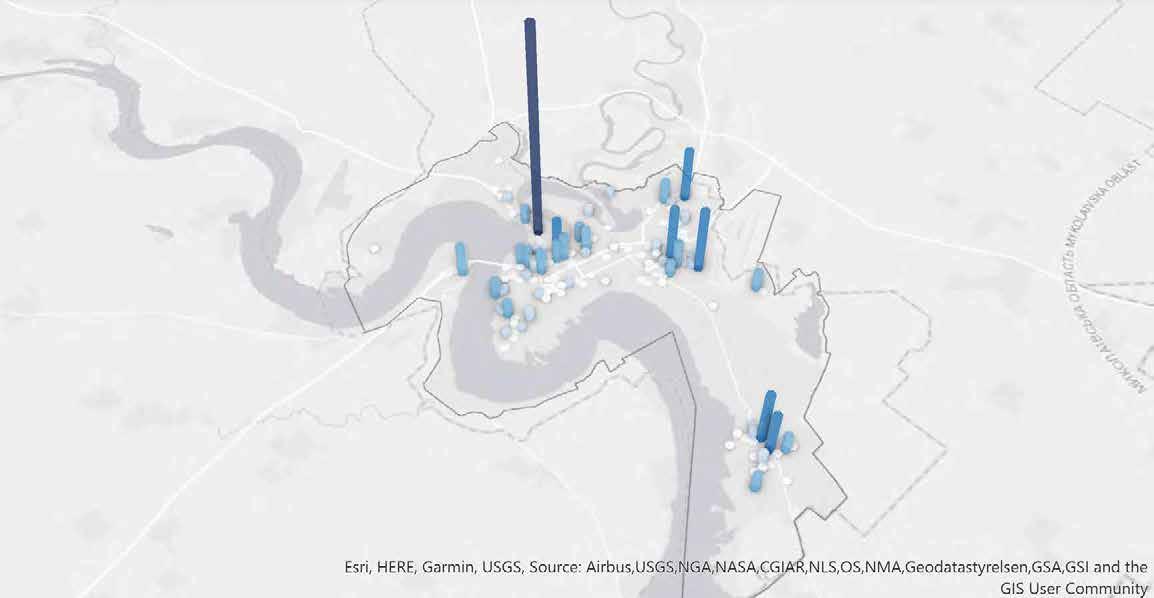
The residential areas have incurred the most extensive damage compared to other categories, comprising over half of the total square meters destroyed.
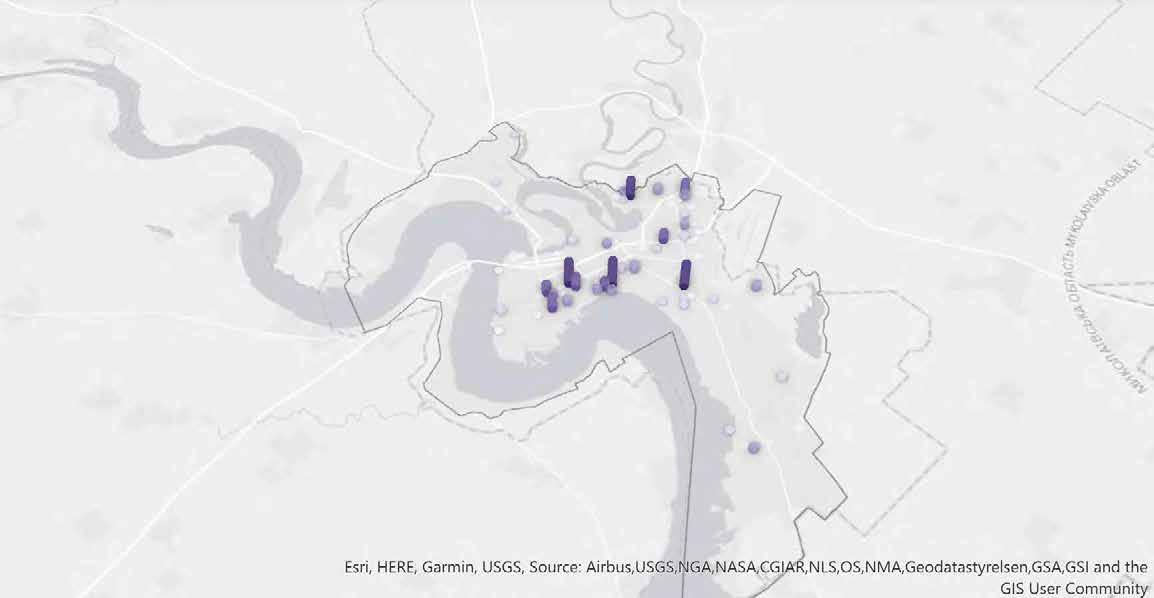
The damage is primarily concentrated in the central sector of Mykolaiv, particularly within the Tsentralnyi and Zavods'kyi districts, as well as in the southern part of the Korabel'nyi district.
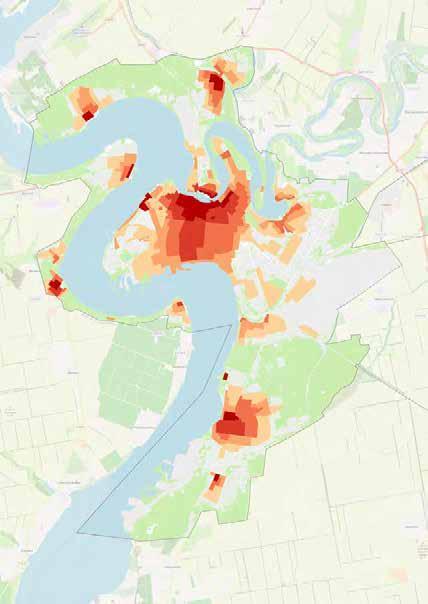
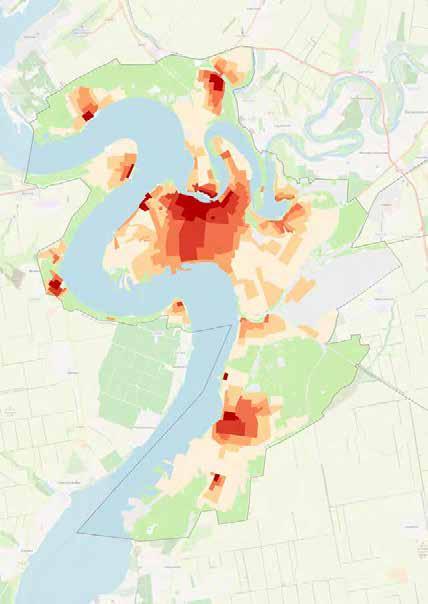
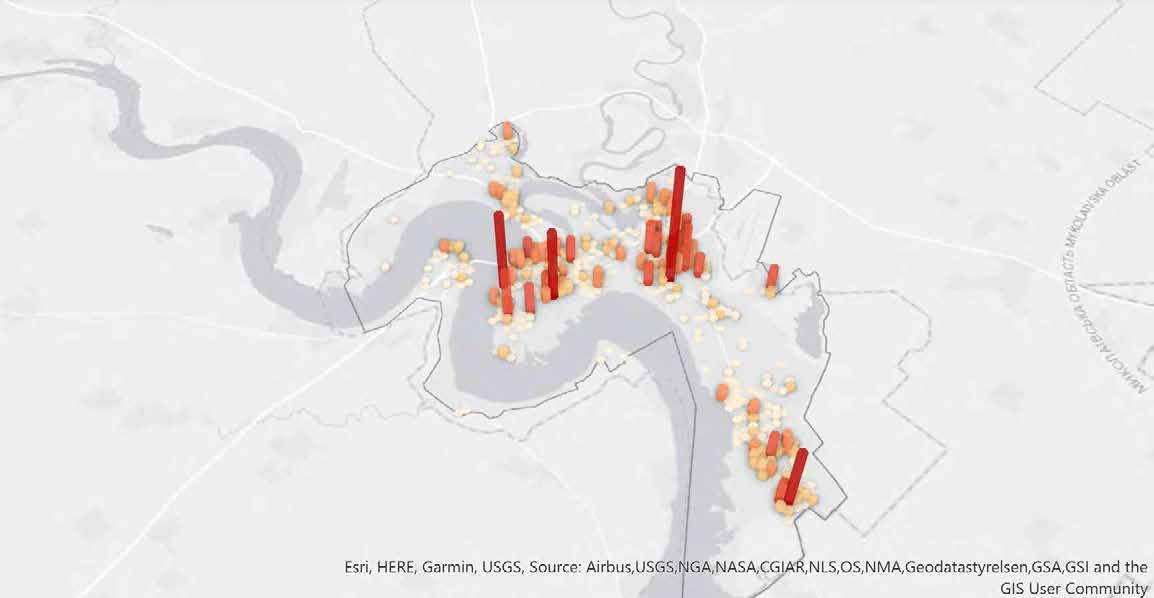
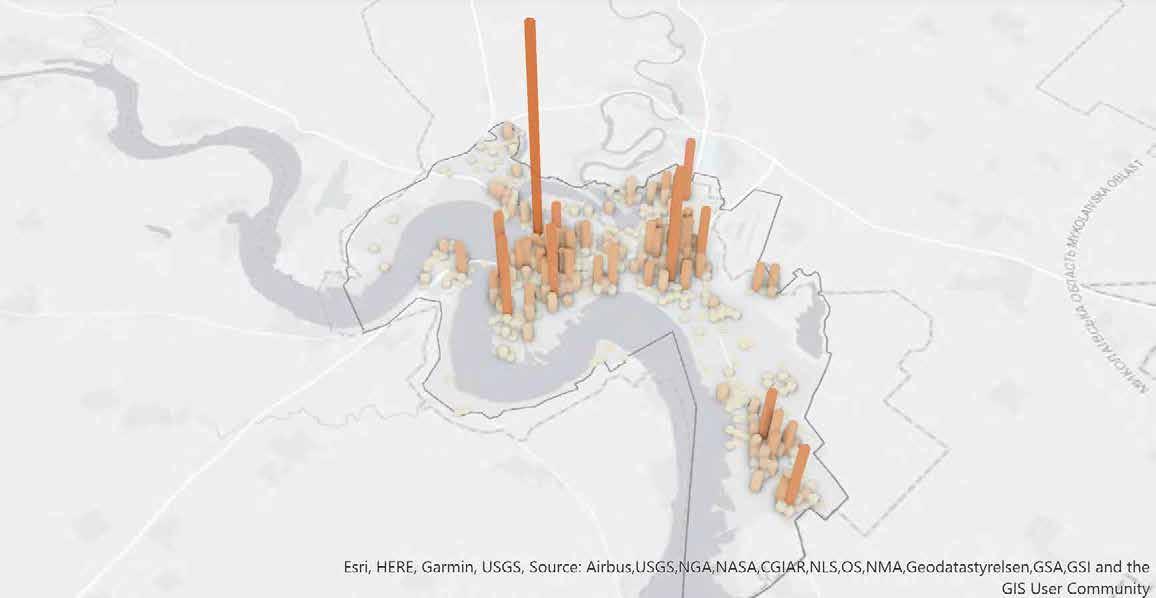
The 3D map on the next page indicates the intensity of hits per cell and identifies three main sectors with the highest concentration of damage. The destruction is in any case widespread throughout the entire city.
m2 OF DAMAGE FOR RESIDENTIAL AREAS
199,973 TSENTRALNYI
DAMAGED OBJECTS
TSENTRAL'NYI
ZAVODS'KYI
INHULS'KYI
KORABEL'NYI
INHULS'KYI
ZAVODS'KYI
The 3D map highlights specific focal points within the four districts where damage is particularly concentrated. These focal points align with urban areas characterized by the highest population density.
TSENTRAL'NYI
KORABEL'NYI
Photo: Viktoriia Lakezina
Photo: Mykolaiv Municipality
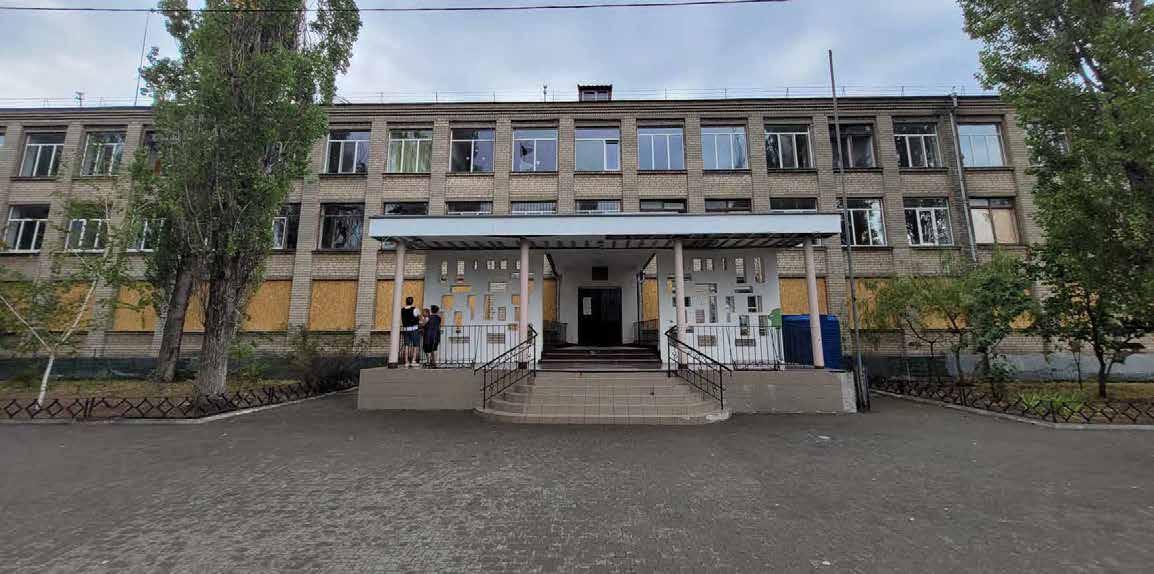
Community facilities
The damage to community facilities constitutes approximately half of the damage incurred by residential services in terms of total square meters of damage.
This damage is predominantly clustered within a limited number of cells, with just six cells exhibiting significant damage density. Notably, most damages are classified as I and II.
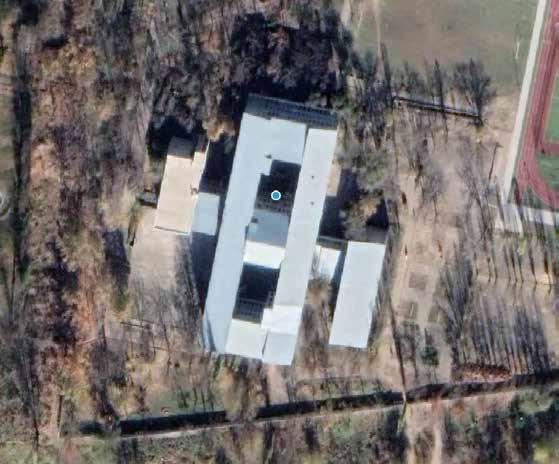
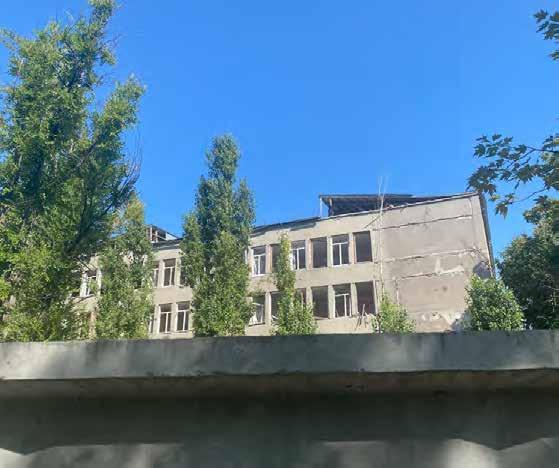
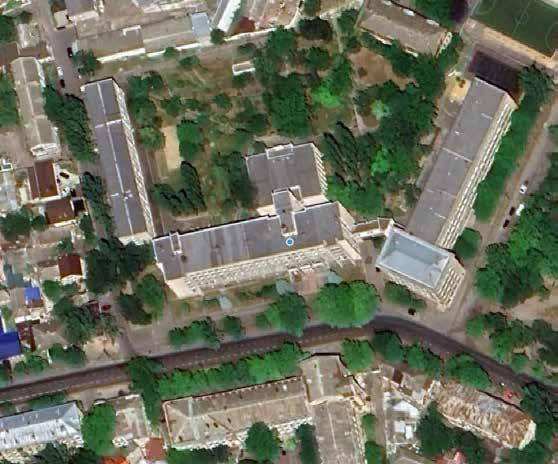
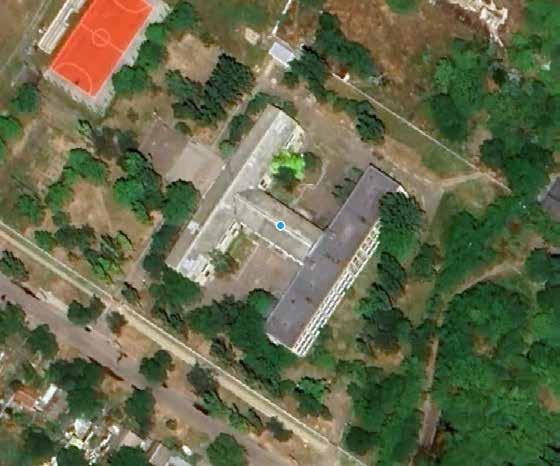
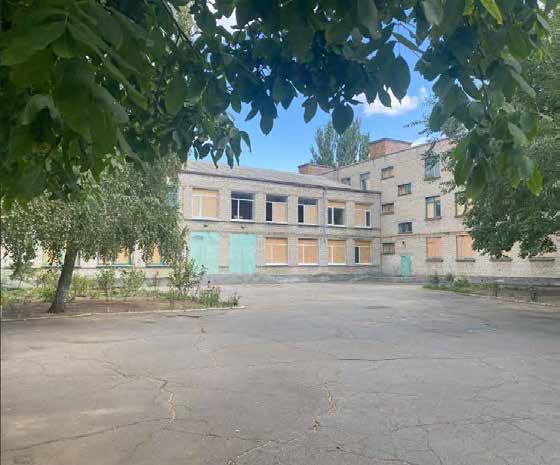
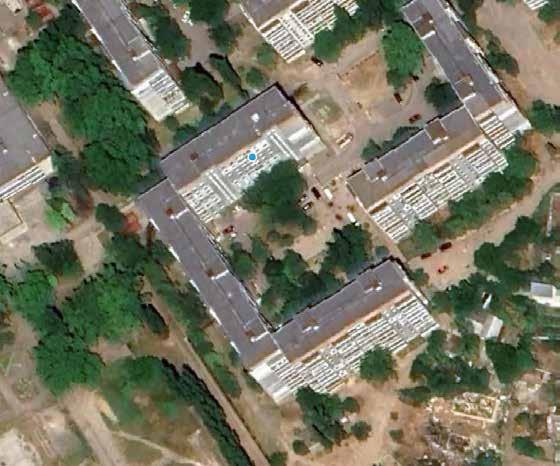
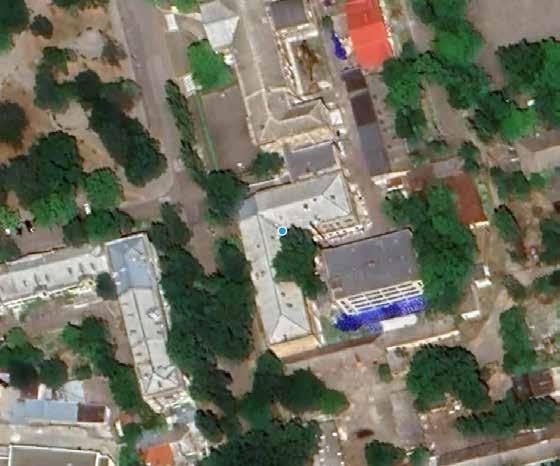
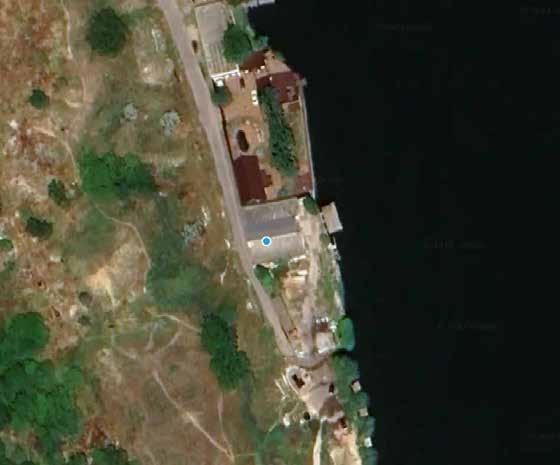
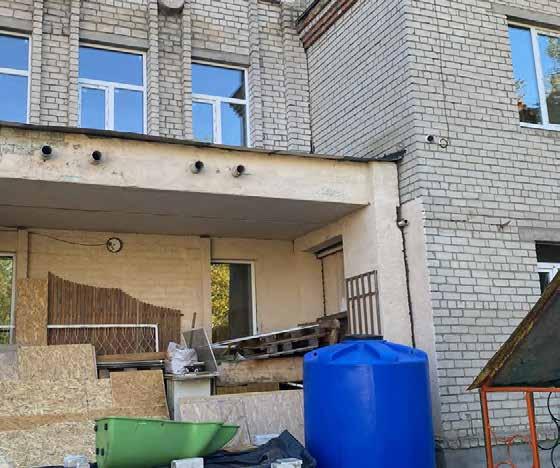
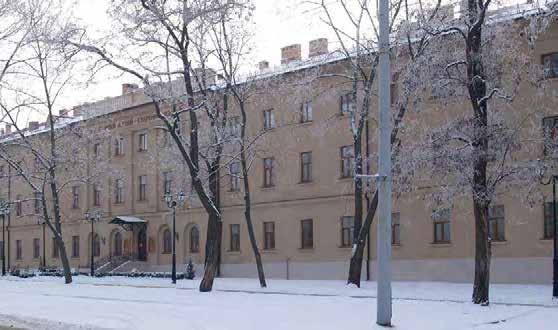
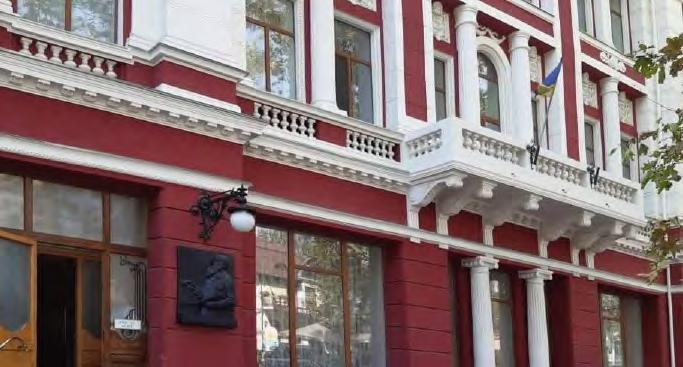
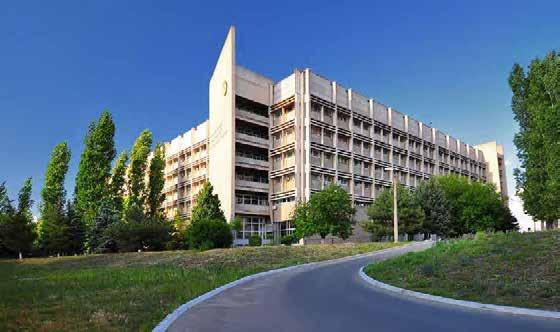
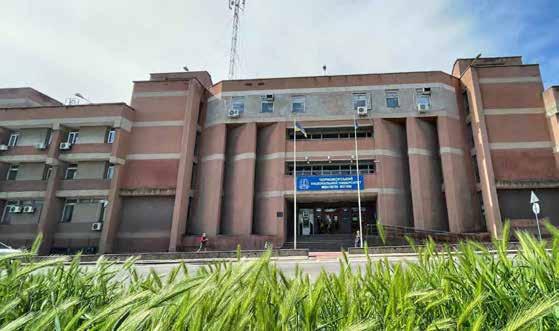
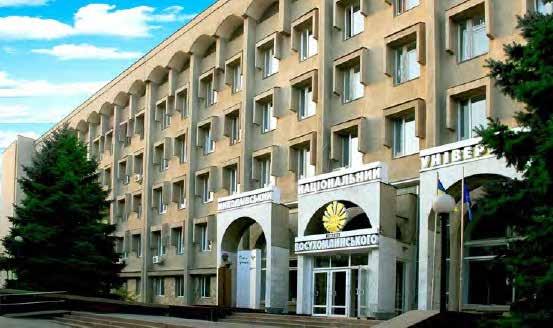
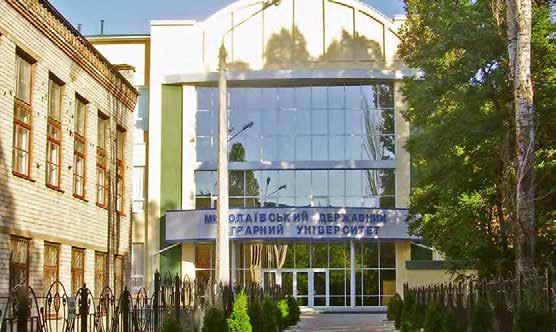
Once again, the 3D map, on the next page, vividly illustrates concentrated damage hotspots within the four districts. In areas with larger peaks, the implication is that the affected buildings are particularly extensive. For instance, within the Tsentralnyi district, notable damage was observed in the Naval University building, signifying substantial damage to this specific structure.
Amount of hits in each polygon
KORABEL'NYI
School with damage category II
m2 of damage to community facilities
TSENTRAL'NYI
KORABEL'NYI
Photo: Mykolaiv Municipality
Photo: Mykolaiv Municipality
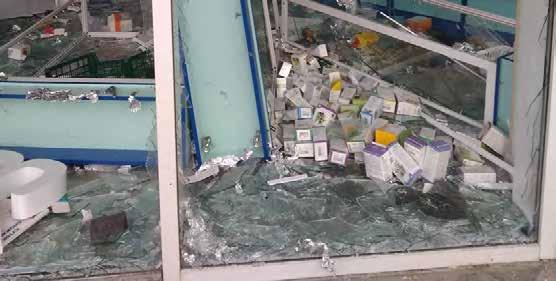
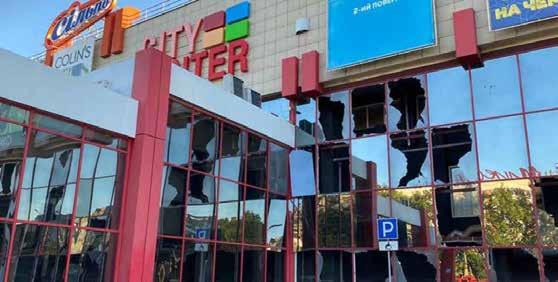
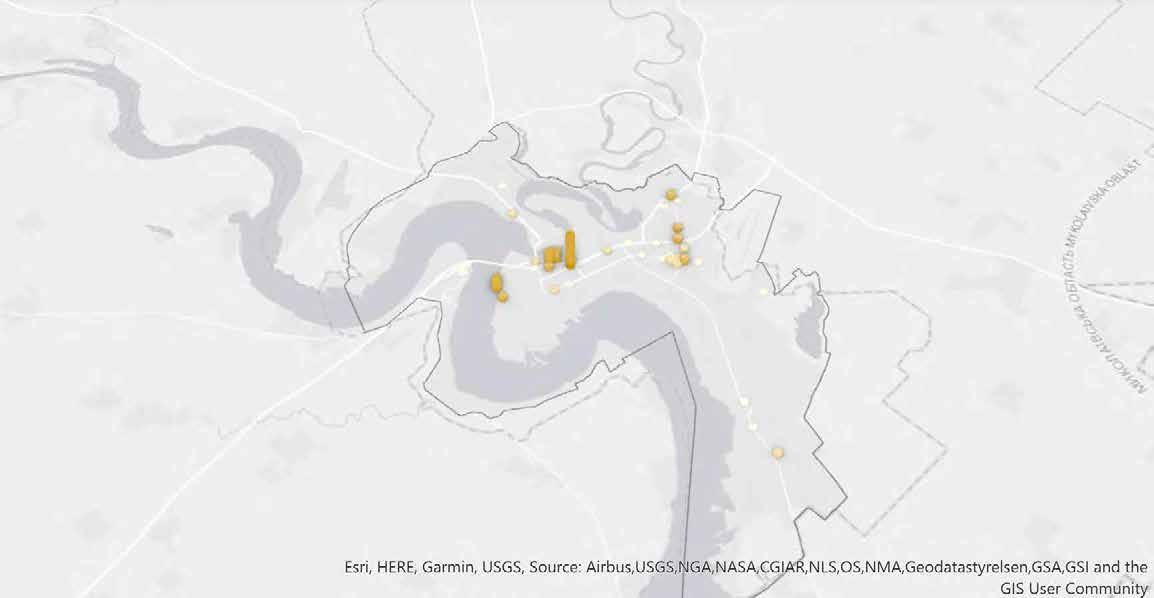
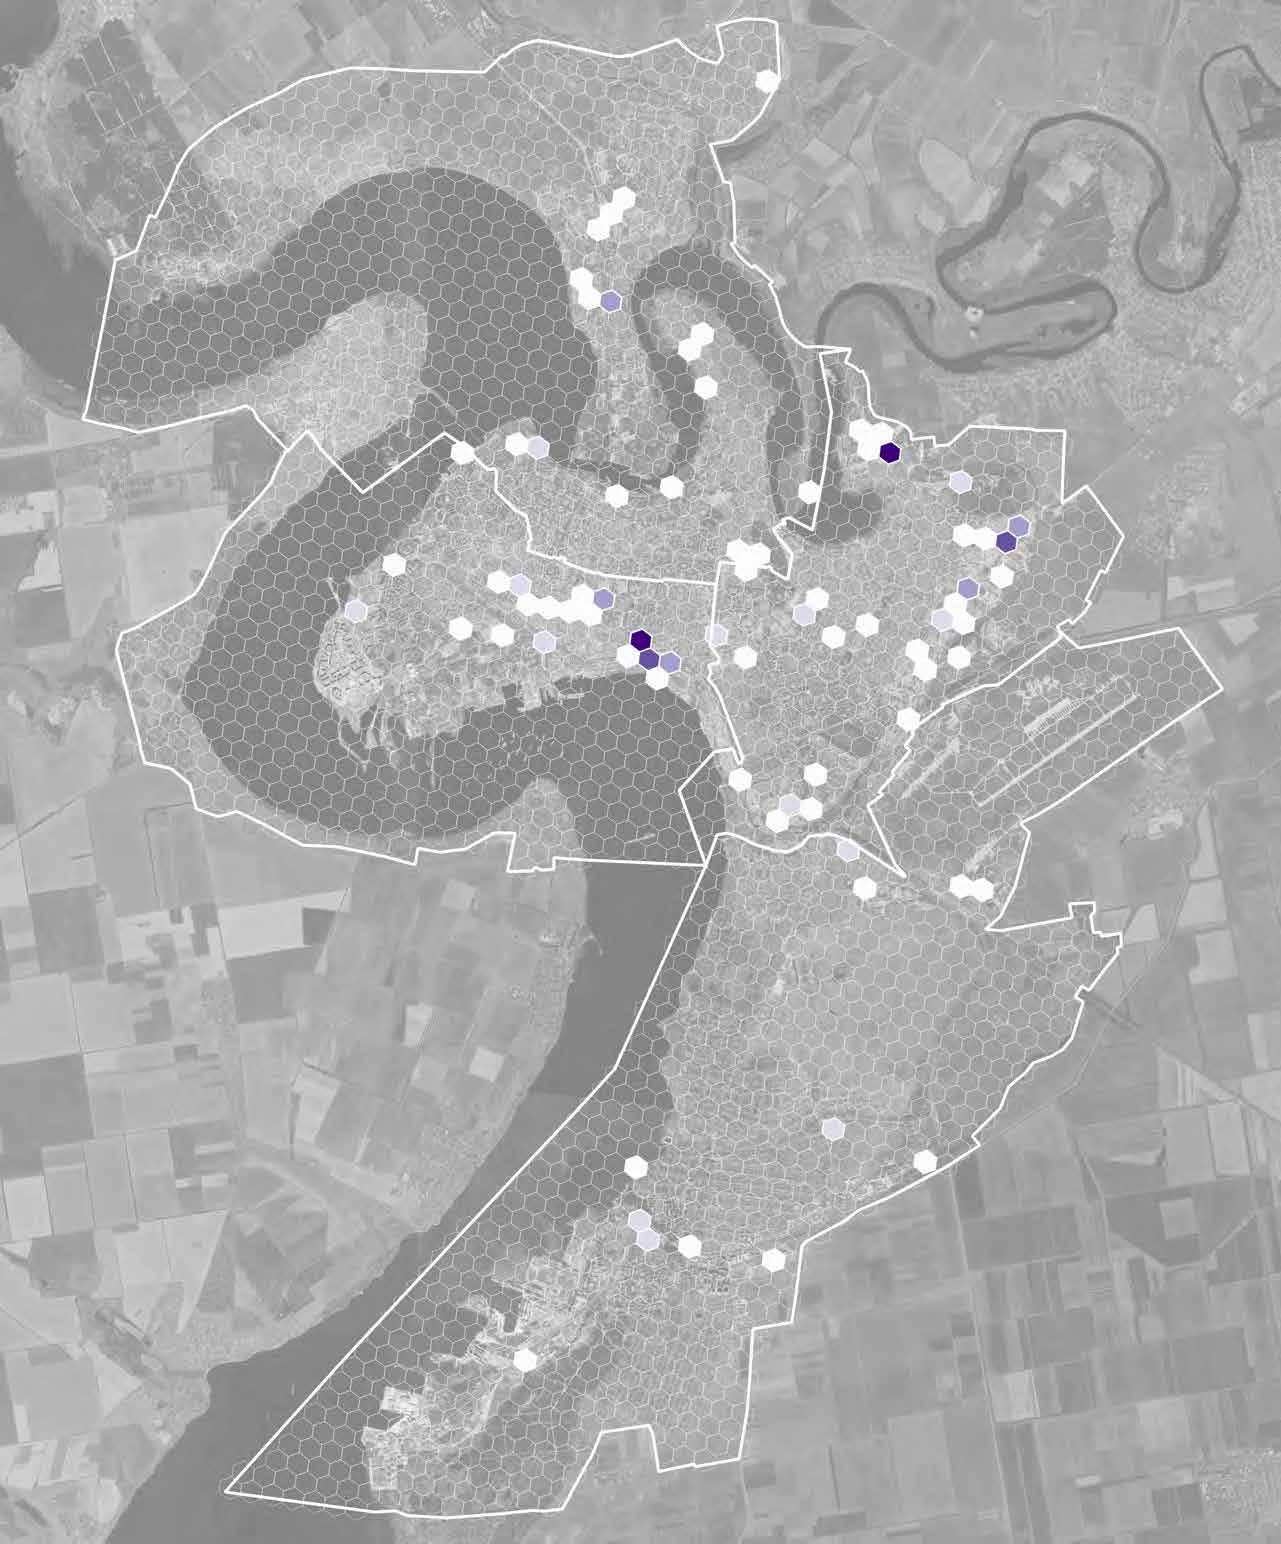
Commercial areas
The damages to commercial areas are similarly clustered in a limited number of cells, with significant density observed in certain ones, although the primary damage categories remain I and II.
Once more, the 3D map, on the next page, provides a clear depiction of the areas with the highest concentration of damage within the four districts. Notably, in locations with more prominent peaks, it indicates substantial damage to particularly extensive buildings. For instance, within the Tsentralnyi district, the "ТРЦ City Center" shopping center sustained notably extensive category I damage.
TSENTRAL'NYI
ZAVODS'KYI
INHULS'KYI
KORABEL'NYI
INHULS'KYI
ZAVODS'KYI
Retail outlet with damage category
m2 of damage to commercial areas
TSENTRAL'NYI
KORABEL'NYI
Photo: Mykolaiv Municipality
Industrial areas
Damage to industrial areas amounted to more than 29,000 sqm in total.
Similarly to other land use types, damages in industrial areas are concentrated within a limited number of cells, primarily near the most extensive industrial zones, and with significant density. In terms of damage intensity, categories I and II are predominant.
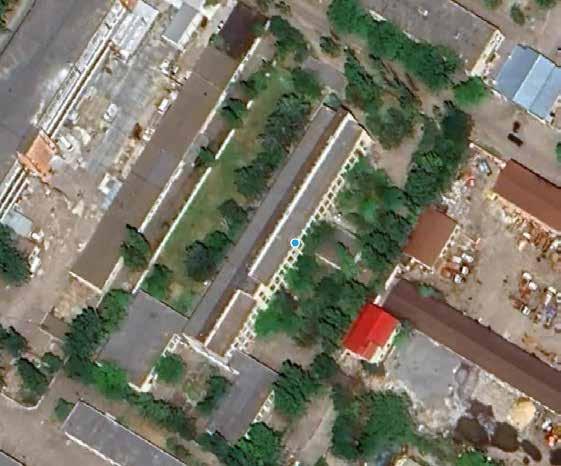
Additionally, the 3D map, on the next page, provides a clear representation of the locations with the most substantial damage to industrial areas within the four districts. Notably, in areas with prominent peaks, it indicates extensive damage to particularly large structures. For instance, in the Inhuls'kyi district, an industrial shed was hit, resulting in category II damage, covering an estimated area of 2,500 sqm.
m2 OF DAMAGE FOR INDUSTRIAL AREAS
MOST COMMON DAMAGE CAUSE
DISTRICT WITH THE HIGHEST CONCENTRATION OF DAMAGED OBJECTS
ZAVODS'KYI
INHULS'KYI
KORABEL'NYI
Prevailing damage category
INHULS'KYI
ZAVODS'KYI
Industrial building subject to damage category III
m2 of damage to industrial areas
TSENTRAL'NYI
KORABEL'NYI
Photo: RES Ukraine
Conclusions
The total land area damaged exceeds 340,000 sqm, with a total of more than 3,000 documented damages. The majority of these damages are low intensity and caused by ammunition impacts.
Among the districts, Tsentral'nyi stands out as the most heavily affected, with 931 registered damages. However, a detailed examination of micro-scale land use damage assessment is required to precisely determine vacancy rates.
The 3D map on the next page pinpoints urban zones within the city that have experienced the most substantial damage. As previously mentioned for individual land use types, the highest peaks on the map correspond to large structures that have sustained particularly extensive damage.
3,109
TOTAL NUMBER OF DAMAGE POINTS REGISTERED
344,066
m2 OF DAMAGE FOR ALL LAND USES
TSENTRAL'NYI
MOST COMMON DAMAGE CAUSE DISTRICT WITH THE HIGHEST CONCENTRATION OF DAMAGED OBJECTS
TSENTRAL'NYI
ZAVODS'KYI
INHULS'KYI
KORABEL'NYI
TSENTRAL'NYI
KORABEL'NYI
Quantitative Assessment on Population and Community facilities
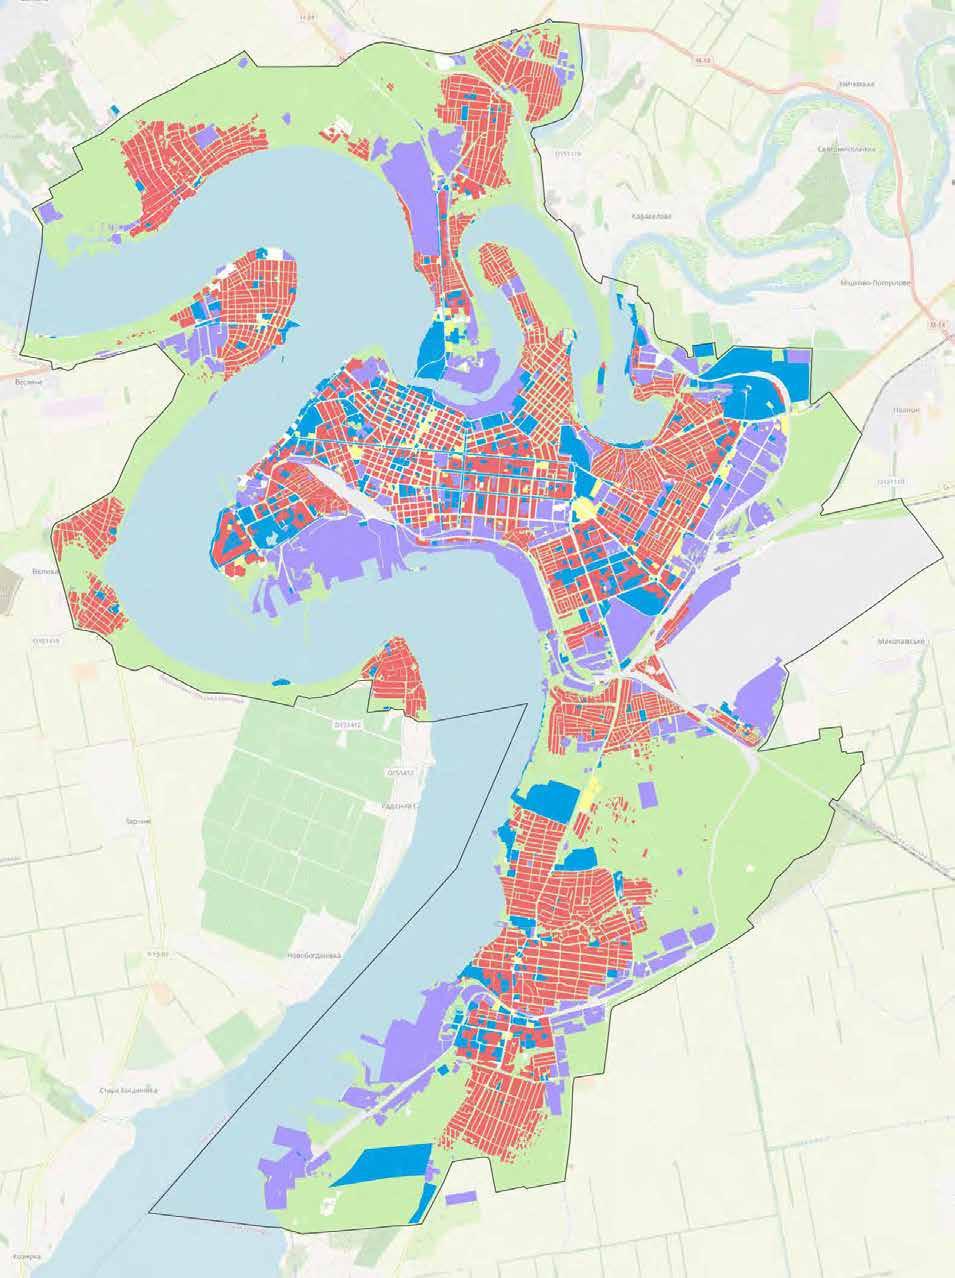
Residential typologies
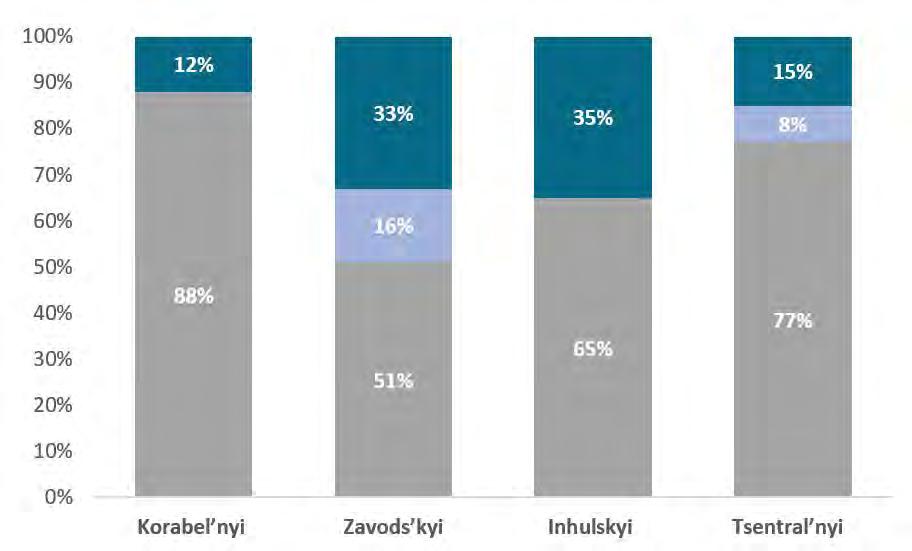
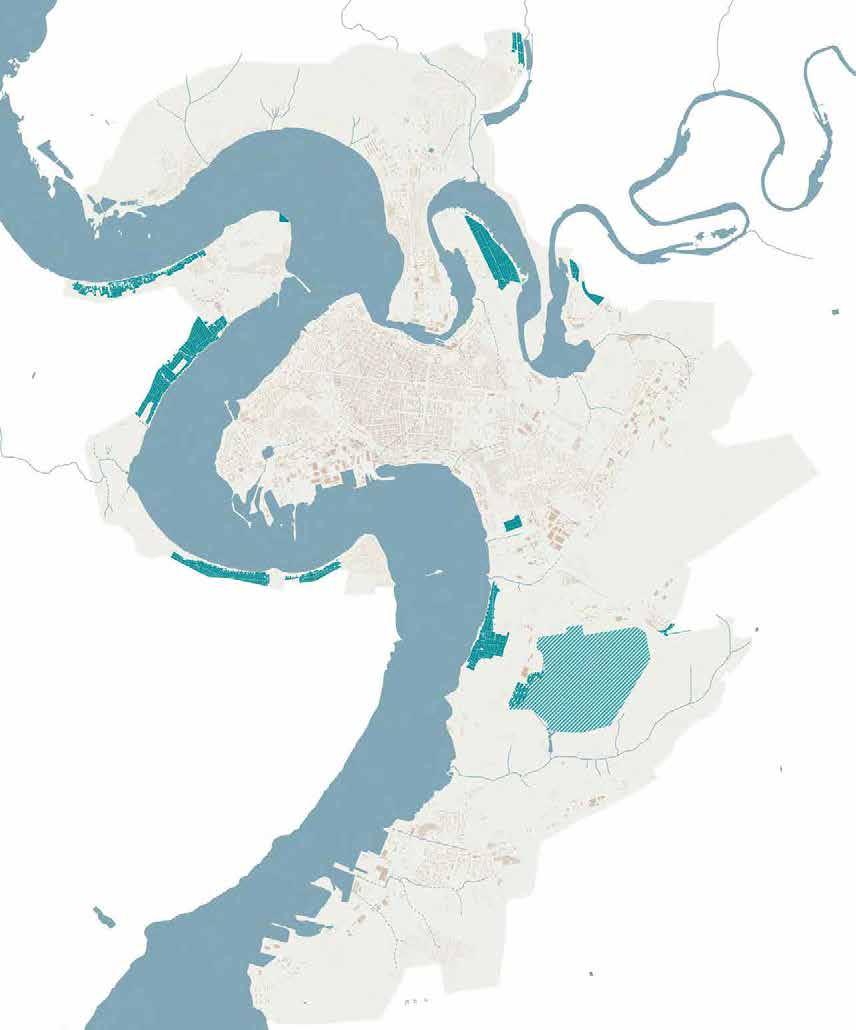
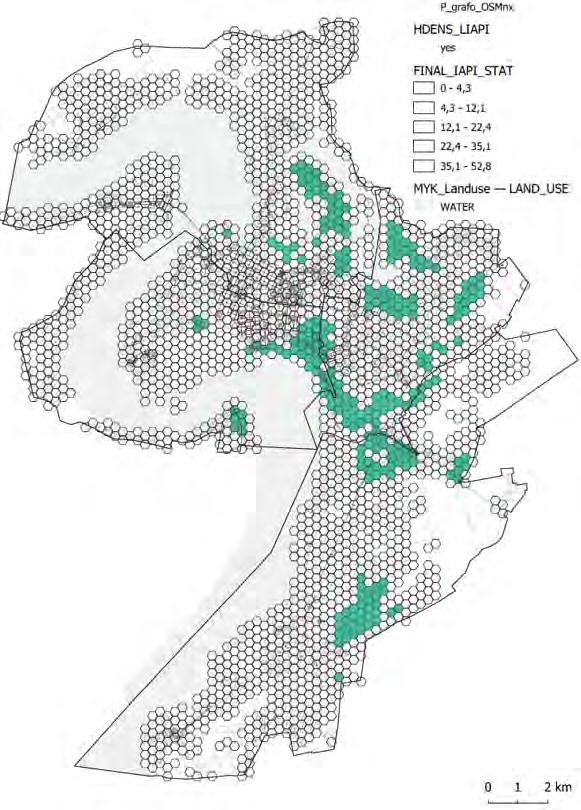
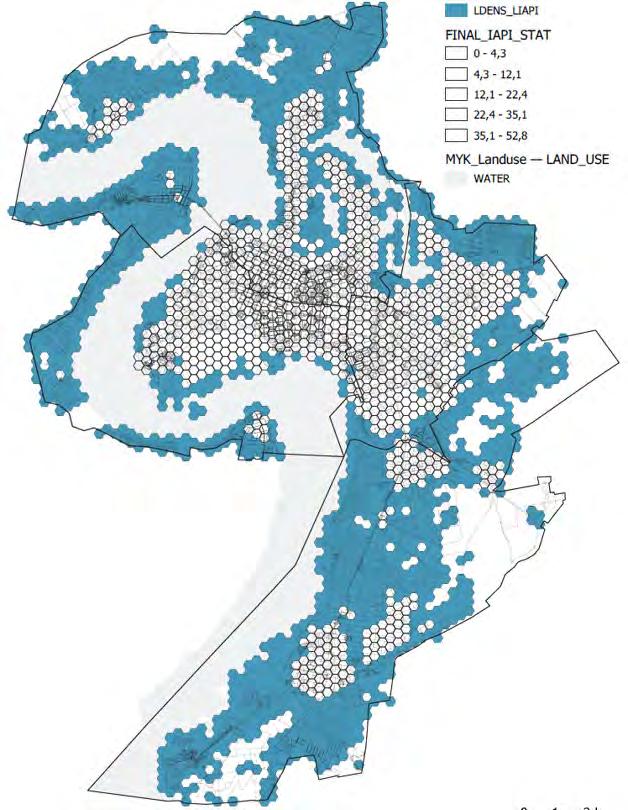
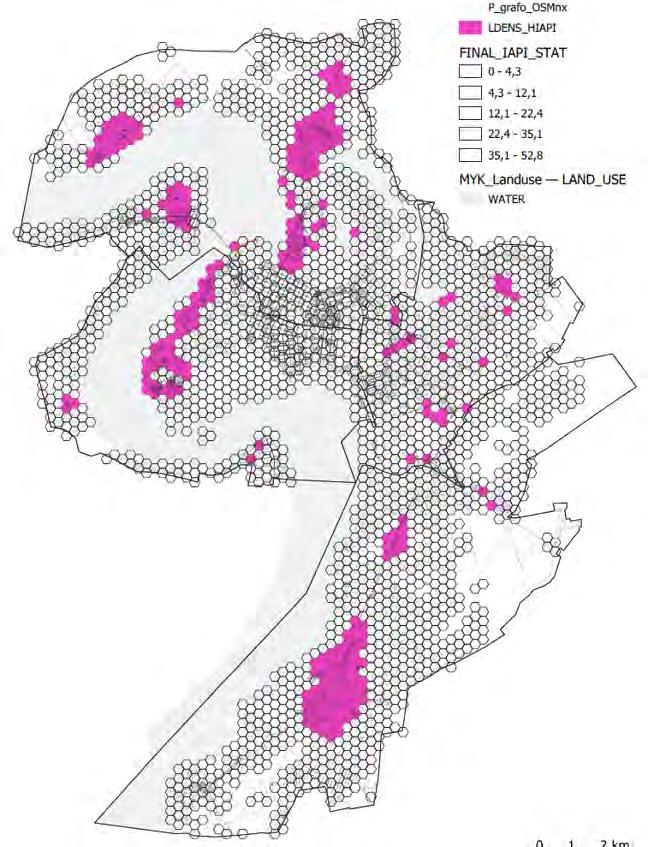
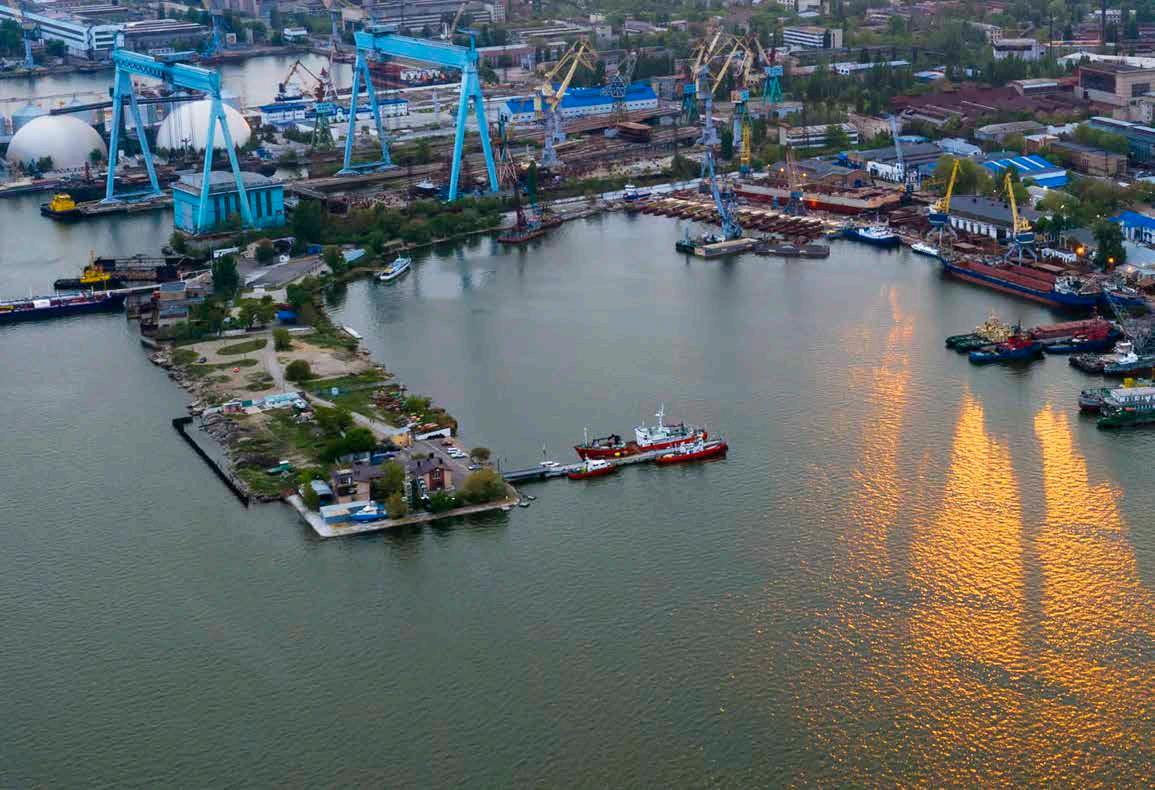
The city of Mykolaiv has three main residential typologies: Apartment Blocks, Low-Rise Mixed Use Buildings, and Manorial Residential Areas. The urban footprint map clearly shows that the central part of the city is the most dense, with a combination of low-rise mixed-use and apartment buildings, while the manorial areas develop towards the outskirts of the city. In terms of soil consumption, the manorial residential typology is the most extensive, being the most widespread in the city and representing 74% of the city's urban residential area.
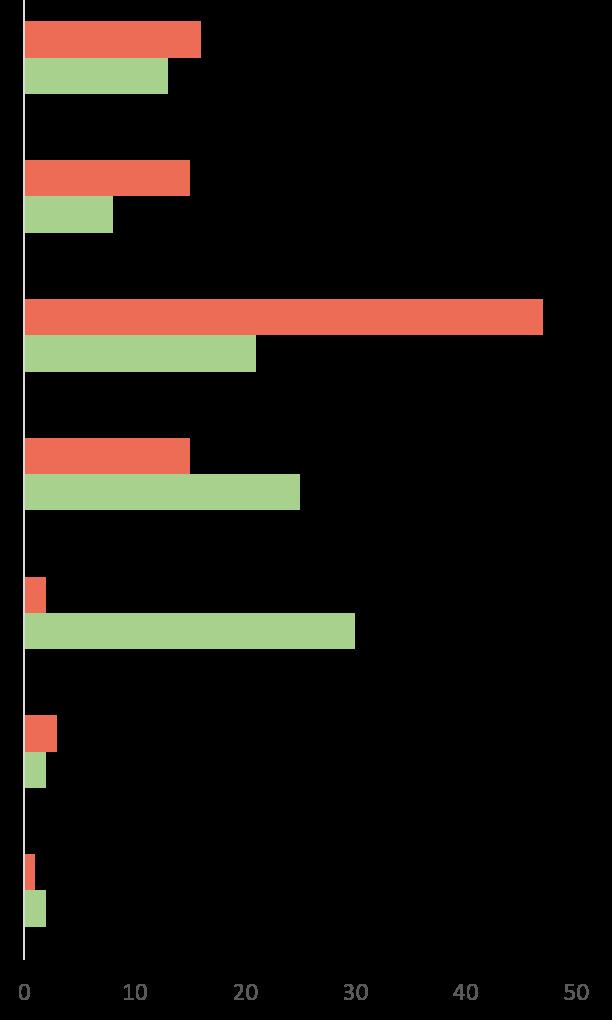
On the next page, category III, II and I damage to residential areas are mapped. The analysis of buildings and population before and after the conflict shows that approximately 2,000 buildings, equivalent to 1.6% of the total residential stock, incurred damage. Furthermore, 0.2% of residential buildings experienced significant damage, falling under category II or III. With regard to population, nearly 77,000 people suffered damage to their residences, equalling 16% of Mykolaiv's total. Overall, 0.7% of the population faced significant damage (falling under category III or II) to their homes.
Community facilities
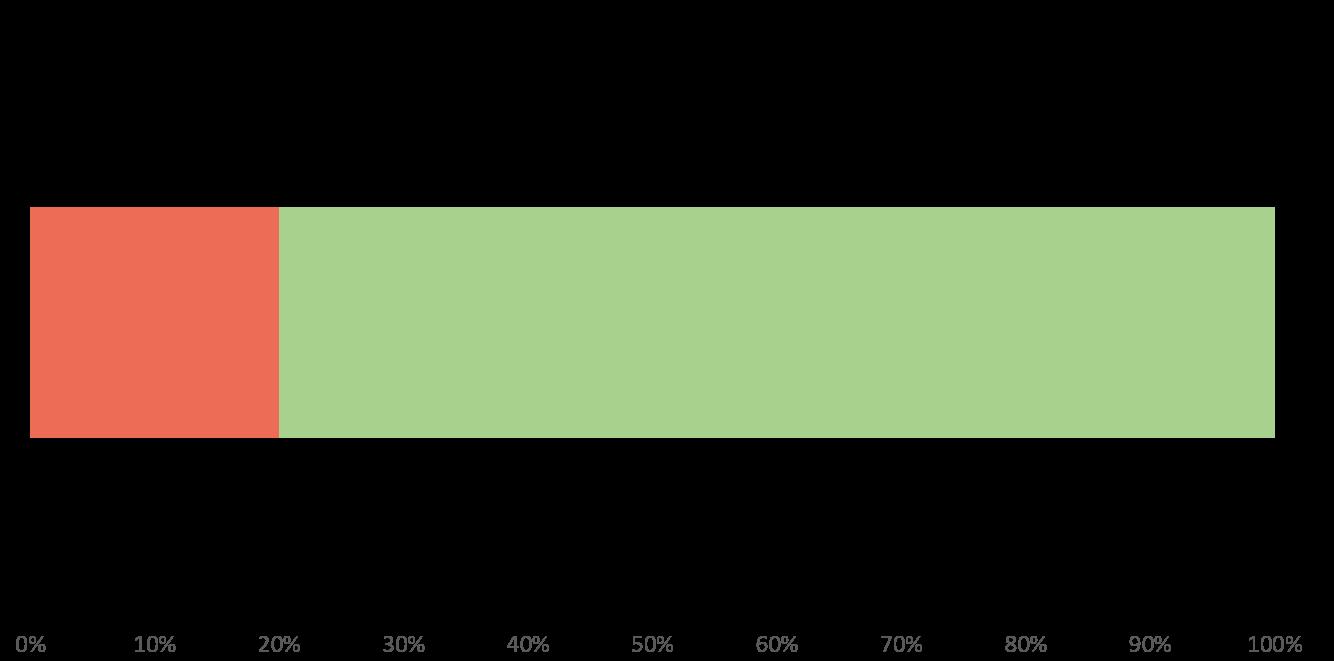
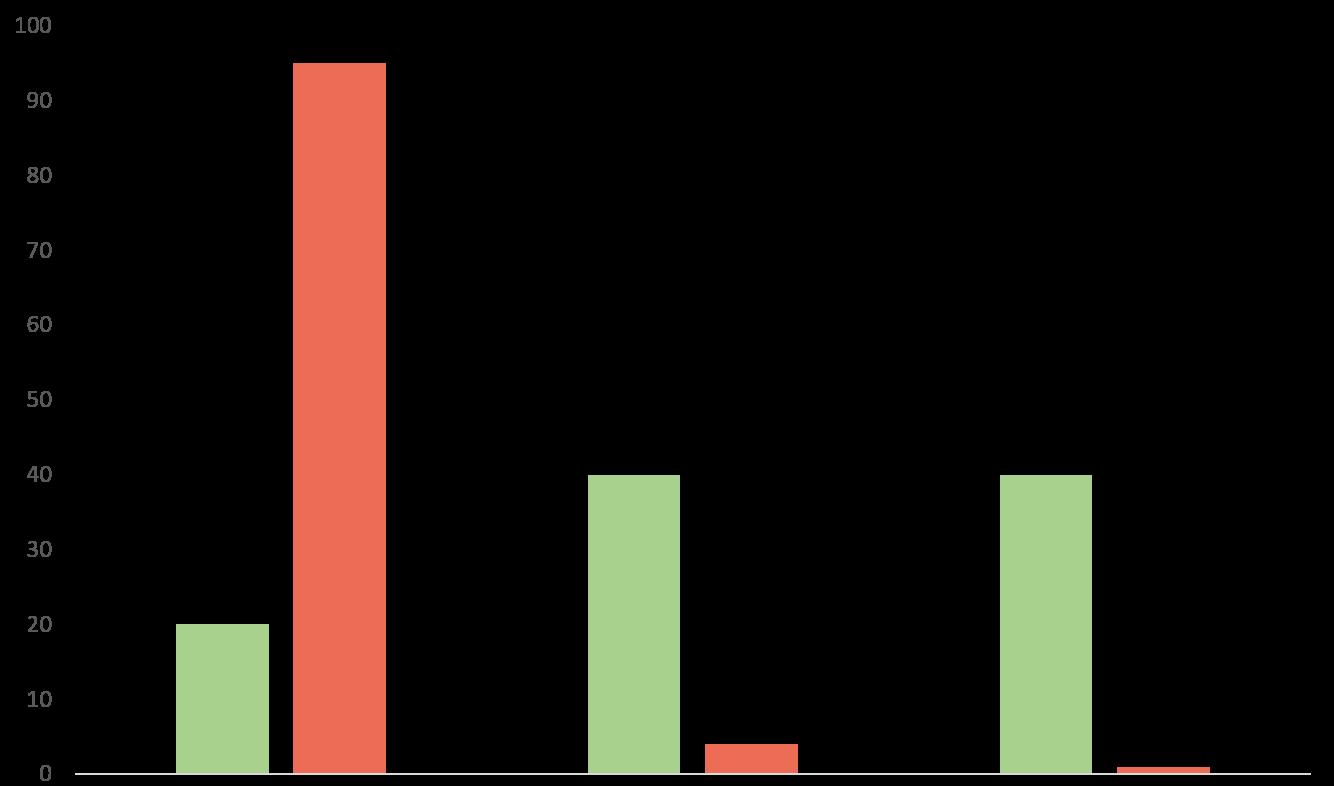
Community facilities cover 3% of the total area of Mykolaiv, including schools, cultural institutions, healthcare, public services, sports facilities and cemeteries. Schools account for more than a third of the area (35.9%).
On the next page, category III, II and I damage to community facilities is mapped. The comparison table detailing the condition of community facilities before and after the conflict shows that approximately 350 facilities incurred damage; of these, 200 experienced significant damage, falling under category II or III.
Note: Pre-war data for some community facility categories are not available.
Micro-Scale
Оцінка на
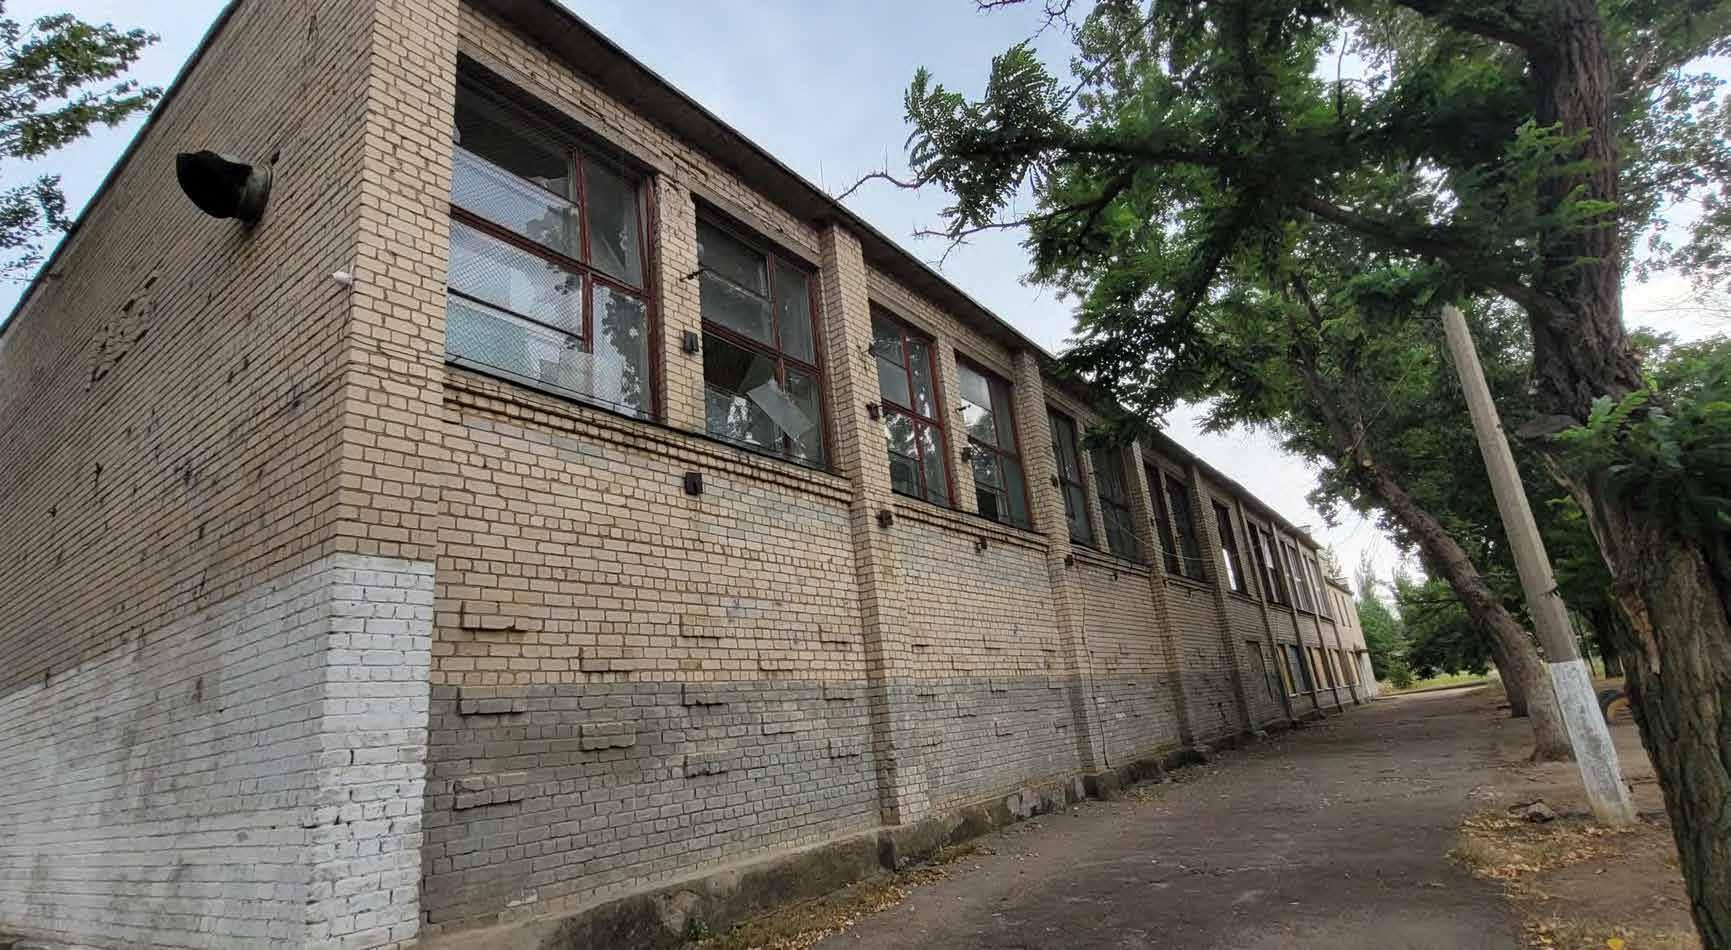
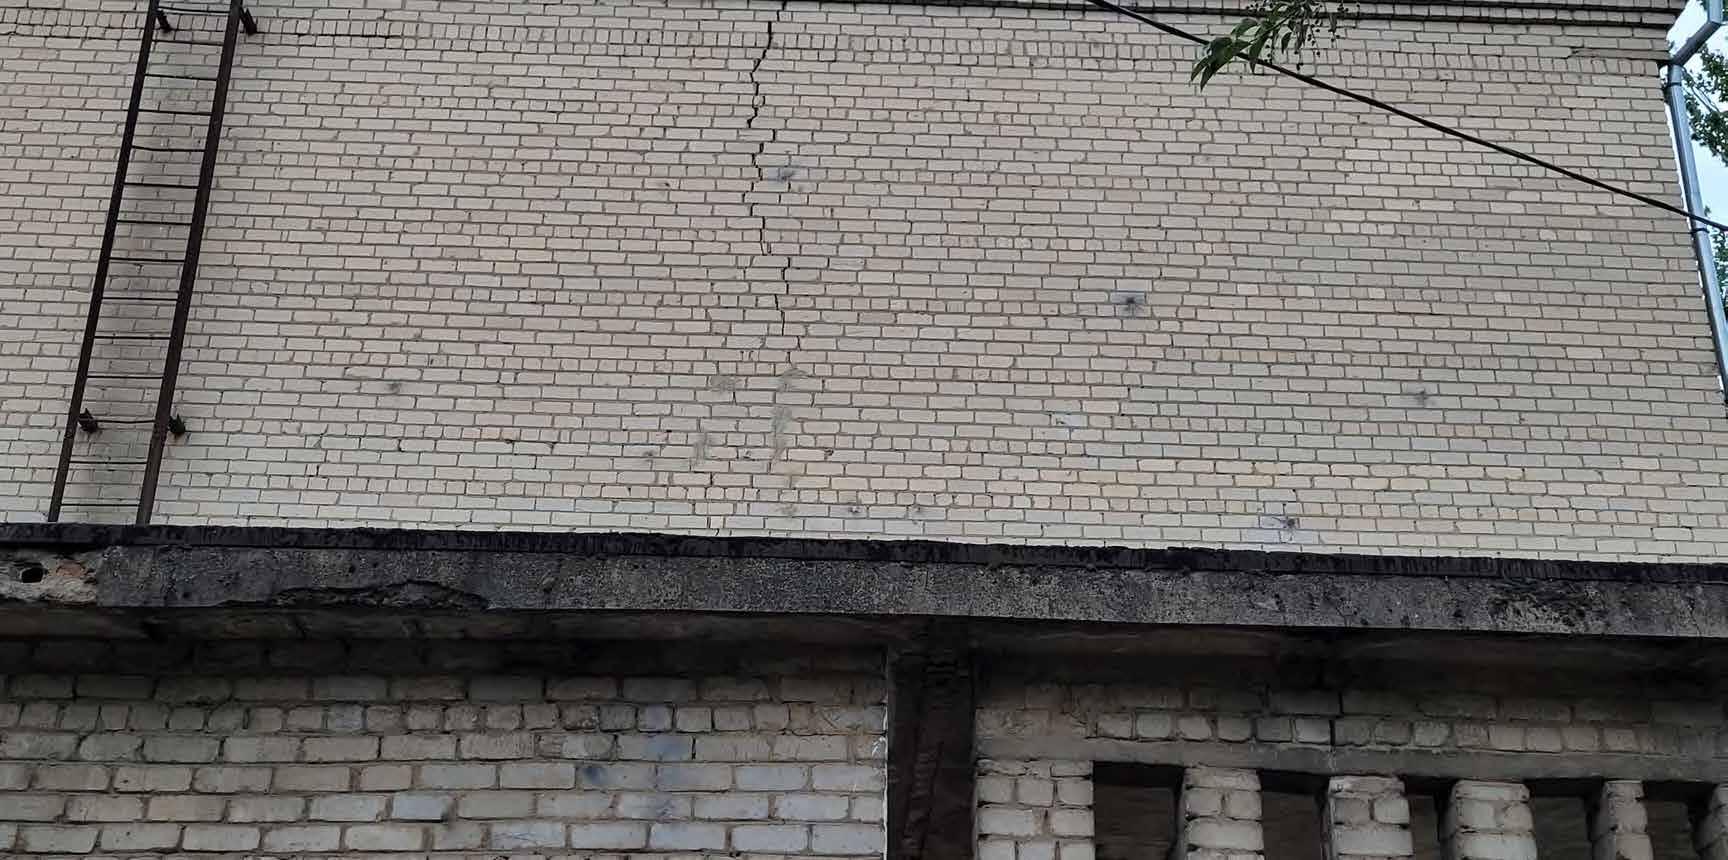
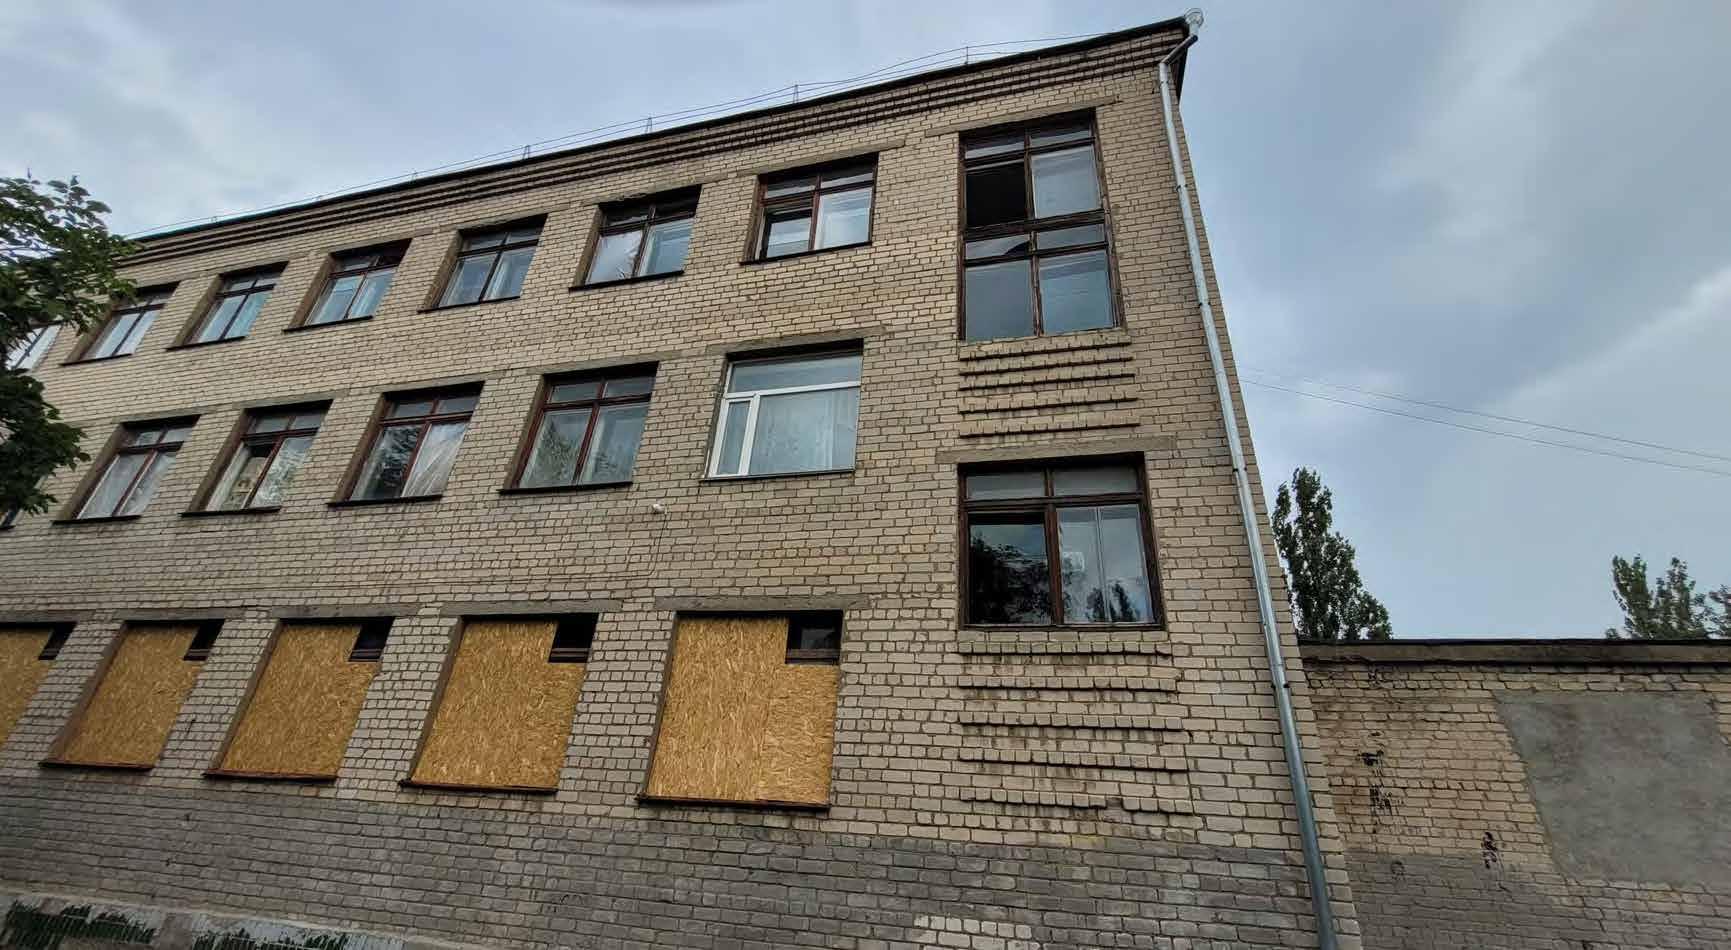
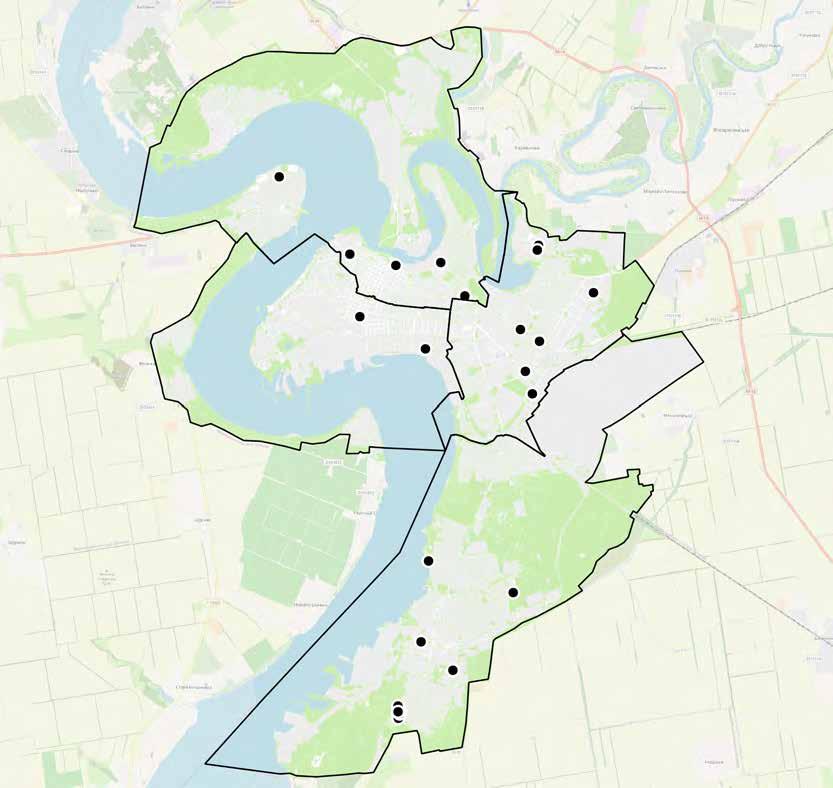
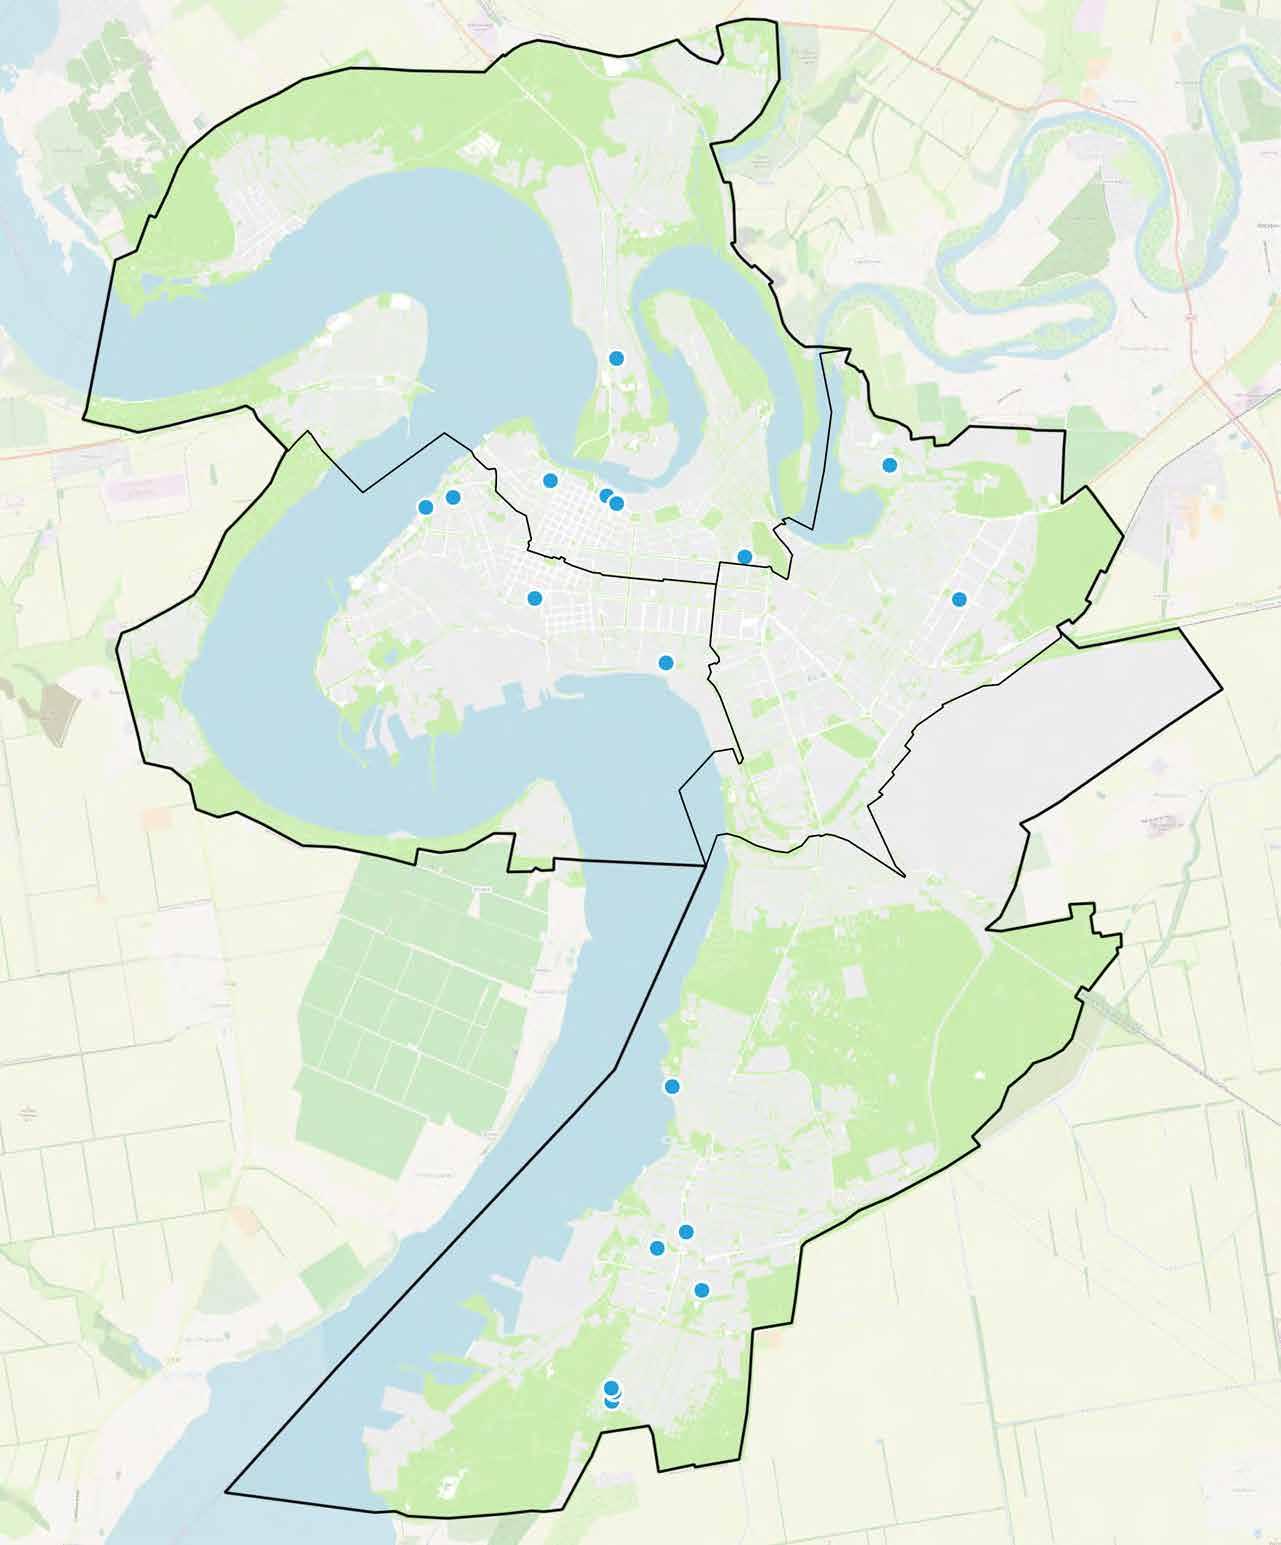
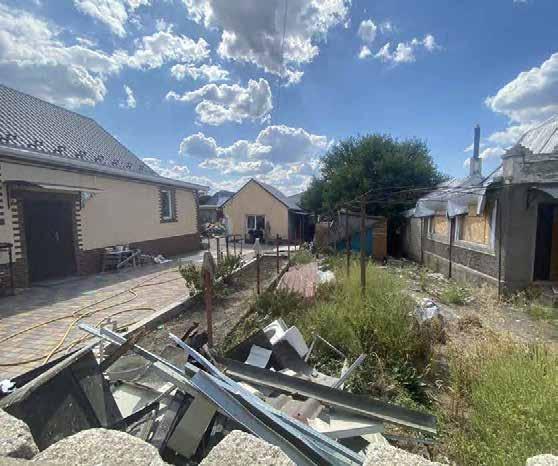
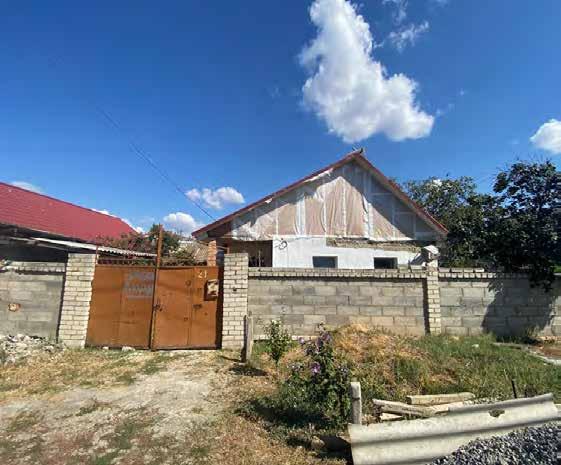
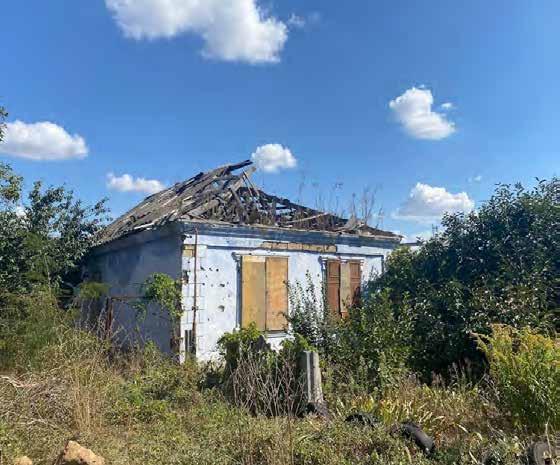
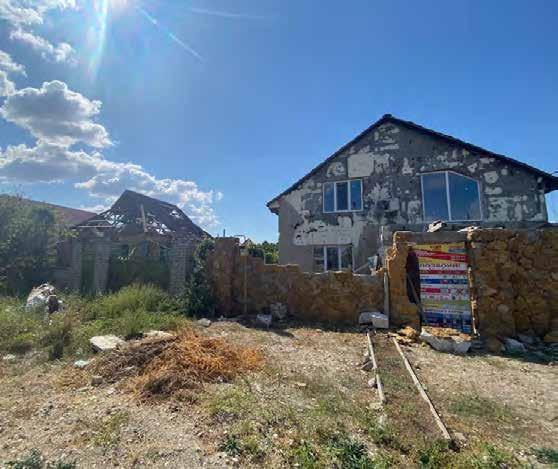
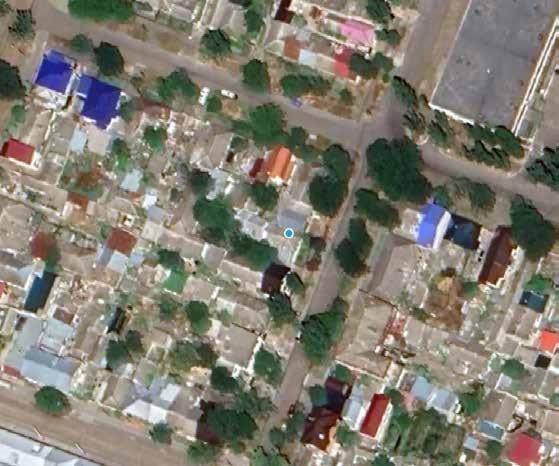
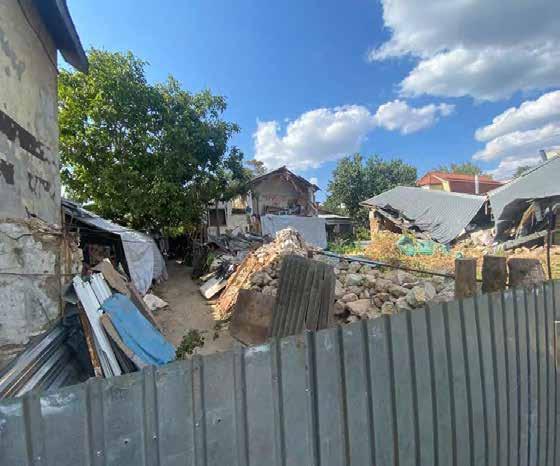
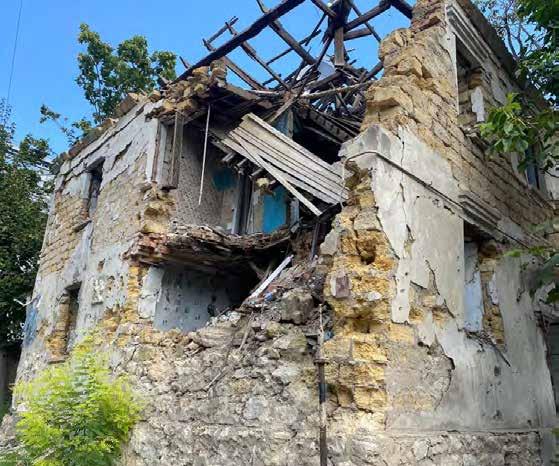
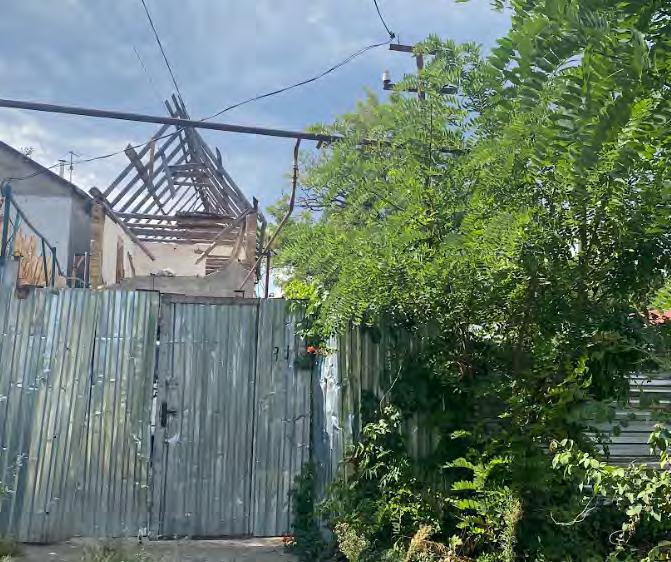
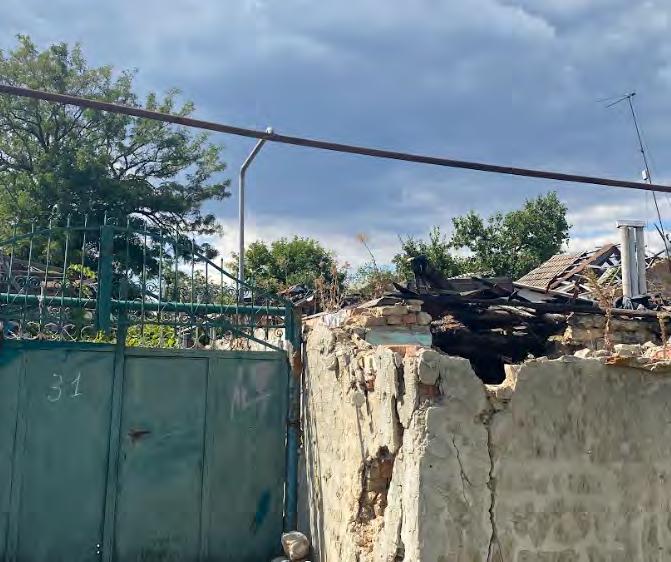
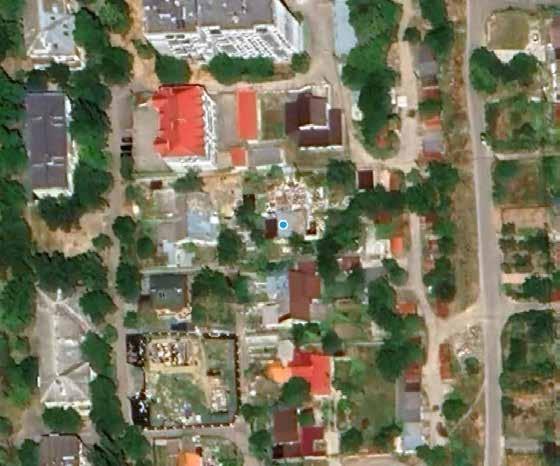
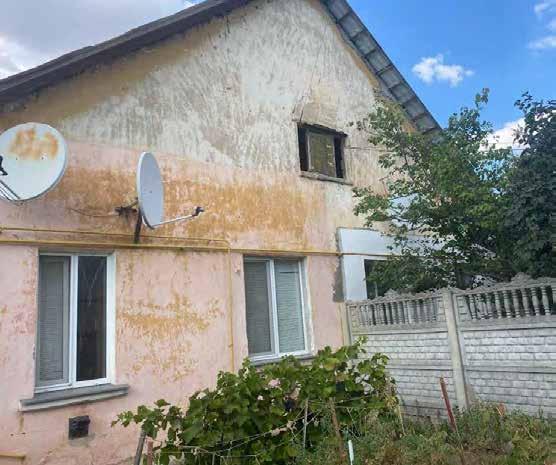
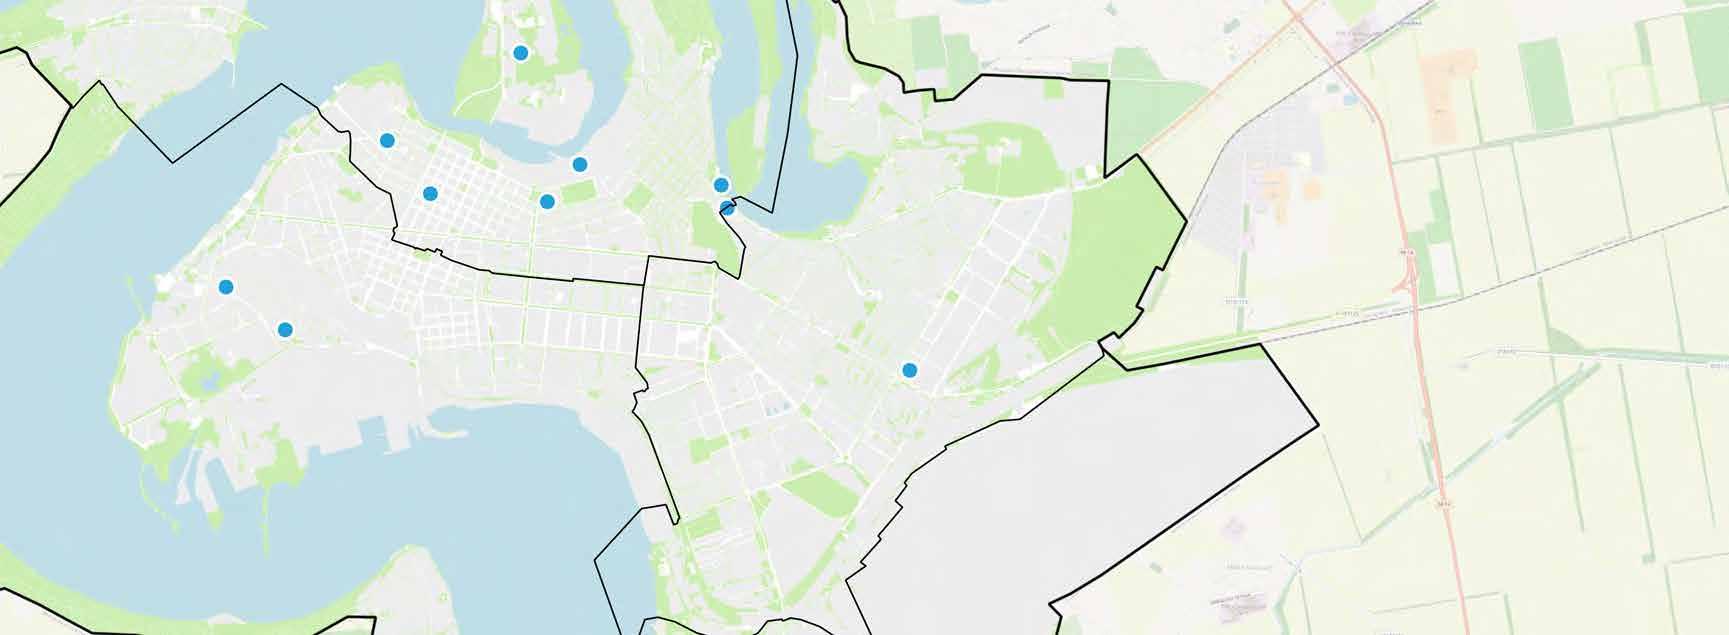
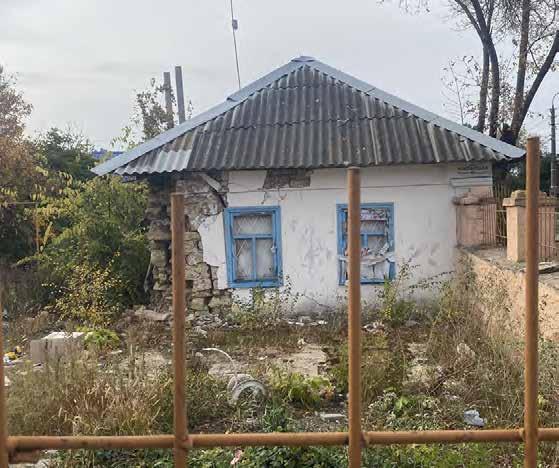
Damage category III
Buildings falling into this category have sustained the most extensive damage, making it highly unlikely for these units to be restored.
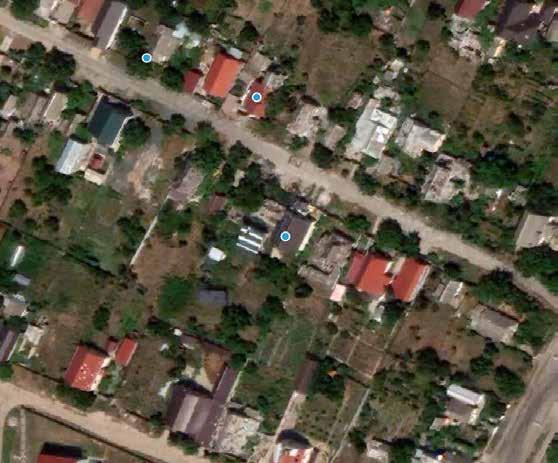
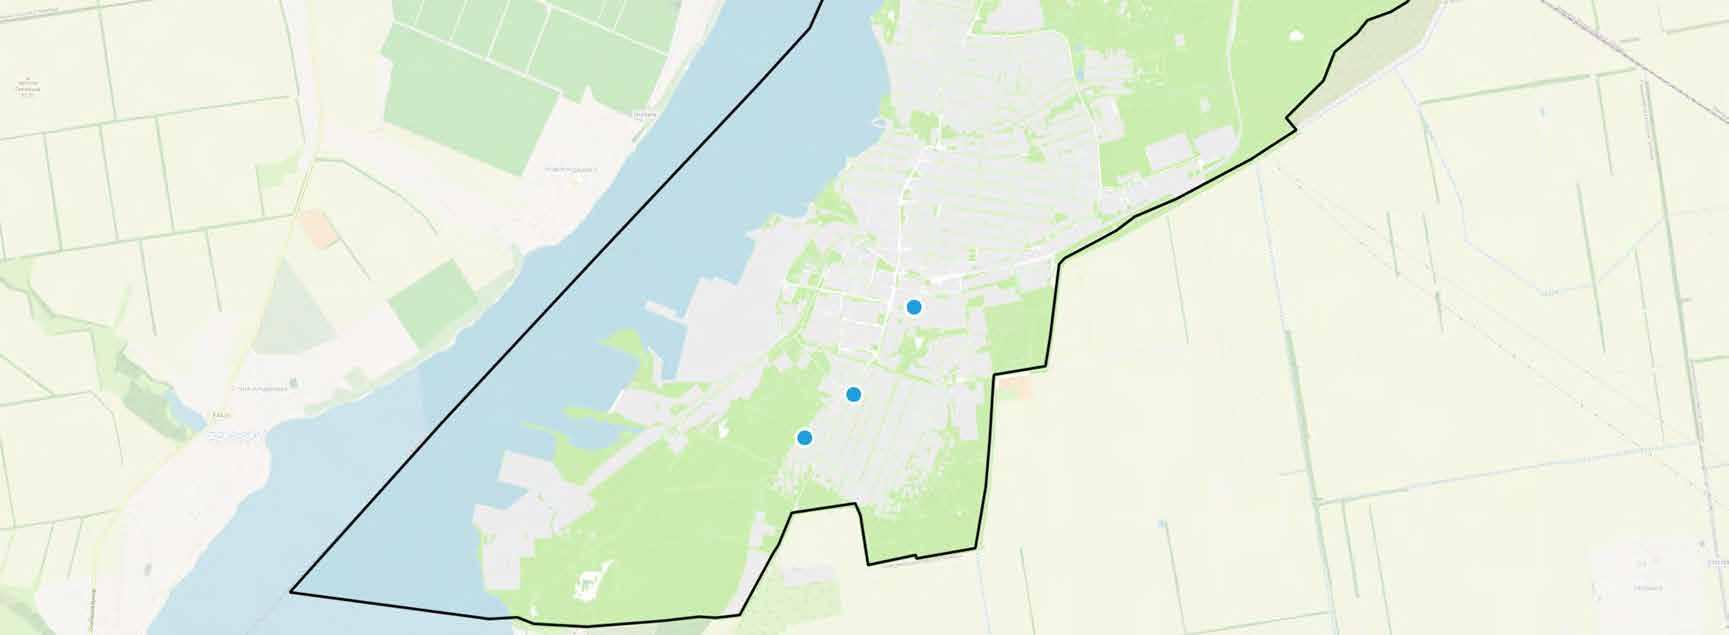
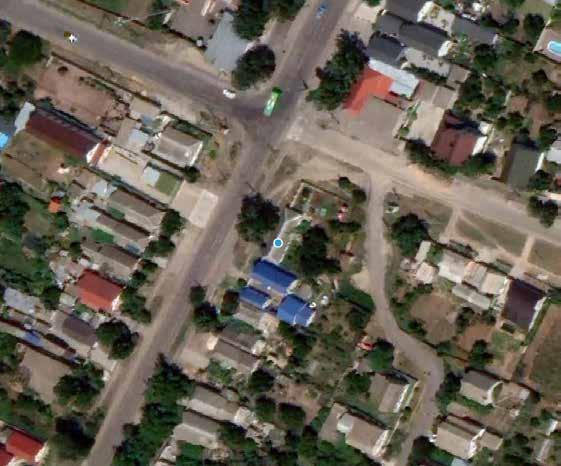
This mapping exercise is crucial for identifying the locations of affected buildings in the city and for evaluating the extent of damage from data available in the damage point database, including square meters and the number of people impacted.
In particular, the municipality was presented with a list of the addresses corresponding to the 29 damage points identified as Category III damage by the Damage Assessment. This allowed for on-site verification of the actual extent of the damage and collection of further data, as detailed in the following pages. As a result, a total of 16 buildings were confirmed to have suffered Category III damage. In addition, the municipality verified that six more community facilities suffered Category III damages, bringing the total number of buildings confirmed to have suffered Category III damages to 22.
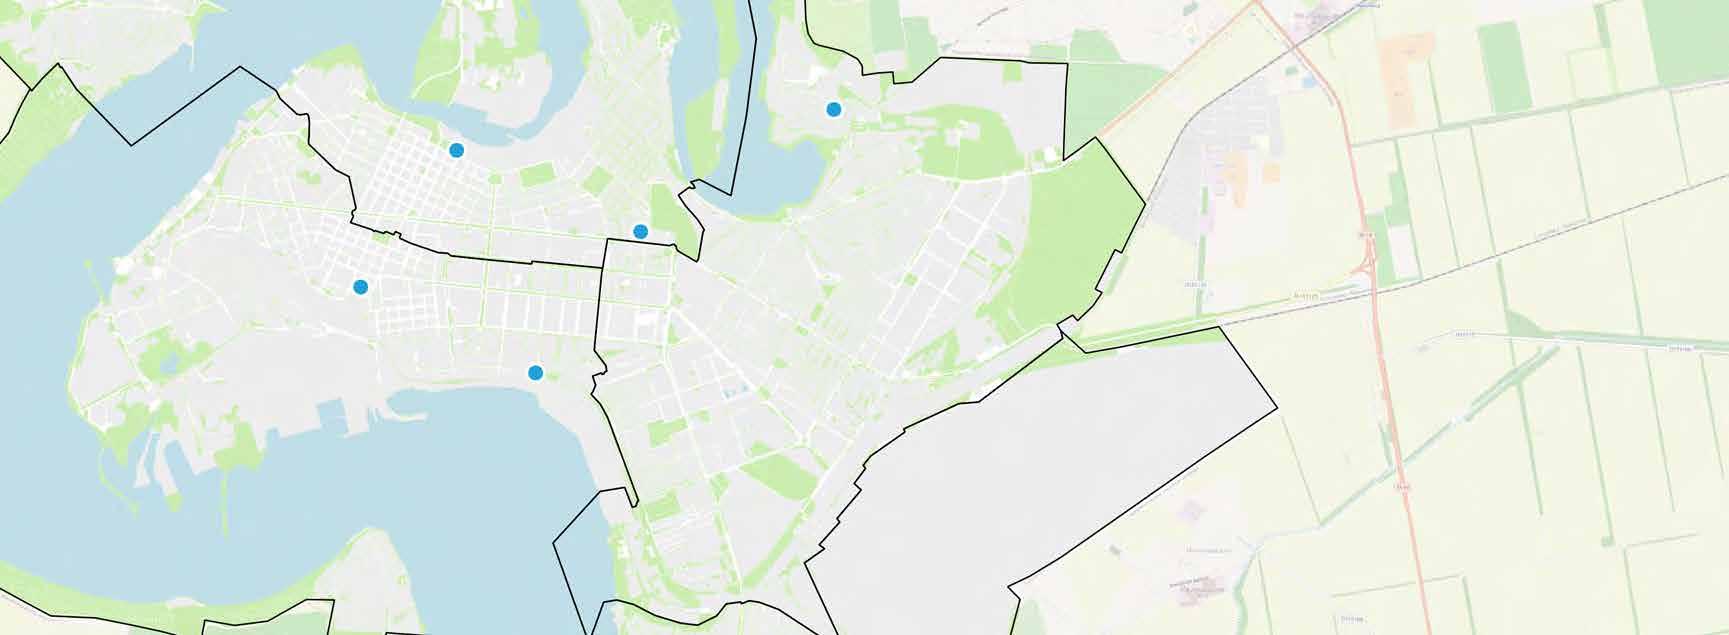
Builldings
TSENTRAL'NYI
INHULS'KYI
ZAVODS'KYI
Of the 22 buildings subject to category III damage identified thus far, 12 are residential buildings, 7 are school buildings, 1 is an administrative building, 1 is a cultural building and 1 is a sport facility. The building type was determined using the 'type_obj' field in the damage_points file. Estimating the number of individuals impacted by the demolition of each building was made feasible by utilizing the 'numer_persons_services' field within the damage point database. Notably, demolition of the seven school buildings has presented a particularly challenging scenario for the town, affecting its educational infrastructure.
3.362
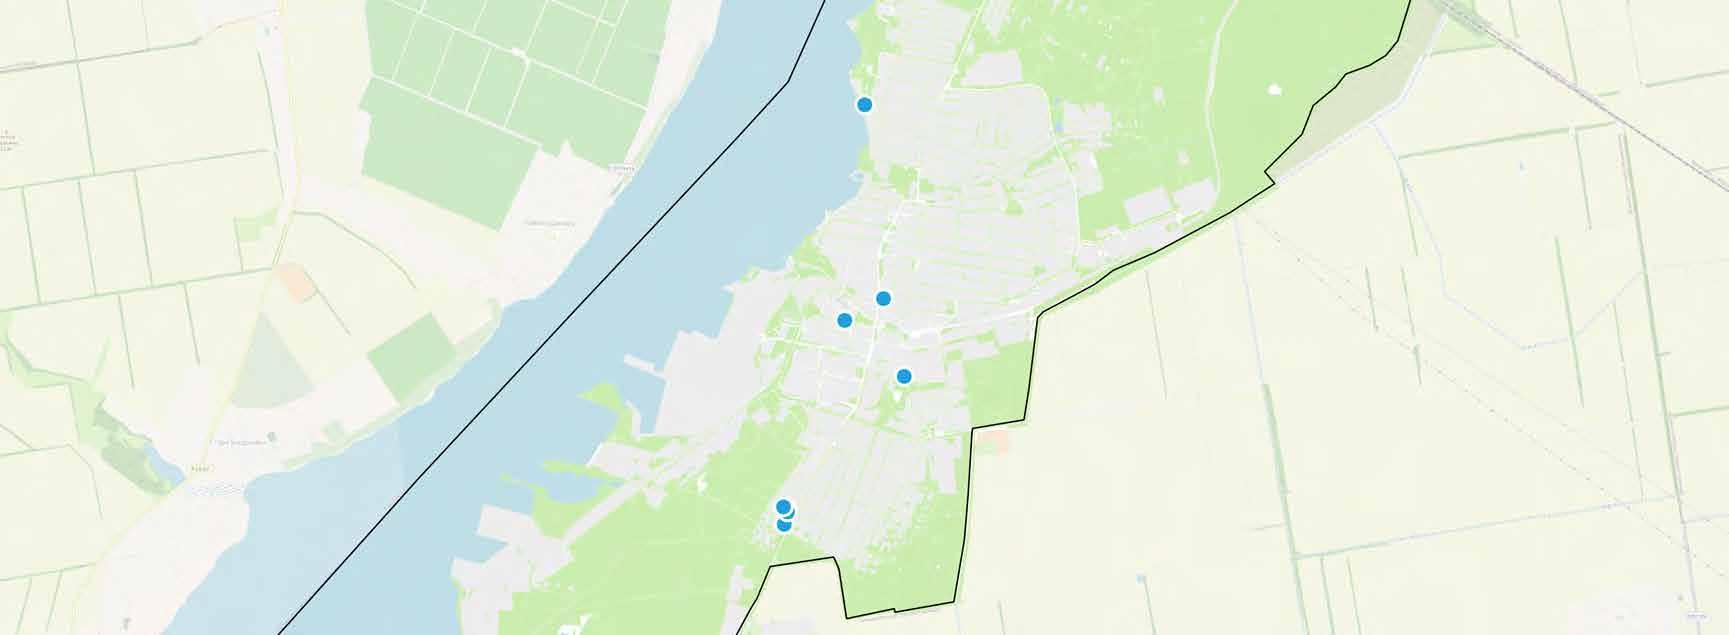
KORABEL'NYI
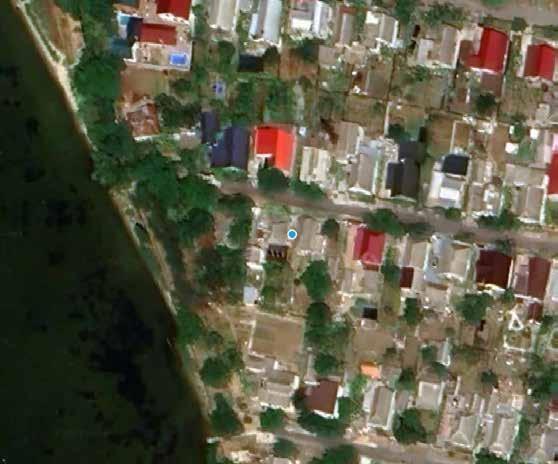
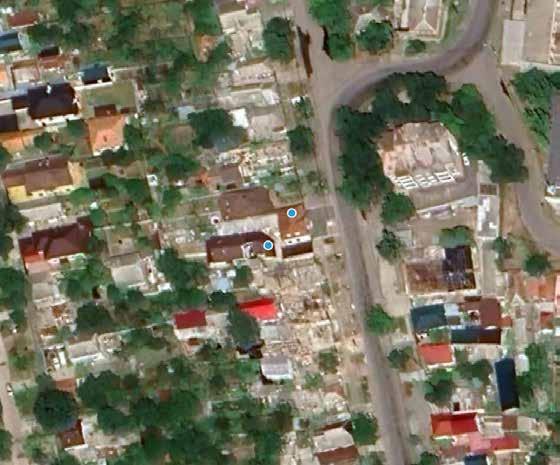
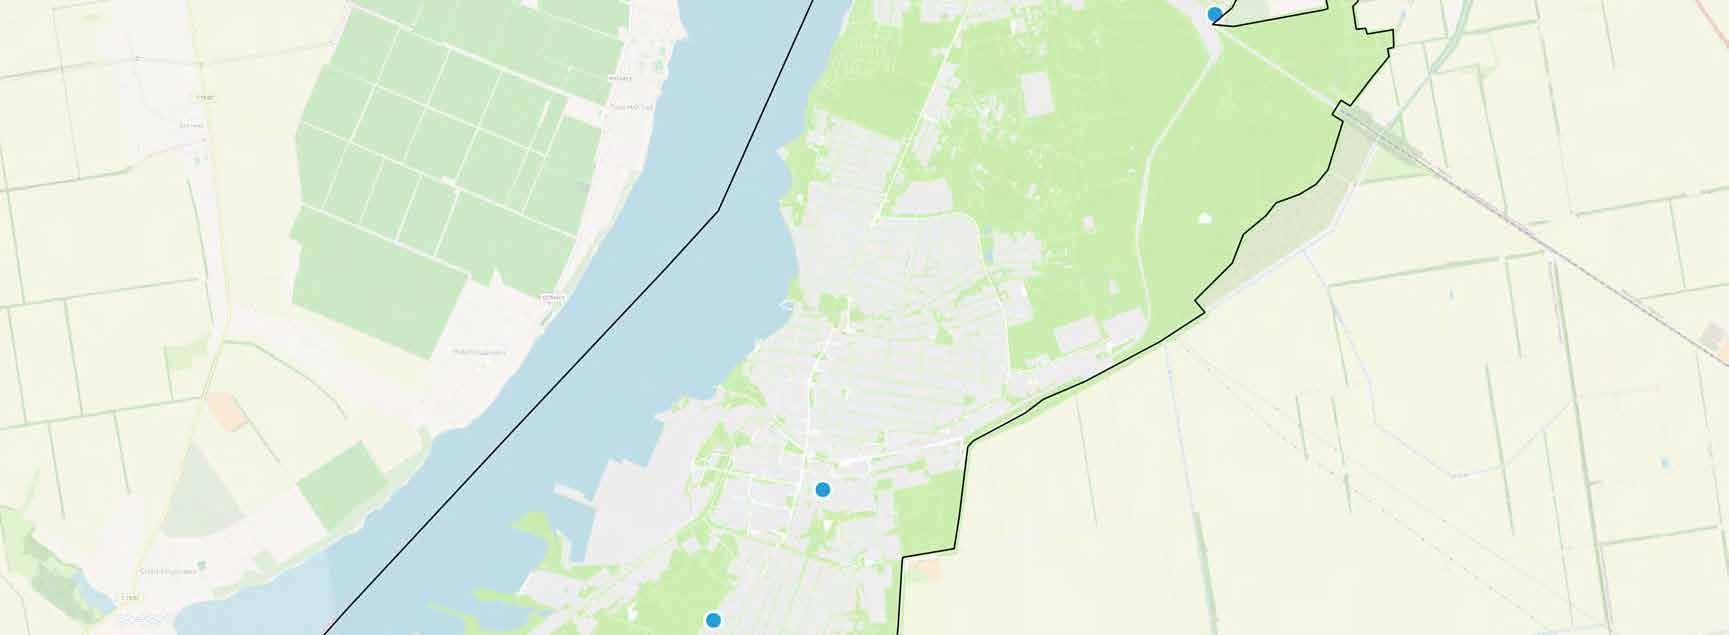
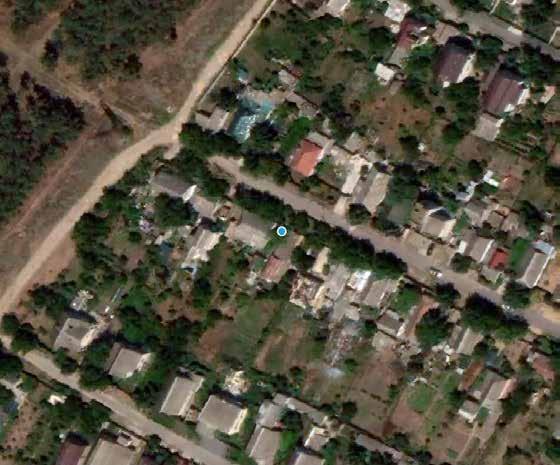
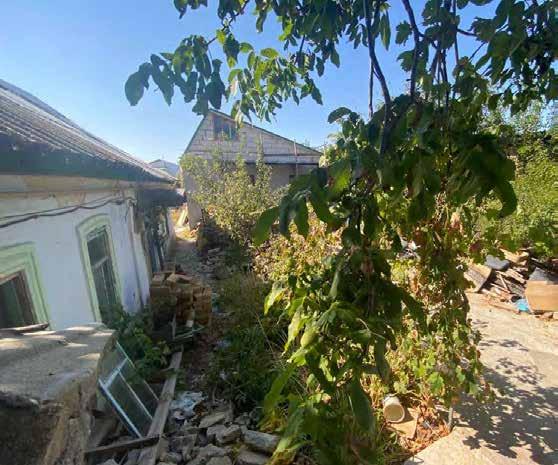
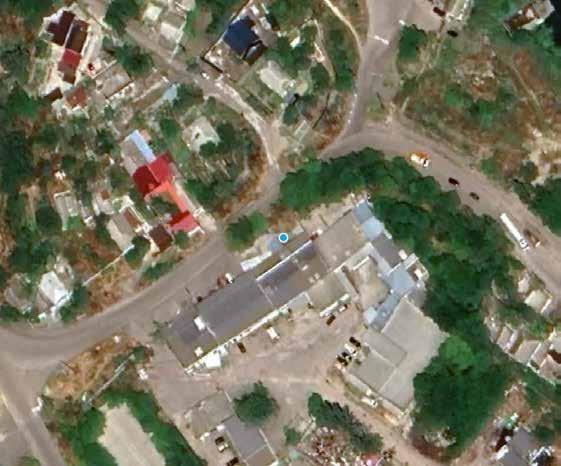
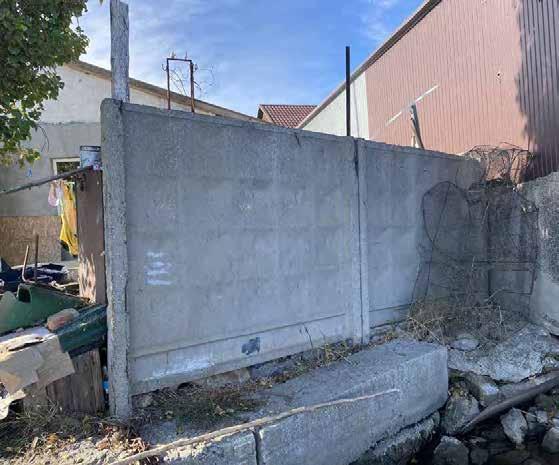
Inf_id: 3134421119965070866
District: Korabel'nyi
Address: Barkasny Lane, 6
Area (sqm): 103
N°floors: 1
GFA: 103
Typology: Residential
Distance to Public Transport: 940 m
People affected: not available
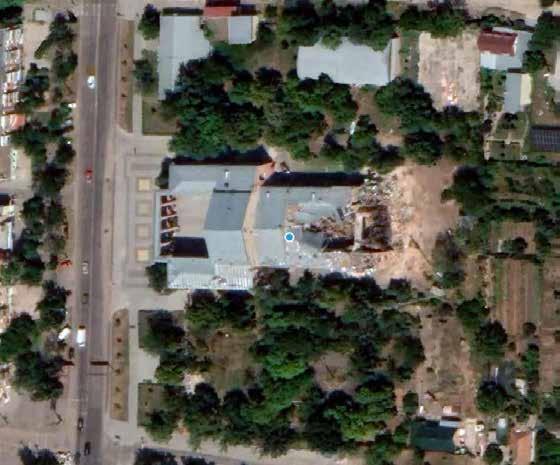
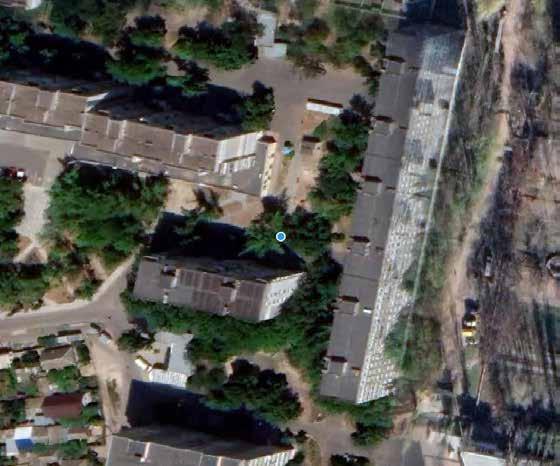
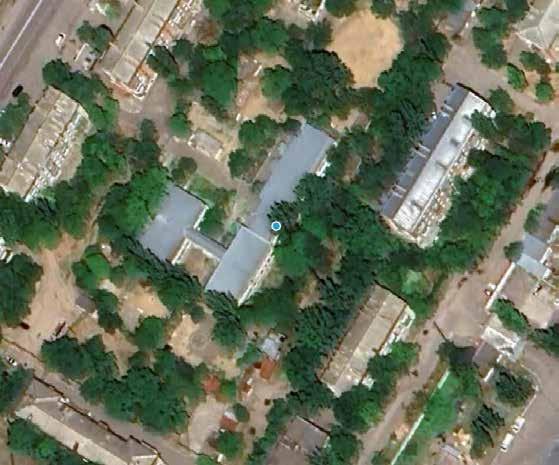
Inf_id: 3134421119965070866
Inf_id: 2993098258638701741
District: Korabel'nyi
Address: 328 Bogoyavlenskyi Ave
Area (sqm): 2000
N°floors: 2
GFA: 4000
Typology: Cultural facility
Distance to Public Transport: 110 m
People affected: 100
Inf_id: 2993098258638701741
2000
2
4000
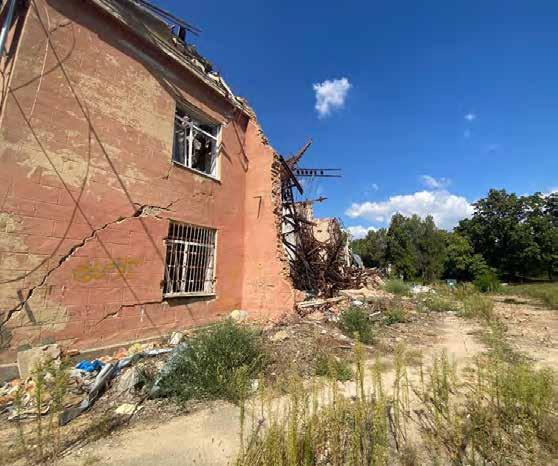
Inf_id: 2993098259293013135
District: Korabel'nyi
Address: St. Samoilovicha, 21
Area (sqm): 76
N°floors: 1
GFA: 76
Typology: Residential
Distance to Public Transport: 430 m
People affected: 1
Inf_id: 2993098259293013135
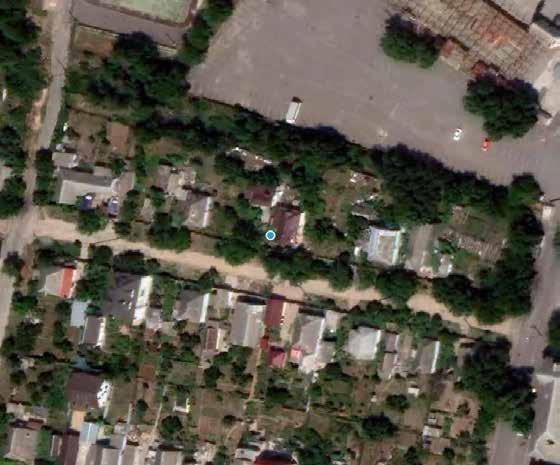
Inf_id: 2993098259477562939
District: Korabel'nyi
Address: St. General Popel, 164
Area (sqm): 3590
N°floors: 3
GFA: 10770
Typology: Educational facility
Distance to Public Transport: 530 m
People affected: 998
2993098259477562939
KORABEL'NYI
Inf_id: 2993098258630313109
District: Korabel'nyi
Address: St. Pshenitsyna, 21
Area (sqm): 200
N°floors: 2
GFA: 400
Typology: Residential
Distance to Public Transport: 260 m
People affected: 2
Inf_id: 2993098258630313109
Inf_id: 2993098258630313113
District: Korabel'nyi
Address: St. Pshenitsyna, 23
Area (sqm): 190
N°floors: 1
GFA: 380
Typology: Residential
Distance to Public Transport: 220 m
People affected: 1
Inf_id: 2993098258630313113
23
(кв.м.): 190
1
380
KORABEL'NYI
Inf_id: 2993098258630313111
District: Korabel'nyi
Address: St. Pshenitsyna, 22 A
Area (sqm): 240
N°floors: 2
GFA: 480
Typology: Residential
Distance to Public Transport: 180 m
People affected: 1
Inf_id: 2993098258630313111
Inf_id: 2993098259469174313
District: Korabel'nyi
Address: 457 Bogoyavlenskyi Ave
Area (sqm): 150
N°floors: 2
GFA: 150
Typology: Residential
Distance to Public Transport: 70 m
People affected: 2
2993098259469174313
KORABEL'NYI
Inf_id: 2993098259905381829
District: Zavods'kyi
Address: St. Lyagina, 61
Area (sqm): 1000
N°floors: 1
GFA: 1000
Typology: Residential
Distance to Public Transport: 170 m
People affected: 12
Inf_id: 2993098259905381829
Inf_id: 2993098258605147203
District: Zavods'kyi
Address: St. Zavodska, 35, building 1
Area (sqm): 500
N°floors: 2
GFA: 1000
Typology: Residential
Distance to Public Transport: 530 m
People affected: 10
Inf_id: 2993098258605147203
(кв.м.): 500
2
1000
Inf_id: 2993098258605147205
District: Zavods'kyi
Address: St. Zavodska, 35, building 2
Area (sqm): 300
N°floors: 2
GFA: 600
Typology: Residential
Distance to Public Transport: 530 m
People affected: 10
Inf_id: 2993098259871827331
District: Inhuls'kyi
Address: St. Garage, 39
Area (sqm): 80
N°floors: 1
GFA: 80
Typology: Residential
Distance to Public Transport: 100 m
People affected: 1 Inf_id: 2993098259871827331
ZAVODS'KYI
INHULS'KYI
Inf_id: 2993098258118608633
District: Tsentral'nyi
Address: prov. Parusny, 3-A
Area (sqm): 1053
N°floors: 4
GFA: 4012
Typology: Educational facility
Distance to Public Transport: 290 m
People affected: 1414
Inf_id: 2993098258118608633
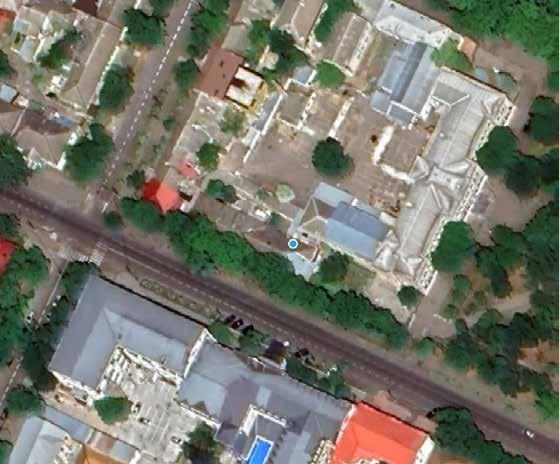
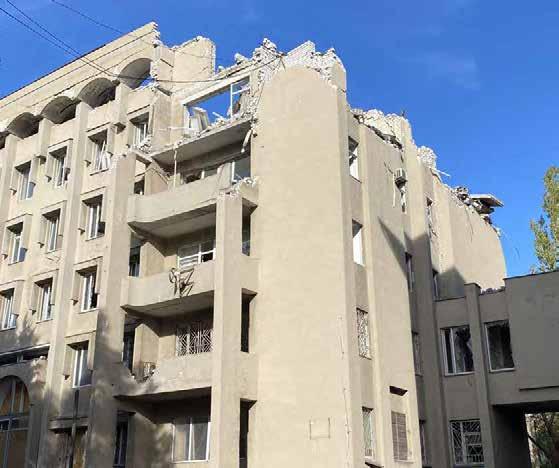
Inf_id: 2993098259536283317
District: Tsentral'nyi
Address: St. Admiralska, 22
Area (sqm): 3235
N°floors: 9
GFA: 29115
Typology: Administrative building
Distance to Public Transport: 530 m
People affected: not available
Inf_id: 2993098259536283317
3235
9
29115
Inf_id: 2993098259863438707
District: Tsentral'nyi
Address: St. Marshala Vasylevsky, 33
Area (sqm): 120
N°floors: 1
GFA: 120
Typology: Residential
Distance to Public Transport: 145 m
People affected: 1
Inf_id: 2993098259871827339
District: Tsentral'nyi
Address: St. Marshala Vasylevsky, 31
Area (sqm): 100
N°floors: 1
GFA: 100
Typology: Residential
Distance to Public Transport: 150 m
People affected: 1
Inf_id: 2993098259871827339
Inf_id: 2993098259192350563
District: Tsentral'nyi
Address: St. Nikolska, 34
Area (sqm): 683
N°floors: 2
GFA: 1366
Typology: Educational facility
Distance to Public Transport: 10 m
People affected: not available
Inf_id: 2993098259192350563
Район: Центральний
(кв.м.): 683
2
1366
Inf_id: 2993098258420598311
District: Tsentral'nyi
34
Address: St. Admiralska, 24
Area (sqm): 1230
N°floors: 2,3
GFA: 3690
Typology: Educational facility
Distance to Public Transport: 420 m
People affected: 745
Inf_id: 2993098258420598311 Район: Центральний
(кв.м.): 1230
2,3
3690
Inf_id: 2993098258202494911
District: Zavods'kyi
Address: St. Sportivna, 11
Area (sqm): 147
N°floors: 2
GFA: 294
Typology: Sport facility
Distance to Public Transport: 510 m
People affected: not available
Inf_id: 2993098258202494911 Район:
2
Inf_id: 2993098258185717645
District: Zavods'kyi
Address: St. Nikolska, 24
Area (sqm): 470
N°floors: 5
GFA: 2350
Typology: Educational facility
Distance to Public Transport: 70 m
People affected: not available
Inf_id: 2993098258185717645
24
(кв.м.): 470
5
2350
ZAVODS'KYI
Inf_id: 2993098258185717655
District: Inhuls'kyi
Address: St. Vingranovsky, 62
Area (sqm): 1570
N°floors: 4
GFA: 6280
Typology: Educational facility
Distance to Public Transport: 310 m
People affected: not available
Inf_id: 2993098258185717655
62
(кв.м.): 1570
4
6280
Inf_id: 2993098258772919865
District: Korabel'nyi
Address: St. Kobzarska, 15
Area (sqm): 850
N°floors: 1
GFA: 850
Typology: Educational facility
Distance to Public Transport: 240 m
People affected: 205
Inf_id: 2993098258772919865 Район:
15
Площа (кв.м) 850
1
850
240
205
INHULS'KYI
KORABEL'NYI
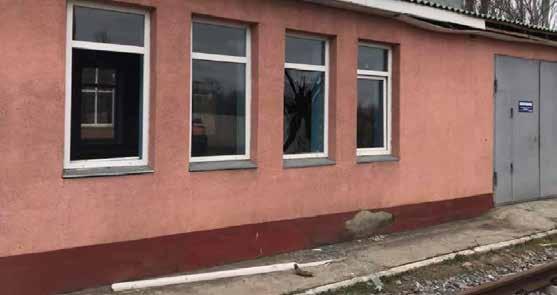
Damage category II
According to the database provided by the Municipality, the number of points subject to category II damages initially amounted to 361. To refine this analysis, two key factors were considered:
• Level of destruction: Only damage points with destruction levels exceeding 80% were included.
• Number of people affected: This information, sourced from the database, varies depending on the building's function, including residents, workers, or visitors.
The team therefore provided a list of 33 points with a degree of destruction higher than 80%, and affecting more than 50 people. In order to evaluate priorities, the Municipality supported by doing a site recognition of these points, helping fixing some errors in the original database. As a result, this comprehensive analysis confirmed the presence of Category II damage in 10 buildings. In addition, the municipality verified that a further seven community facilities buildings suffered Category II damage.
According to the database provided by the Municipality, the number of points subject to category II damages initially amounted to 361. To refine this analysis, two key factors were considered:
BUILDINGS
KORABEL'NYI
ZAVODS'KYI
The 17 buildings analysed included 8 residential buildings, 6 school buildings, 2 sport facilities and one cultural facility. The building type was determined using the 'type_obj' field in the damage_ points file. The affected residences sometimes include apartment buildings, resulting in a substantial number of affected individuals. Furthermore, it is estimated that there are at least 704 students housed within the six school buildings displaying Category II damage.
Inf_id: 2993098258538039169
District: Korabel'nyi
Address: St. Kubynska, 6
Area (sqm): not available
N°floors: 1
GFA: not available
Typology: Residential
Distance to Public Transport: 480 m
People affected: not available
Inf_id: 2993098258705810779
District: Korabel'nyi
Address: St. General Popel, 176 A
Area (sqm): 2531
N°floors: 2
GFA: 5062
Typology: Educational facility
Distance to Public Transport: 385 m
People affected: 226
Inf_id: 2993098258705810779
2531
5062
Inf_id: 2993098258160551749
District: Korabel'nyi
Address: St. Raiduzhna, 49
Area (sqm): 2131
N°floors: 4
GFA: 8524
Typology: Residential
Distance to Public Transport: 220 m
People affected: 55
Inf_id: 2993098258160551749
Inf_id: 2993098259452397063
District: Korabel'nyi
Address: St. Vokzalna, 61
Area (sqm): 3999
N°floors: 9
GFA: 35994
Typology: Residential
Distance to Public Transport: 130 m
People affected: 75
Inf_id: 2993098259452397063
61
(кв.м.): 3999.3
9
35994
KORABEL'NYI
Inf_id: 2993098259007800593
District: Korabel'nyi
Address: St. Znamenska, 2/6
Area (sqm): 4243
N°floors: 3
GFA: 12729
Typology: Educational facility
Distance to Public Transport: 40 m
People affected: 478
Inf_id: 2993098259007800593
2/6
(кв.м.): 4243
3
12729
Inf_id: 2993098259276235857
District: Zavods'kyi
Address: St. Krylova, 8 Area (sqm): 7159.8
N°floors: 5
GFA: 35799
Typology: Residential Distance to Public Transport: 160 m
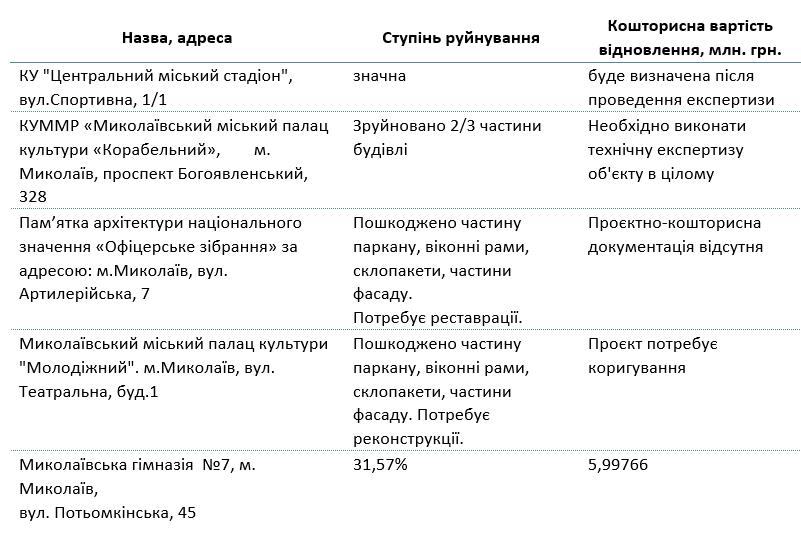
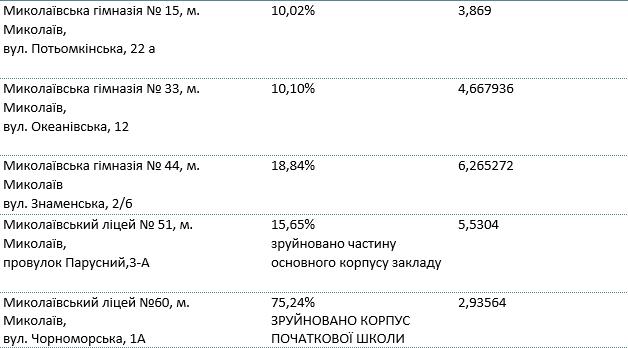
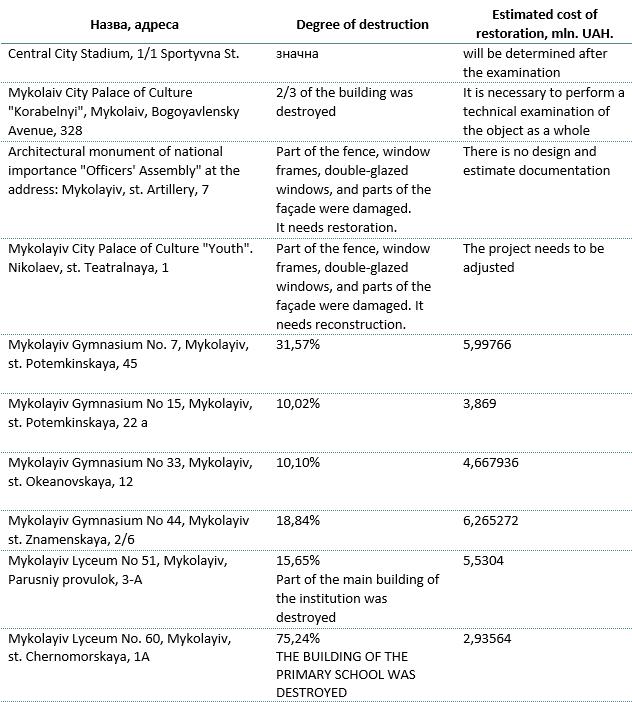
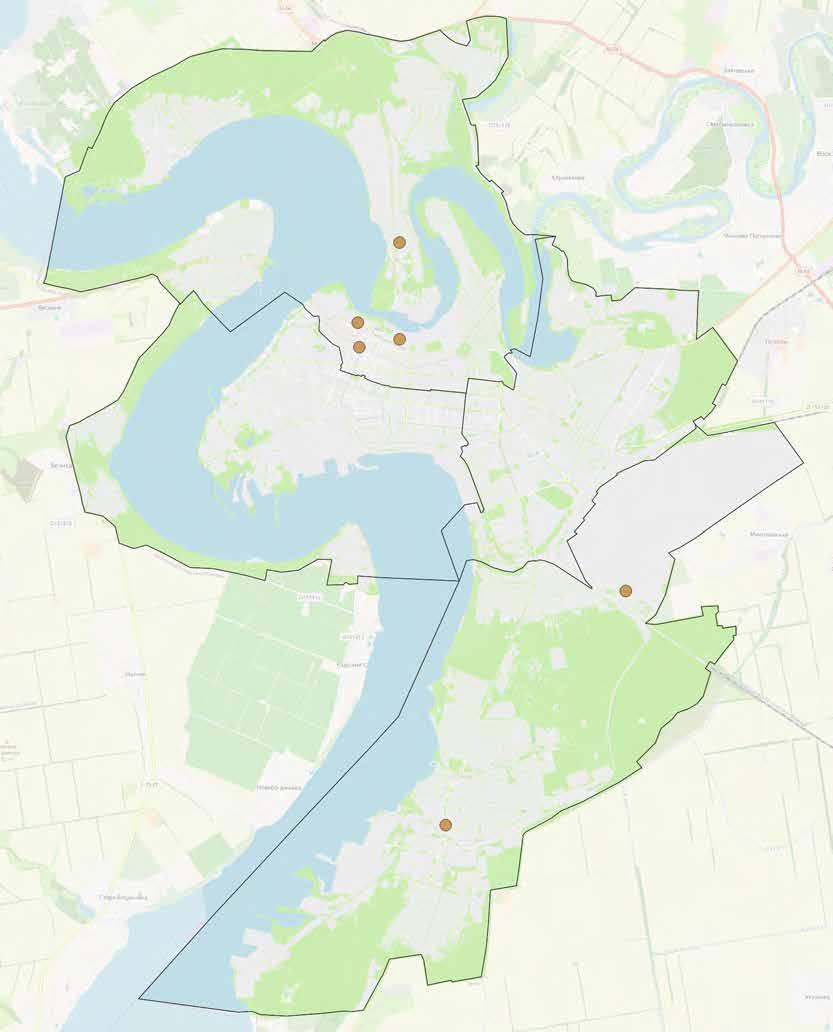
A local working group, composed by local stakeholders guided by UNDP have compiled a list of both damaged and destroyed buildings that are considered reconstruction priorities, as showed in the extracts below.
Cover of the "Analytical Part" document compiled by the local working group
List of damaged / destroyed items considered to be a priority
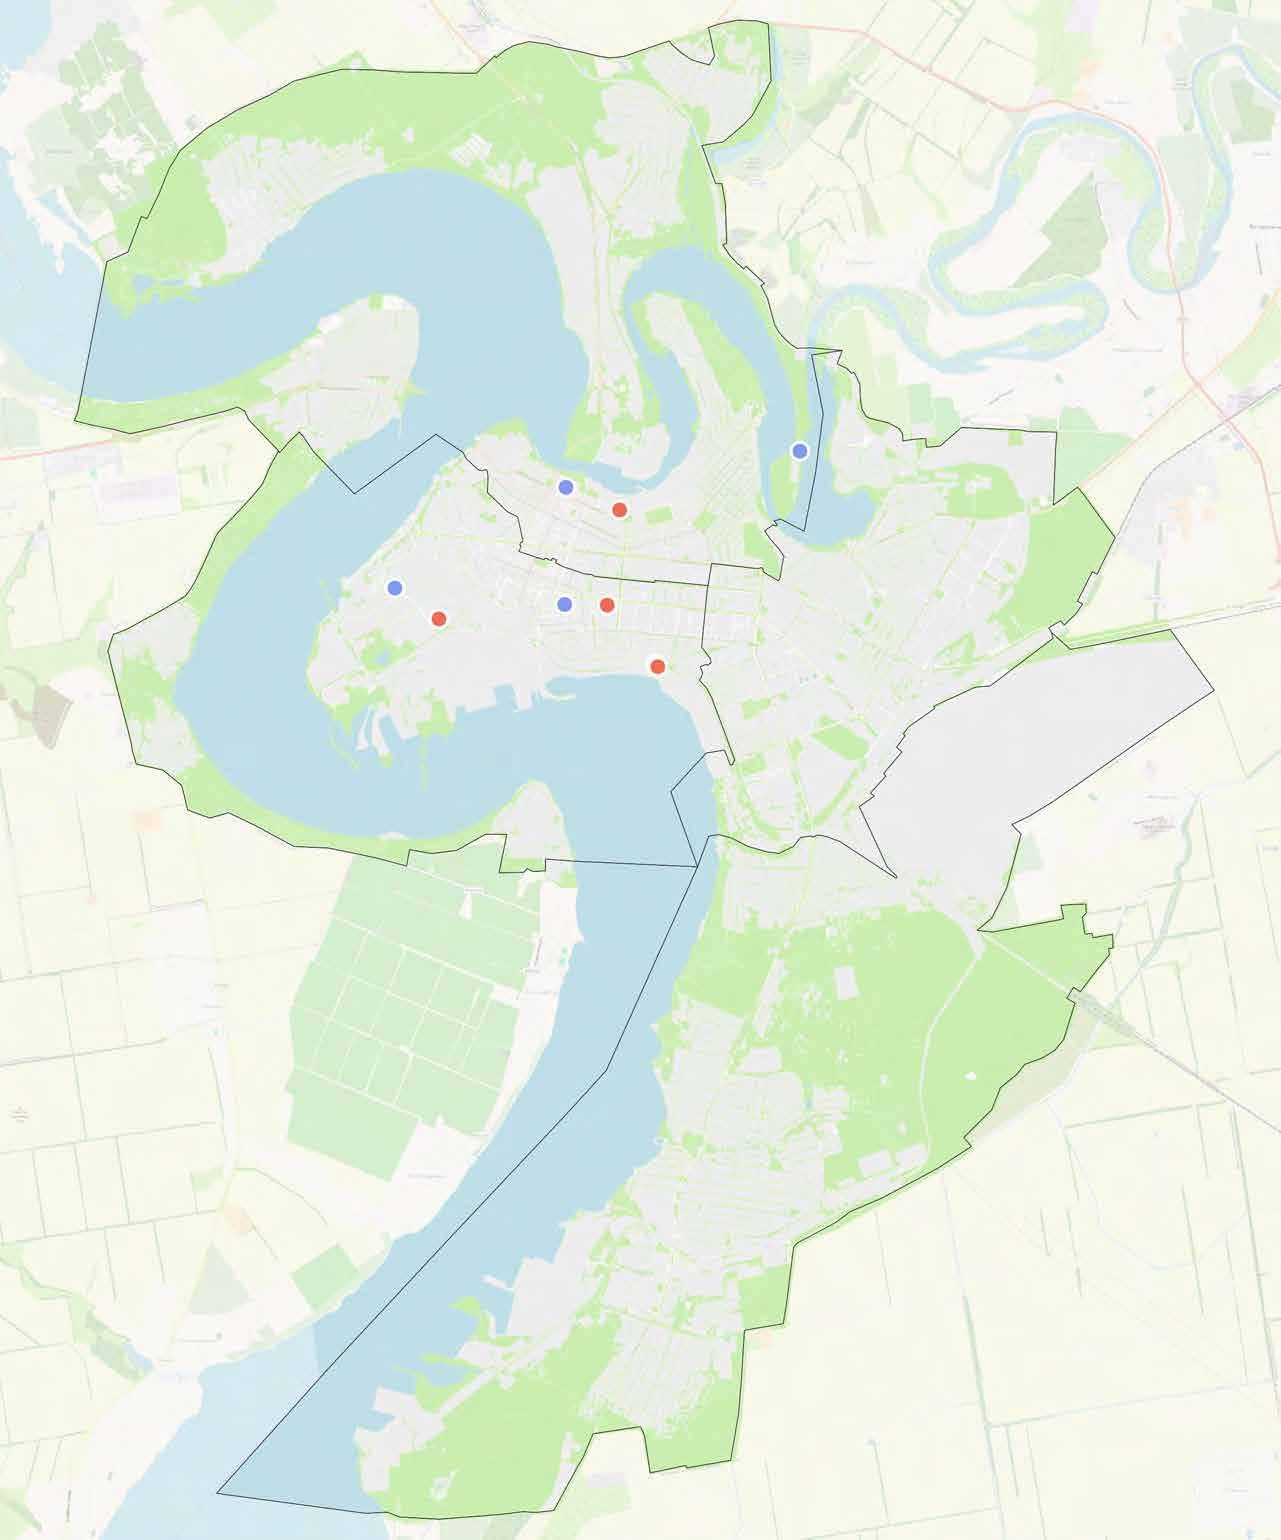
The list provided by the working group has been crossed-referenced with the category II and III damage map defined together with the municipality.
The resulting buildings are primarily addressing the provision of community facilities in particular in the spheres of healthcare, education, culture and sport.
Reconstruction priorities - heavily damaged buildings verified with the municipality
Mykolaiv municipality | Housing priorities
Yevhen Poliakov, Director of the Department of Architecture and Urban Planning of Mykolaiv, provided a list of buildings that have suffered damage of Category II and are intended to be renovated through local budget funds. Six residential buildings are scheduled for demolition as they have sustained Category III damage; however, this can only happen if all homeowners agree.
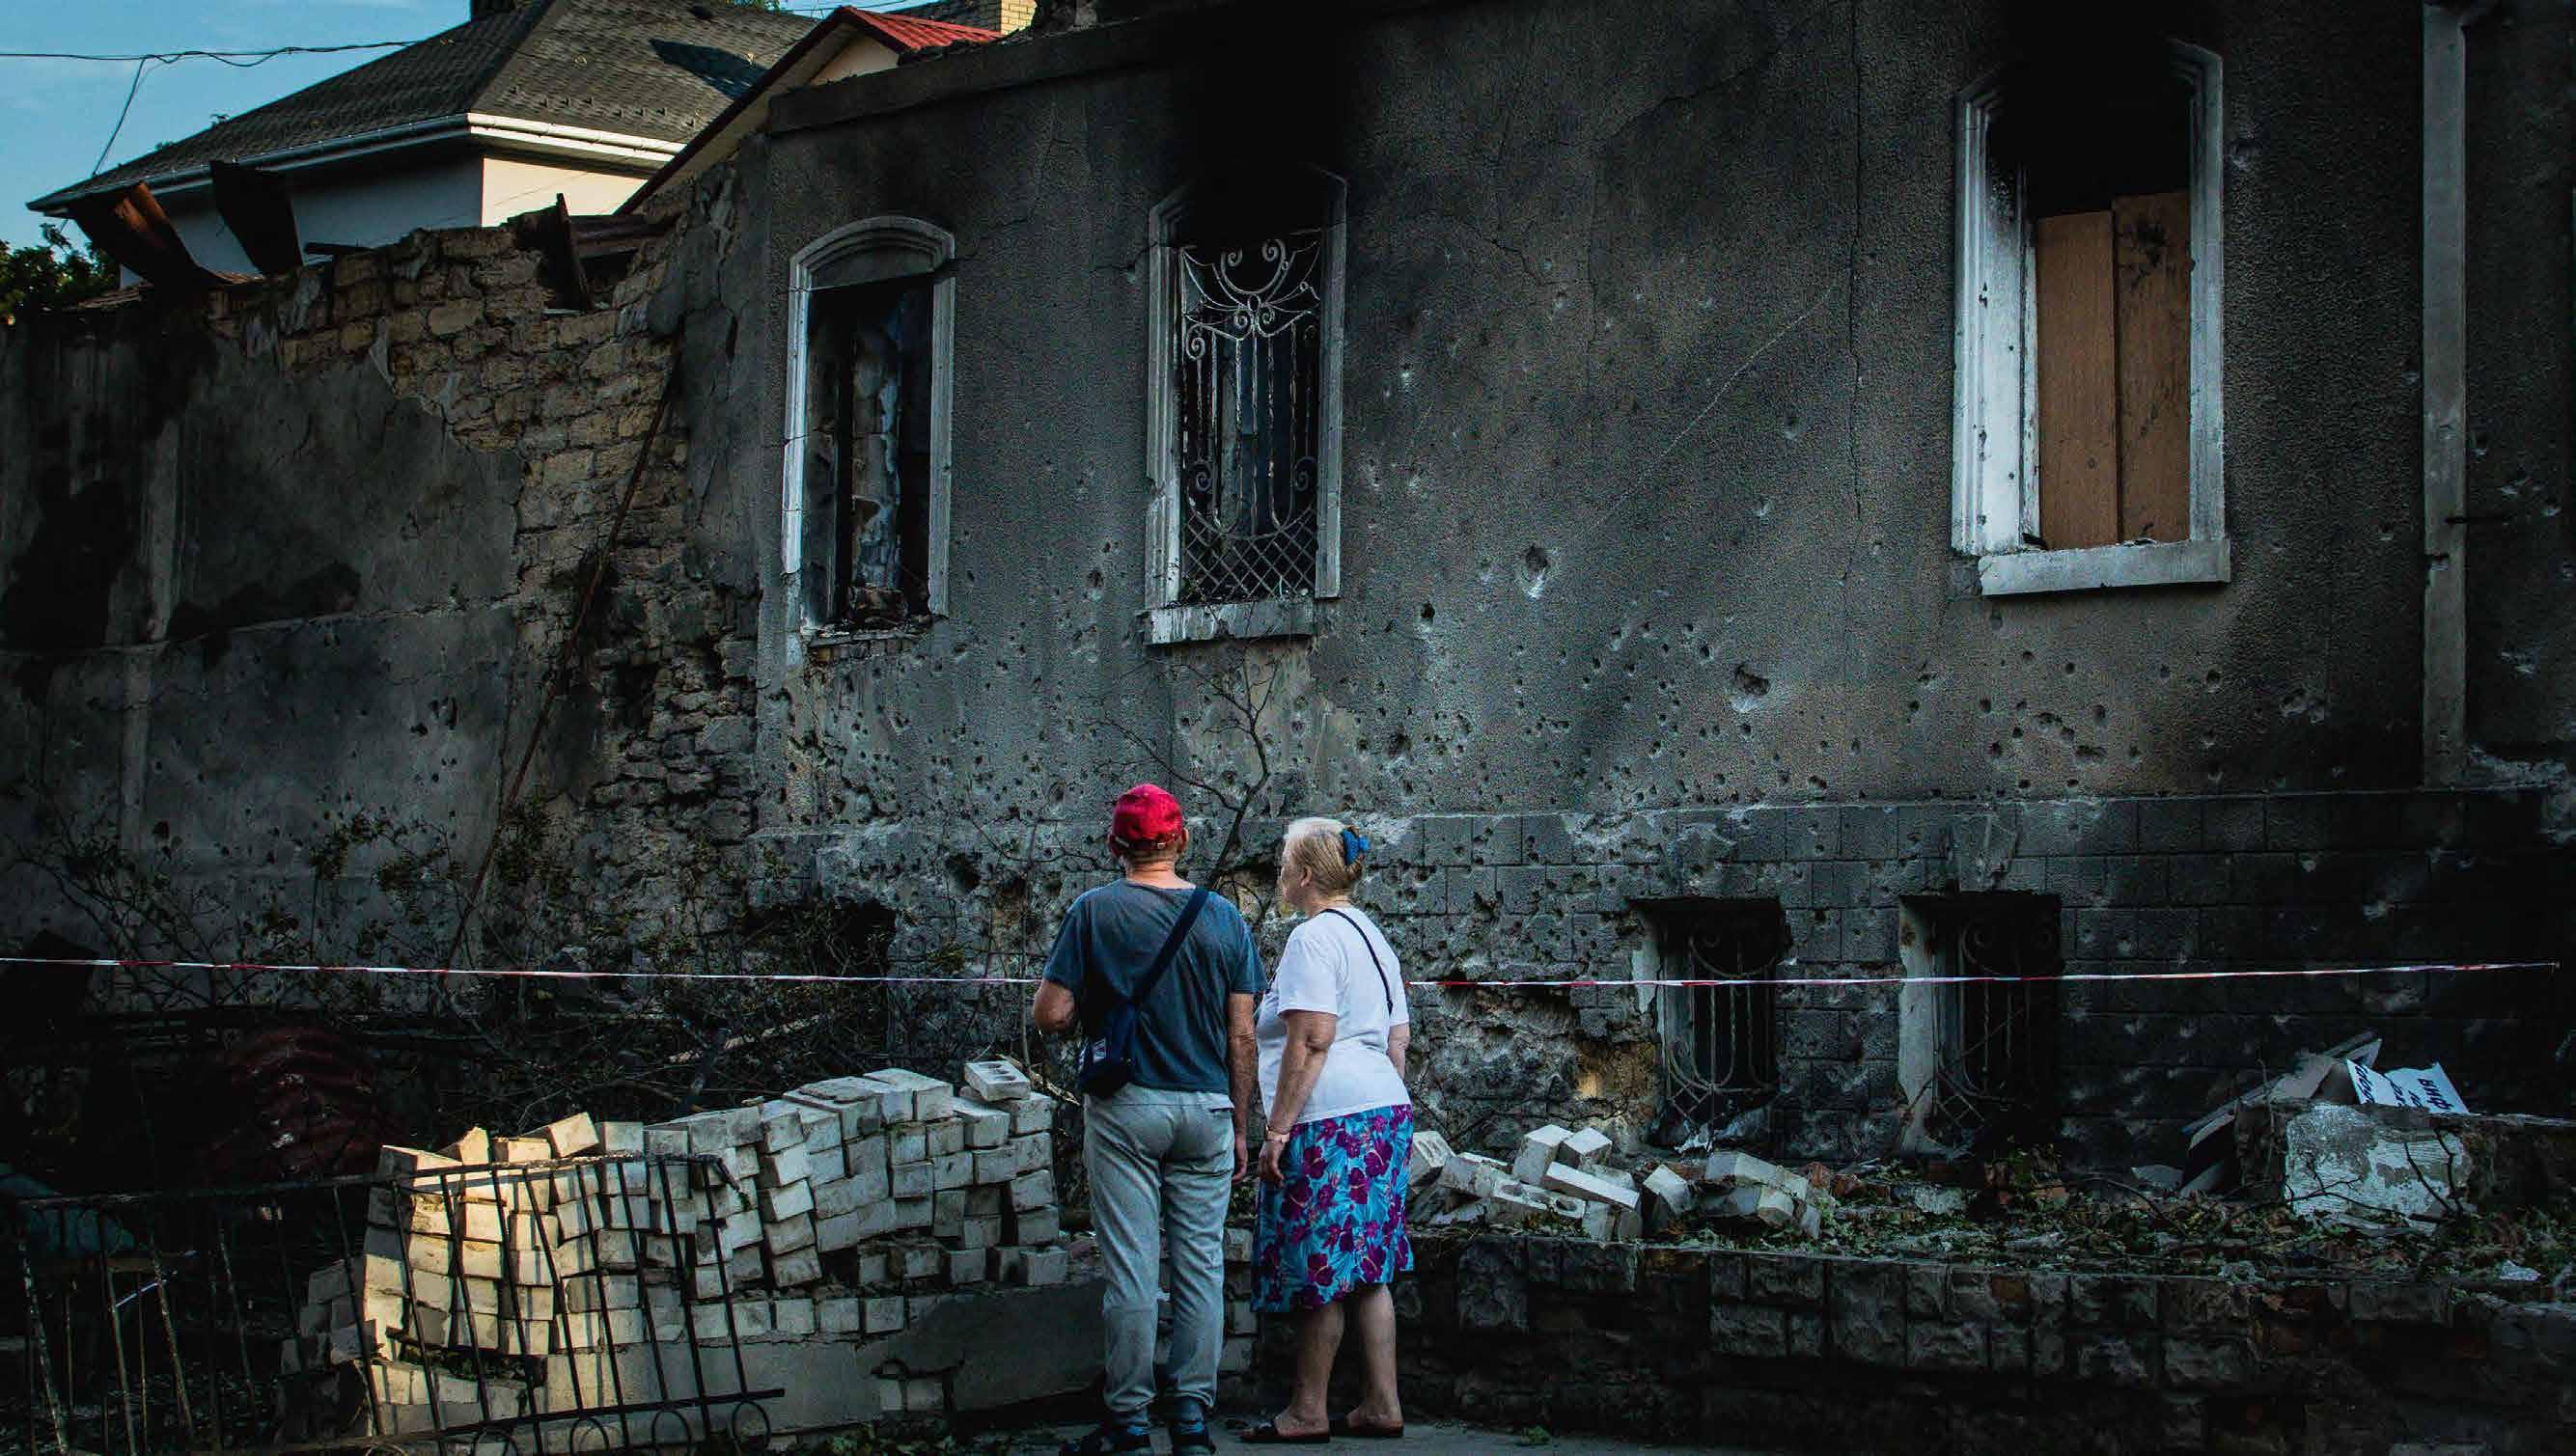
Photo: Svitlana Vovk
Monuments and Cultural heritage
The damage points database received did not include a specific category for monuments. However, considering the significant historical value of some buildings and installations, it became crucial to assess whether they had incurred any damage and to what extent.
On the maps, monuments that may have suffered damage are identified within buffers of either 50 or 100 meters from recorded category II or III damage points. Three monuments were found within a 50-meter radius of damage points, all situated in the Tsentral'nyi district.
Monuments
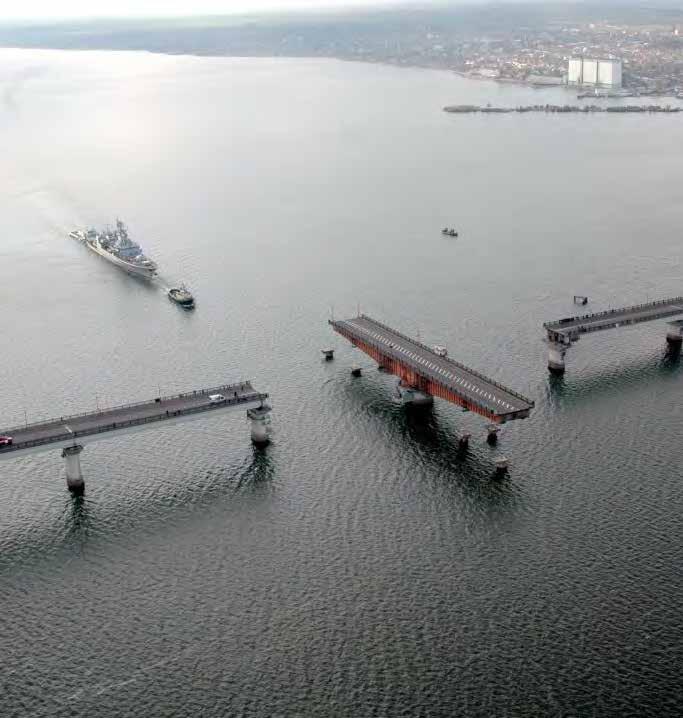
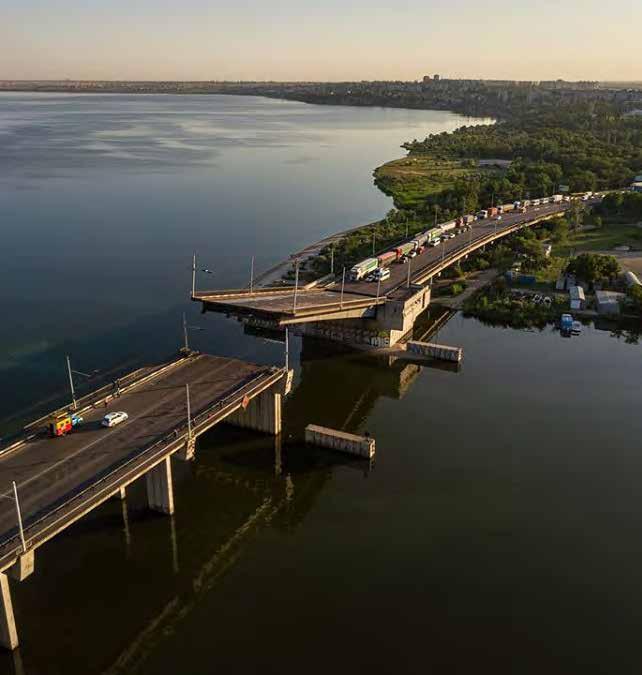
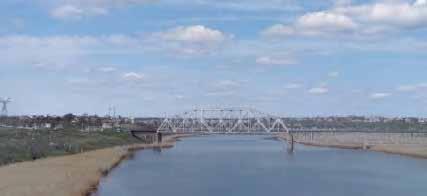
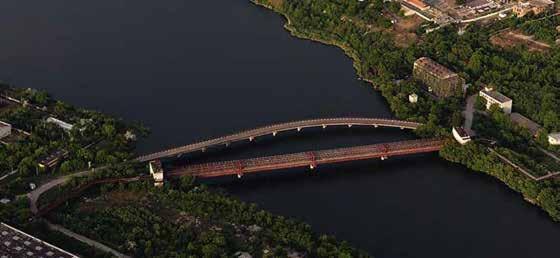
Infrastructure and utilities
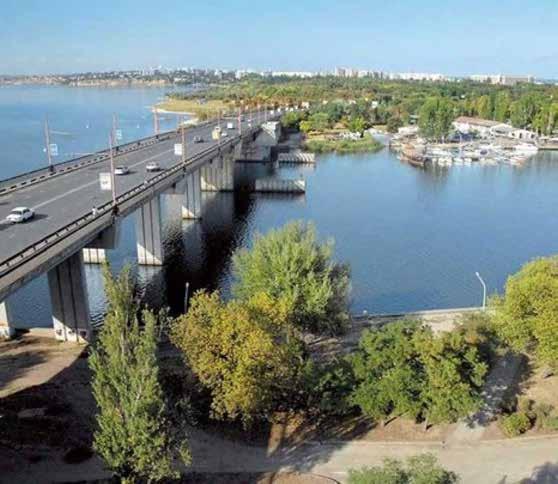
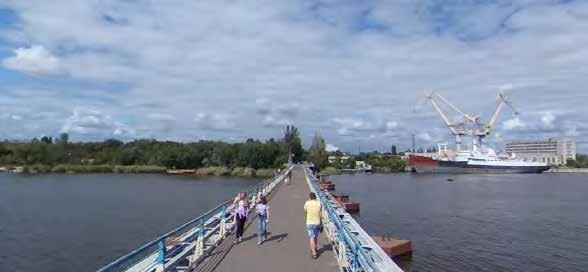
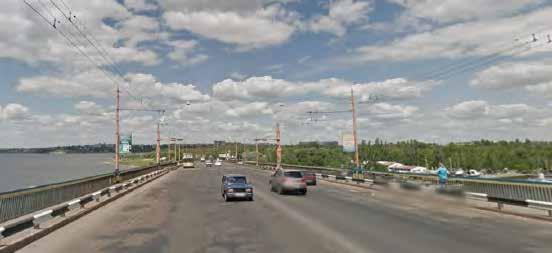
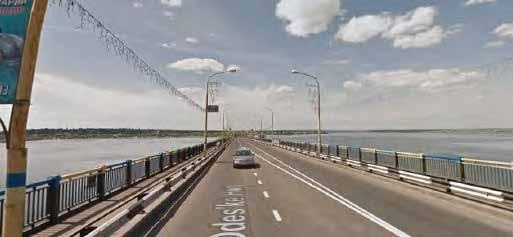
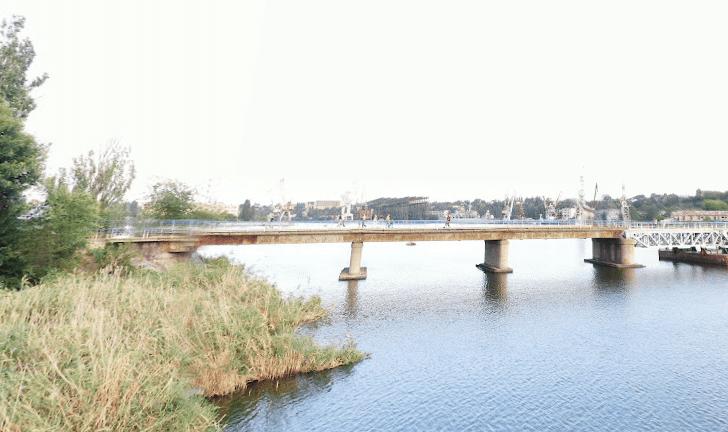
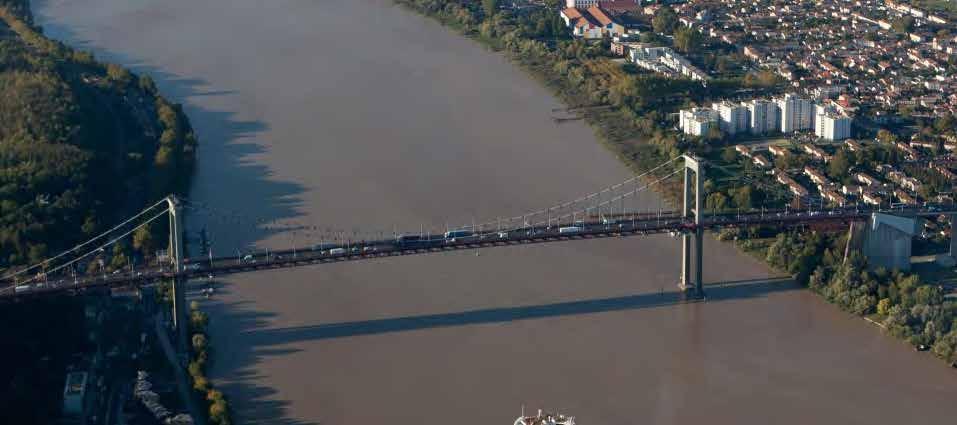
Within the database provided by the Municipality, damage detection was primarily associated with buildings. Out of the total 3,109 damage points recorded, only two were related to infrastructure damage. Both instances pertained to bridges in the Tsentral'nyi district, specifically the Varvarivs'kyy bridge and the Inhul's'kyy bridge. It's worth noting that these infrastructure remain fully operational, exhibiting only category I damage.
Varvarivs'kyy Mist
Inhuls'kyy Mist
Photo by Ukrinform
Photo by Andrij Dronov
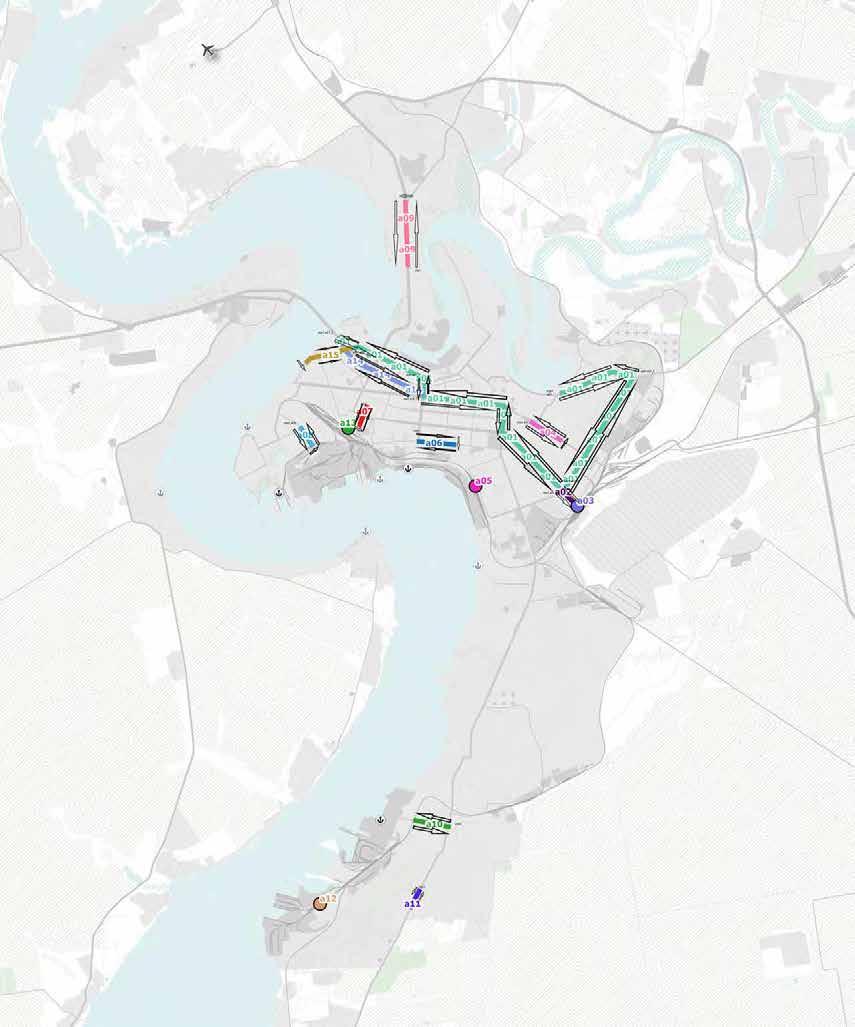
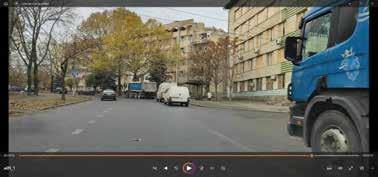
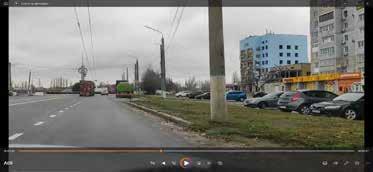
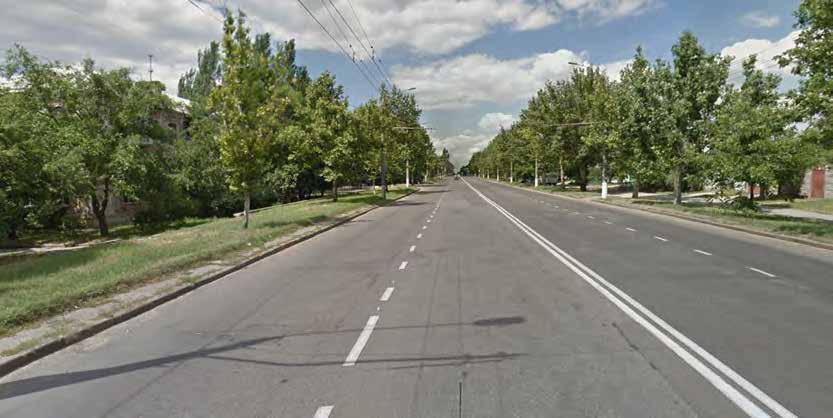
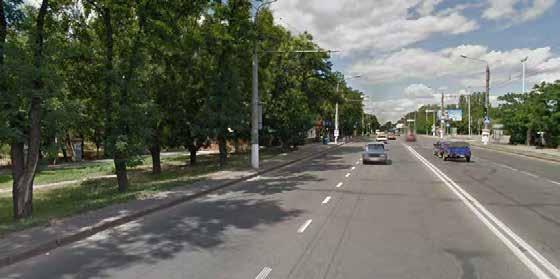
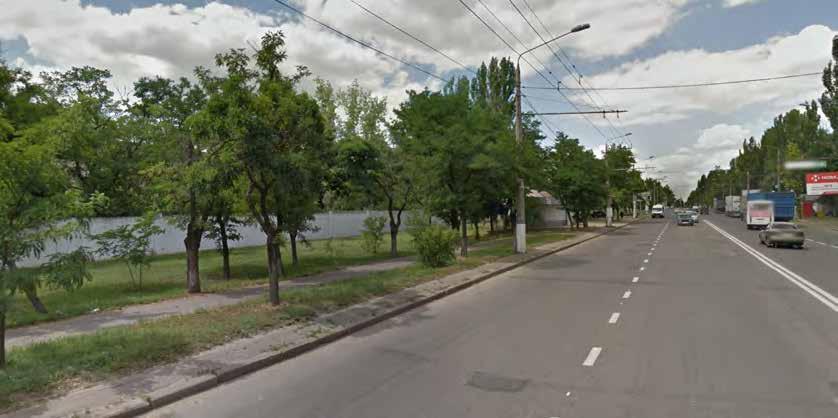
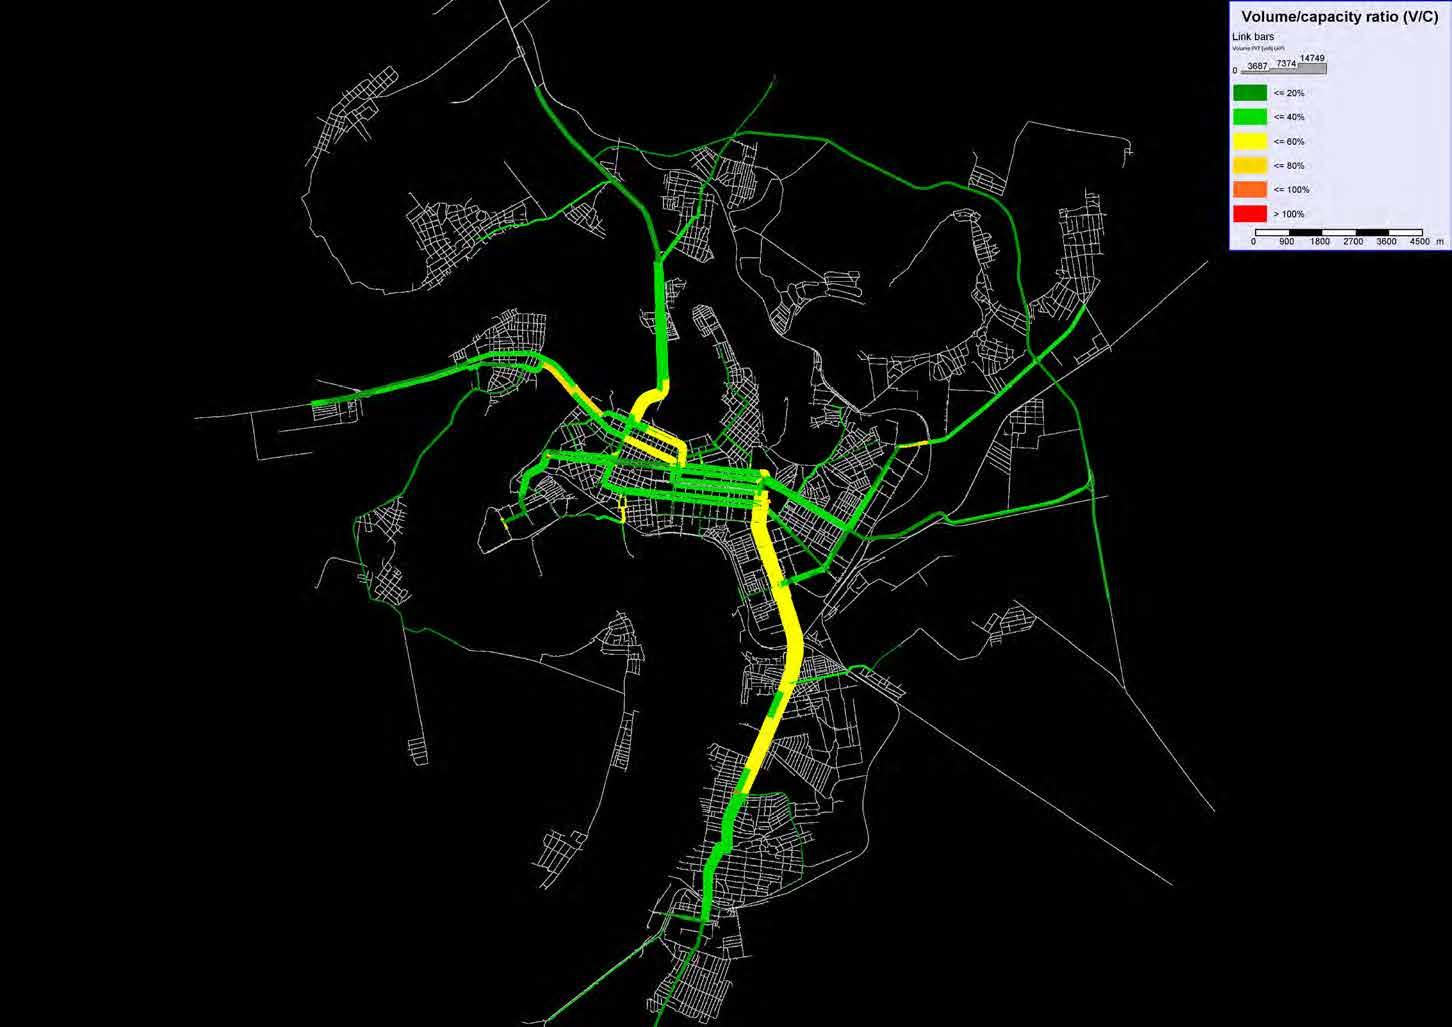
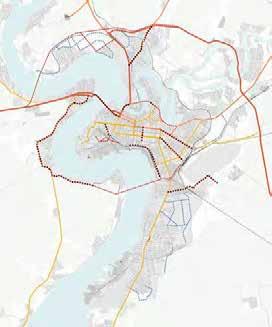
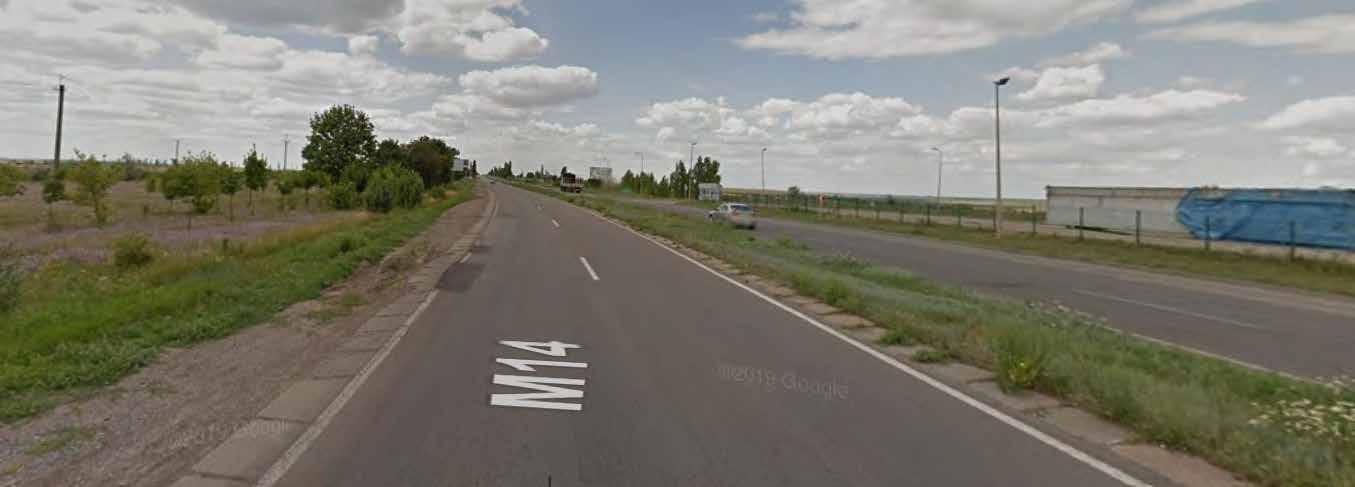
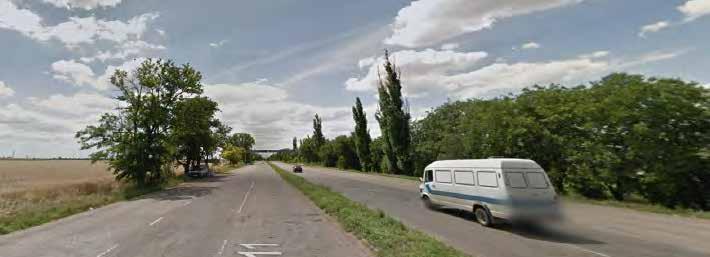
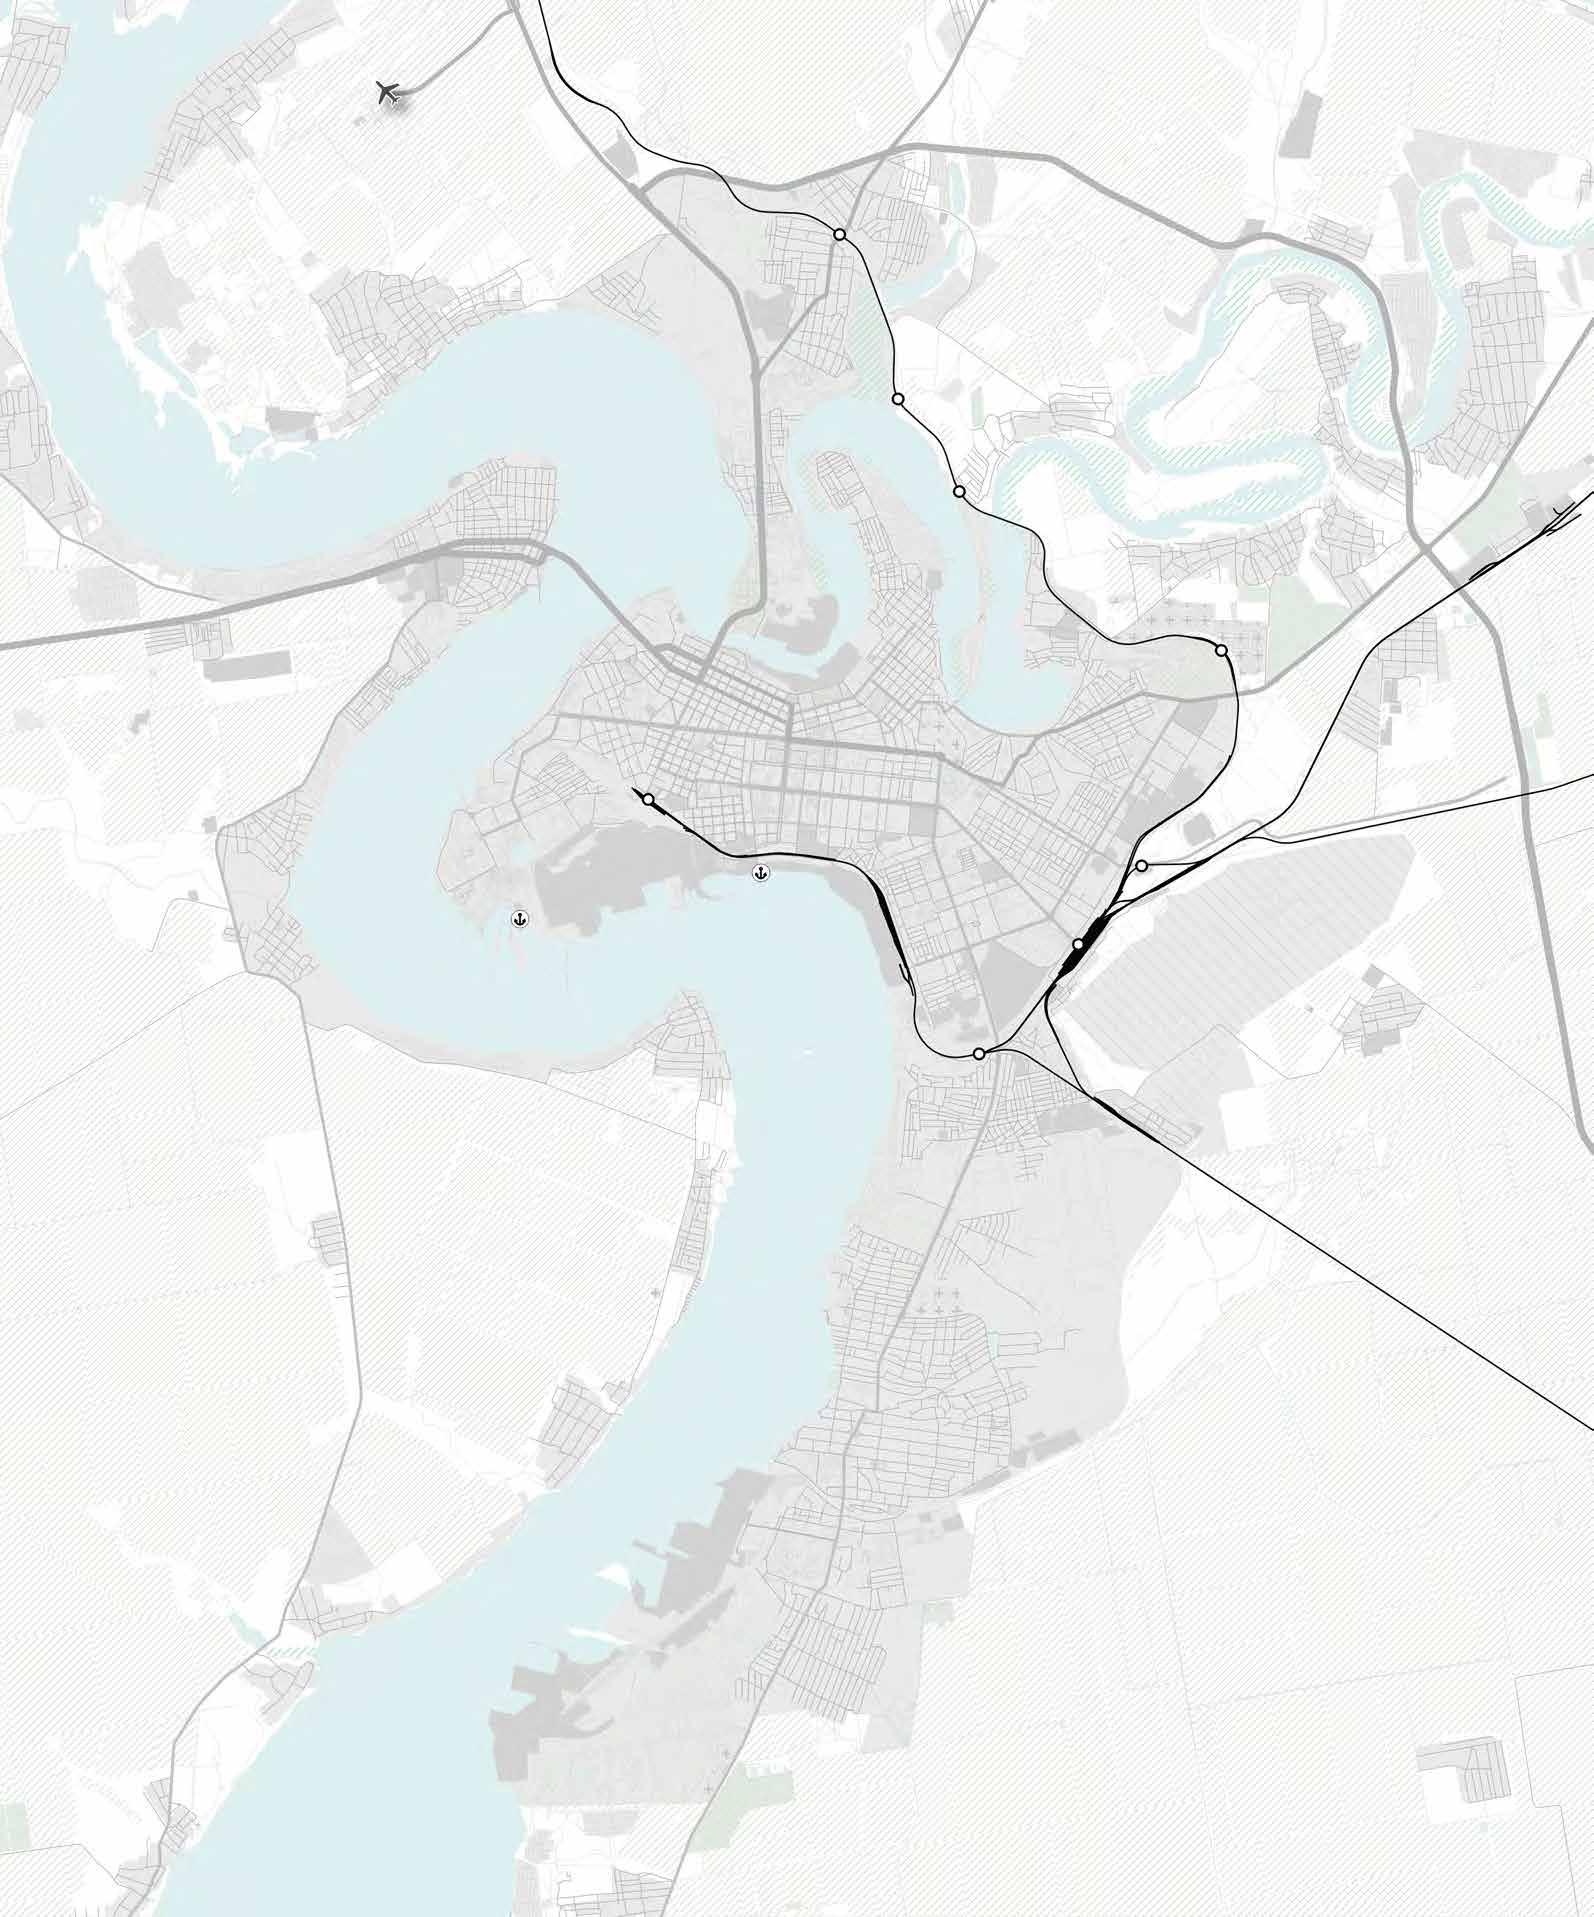
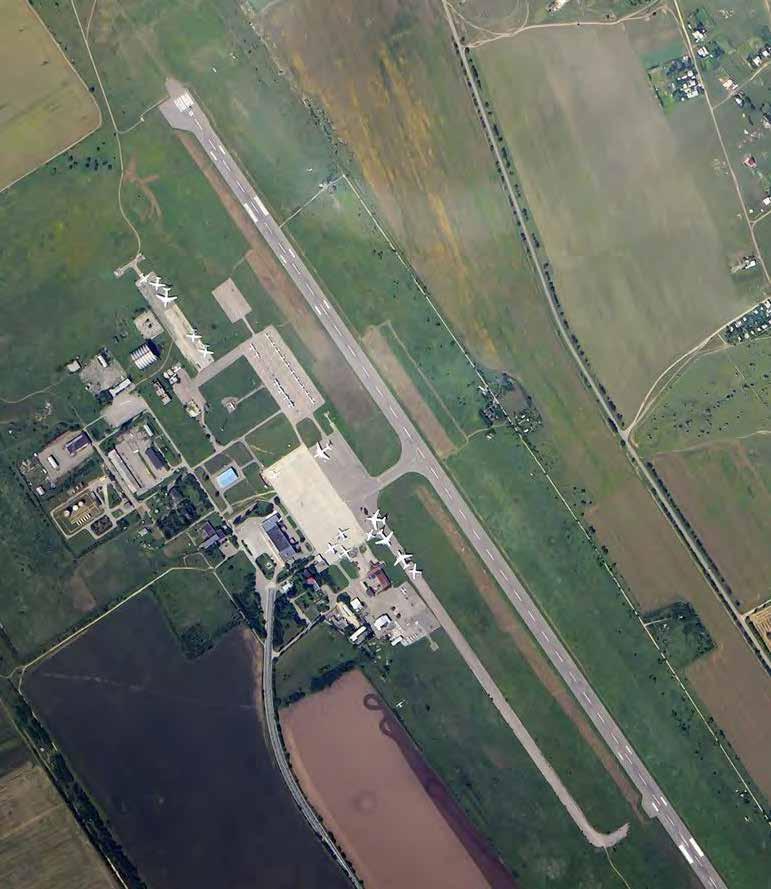
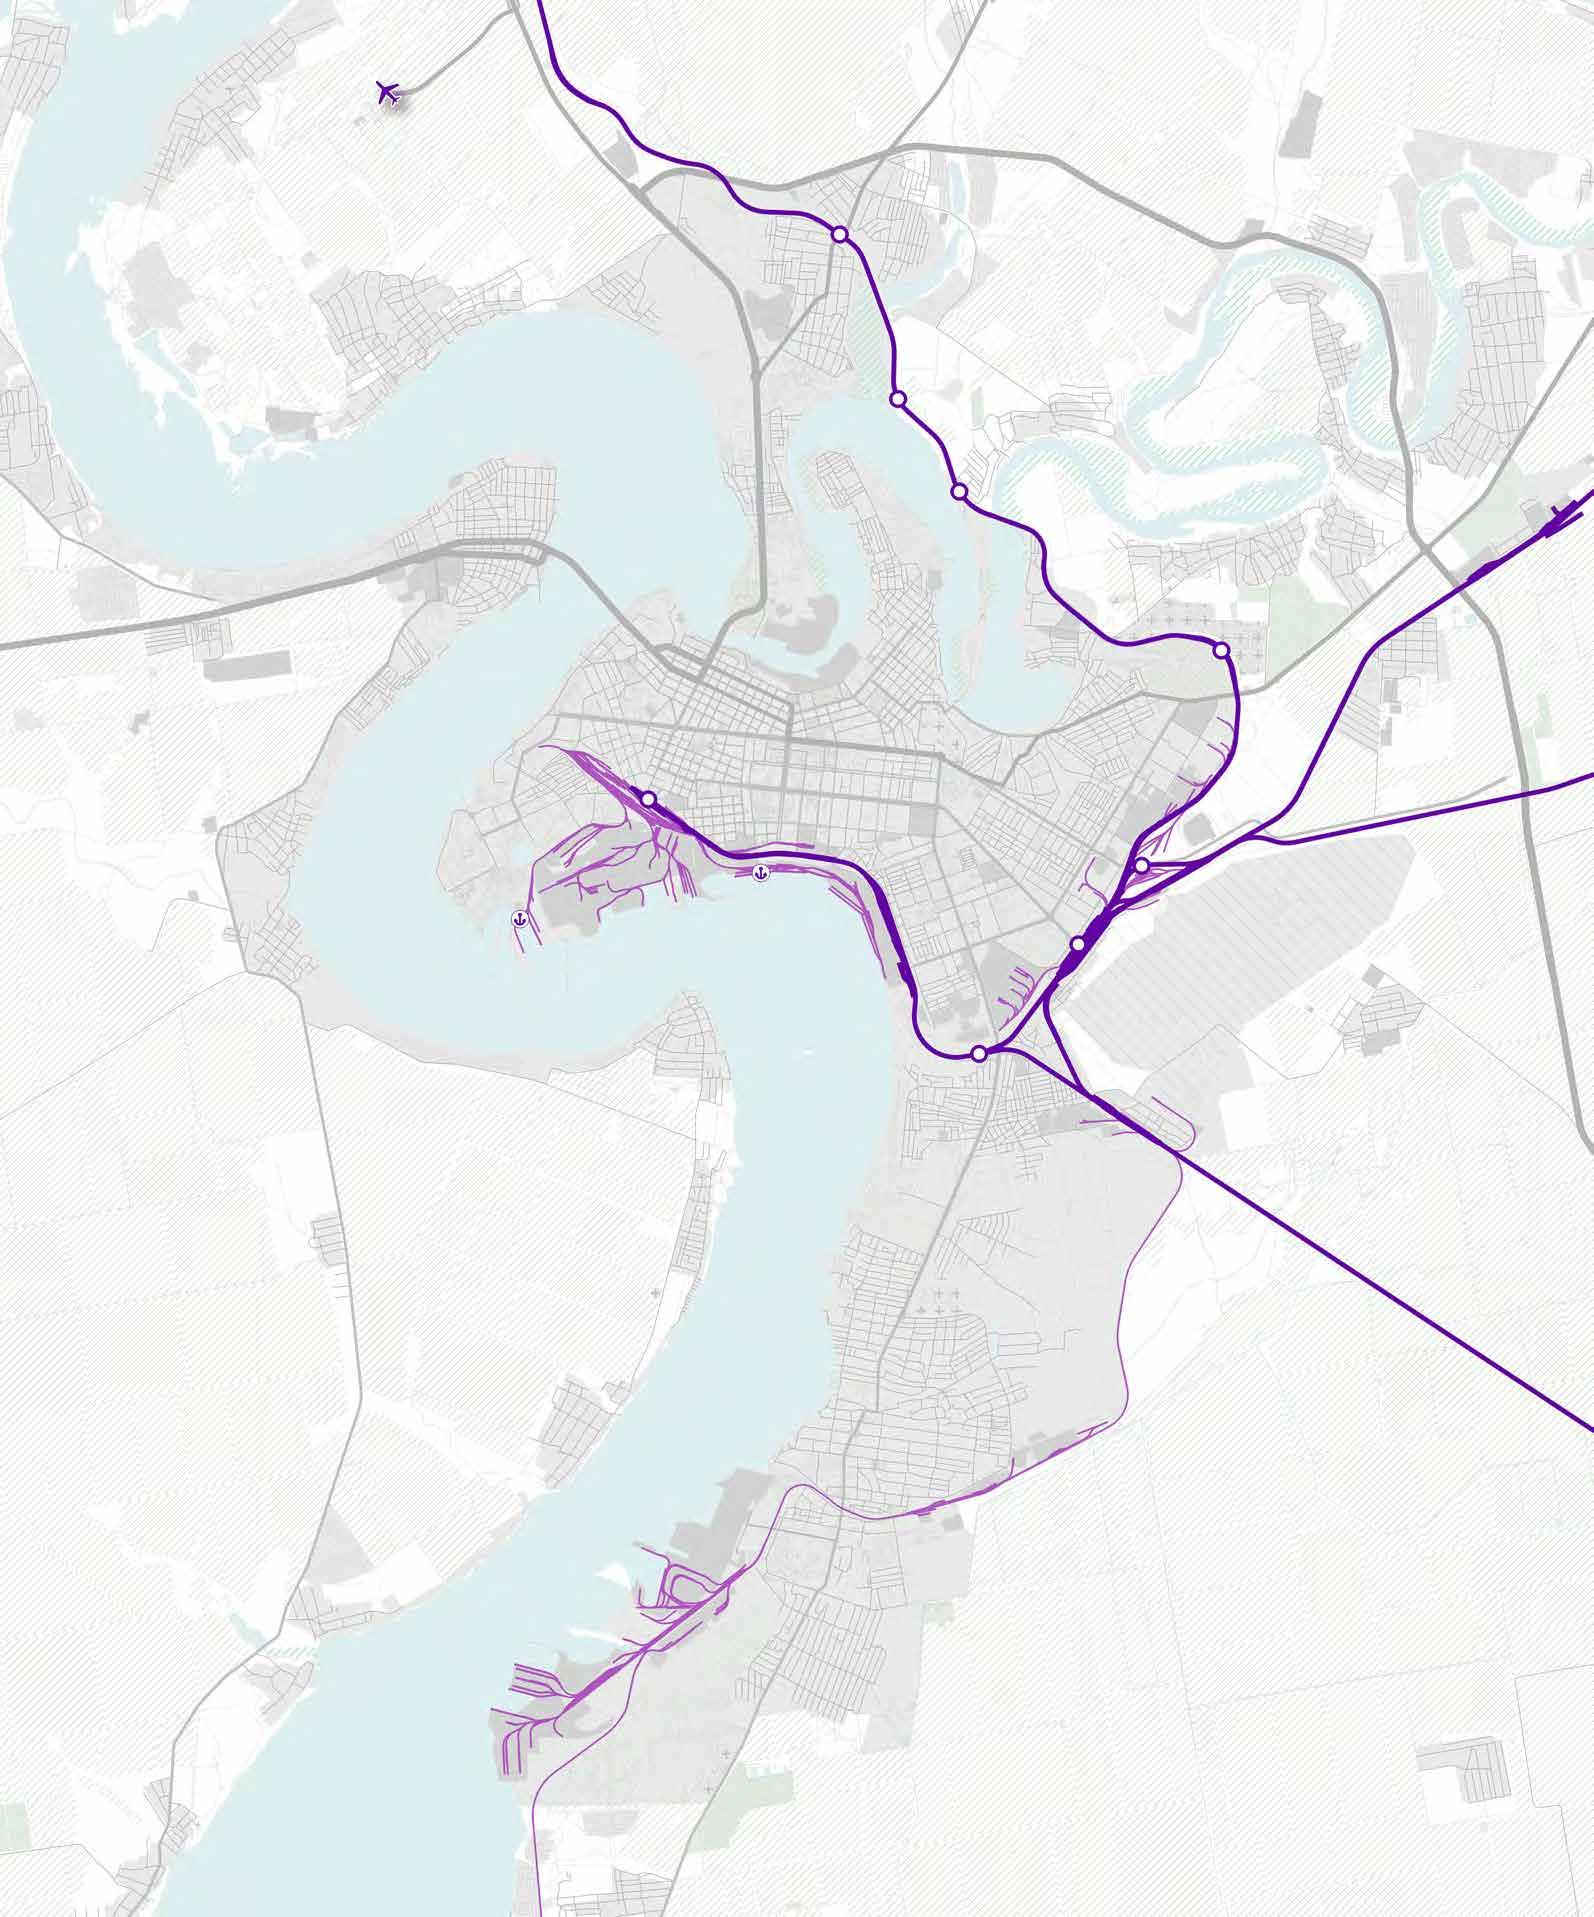
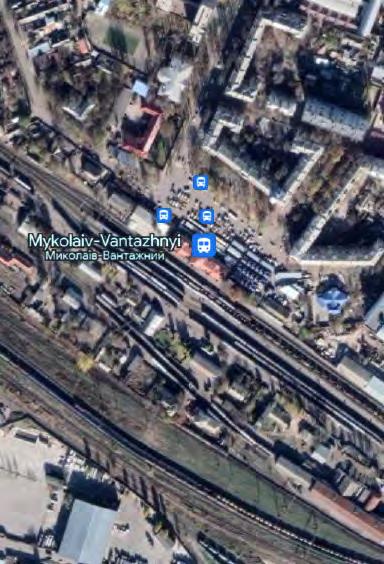
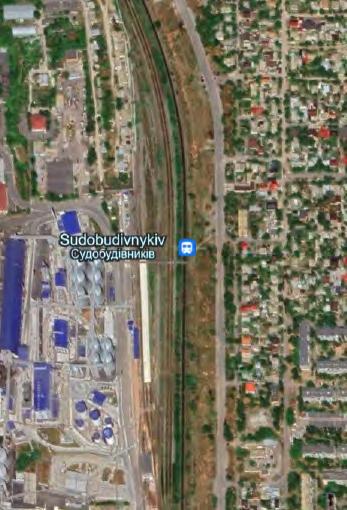
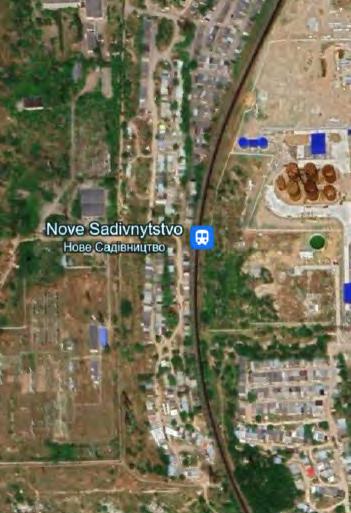
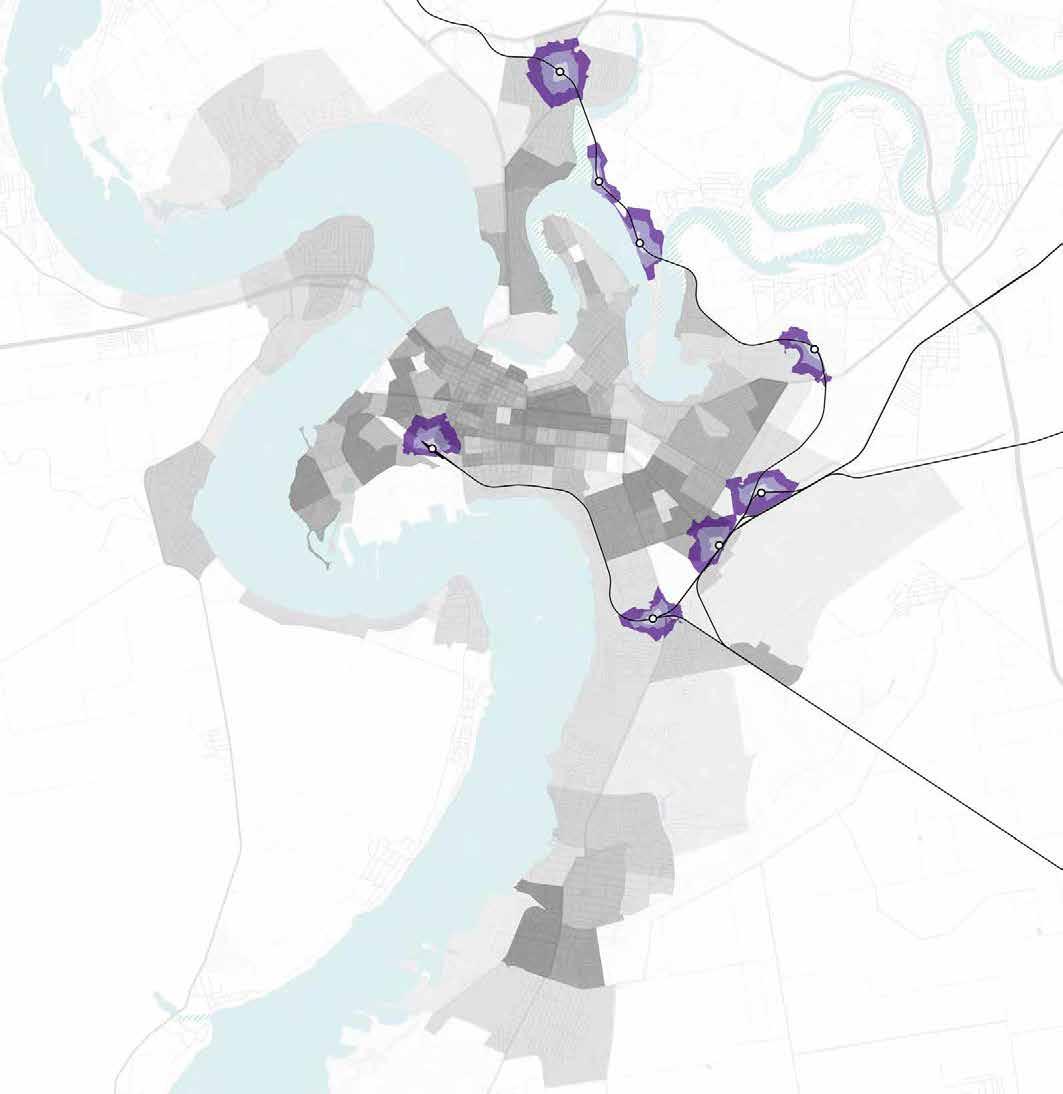
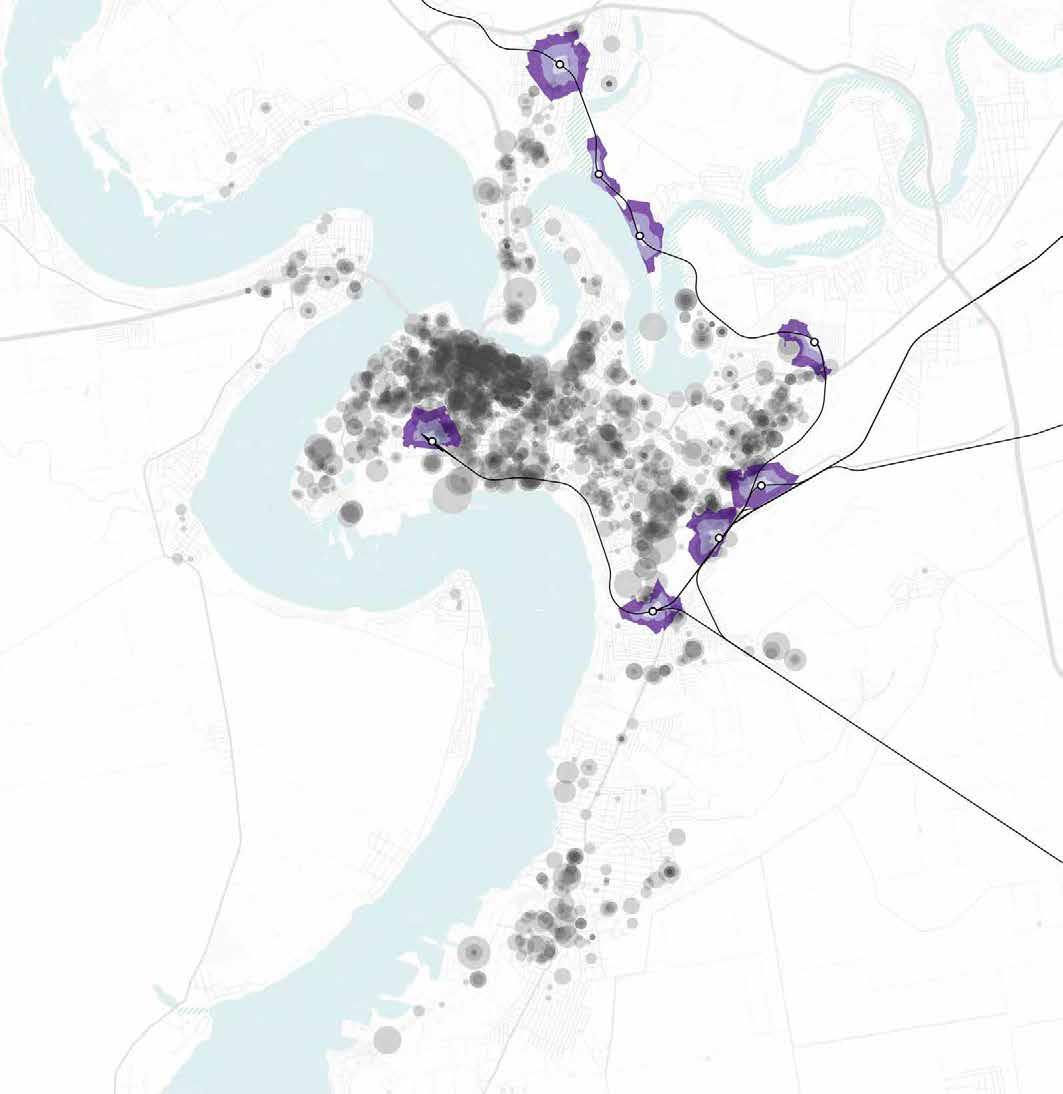
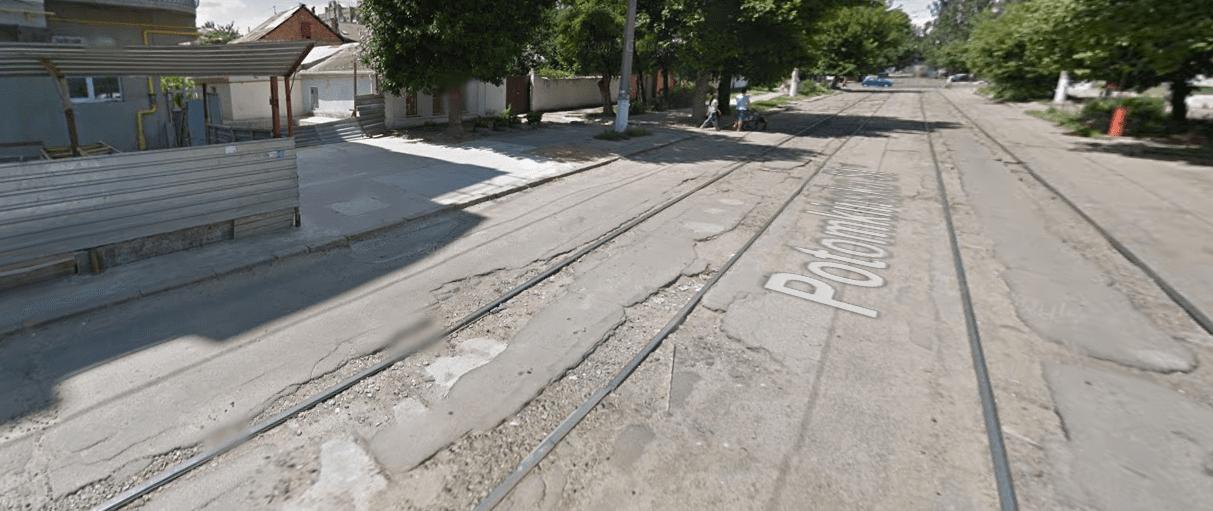
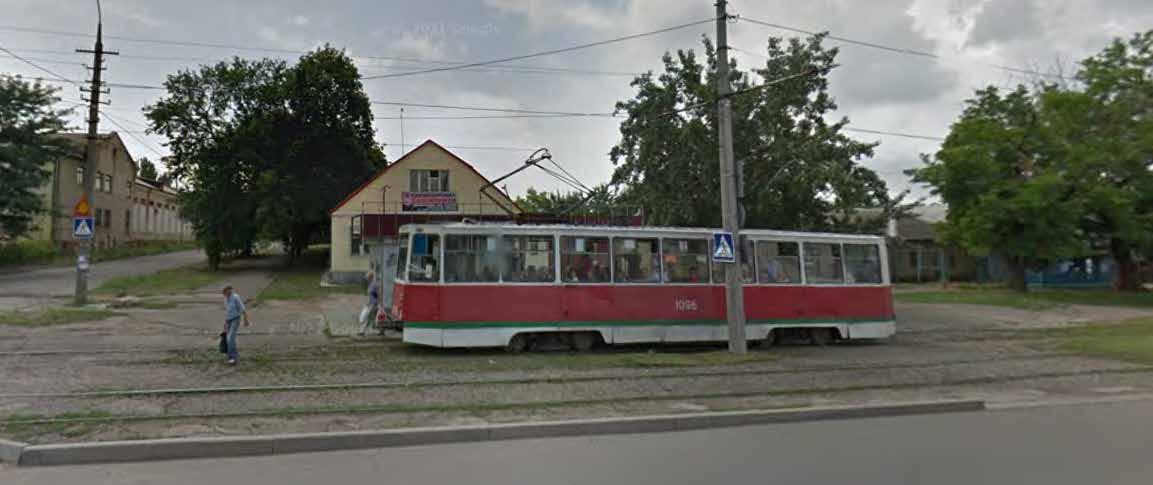
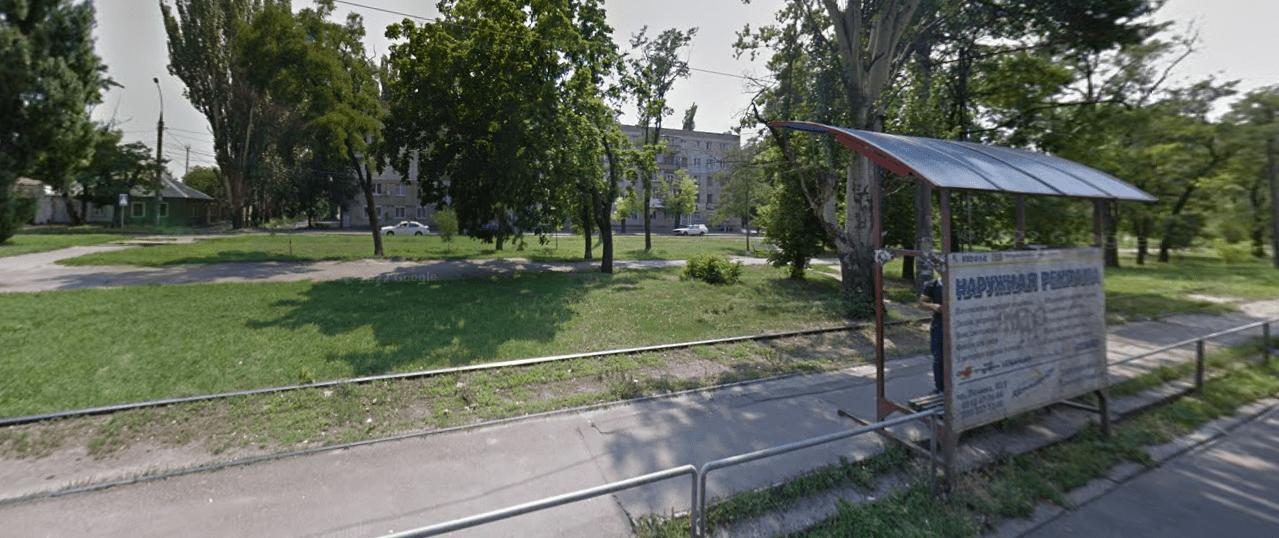
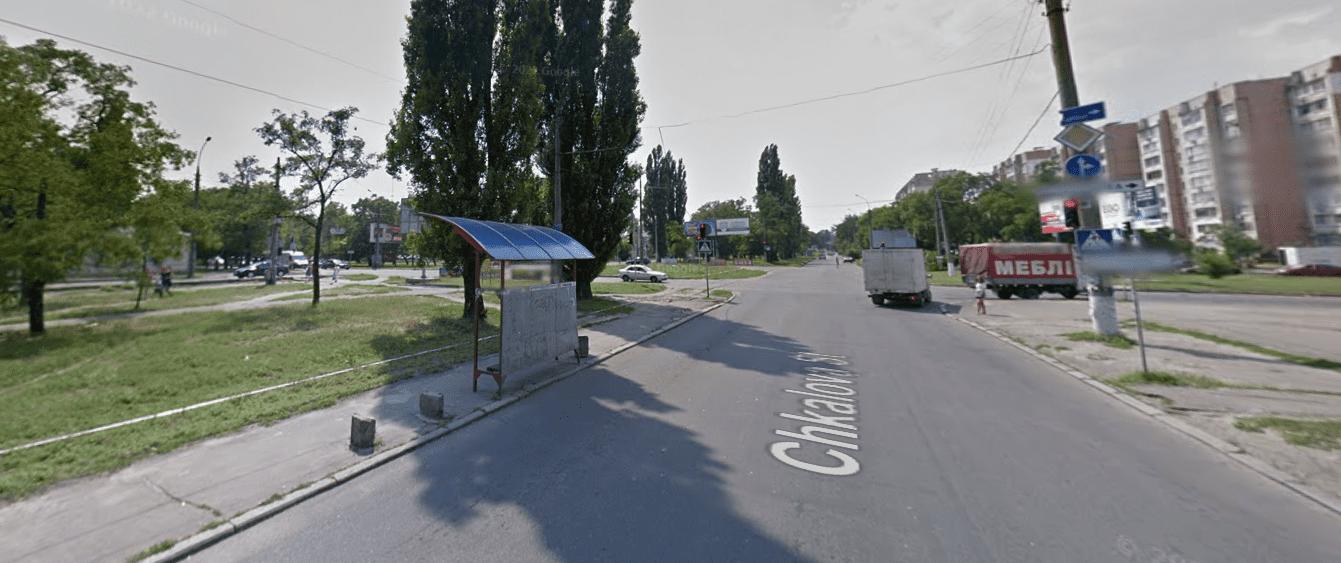
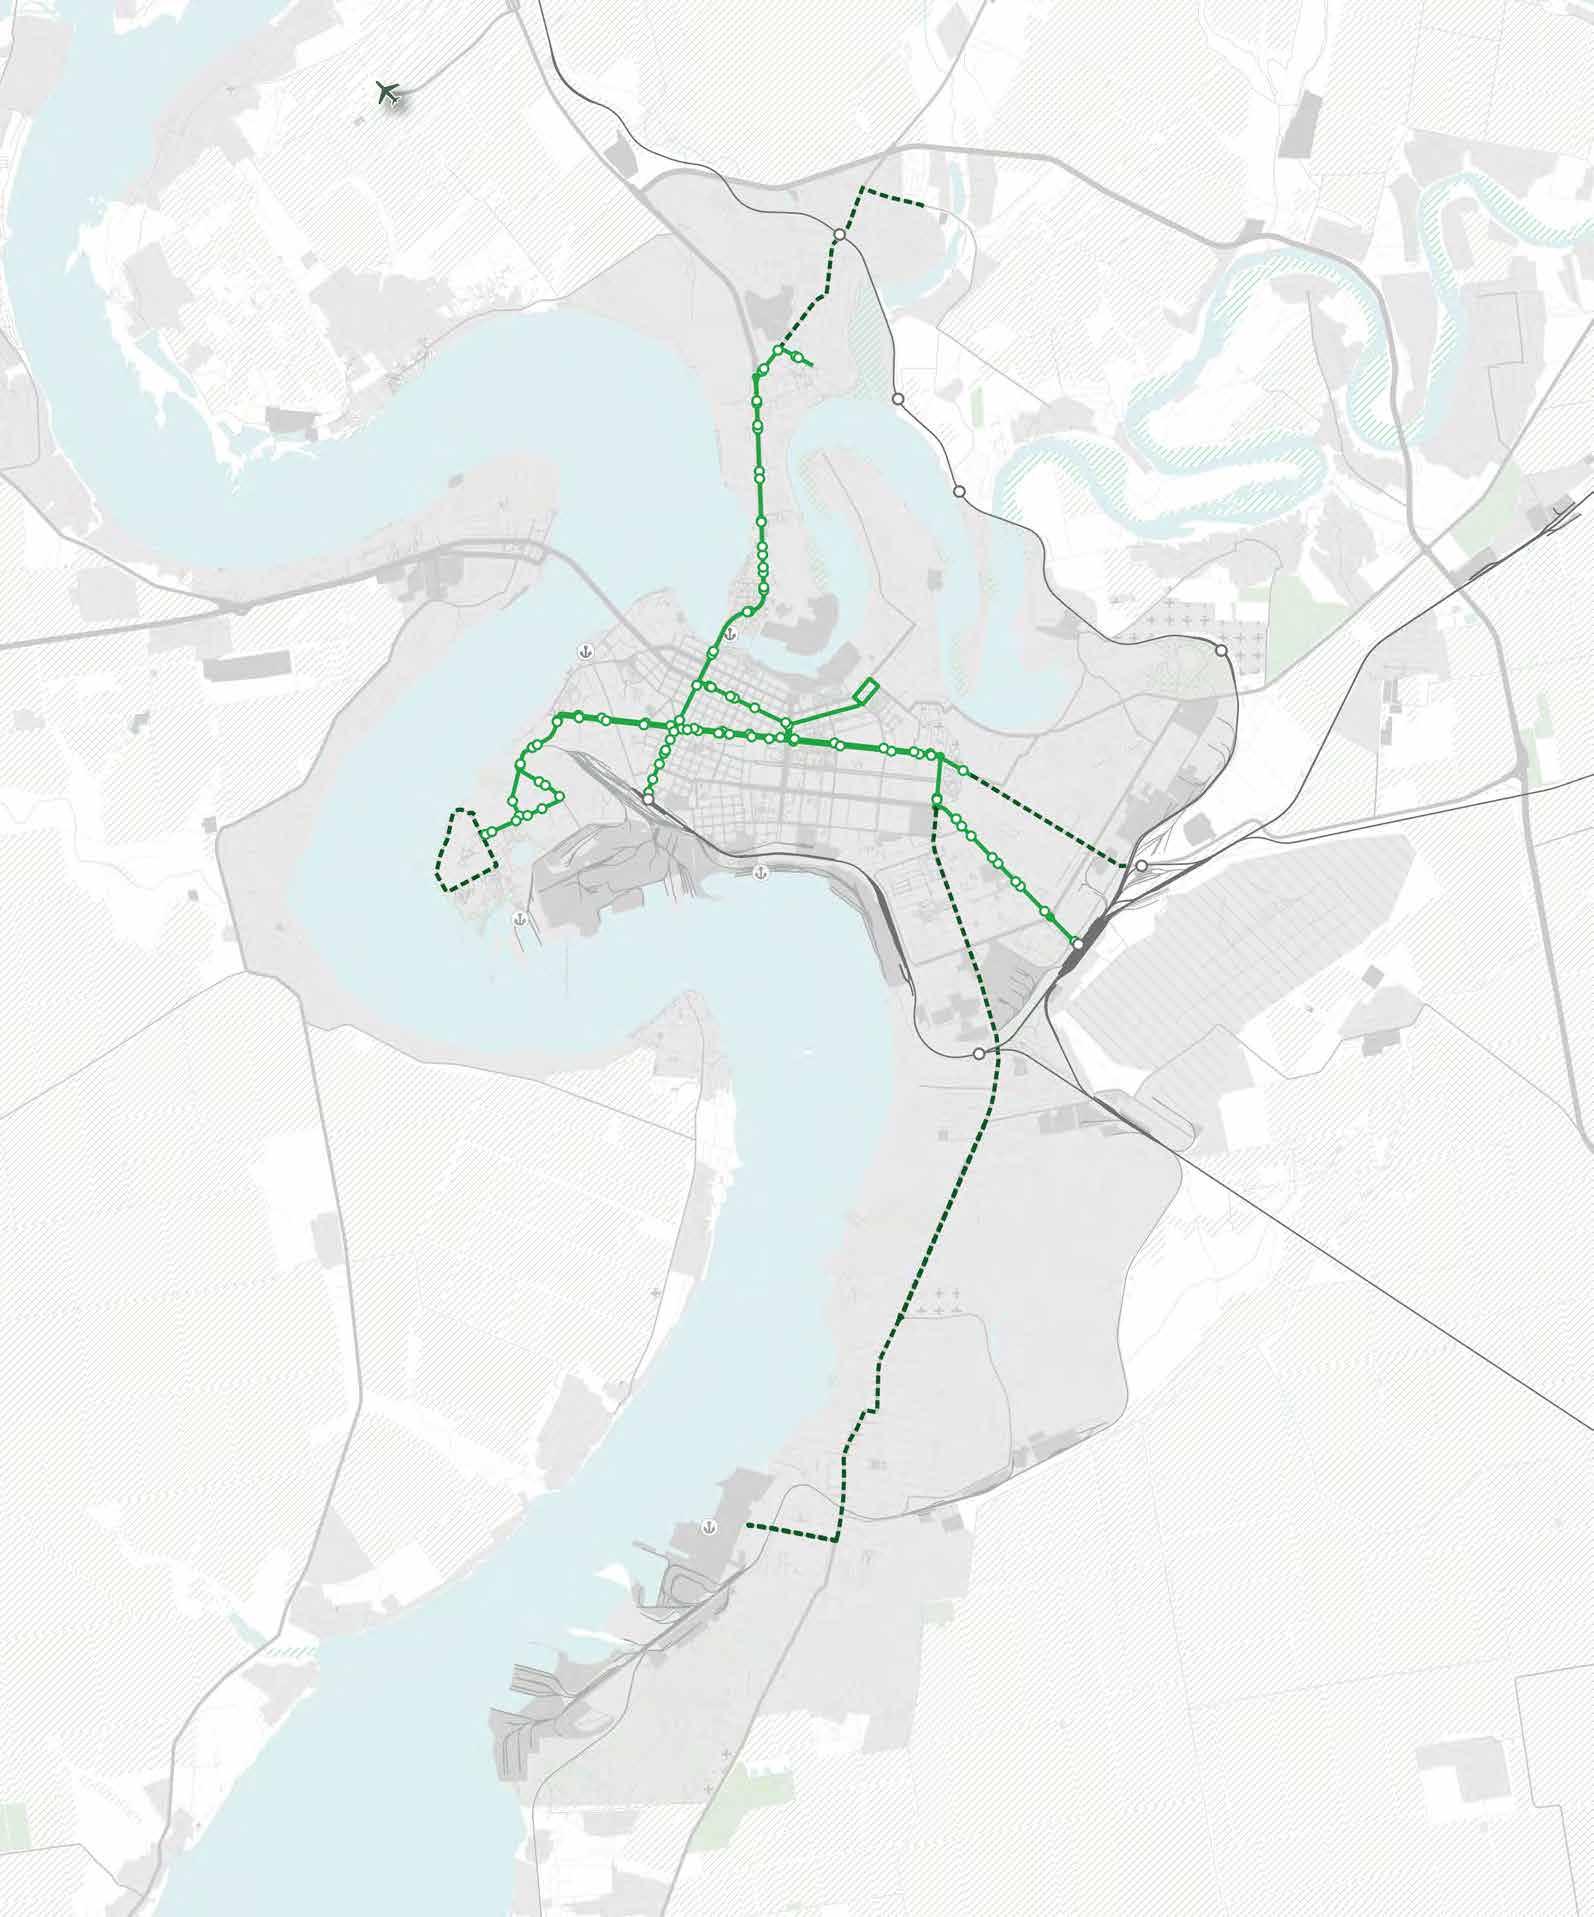
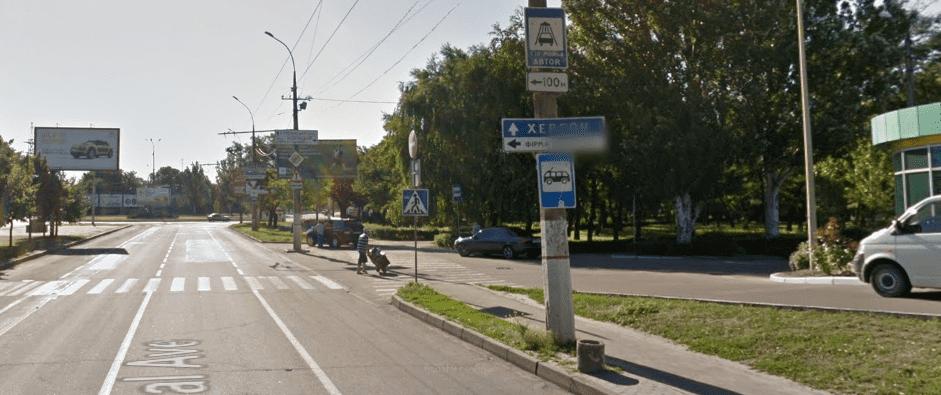
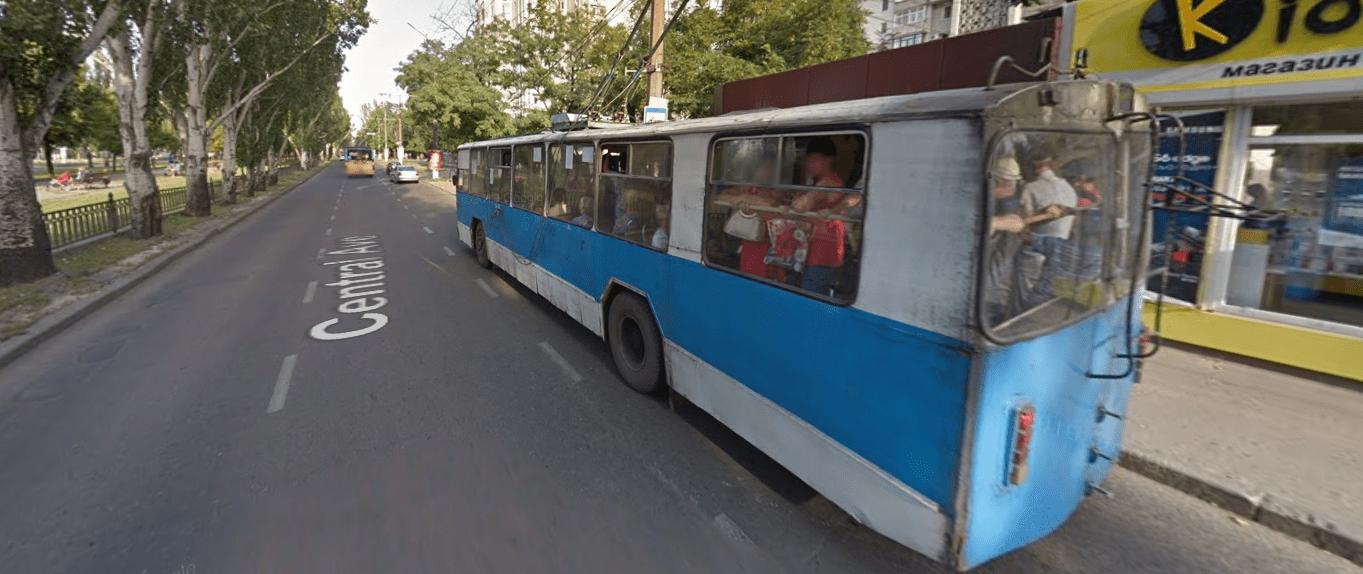
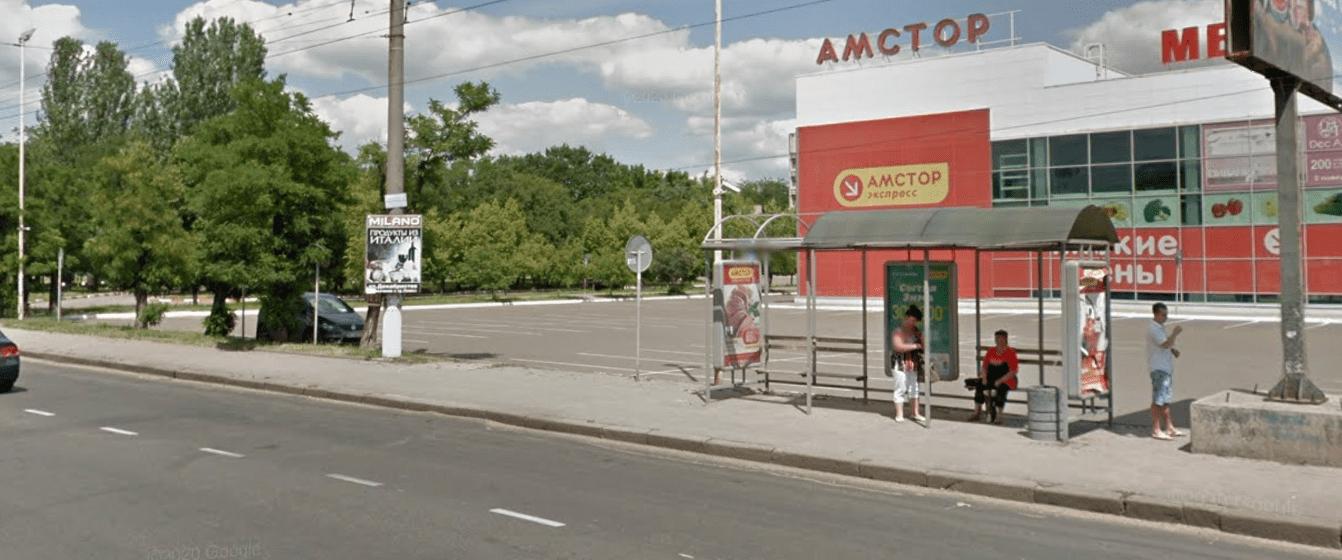
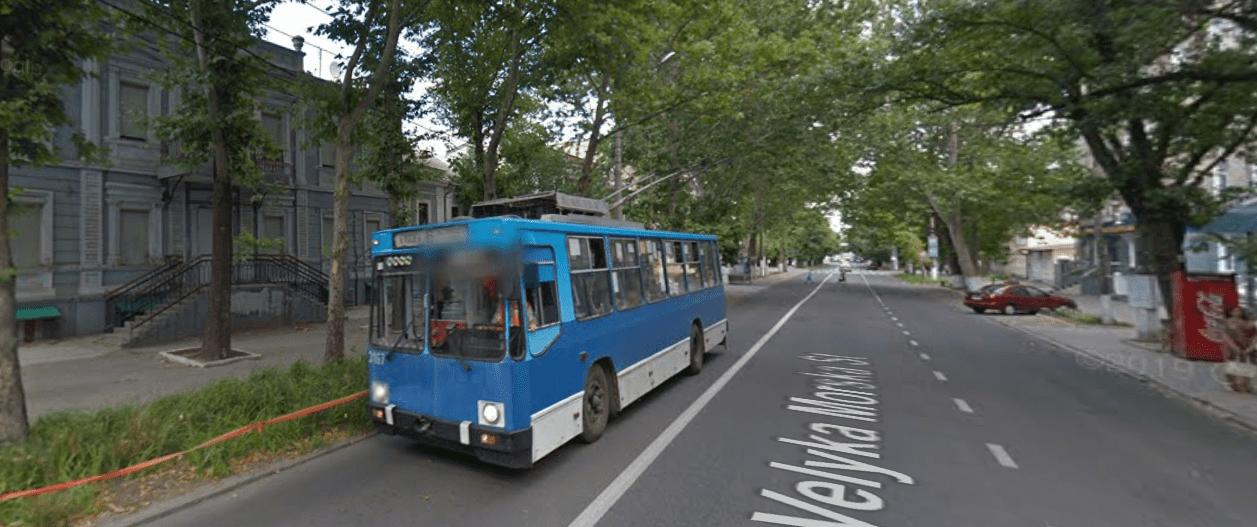
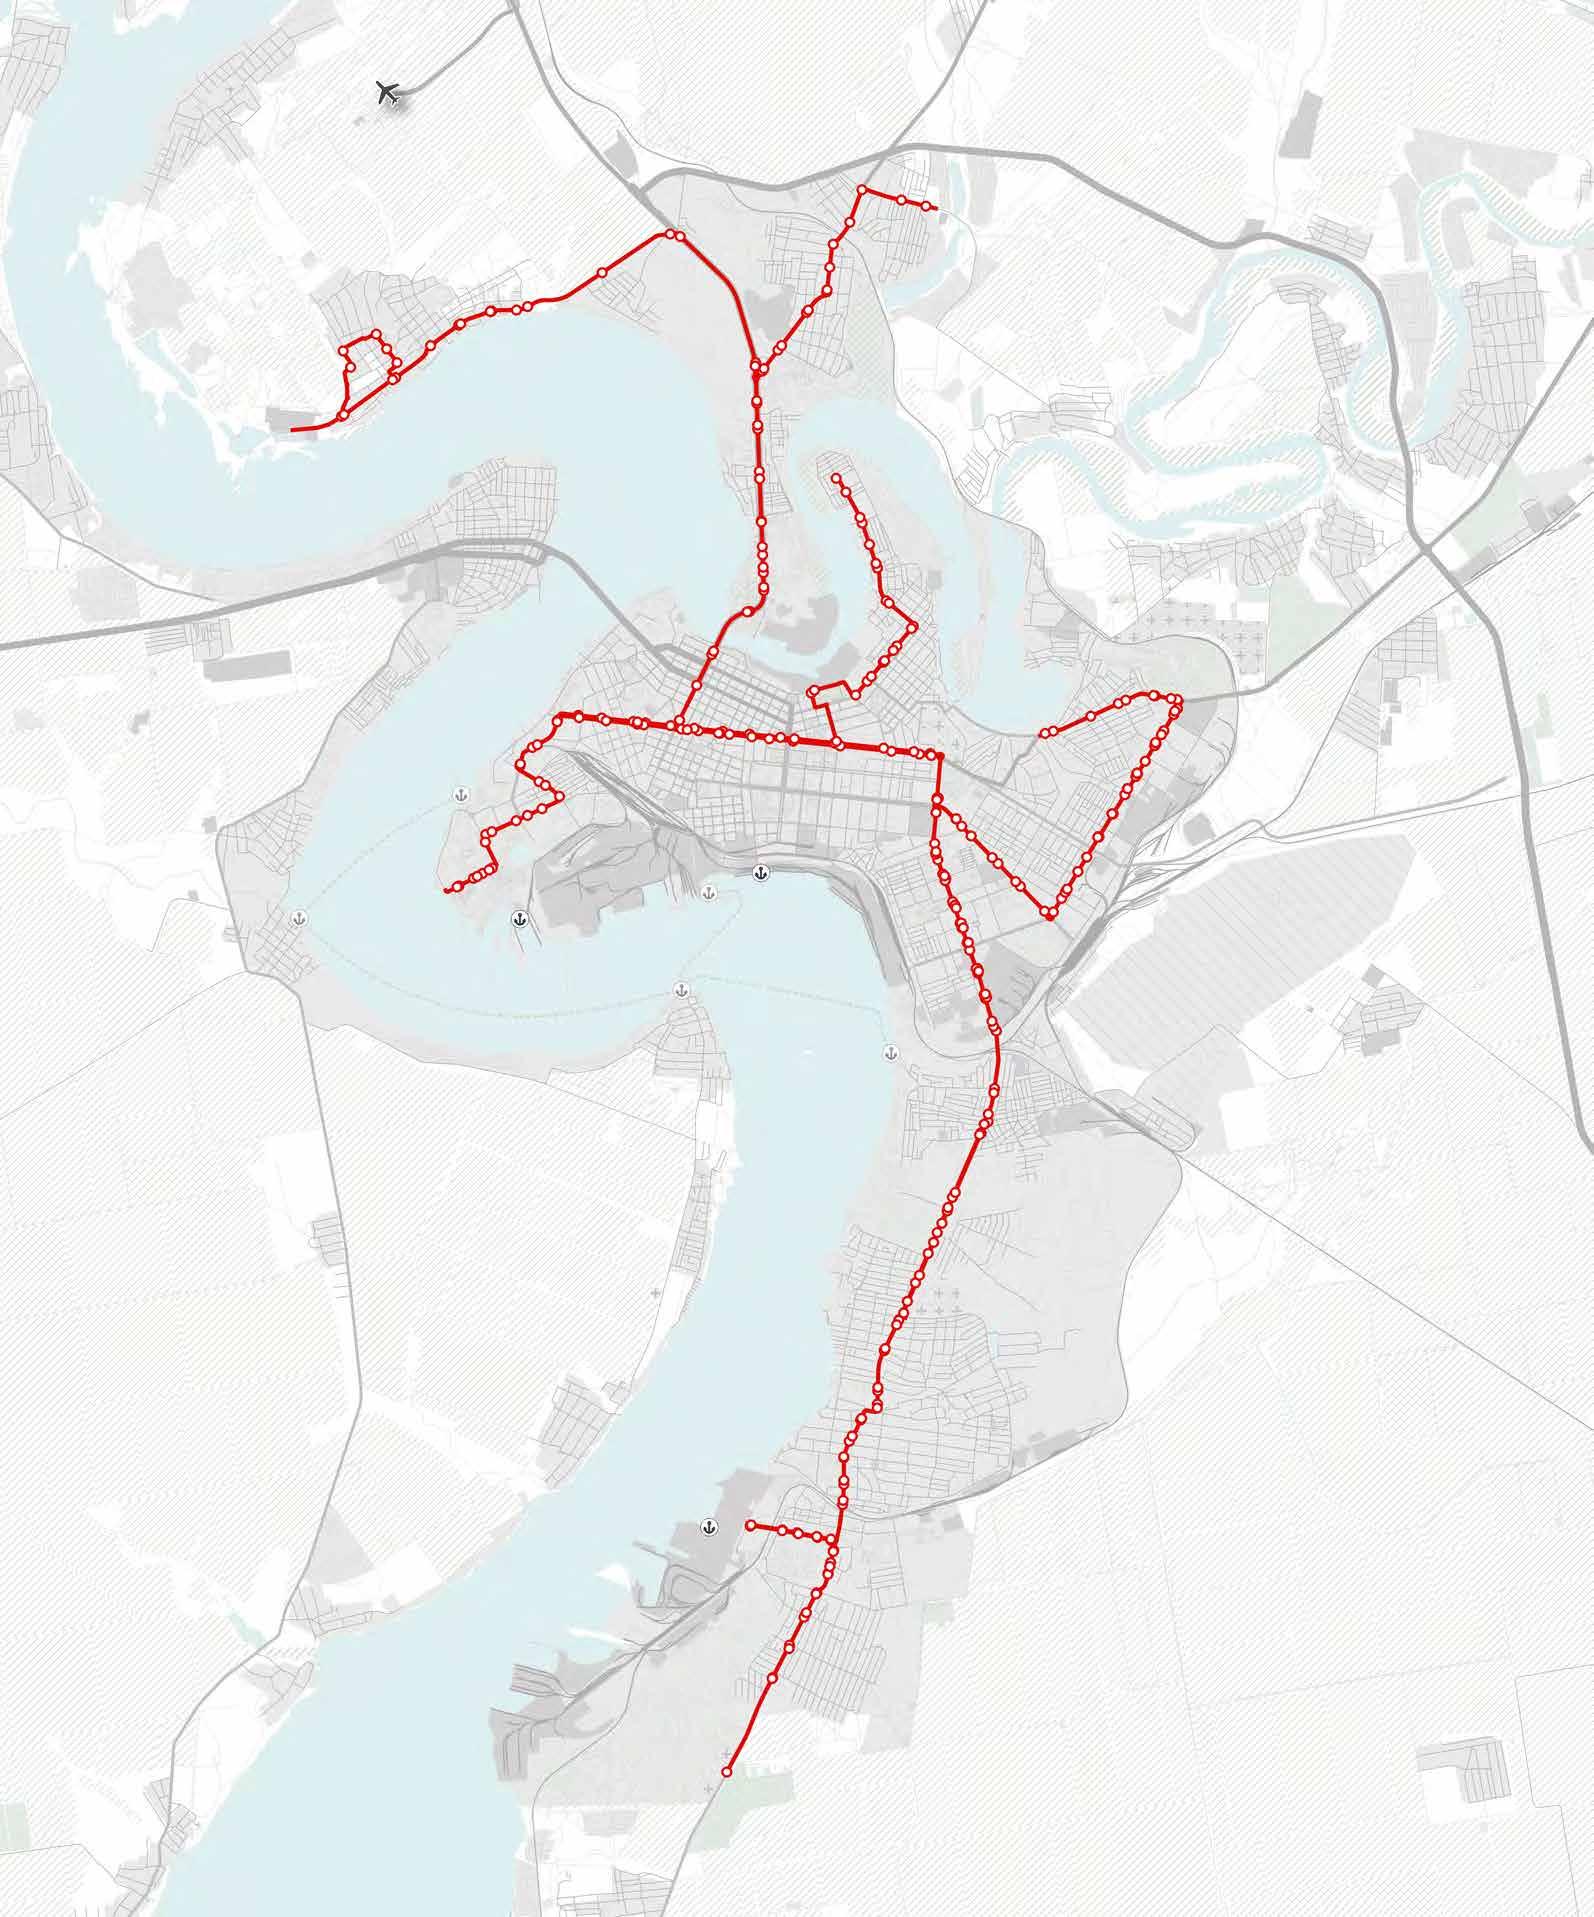
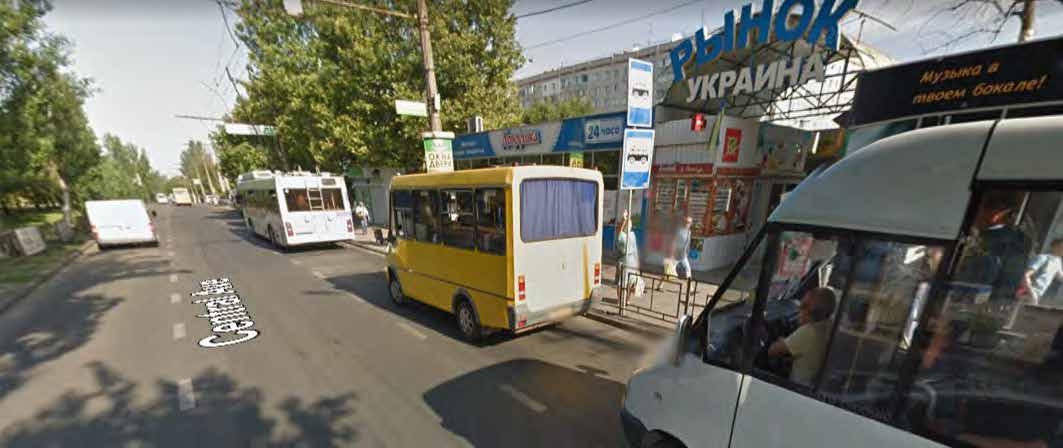
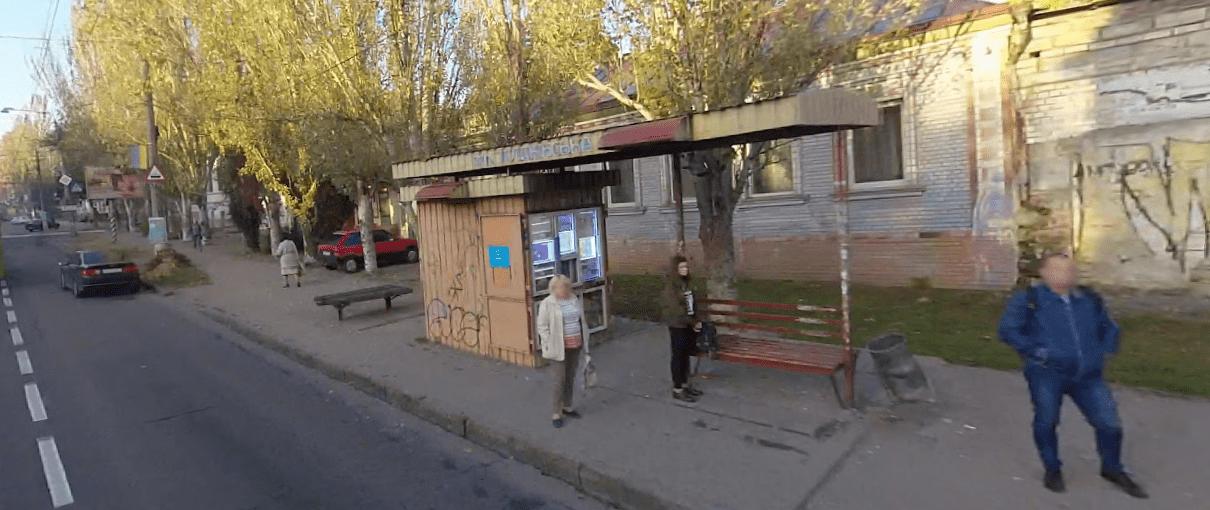
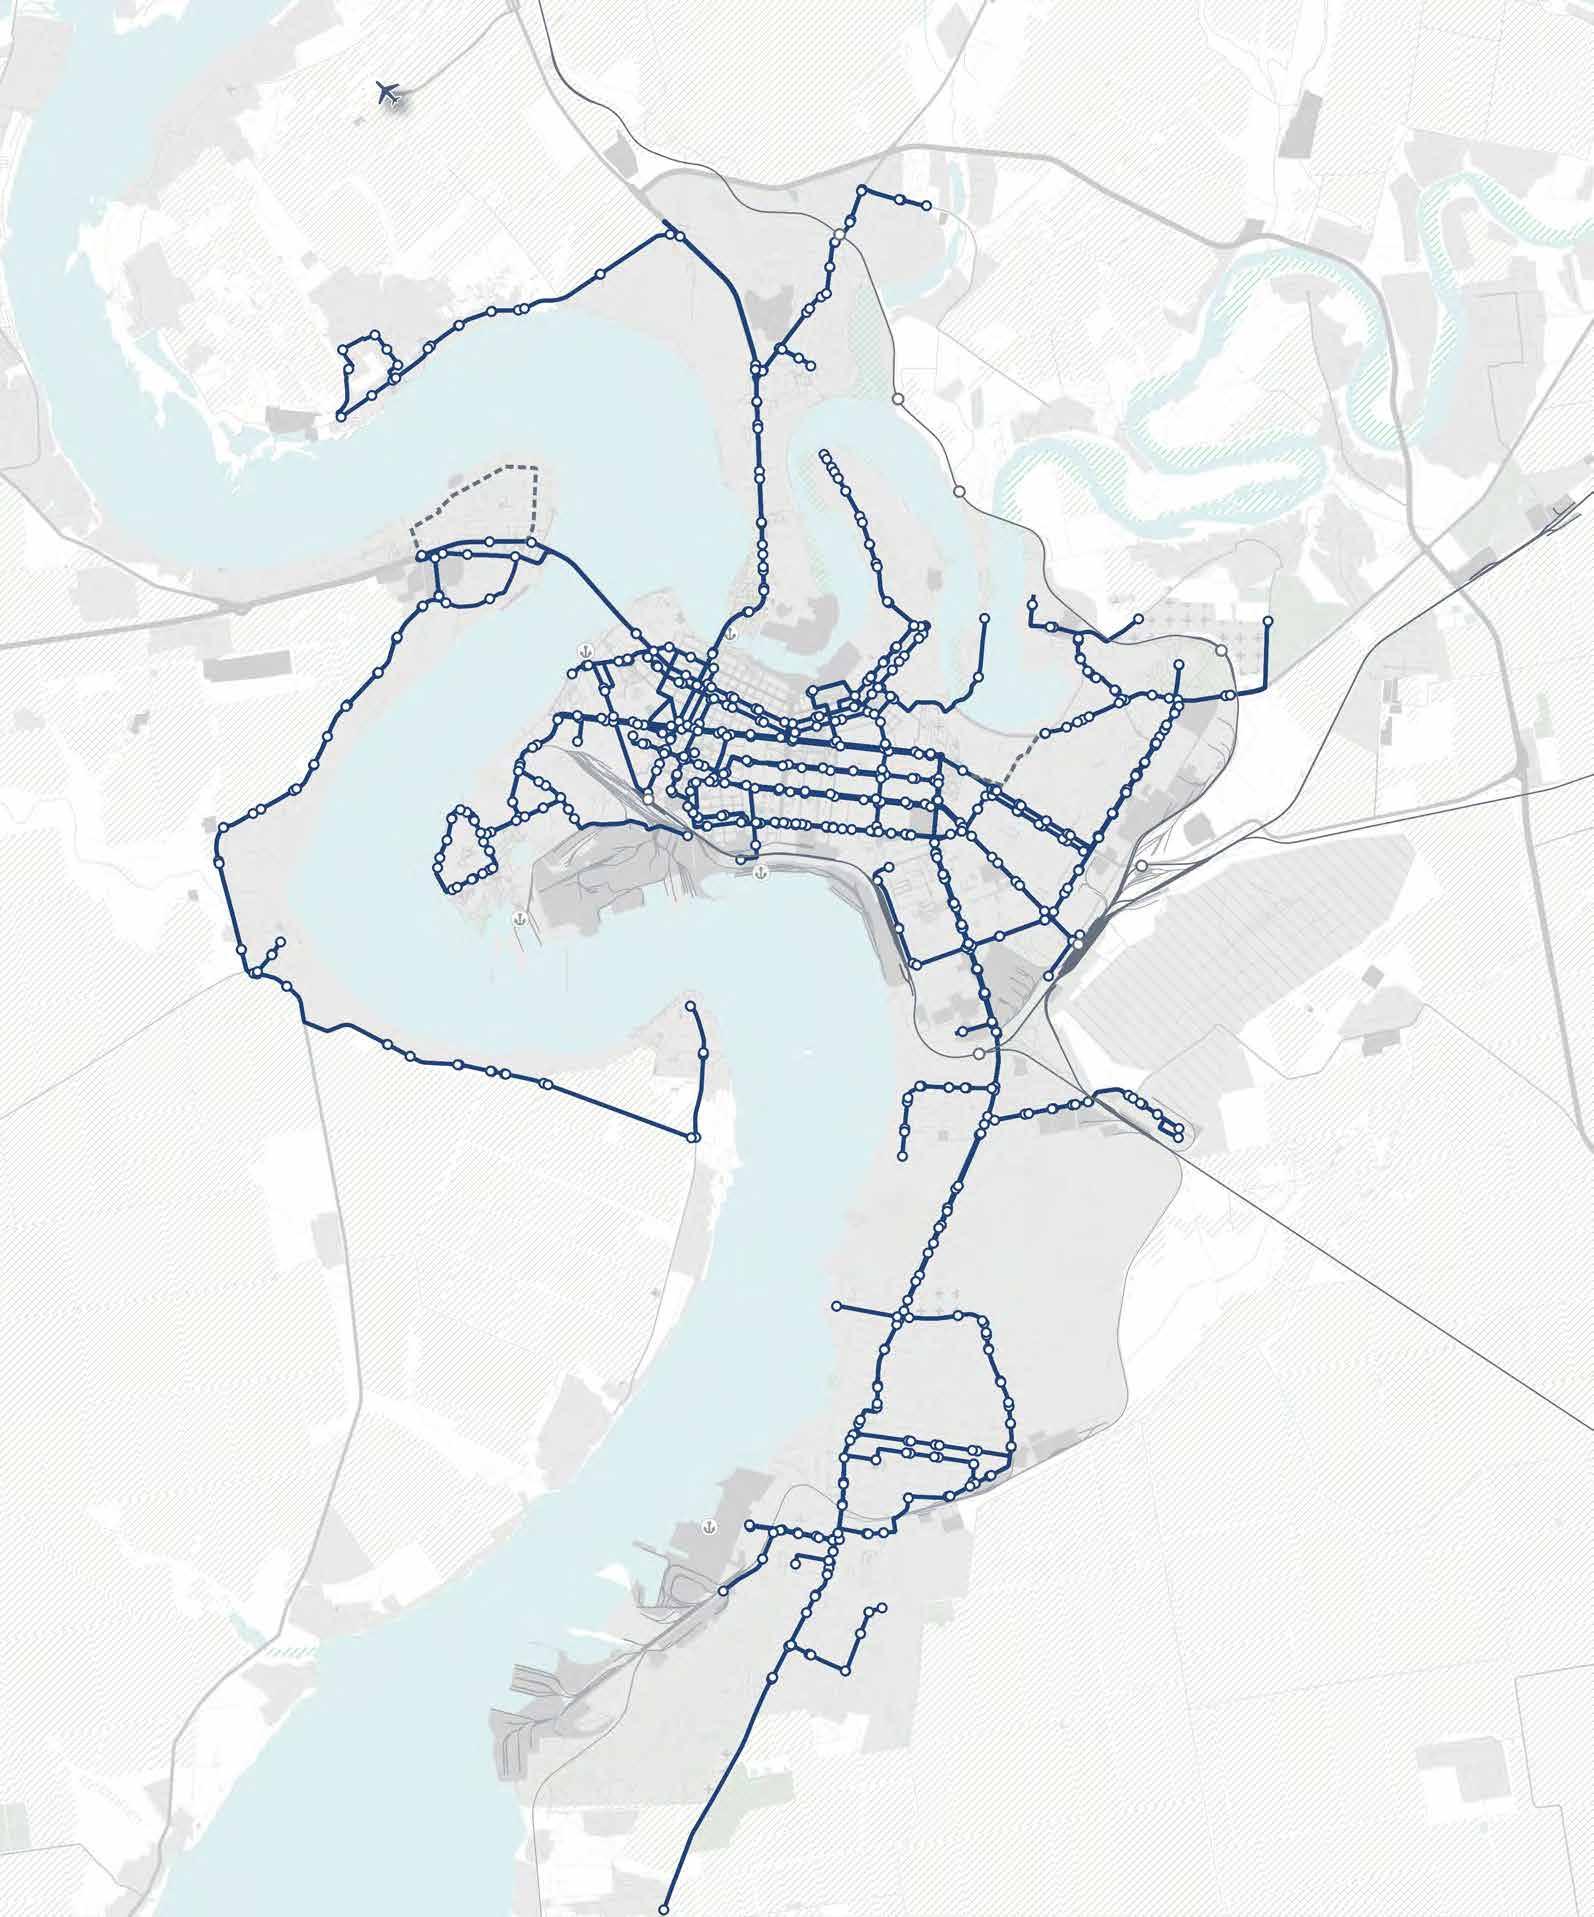
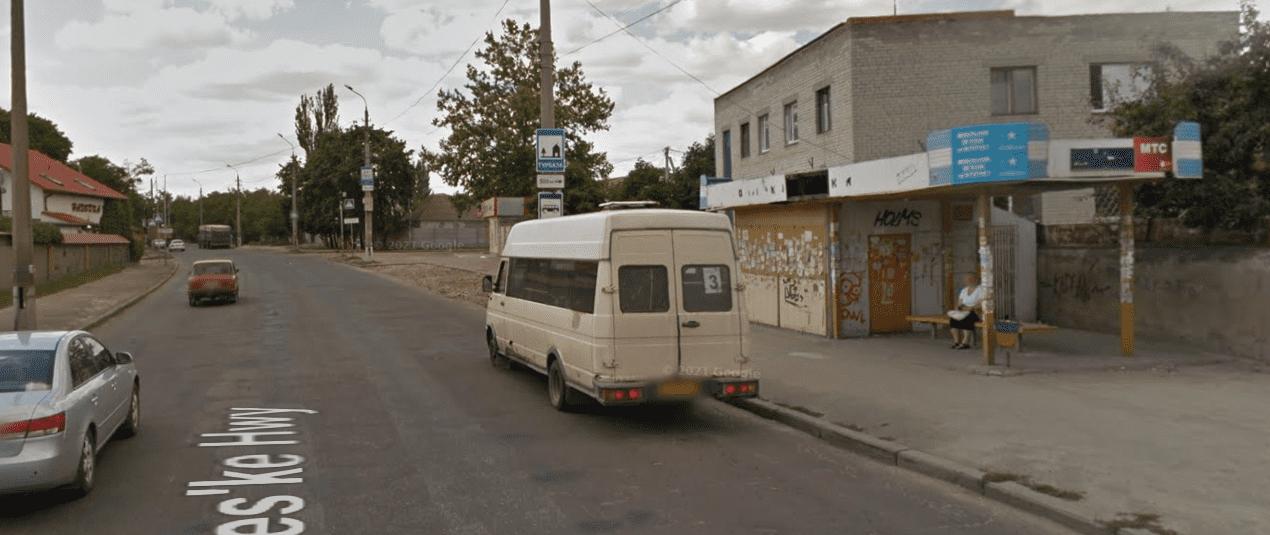
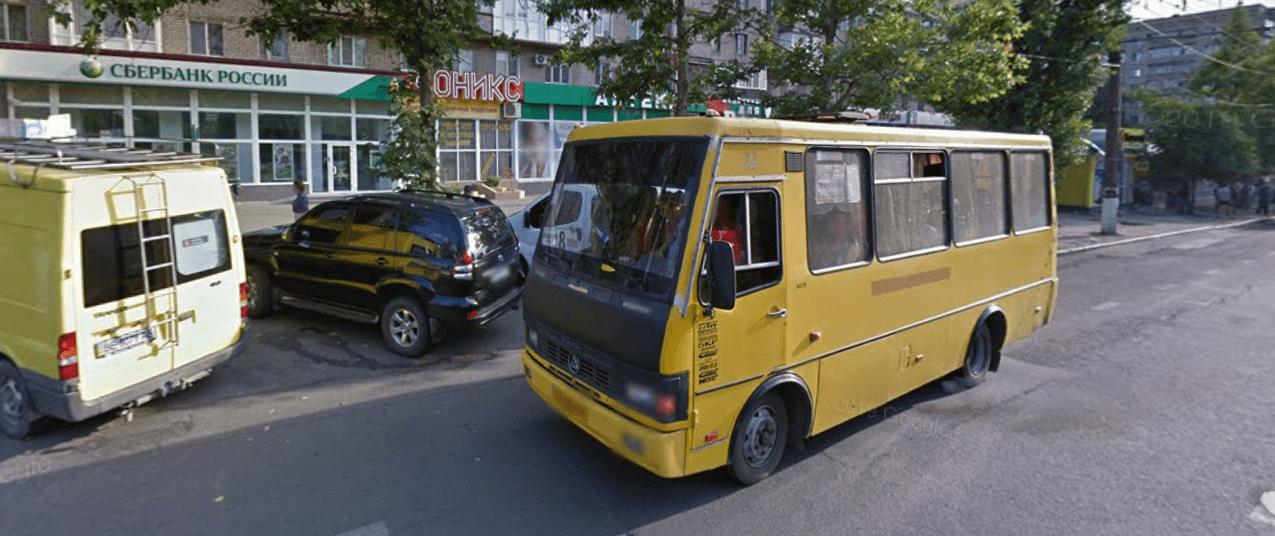
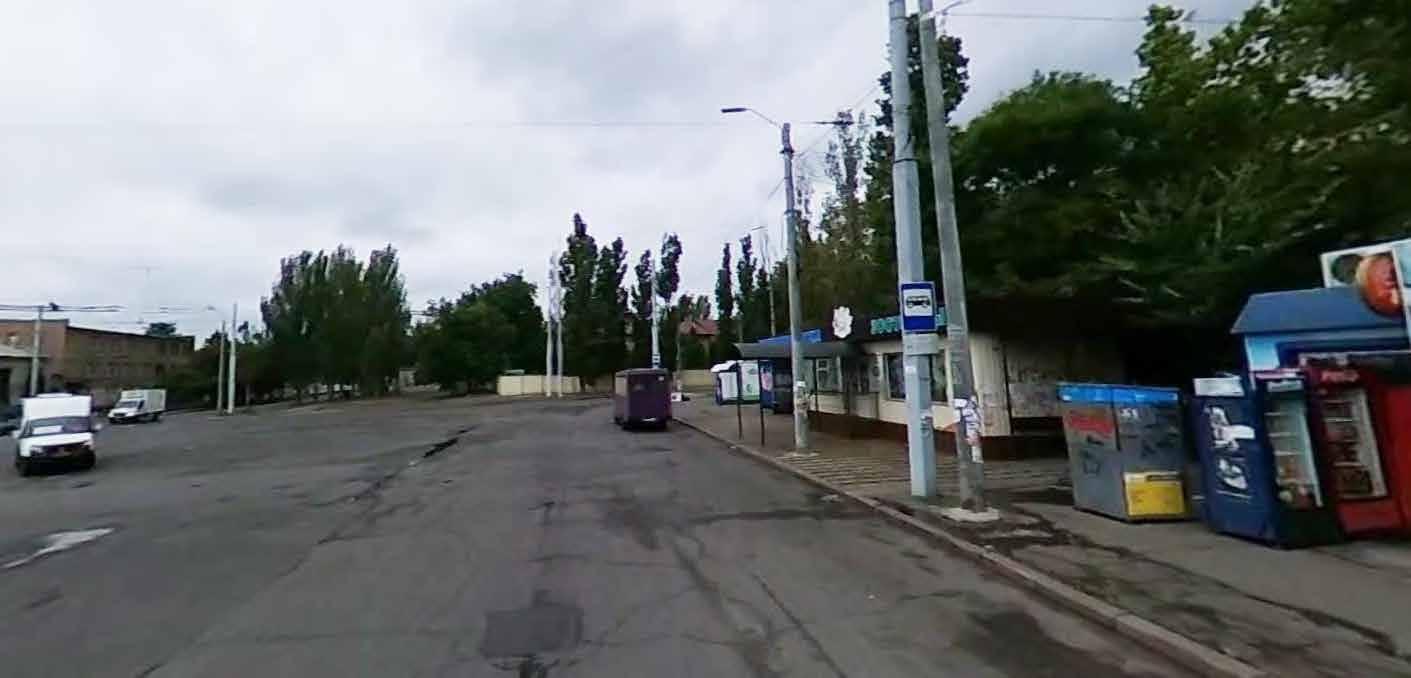
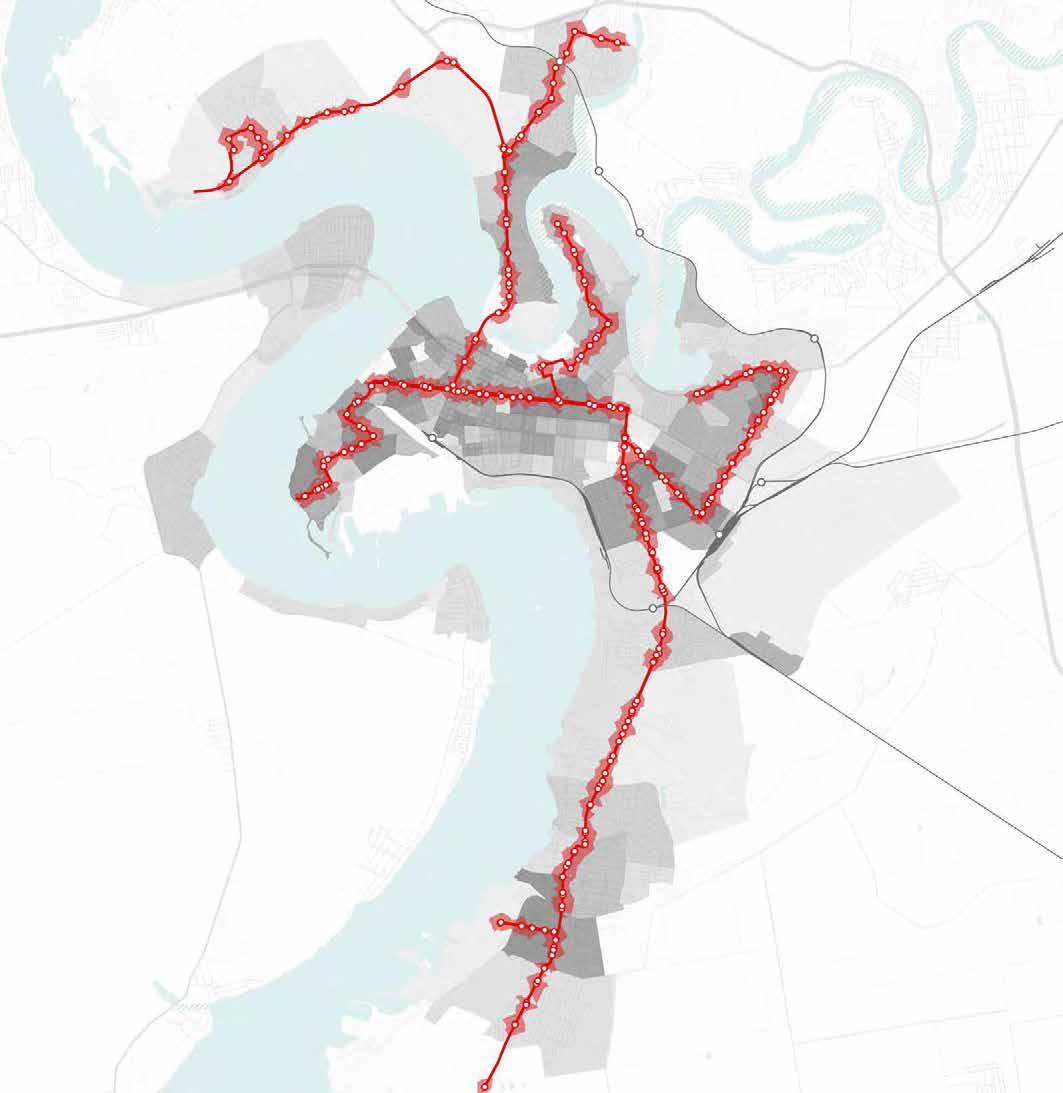
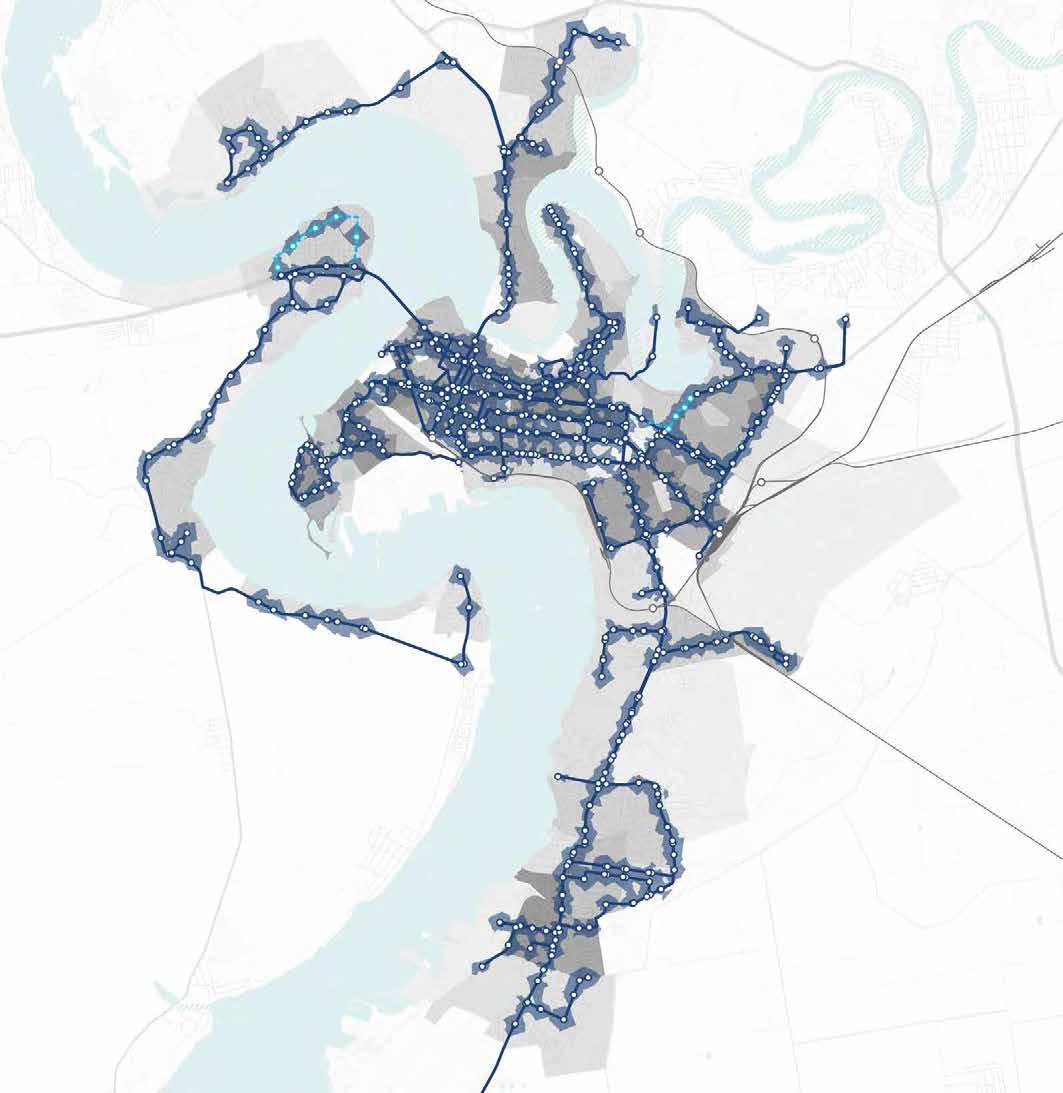
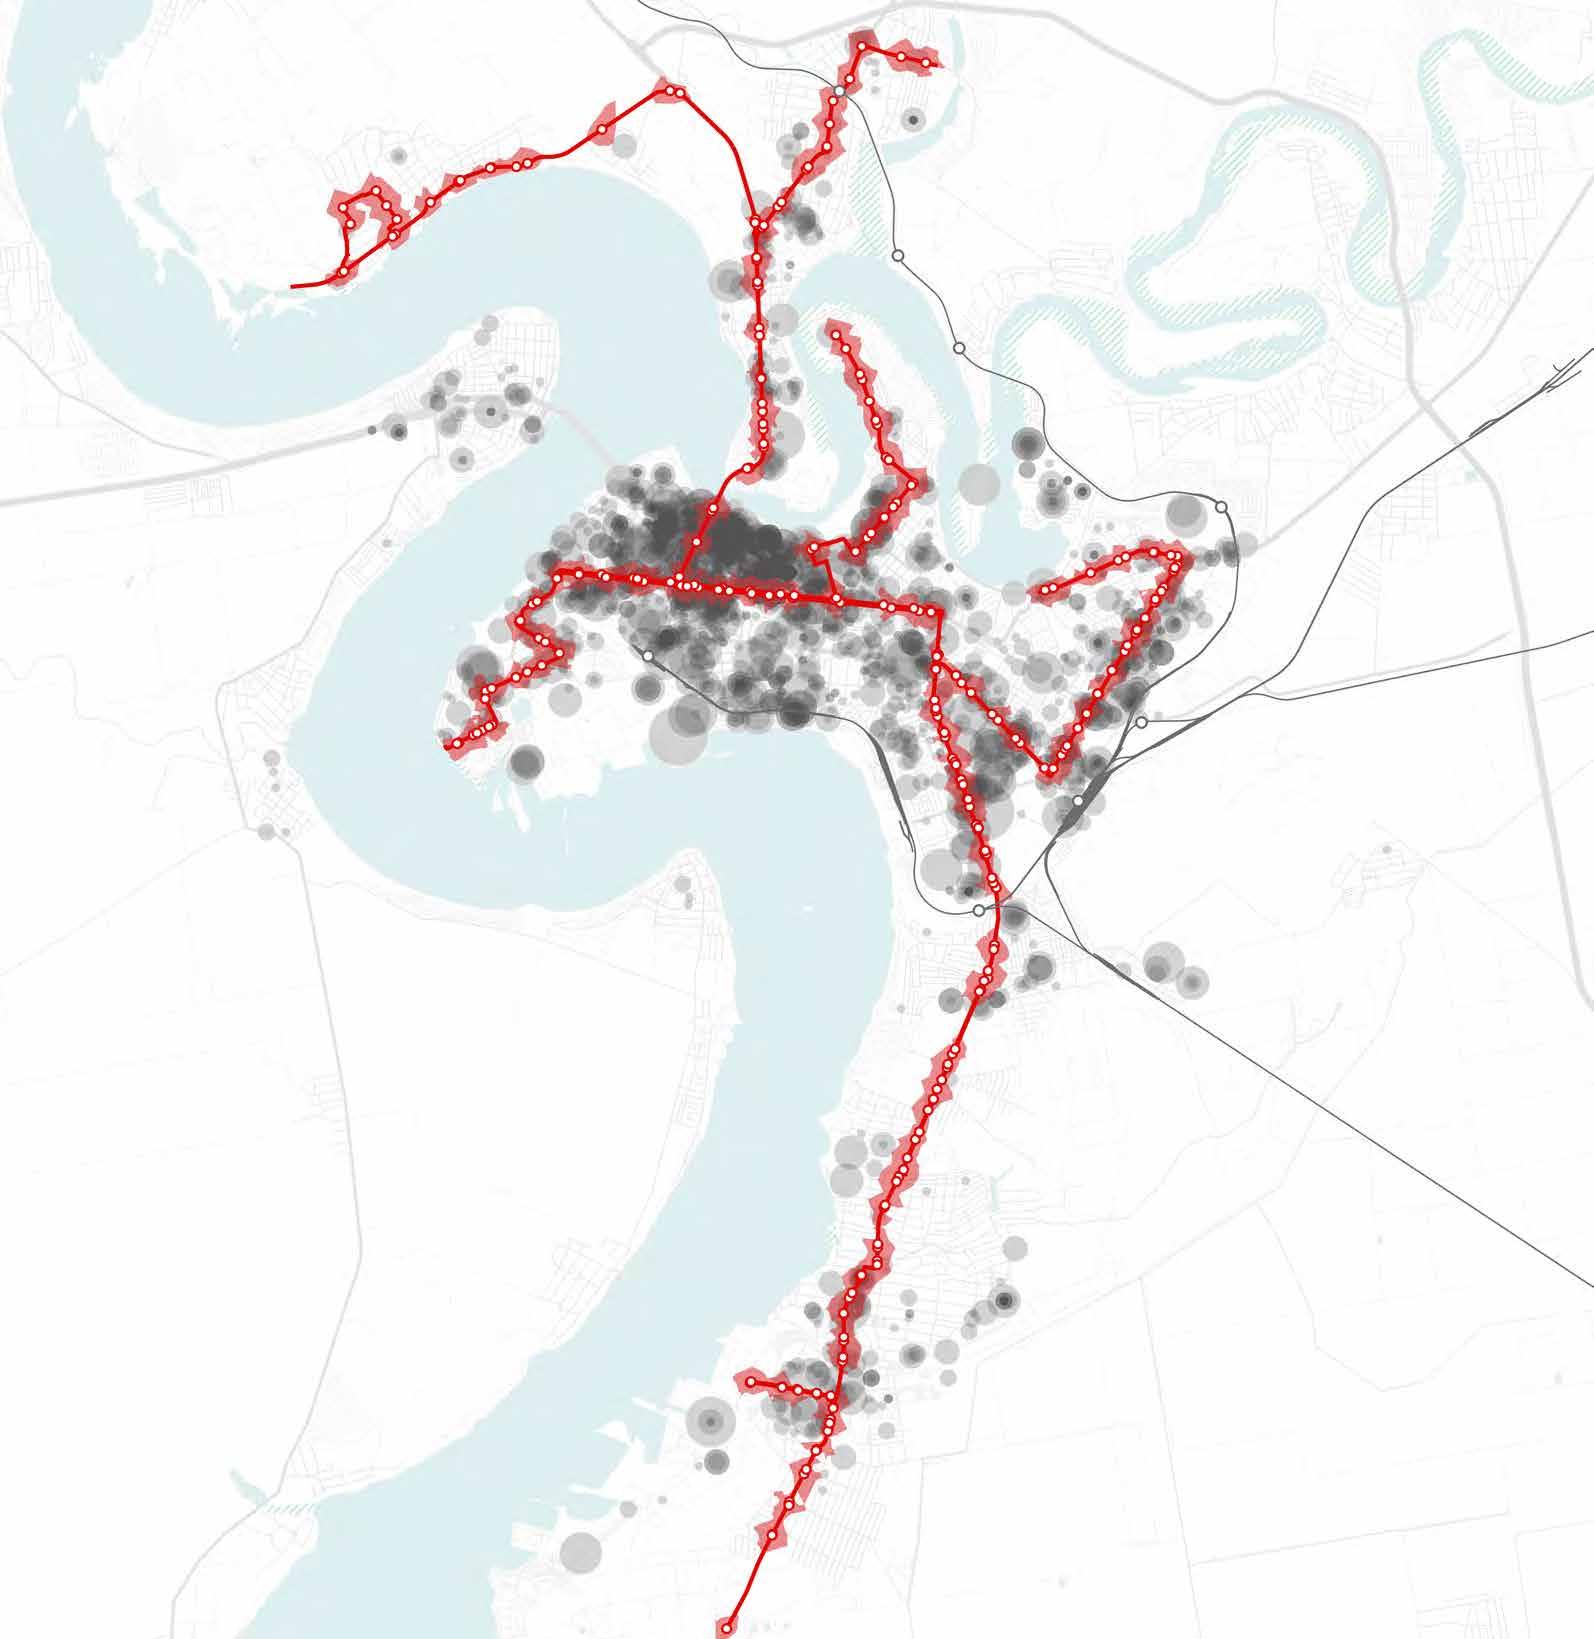
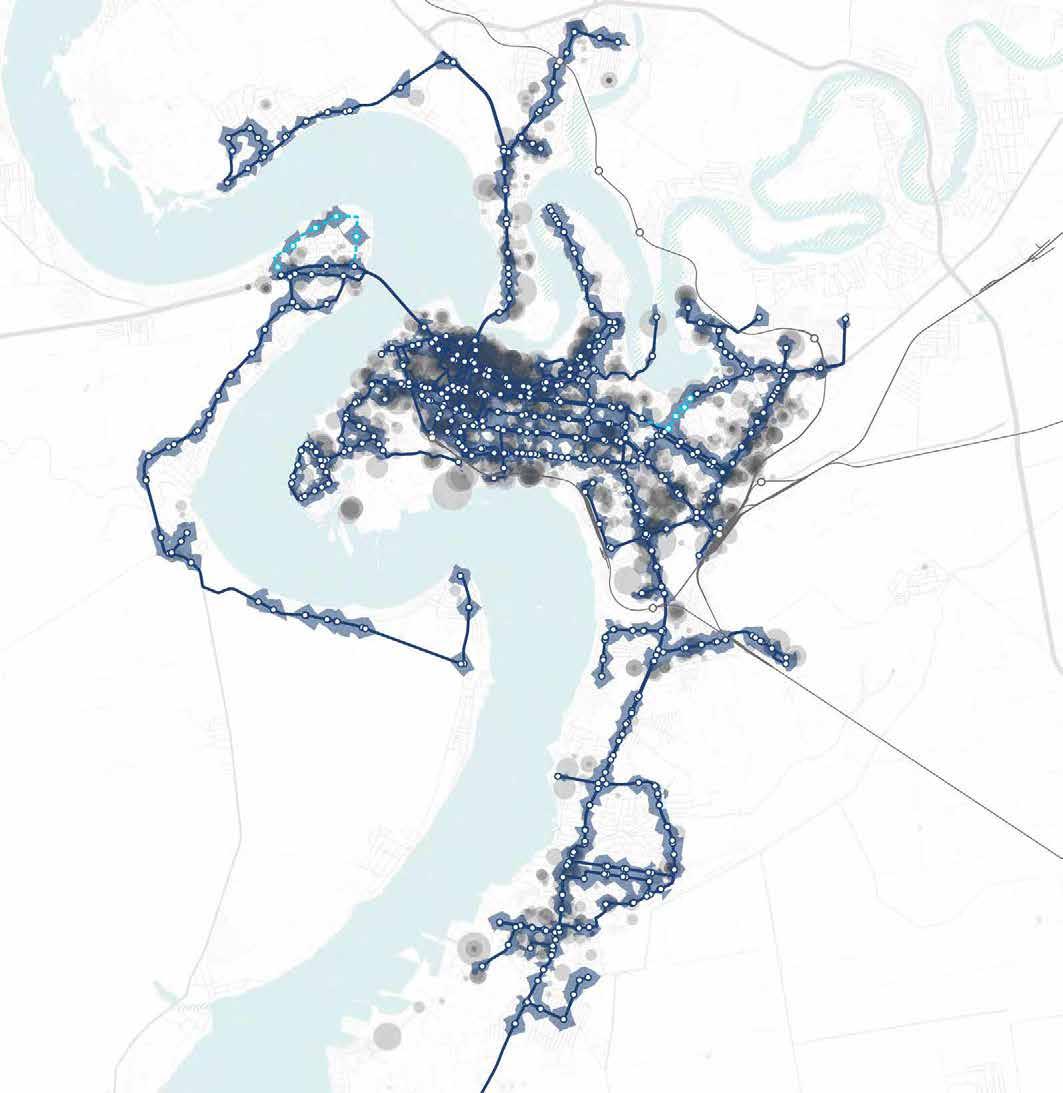
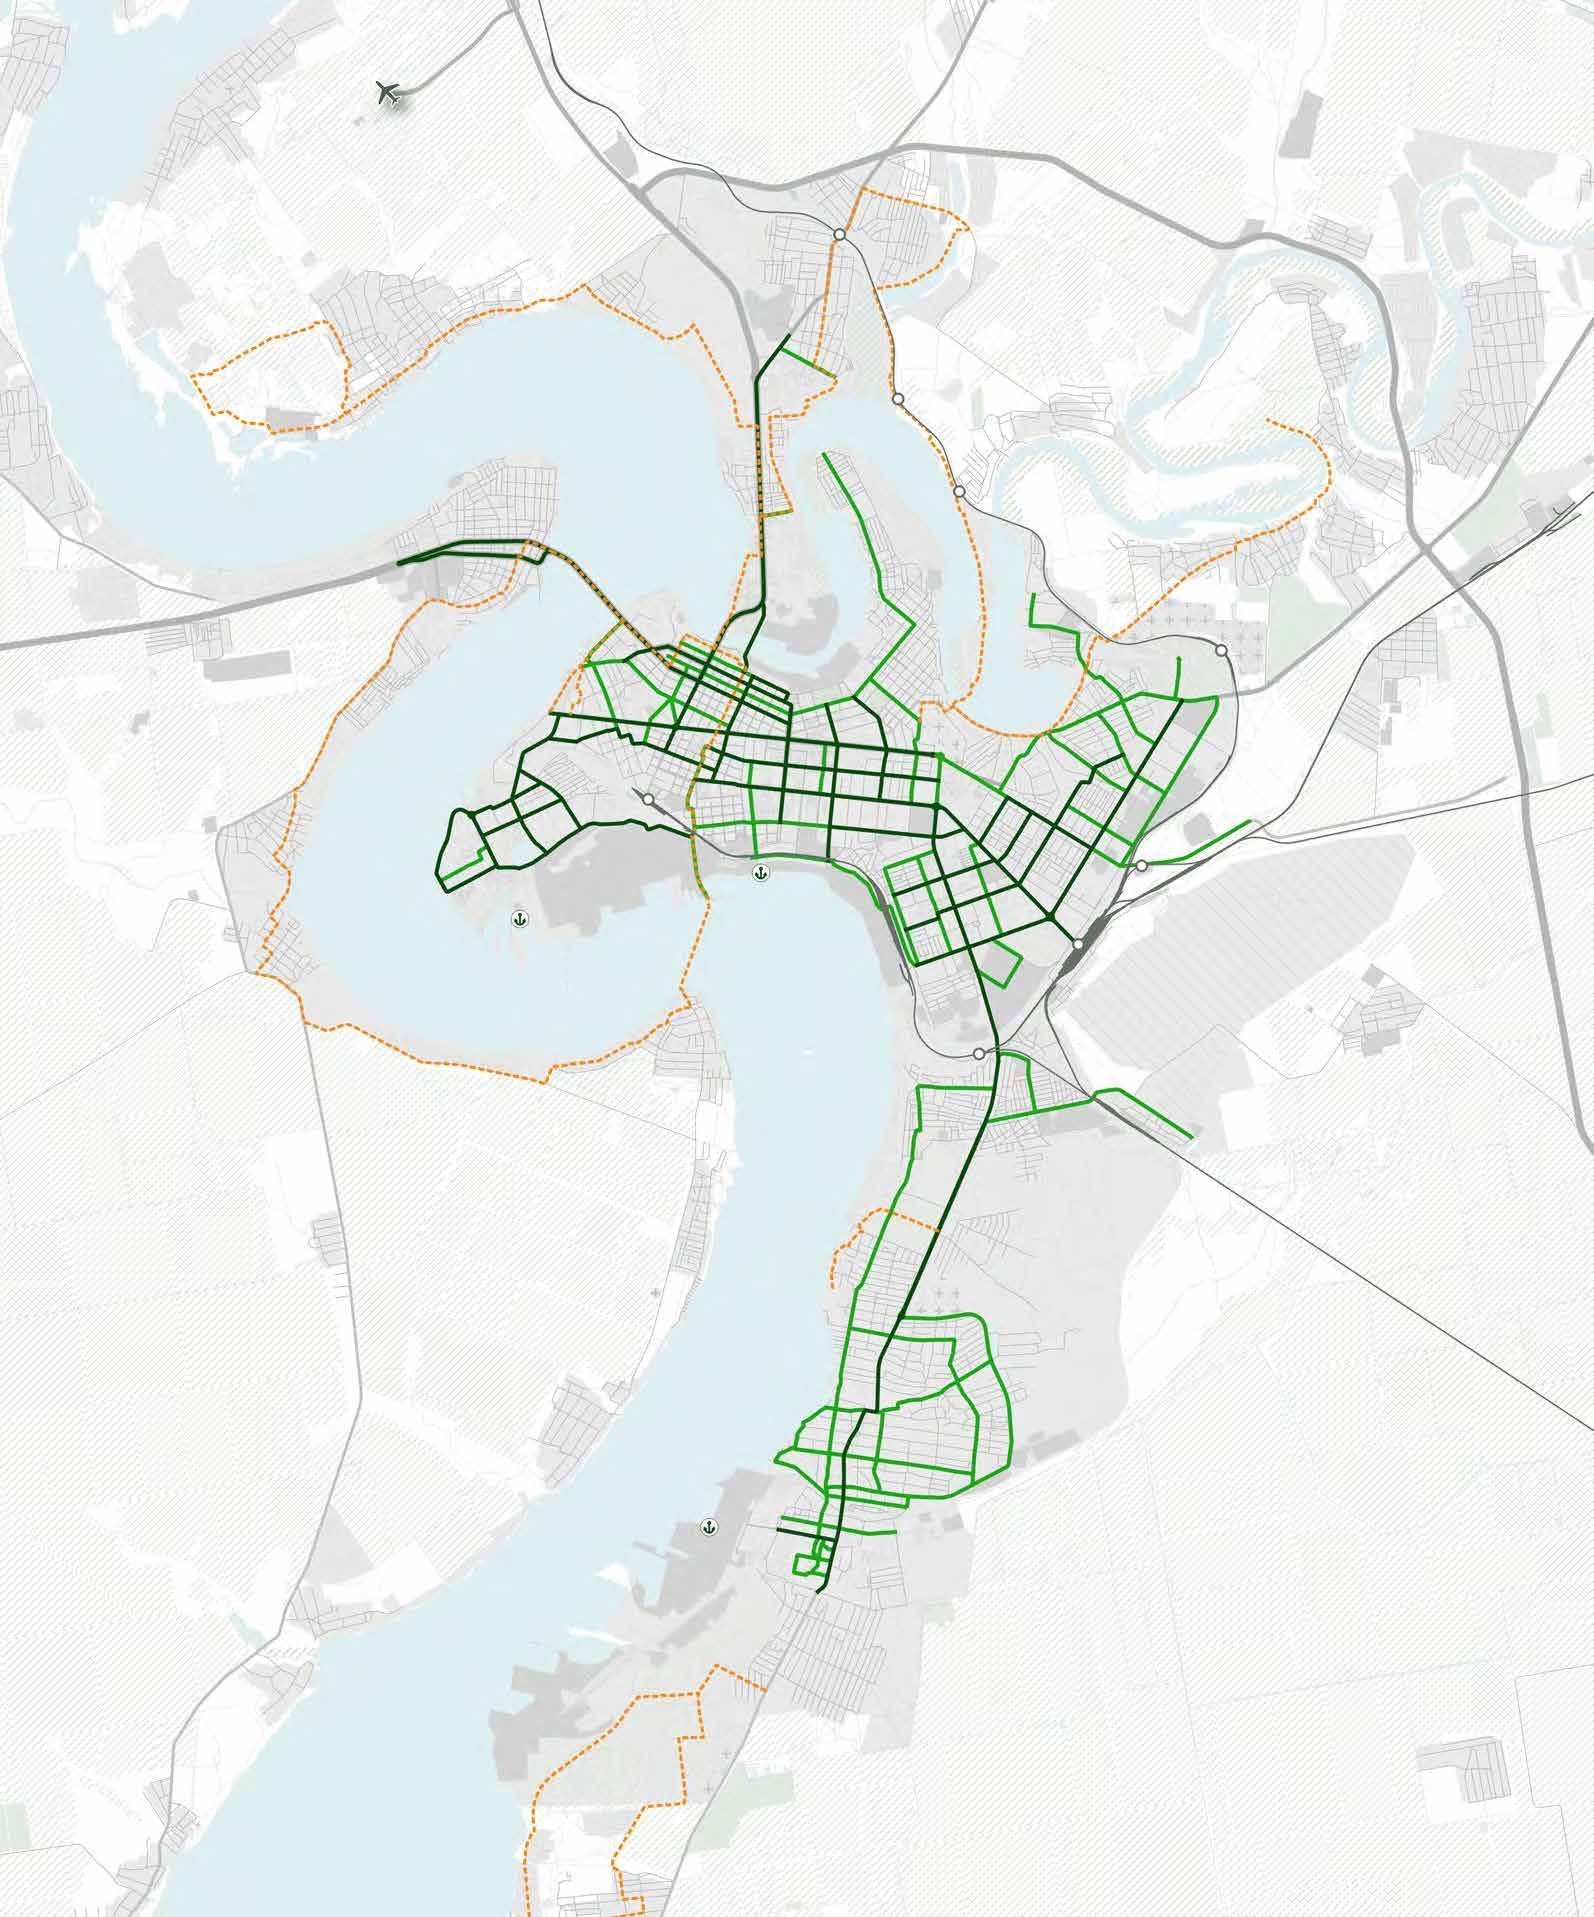
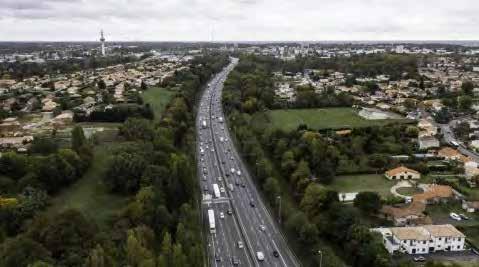
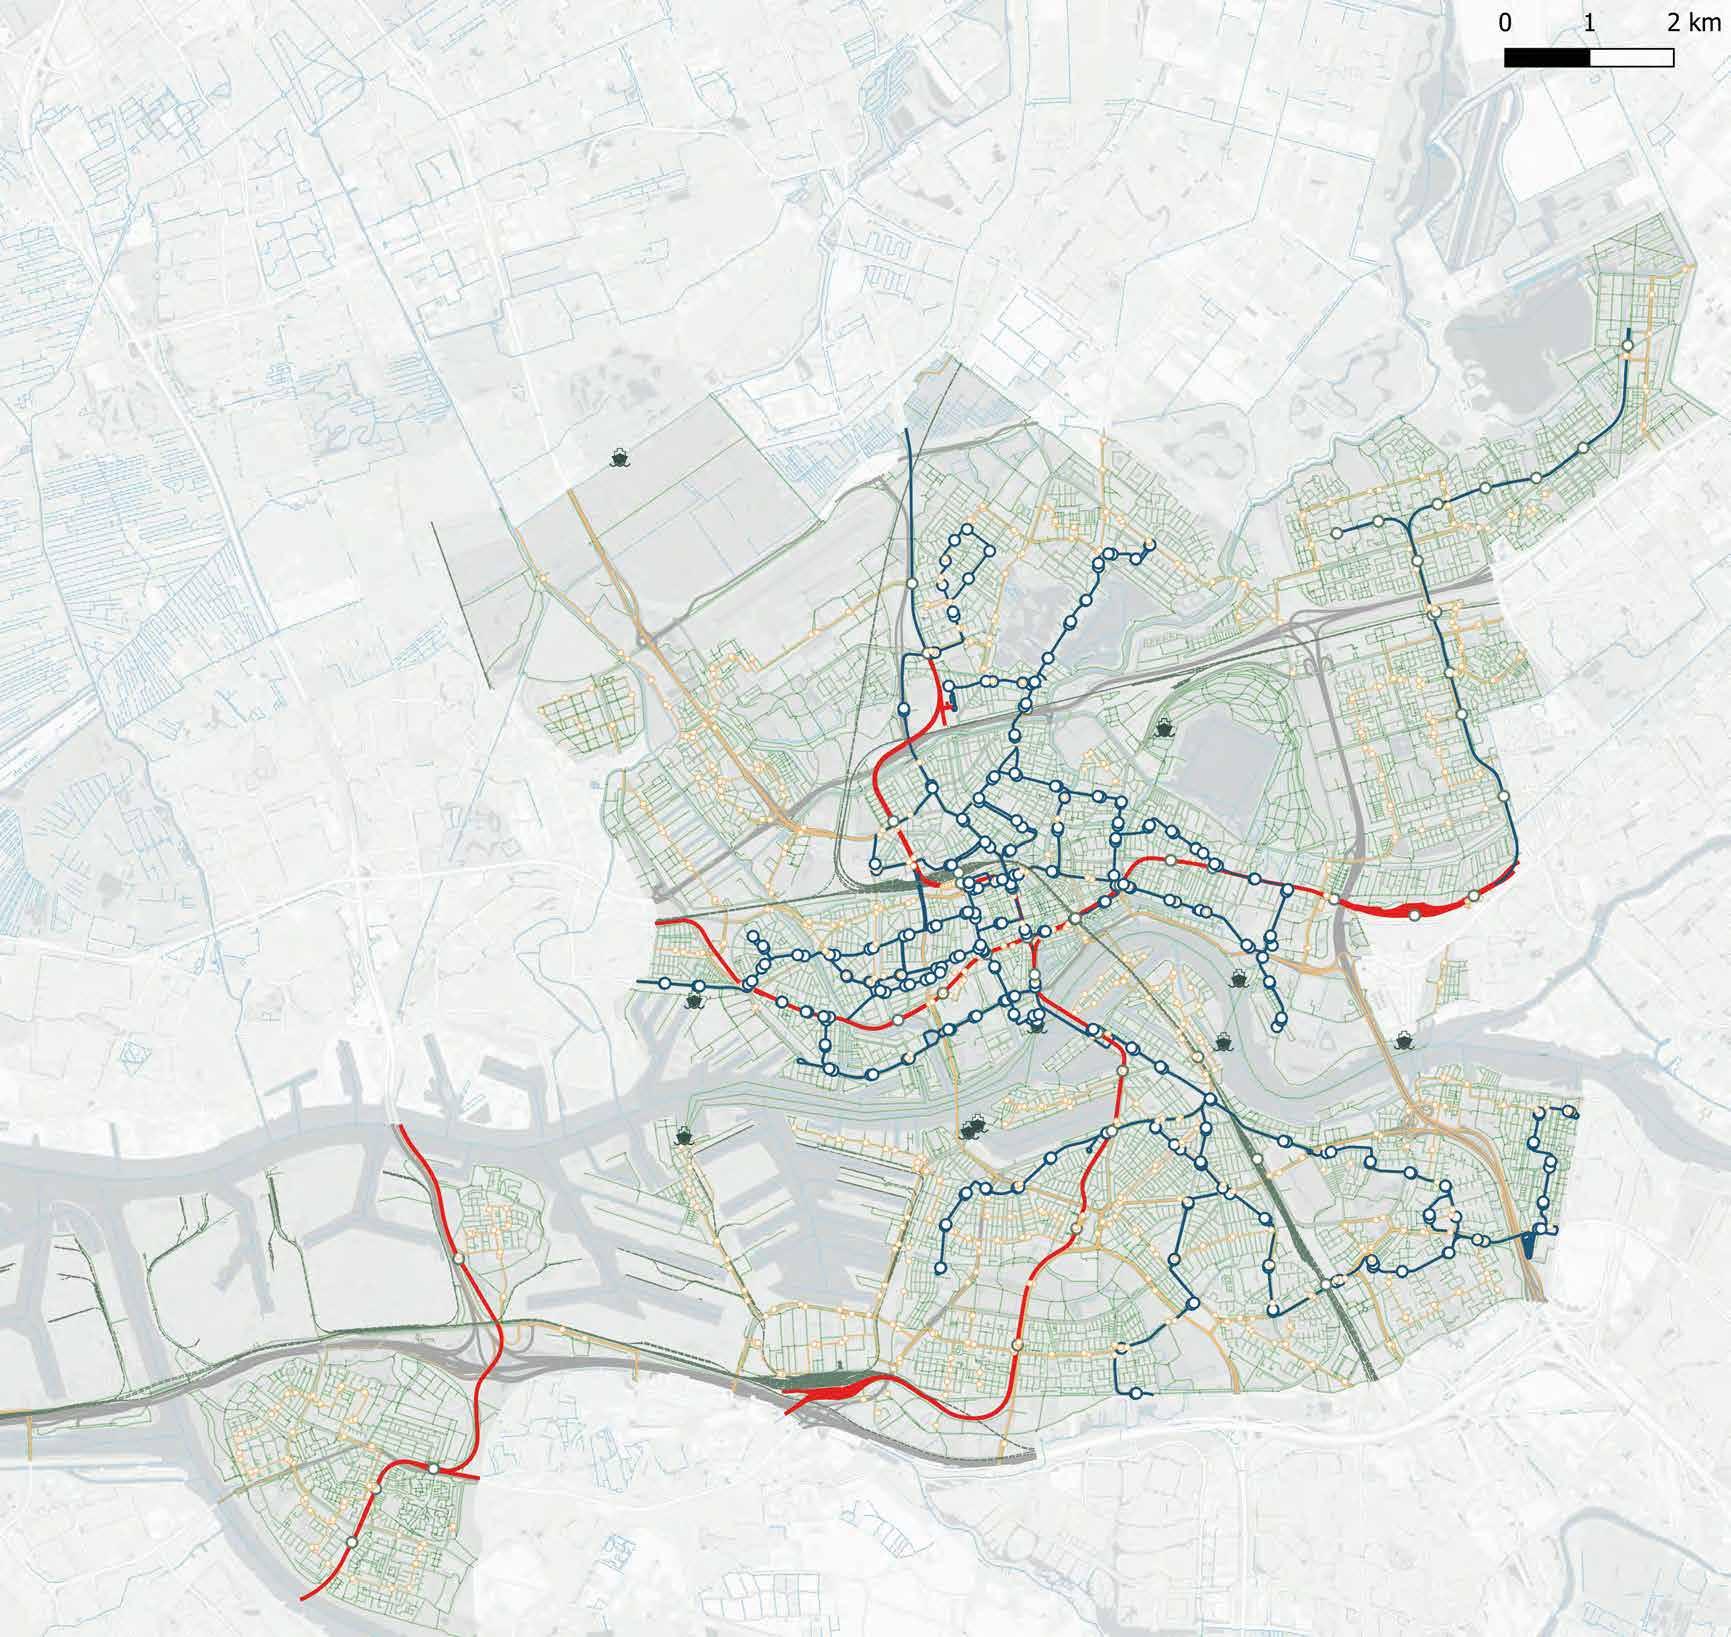
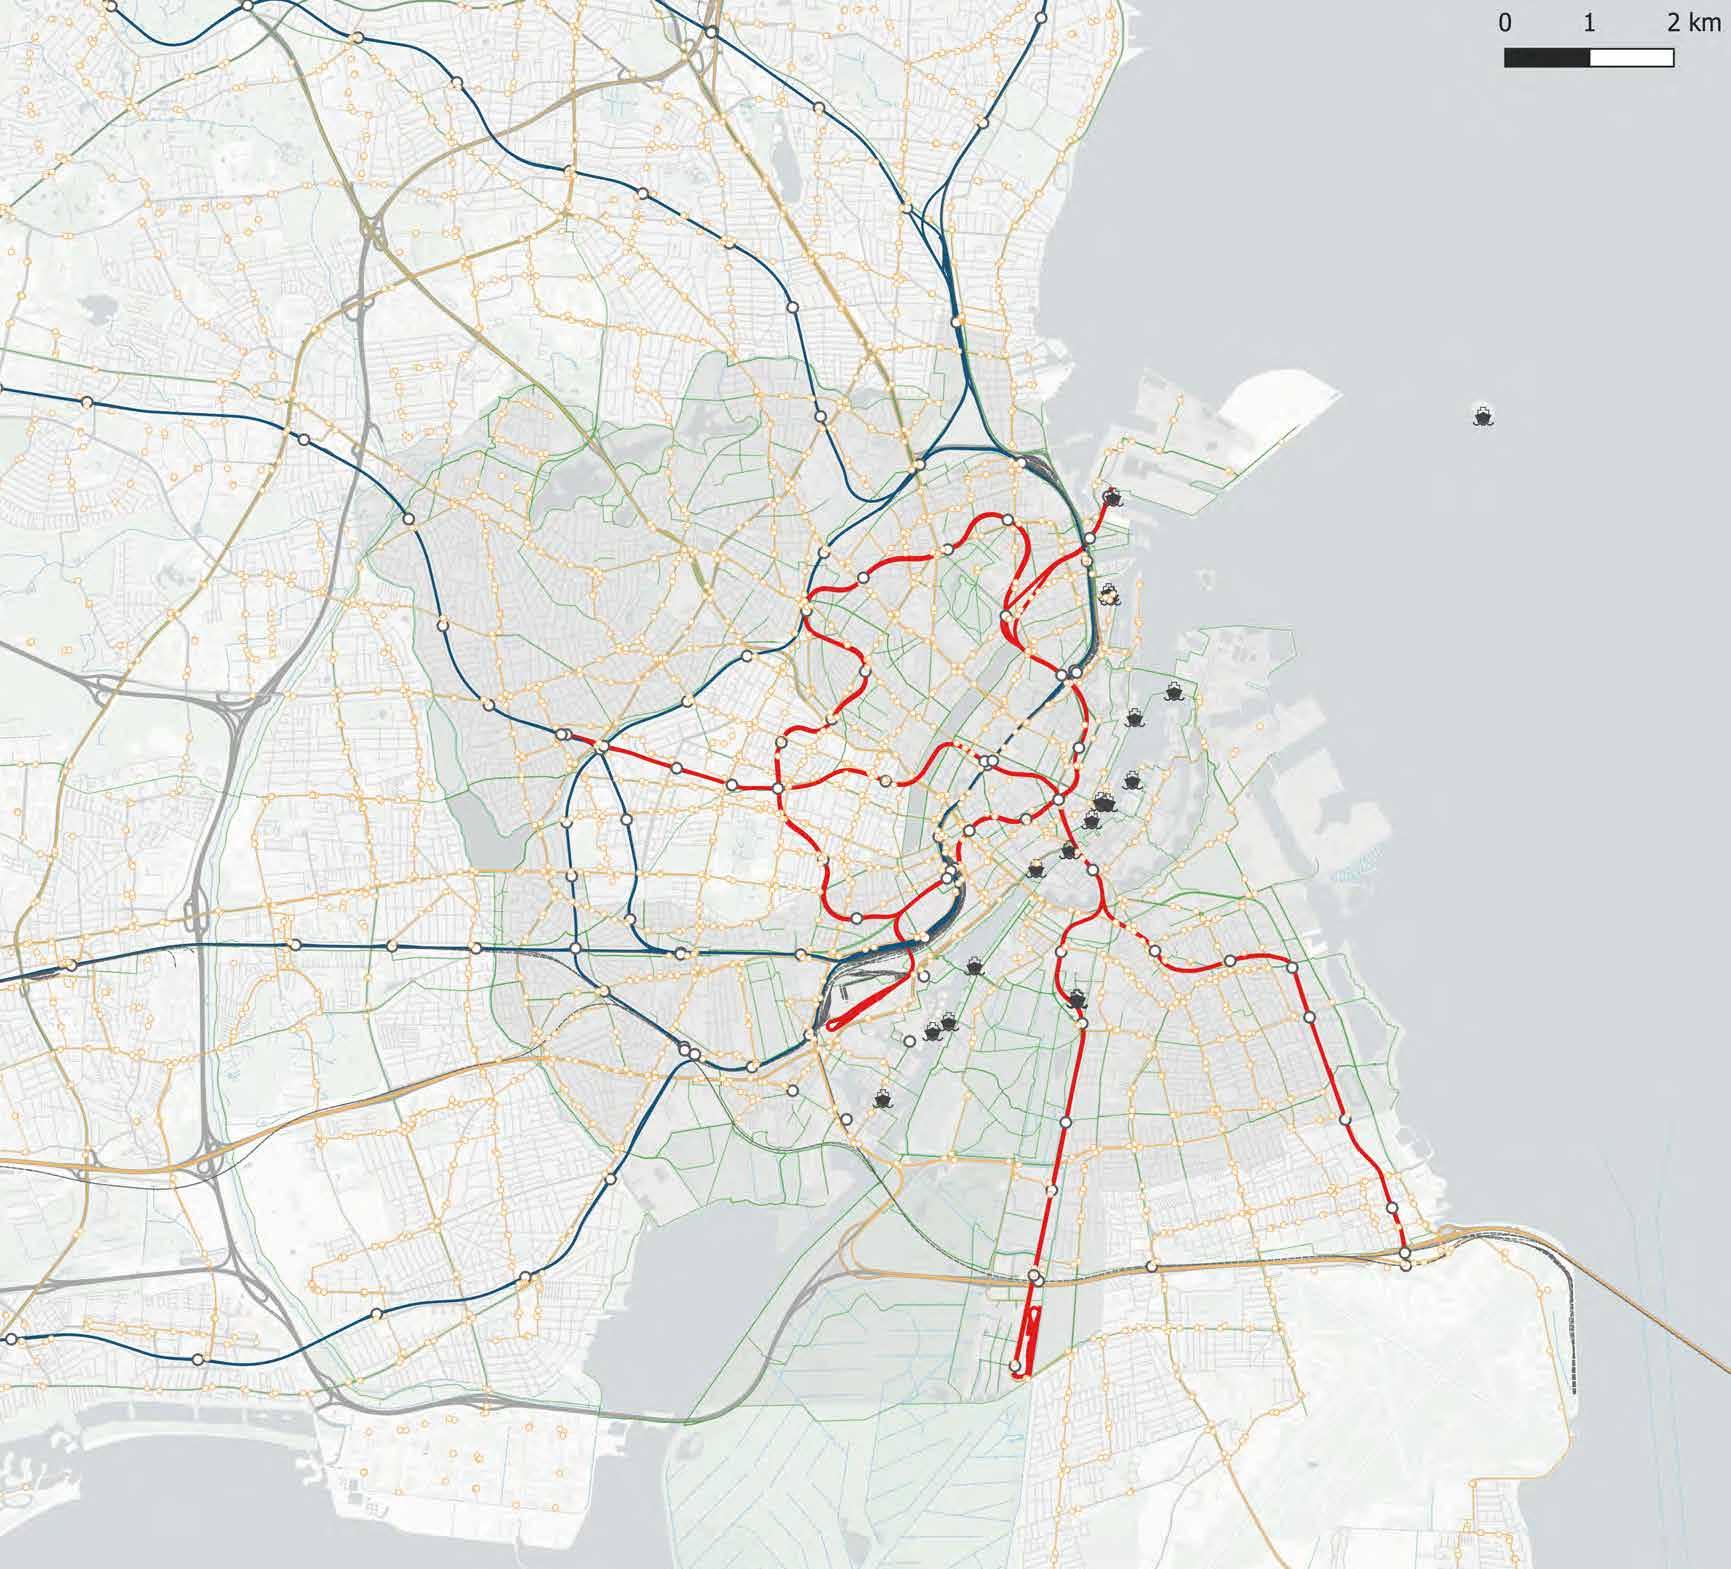
Transport Infrastructure
Based on the damage information received, potential areas of damage to Mykolaiv's transport infrastructure where highlighted on a map. The latter included road network, public transport infrastructure, and major mobility hubs, such as railway stations and ports. This map has been shared with the Mykolaiv municipality to facilitate video surveys. Following a thorough review of the video and image data received, it was clear that the city's transport infrastructure was largely unaffected. The table on the following pages summarises our footage review findings.
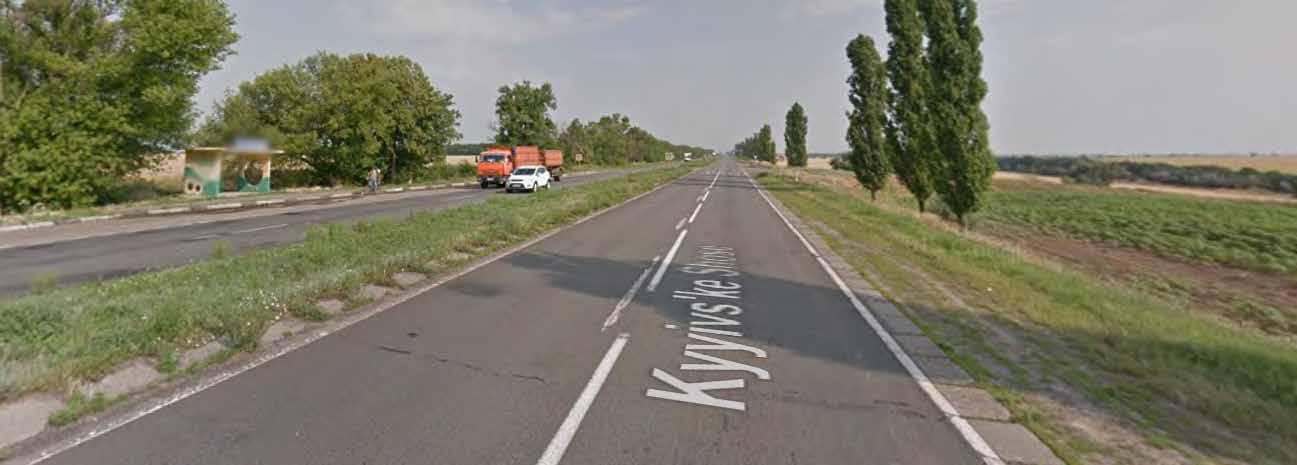
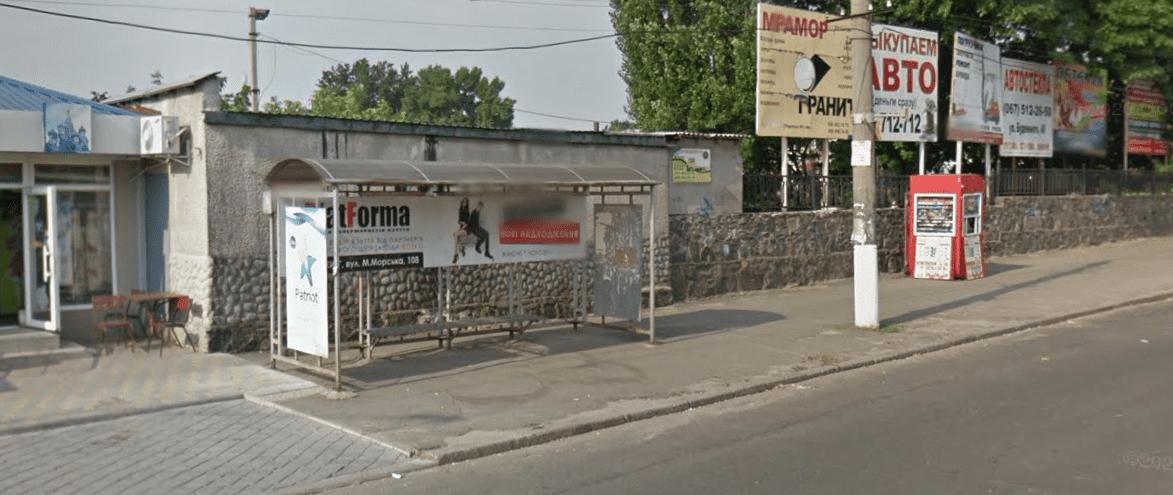
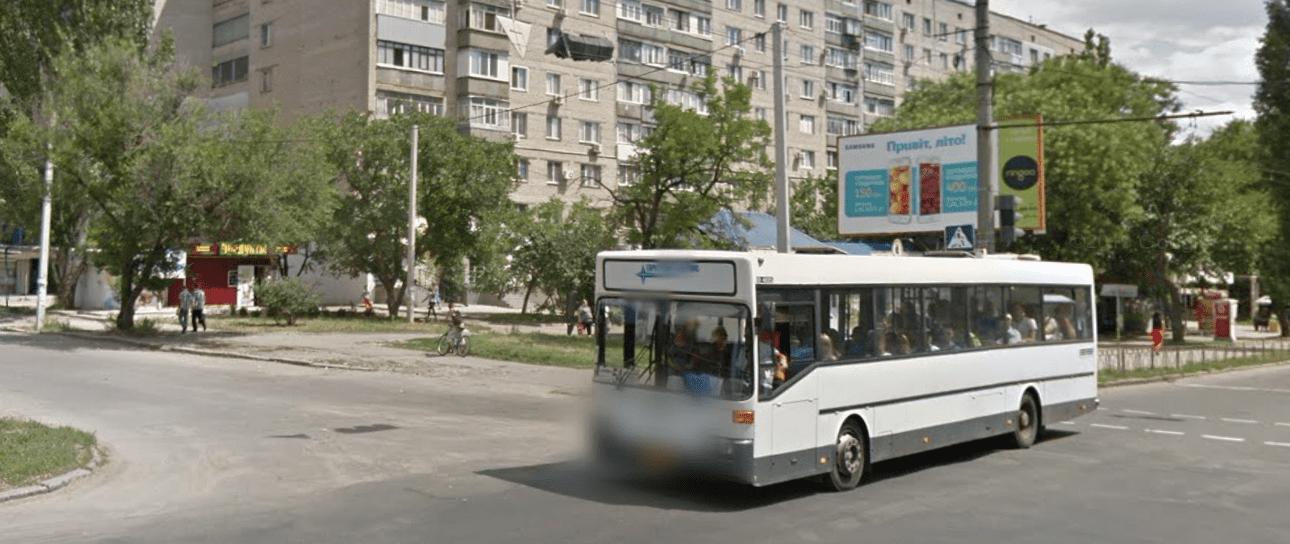
A damaged building was spotted at 19:09 minutes of the video. No damage to the road network or
a01_2 mp4 No damage to the road network or public transport infrastructure is evident from the video.
a01_3
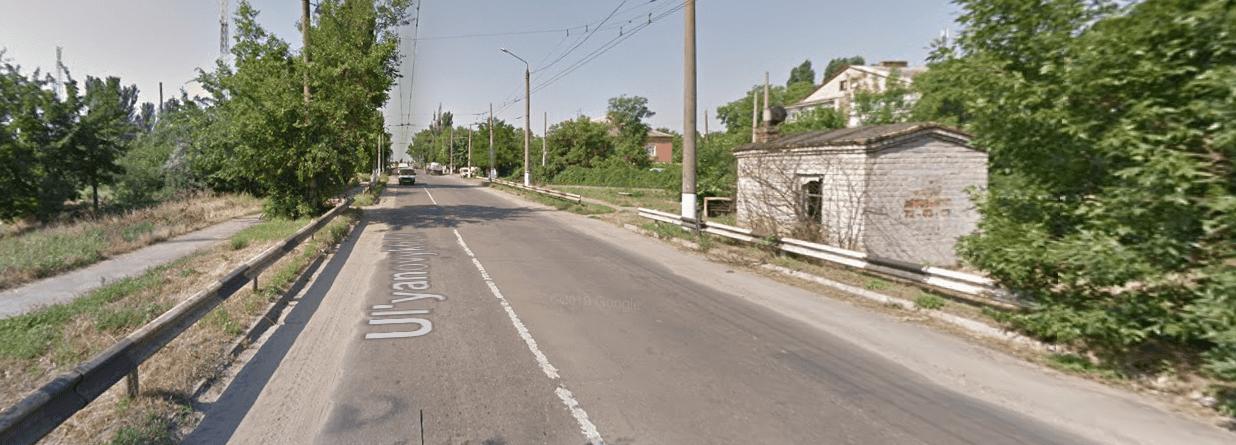
a03_photo_2 –kopіya jpg No damage to the road
or transport
is evident from the photo.
a03_photo_3 –kopіya jpg No damage to the road network or transport infrastructure is evident from the photo.
a03_photo_4 –kopіya jpg No damage to
a03_photo_5 –kopіya jpg No damage to the road network or transport infrastructure
Infrastructure and utilities
The COWI Group has provided the following information regarding three main utility sectors:
1. Waste
It appears there is no report on destroyed infrastructures related to municipal solid waste management.
2. Water
There is a documented need to invest in water management, specifically estimating that 240 km of pipes have been seriously damaged.
3. Energy
Damages to heating networks have been restored. However, the energy network has suffered damage affecting its integrity.
It's important to highlight that the municipality promptly addressed the majority of utility damages as they emerged.
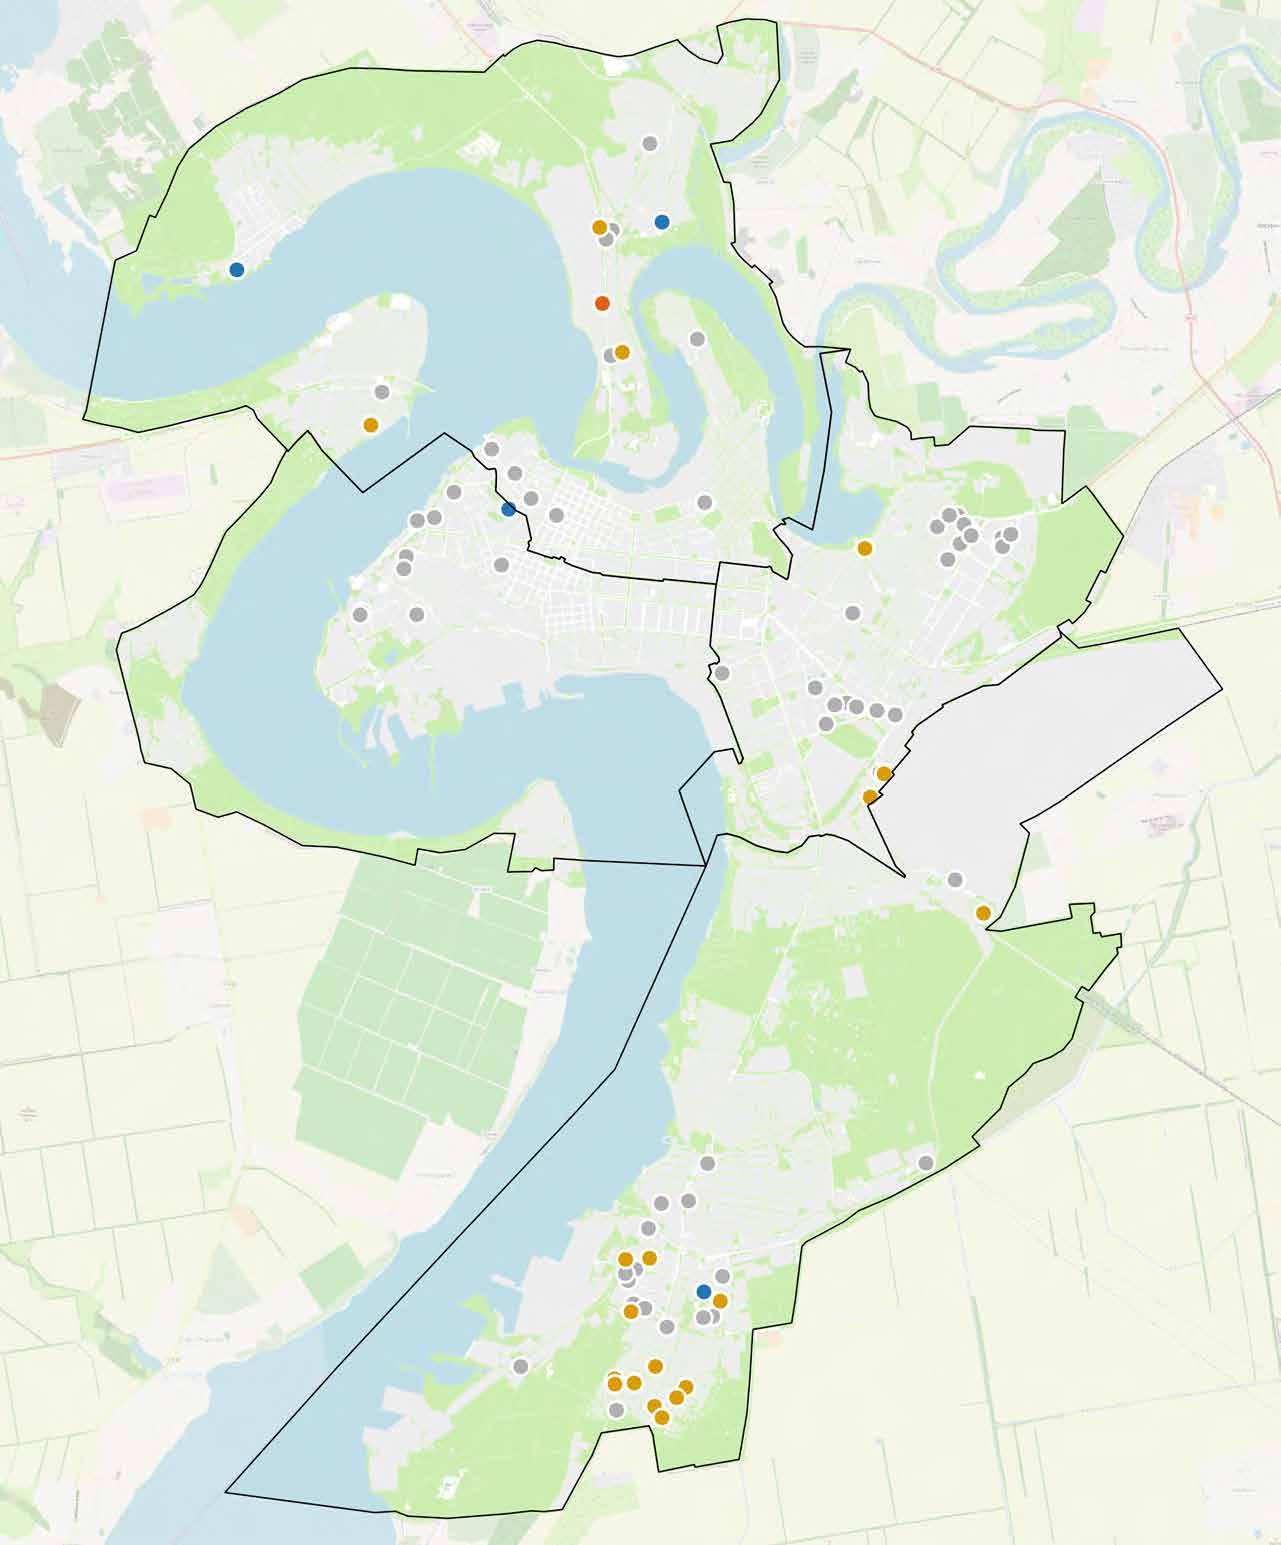
The map on the right offers a comprehensive overview of Mykolaiv's energy and heating system, with particular attention drawn to pipe damages identified in the Zavodskyi district.
The following page provides an overview of all damages documented across utilities, based on the damage assessment dataset provided by the municipality.
There are 122 damage points to utilities, out of a total of 3109, one is specific to a heat supply facility, 4 to water supply facilities, 41 to electricity supply facilities and 76 to "life support infrastructure of the population", which includes:
• Centralised water supply facilities
• Heat supply installations
• Gas supply facilities
• Electricity supply facilities
• Electronic communication network infrastructure facilities
Inhuls'kyi
Korabel'nyi
Tsentral'nyi Zavods'kyi
INHULS'KYI
TSENTRAL'NYI
ZAVODS'KYI
KORABEL'NYI
Ecological Network and Vacant Land Assessment
Ecological Network
Enhancing Urban Planning in the city of Mykolaiv
Landscape and Natural Environments | Introduction
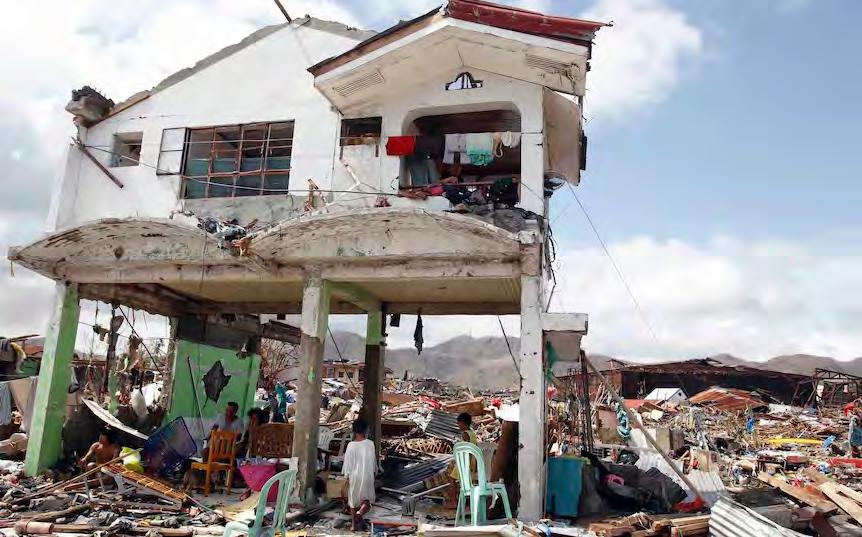
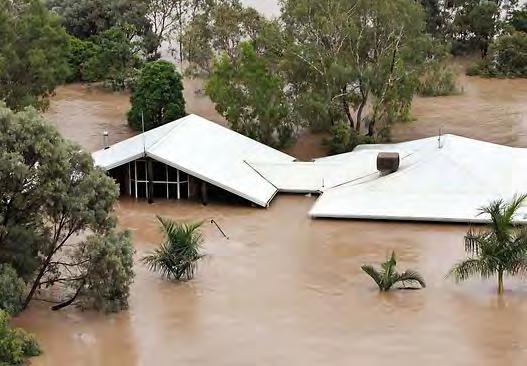
Besides the challenges posed by the reconstruction process, Mykolaiv’s natural environment faces great global challenges such as digitisation, demographic changes and, above all, climate change.
Climate change refers to climate alterations (i.e. temperature variations and extreme weather events) that affect the entire planet over the long term. Over the Earth's lifetime, climate has changed many times, however never as fast as in the last two centuries. This global phenomenon influences natural environments around the planet, causing major negative effects.
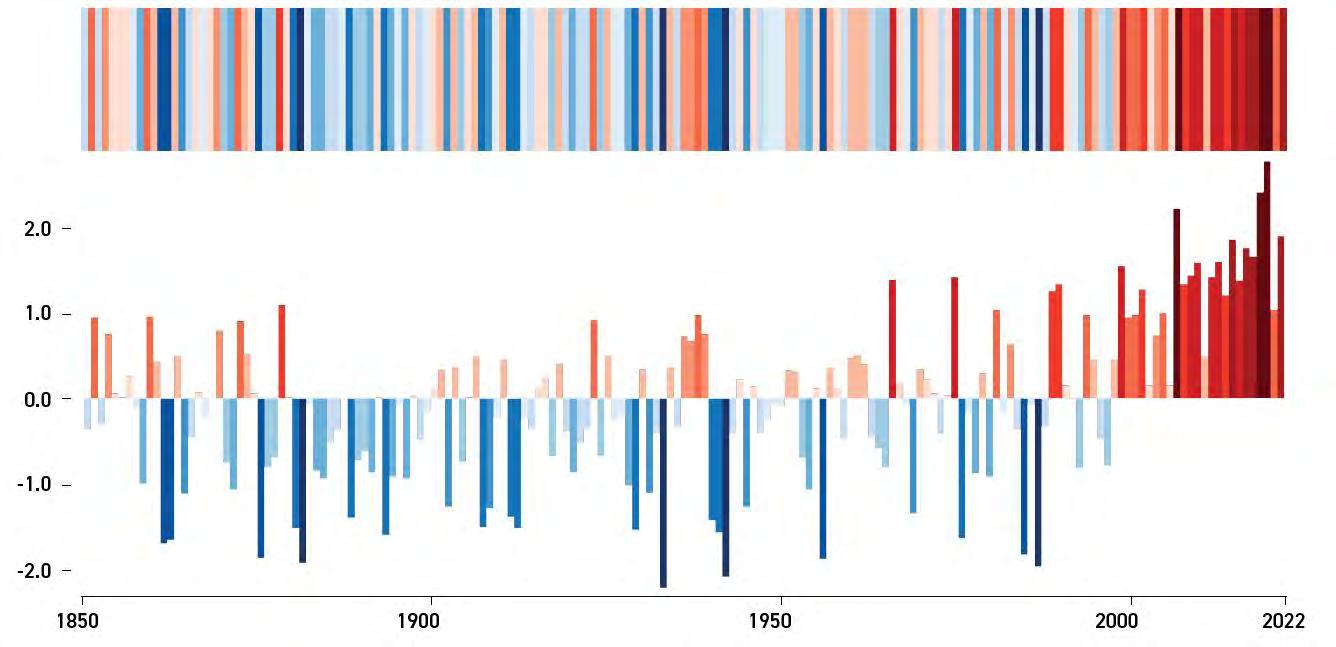
Warming stripes graphically portray long-term temperature trends. A colour is assigned to each row (representing a year), with a shade of red or blue depending on the greater or lesser deviation of the average annual temperature from the reference temperature. As the chart shows, Mykolaiv is not immune to a sharp rise in average temperature.
On top of rising average temperatures and changes in regional and local climate systems, climate change causes altered rainfall patterns, more intense cyclones, heat waves, torrential rains and rising sea levels. As a result, impacts on ecosystems include alterations in distribution, composition, phenology, ecosystem services and species, changes in population and genetic diversity.
It is important to recognise the interdependence between climate, ecosystems, biodiversity, and human society. According to the last IPCC report (IPCC AR6 SYR, 2023), agriculture, forestry and other green land uses provide adaptation and mitigation benefits that could be upscaled in the near-term across most regions. Conservation, improved management, and restoration of forests and other ecosystems offer the largest share of economic mitigation potential.
The Mykolaiv Municipality should seize the opportunity to rethink their strategic actions and promote a virtuous process oriented towards sustainability. Mykolaiv can in fact develop by valuing local resources and repositioning its productive landscape.
Site-specific solutions and strategic visions require a critical analysis of existing site conditions. The following chapter therefore illustrates the national, regional, and municipal territory landscapes and natural environments.
Mykolaiv’s municipal territory was analysed in detail in terms of:
• Land uses and current conditions: overall reading of the local context’s characteristics;
• Historical and cultural resources: understanding of the historical and archaeological value of the territory, including the city’s suburbs;
• Visual perception and access: study of panoramic views and infrastructural system of different areas.
Different landscape conditions are hereby presented not only through their physical and morphological characteristics, but also through user experience.
This summary framework will help determine the main strategic targets and possible actions aimed to shape the desired development scenario.
Temperature change in Mykolaiv (1850-2022)
(1850-2022)
Source I Джерело showyourstripes.info
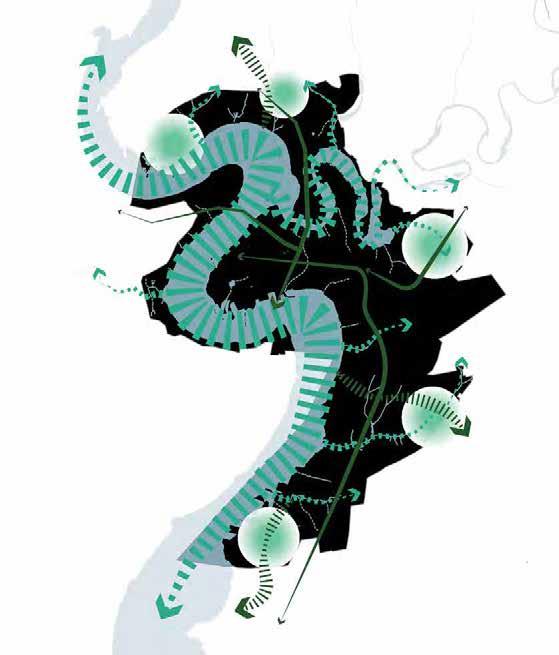
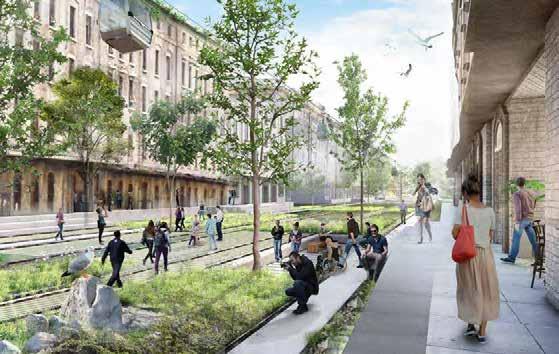
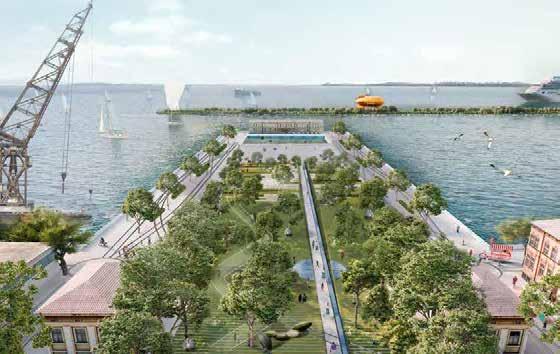
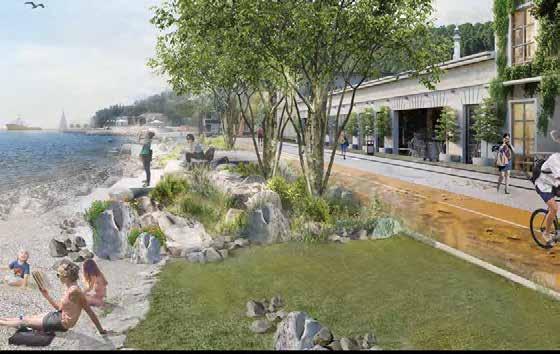
Principles for Mykolaiv Landscape Enhancement
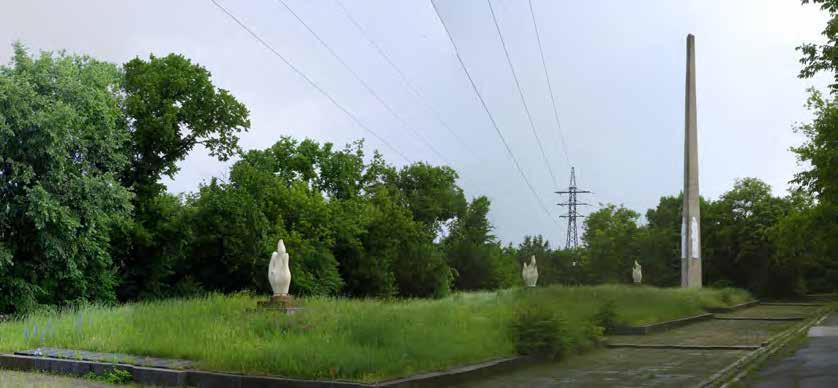
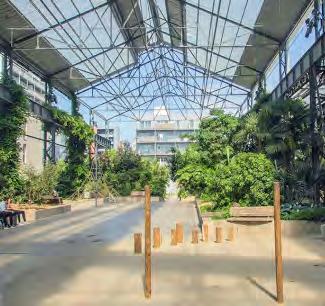
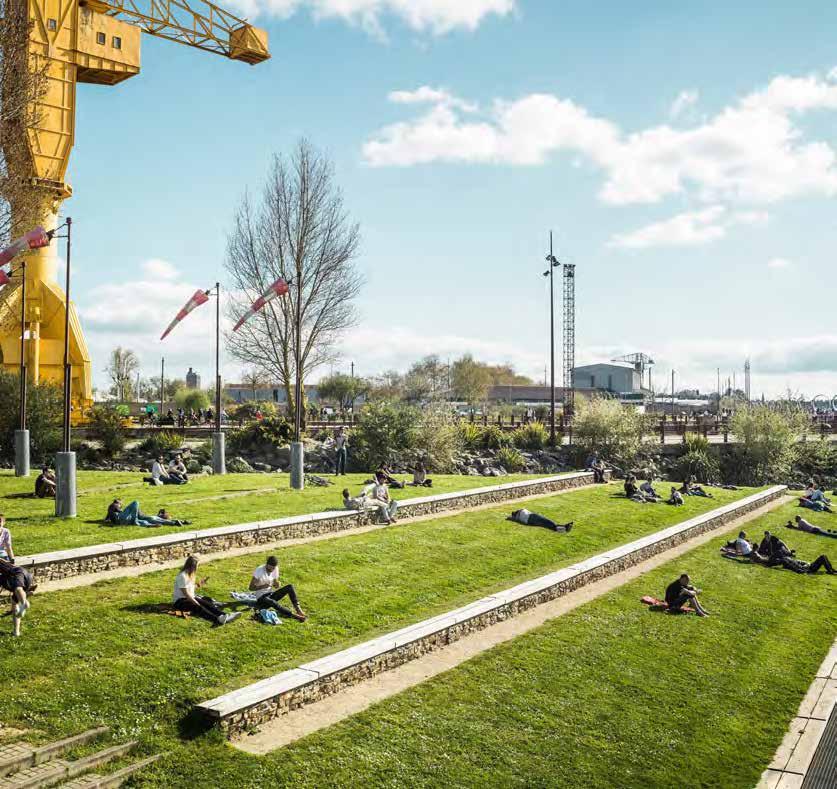
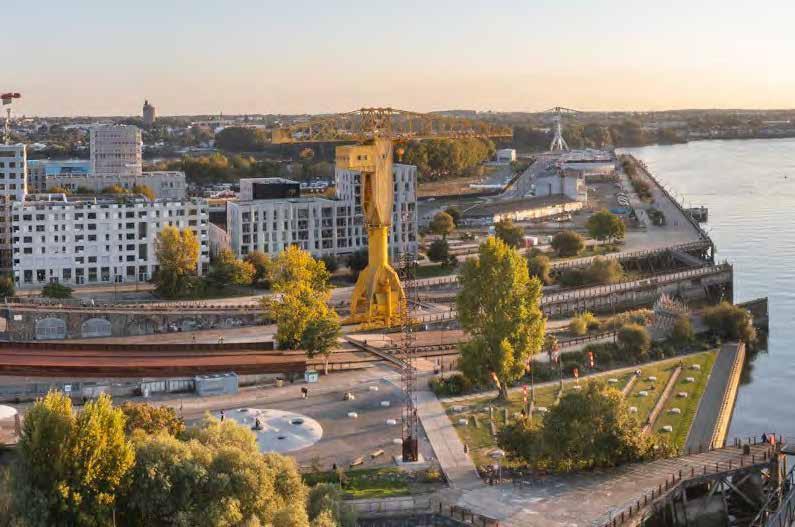
Preserved and surviving elements can be expressive spatial elements. The imprint of the industrial era
and Blue infrastructures
The post-industrial heritage can become a distinctive starting point for creating a modern urban environment.
Постіндустріальна
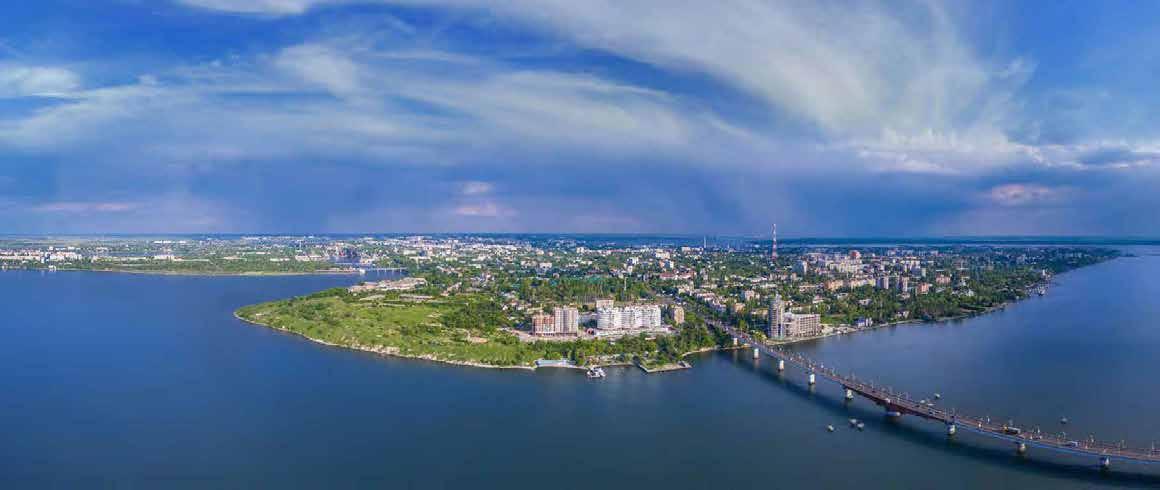
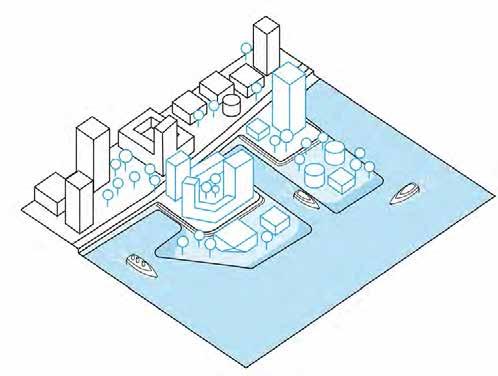
The Landscape Strategy can restore Mykolaiv's status as the “City on the Wave”, a city that is in close contact with water.
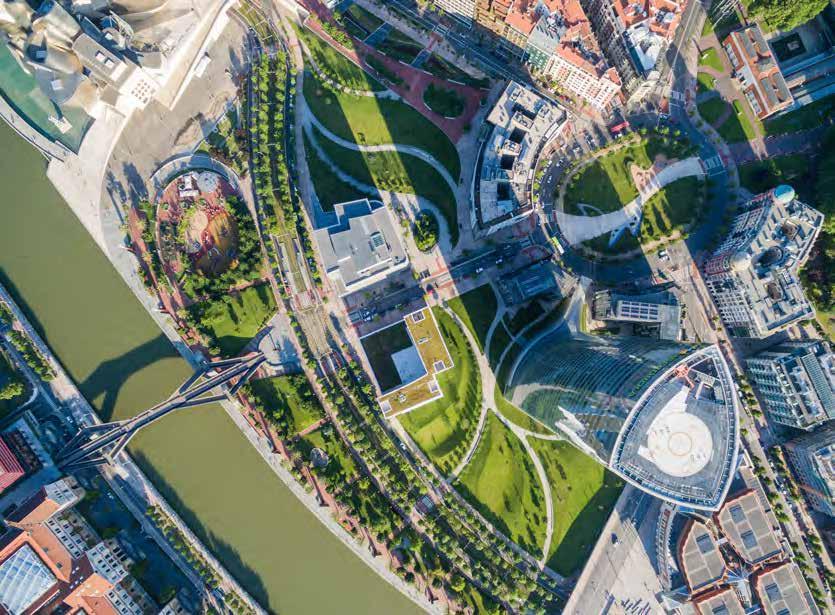
The creation of a unified framework of open green spaces will have a positive impact on the creation of ecological corridors, while allowing local inhabitants to easily access nature within the city boundaries. Green and blue spaces will allow Mykolaiv to personify its public spaces, enhancing the bond with its residents, while fostering a unique character.
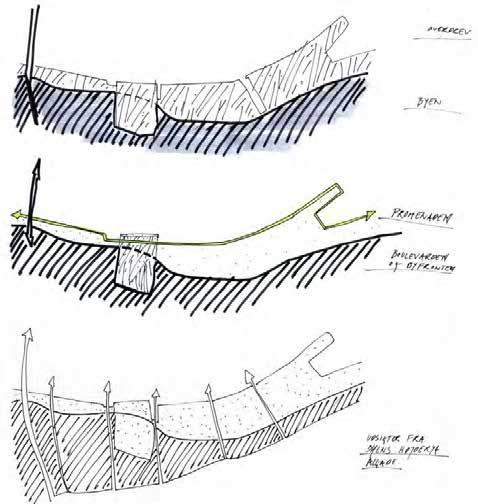
over time
Mykolaiv’s Landscape Strategy should set a structure that can change over time, adapting to the demands of modern society. Flexibility in the creation of the urban environment is important for the sustainable development of the city. Respecting the needs of today’s citizens, the framework should encourage future generations to be actively involved in choices to come.
Enhancing Urban Planning in the city of Mykolaiv
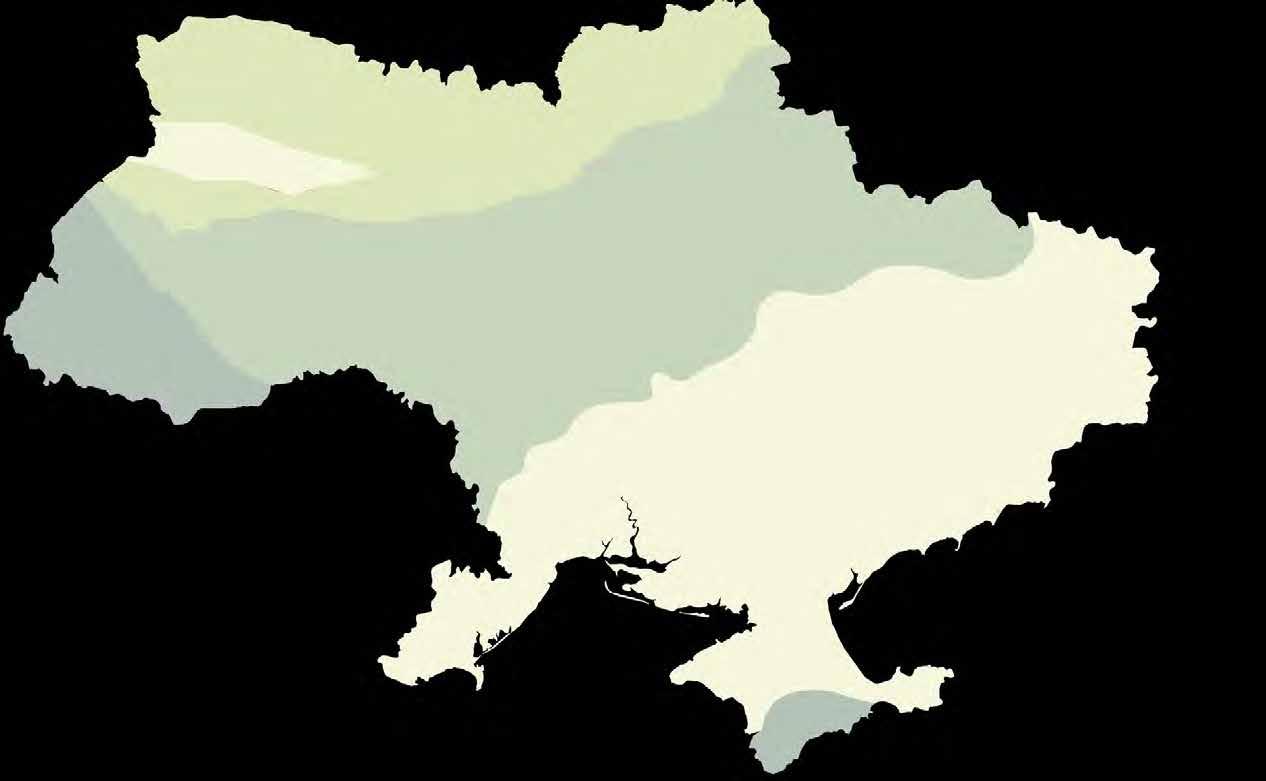
Natural system at National level
Covering an area of 603,700 sqkm (2021), Ukraine is the second largest country in Europe. Although it covers less than 6% of the continent's surface, its territory hosts about 35% of Europe’s biodiversity (Source: Convention for Biological Diversity). Such richness is due to a great variety of ecosystems - river and coastal wetlands, woods and steppes – as well as high soil fertility, and a key position in terms of migratory routes.
The country relief includes mountain ranges, uplands, and lowland plains, which are habitats for living organisms and areas of human economic activities. The biota of Ukraine comprises over 25,000 plant species and 45,000 animal species. Two key global bird migration routes run through the country; Ukraine’s migratory birds nesting sites, particularly to the south, are of international importance.
In the early 20th century, 40% of the country was steppe. Currently, the natural steppe ecosystem – considered as the last original European steppes - represents a very small percentage of the country. Mostly located in the south-eastern regions of Donetsk, these ecosystems are currently heavily affected by the conflict. Around a third (30%) of all endangered flora and fauna species listed in the Red Book of Ukraine are concentrated in this area. For this reason, Ukraine has planned to increase the area covered by nature management systems (currently about 29% of the country) and forested areas (around 16%).
Over half of the country is cultivated, and another 13% is used as hayfields and pastures. Wetlands are particularly important, with 63,000 watercourses and 1.3 million ha of protected coastal and river areas. Notably, 16% of the country is occupied by forests alternating with grasslands, swamps and saline meadows. The country has abundant soil resources in the form of fertile black earth. However, the soil suffers from pollution and erosion. Water and wind erosion cause up to 15 tons/ha of average annual soil losses.
The loss of humus and nutrients is observed in 43% of the total area. Large areas have been polluted because of economic activity. In order to preserve and establish an environmental network, Ukraine has designated territories and objects as natural reserves (natural and biosphere reserves, national parks etc.) and created conservation areas of international importance. As of 2017, the nature reserve network of Ukraine comprised 8,246 sites located on 6.6% of the country.
Charming
Enhancing Urban Planning in the city of Mykolaiv
The Southern Bug river
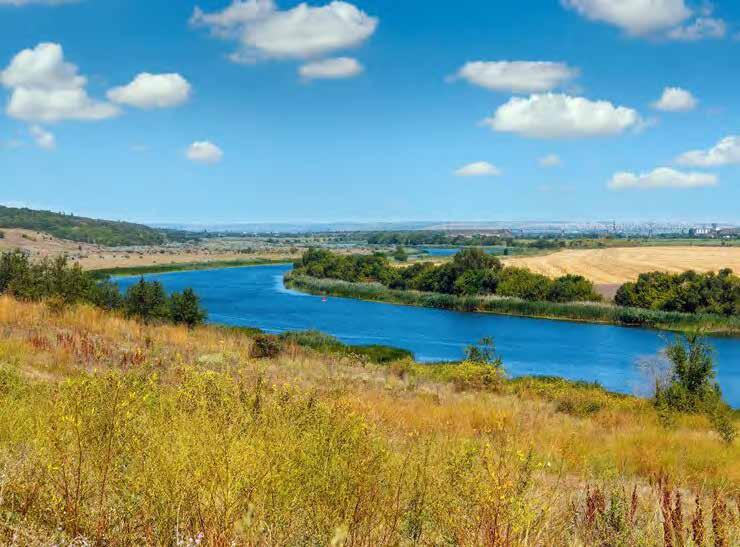
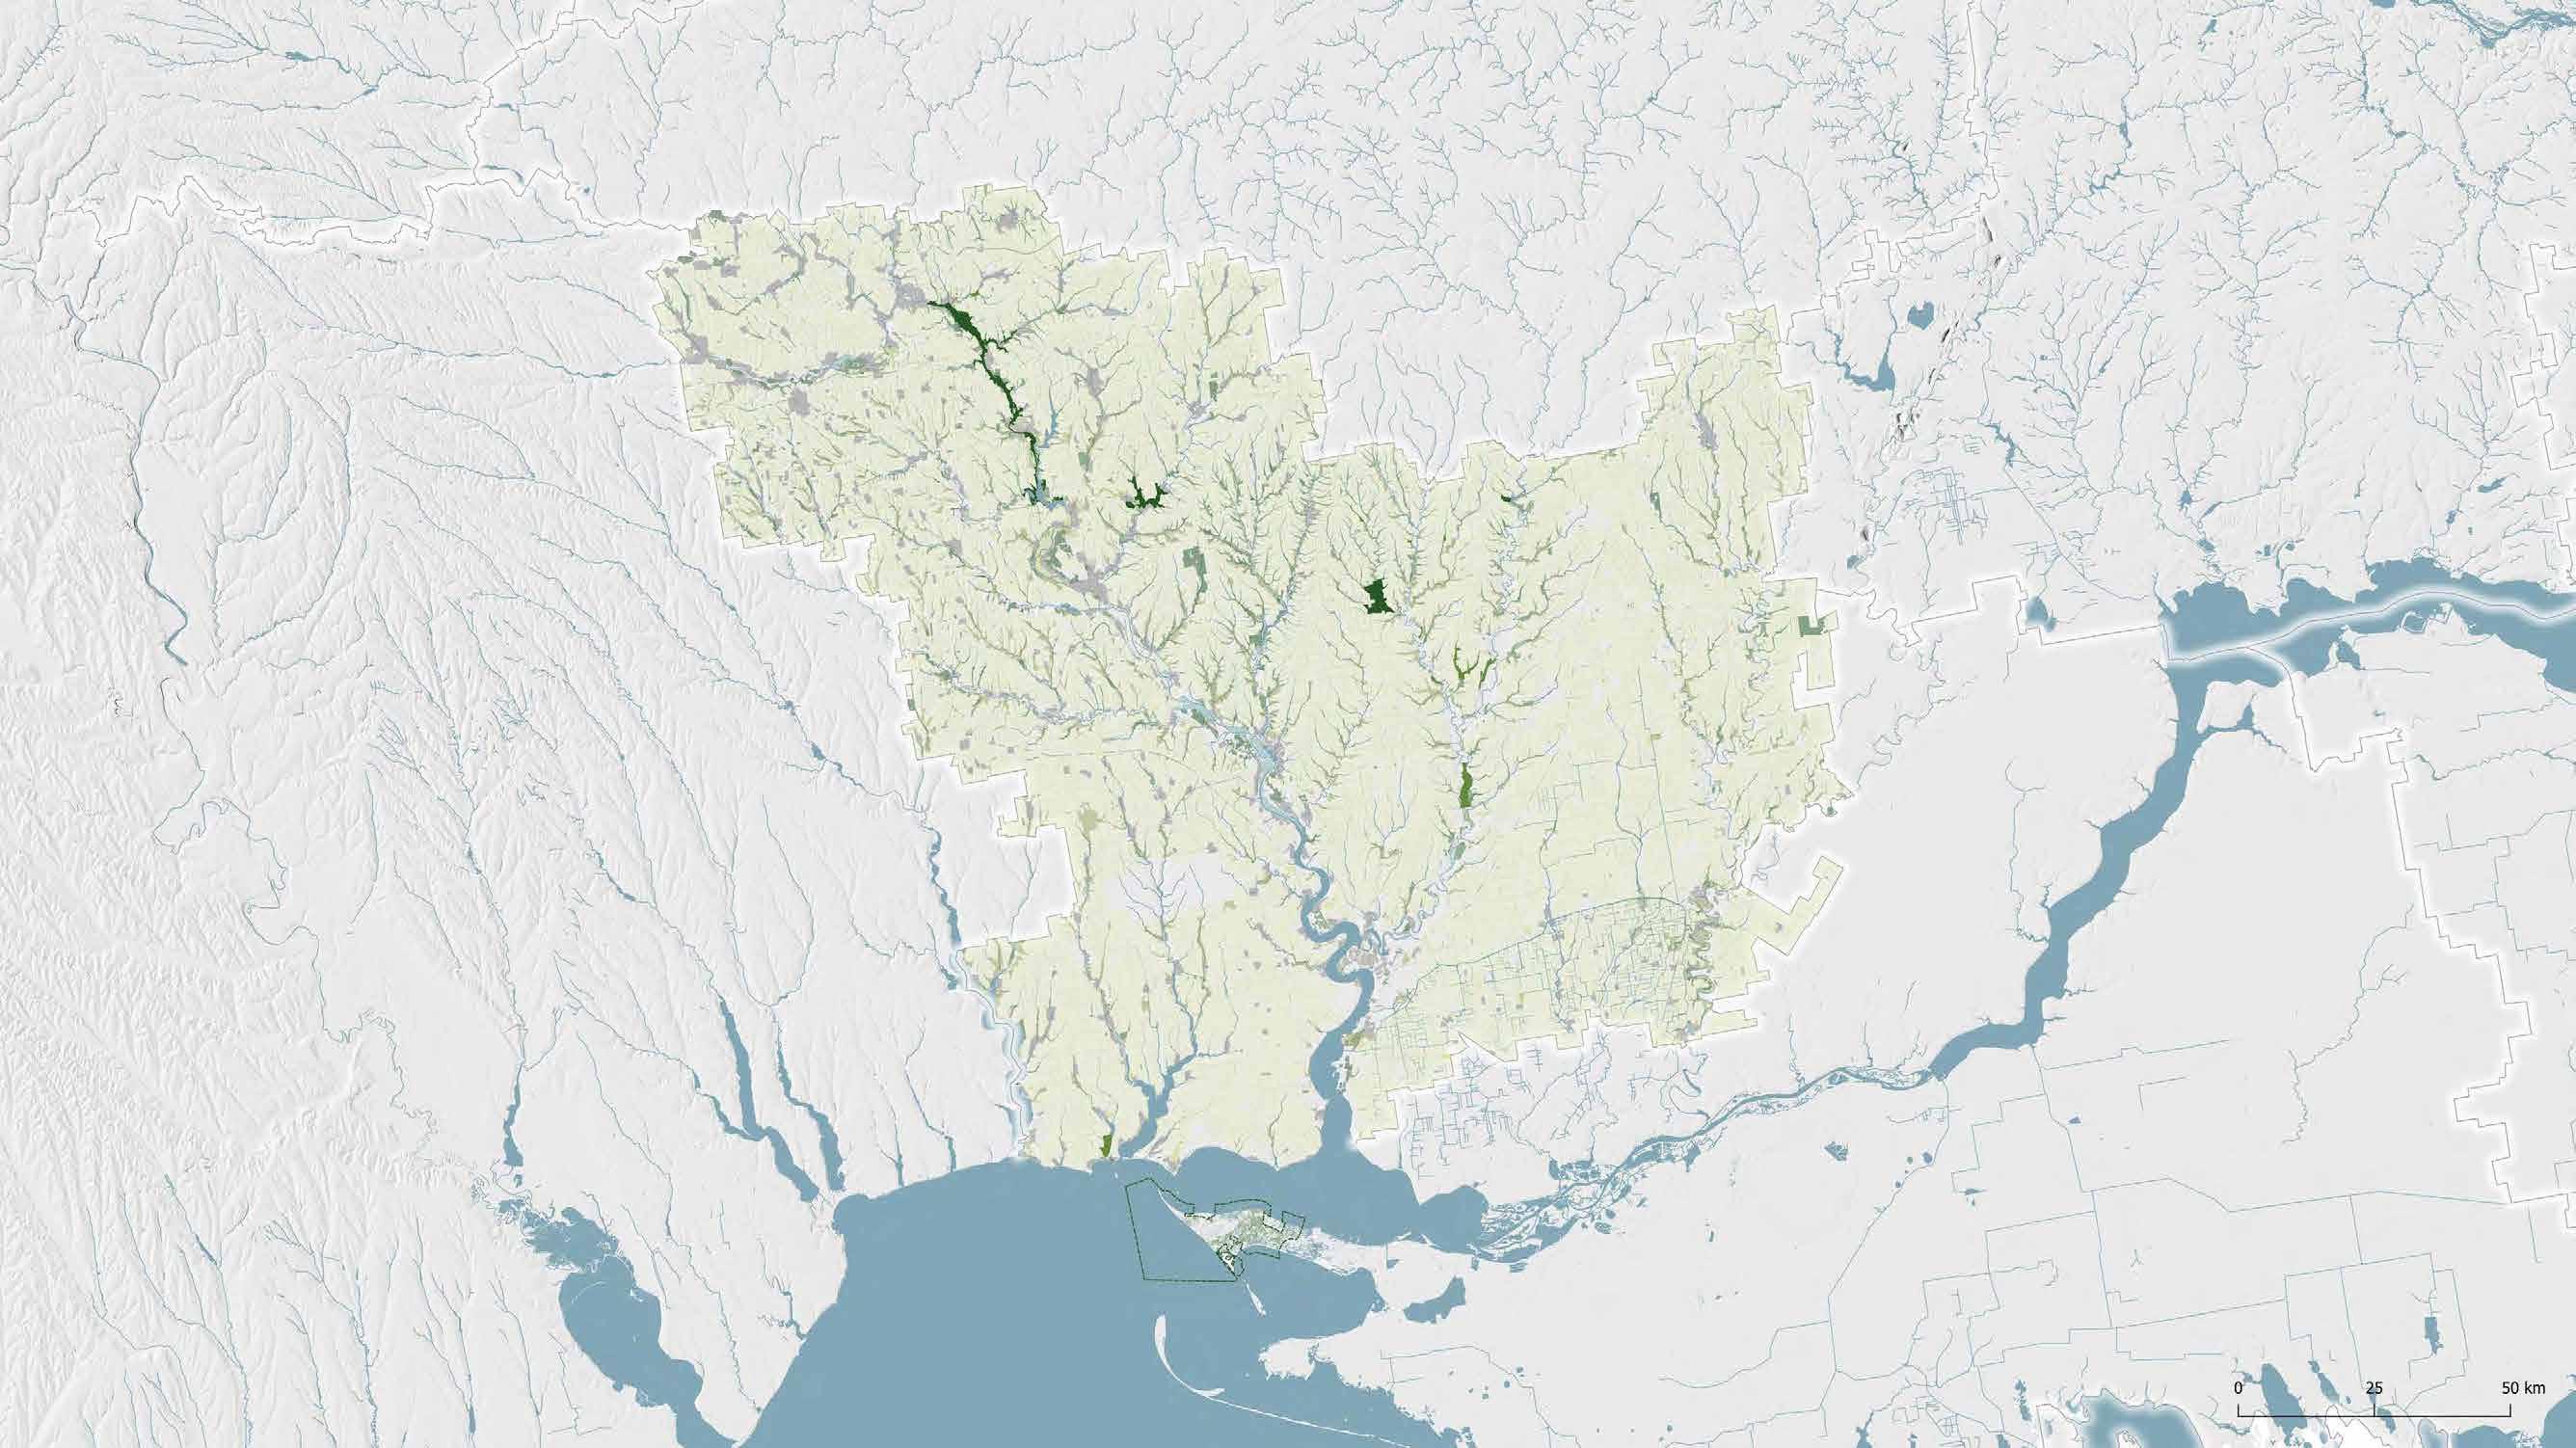
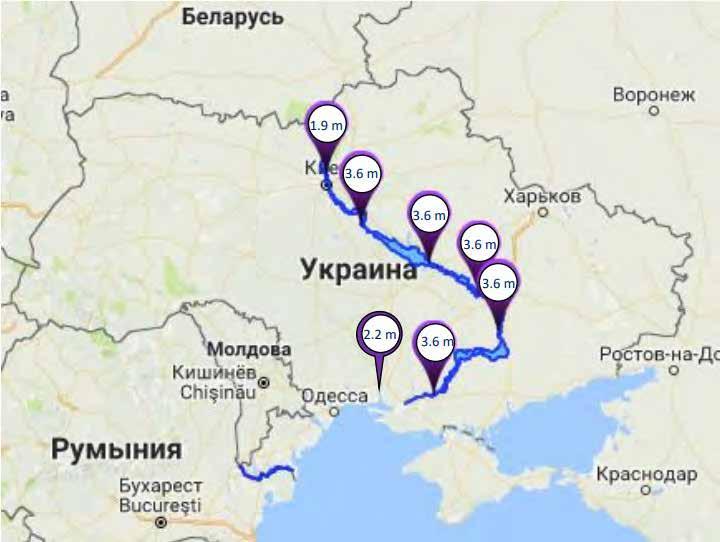
The Southern Bug River is one of the most important rivers in Ukraine. The river basin is entirely located in Ukrainian territory; it is about 800 km long, it covers an area of about 63,700 square km and the altitude difference of the river is about 328 m. Located to the south-west of the country, it originates on the Volyn-Podilska Highlands, flowing down into the Dnipro-Buzky Firth. The Southern Bug River Basin crosses the forest steppe and steppe areas of Ukraine, across two geomorphological regions – Volyn-Podilska Highlands: upper and middle parts; Dnieper Highland: lower part – on the Black Sea Lowlands. The flow of the river shows great seasonal variation; it is navigable from Voznesens'k to its estuary, close to the port of Mykolaiv.
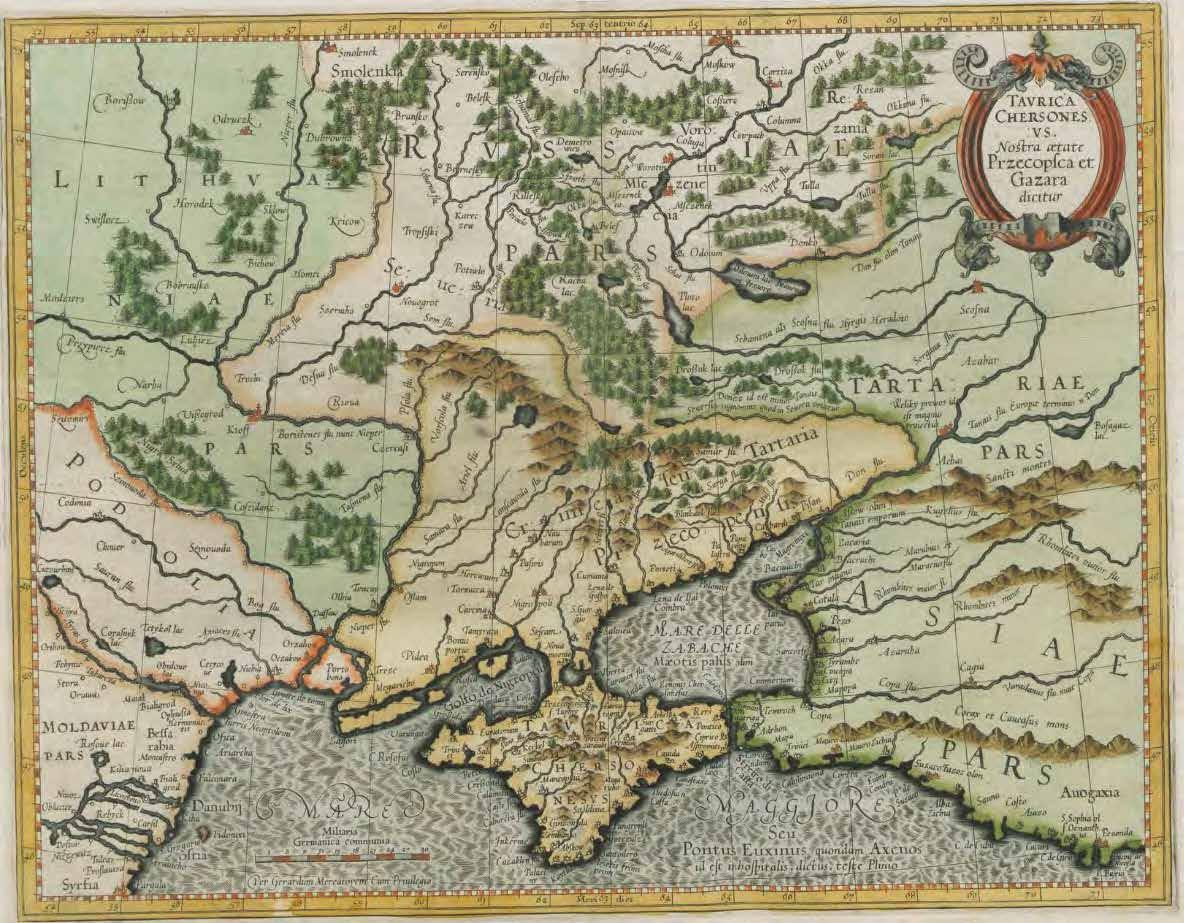
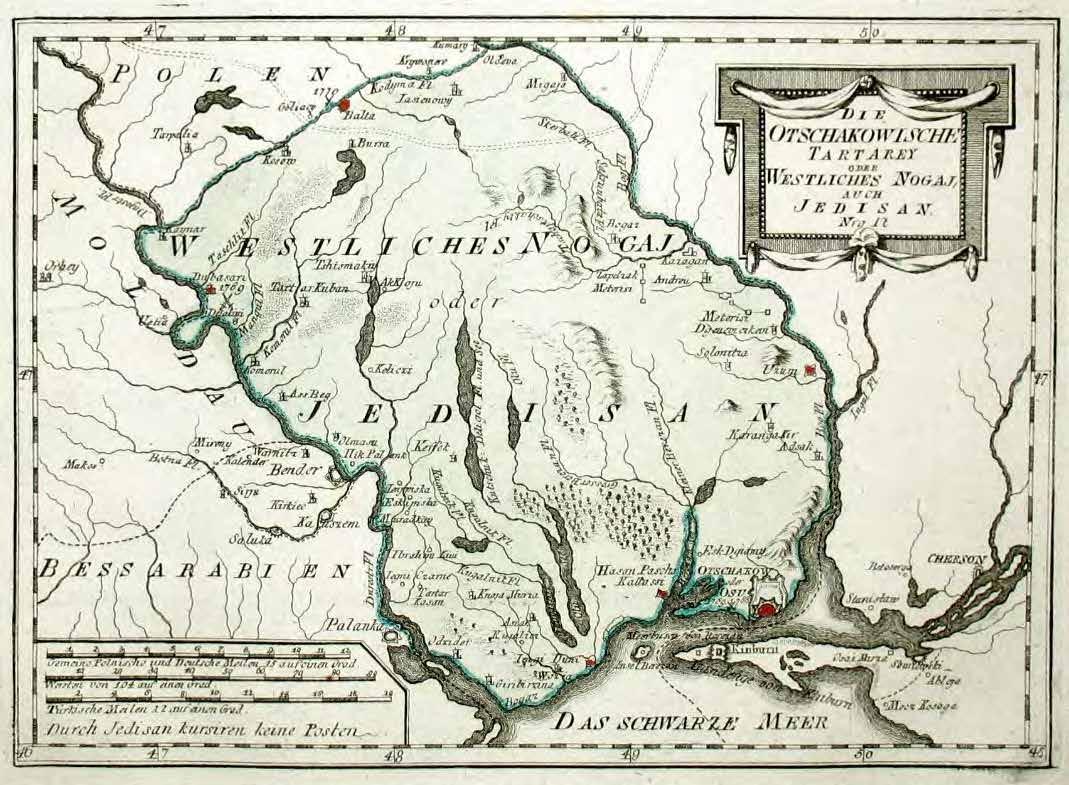
Historical maps clearly demonstrate the importance of the Southern Bug River for both the natural environment and geopolitical boundaries. In the "Taurica Chersonesus nostra aetate Przecopsca et Gazara dicitur" map of 1595, the Southern Bug river, named Bog, flows in the Podolia region shown as an independent area, which today is largely Ukrainian. On the East part of the river, in the Pars region, are represented forests and green plains, no longer present today. In the "Die Otschakowische Tartarey oder Westliches Nogaj, auch Jedisan" map of 1789, the extension of the Southern Bug river, shown as Bog Fl., flows from the Black Sea through the Ukrainian morphology. The first settlement of Mykolaiv is not yet present, however the Ingul River, on whose shores the city will develop, is represented. The mountain chains along the course of the river represented on the map are no longer noticeable today in the Ukrainian morphology.
Today, the southern Bug River faces several problems related to water pollution and water scarcity. The river comes across a substantial anthropogenic burden primarily due to a high degree of flow regulation, presence of multiple large cities, energy and industrial facilities, as well as a developed agricultural sector. Consequently, these factors contribute significantly to altering the water quality. Starting from the upstream reaches of the river, the sum of wastewater coming from the cities and settlements determine water quality in the lower parts of the river. The prevailing sectors of water consumption of the Southern Bug River Basin are agriculture (39%), industry (37%), utilities (23%). In order to assess and predict the ecological status of the river and protect the hydro ecosystem, it is necessary to implement environmental protection measures in the context of water management transformations and climate change.
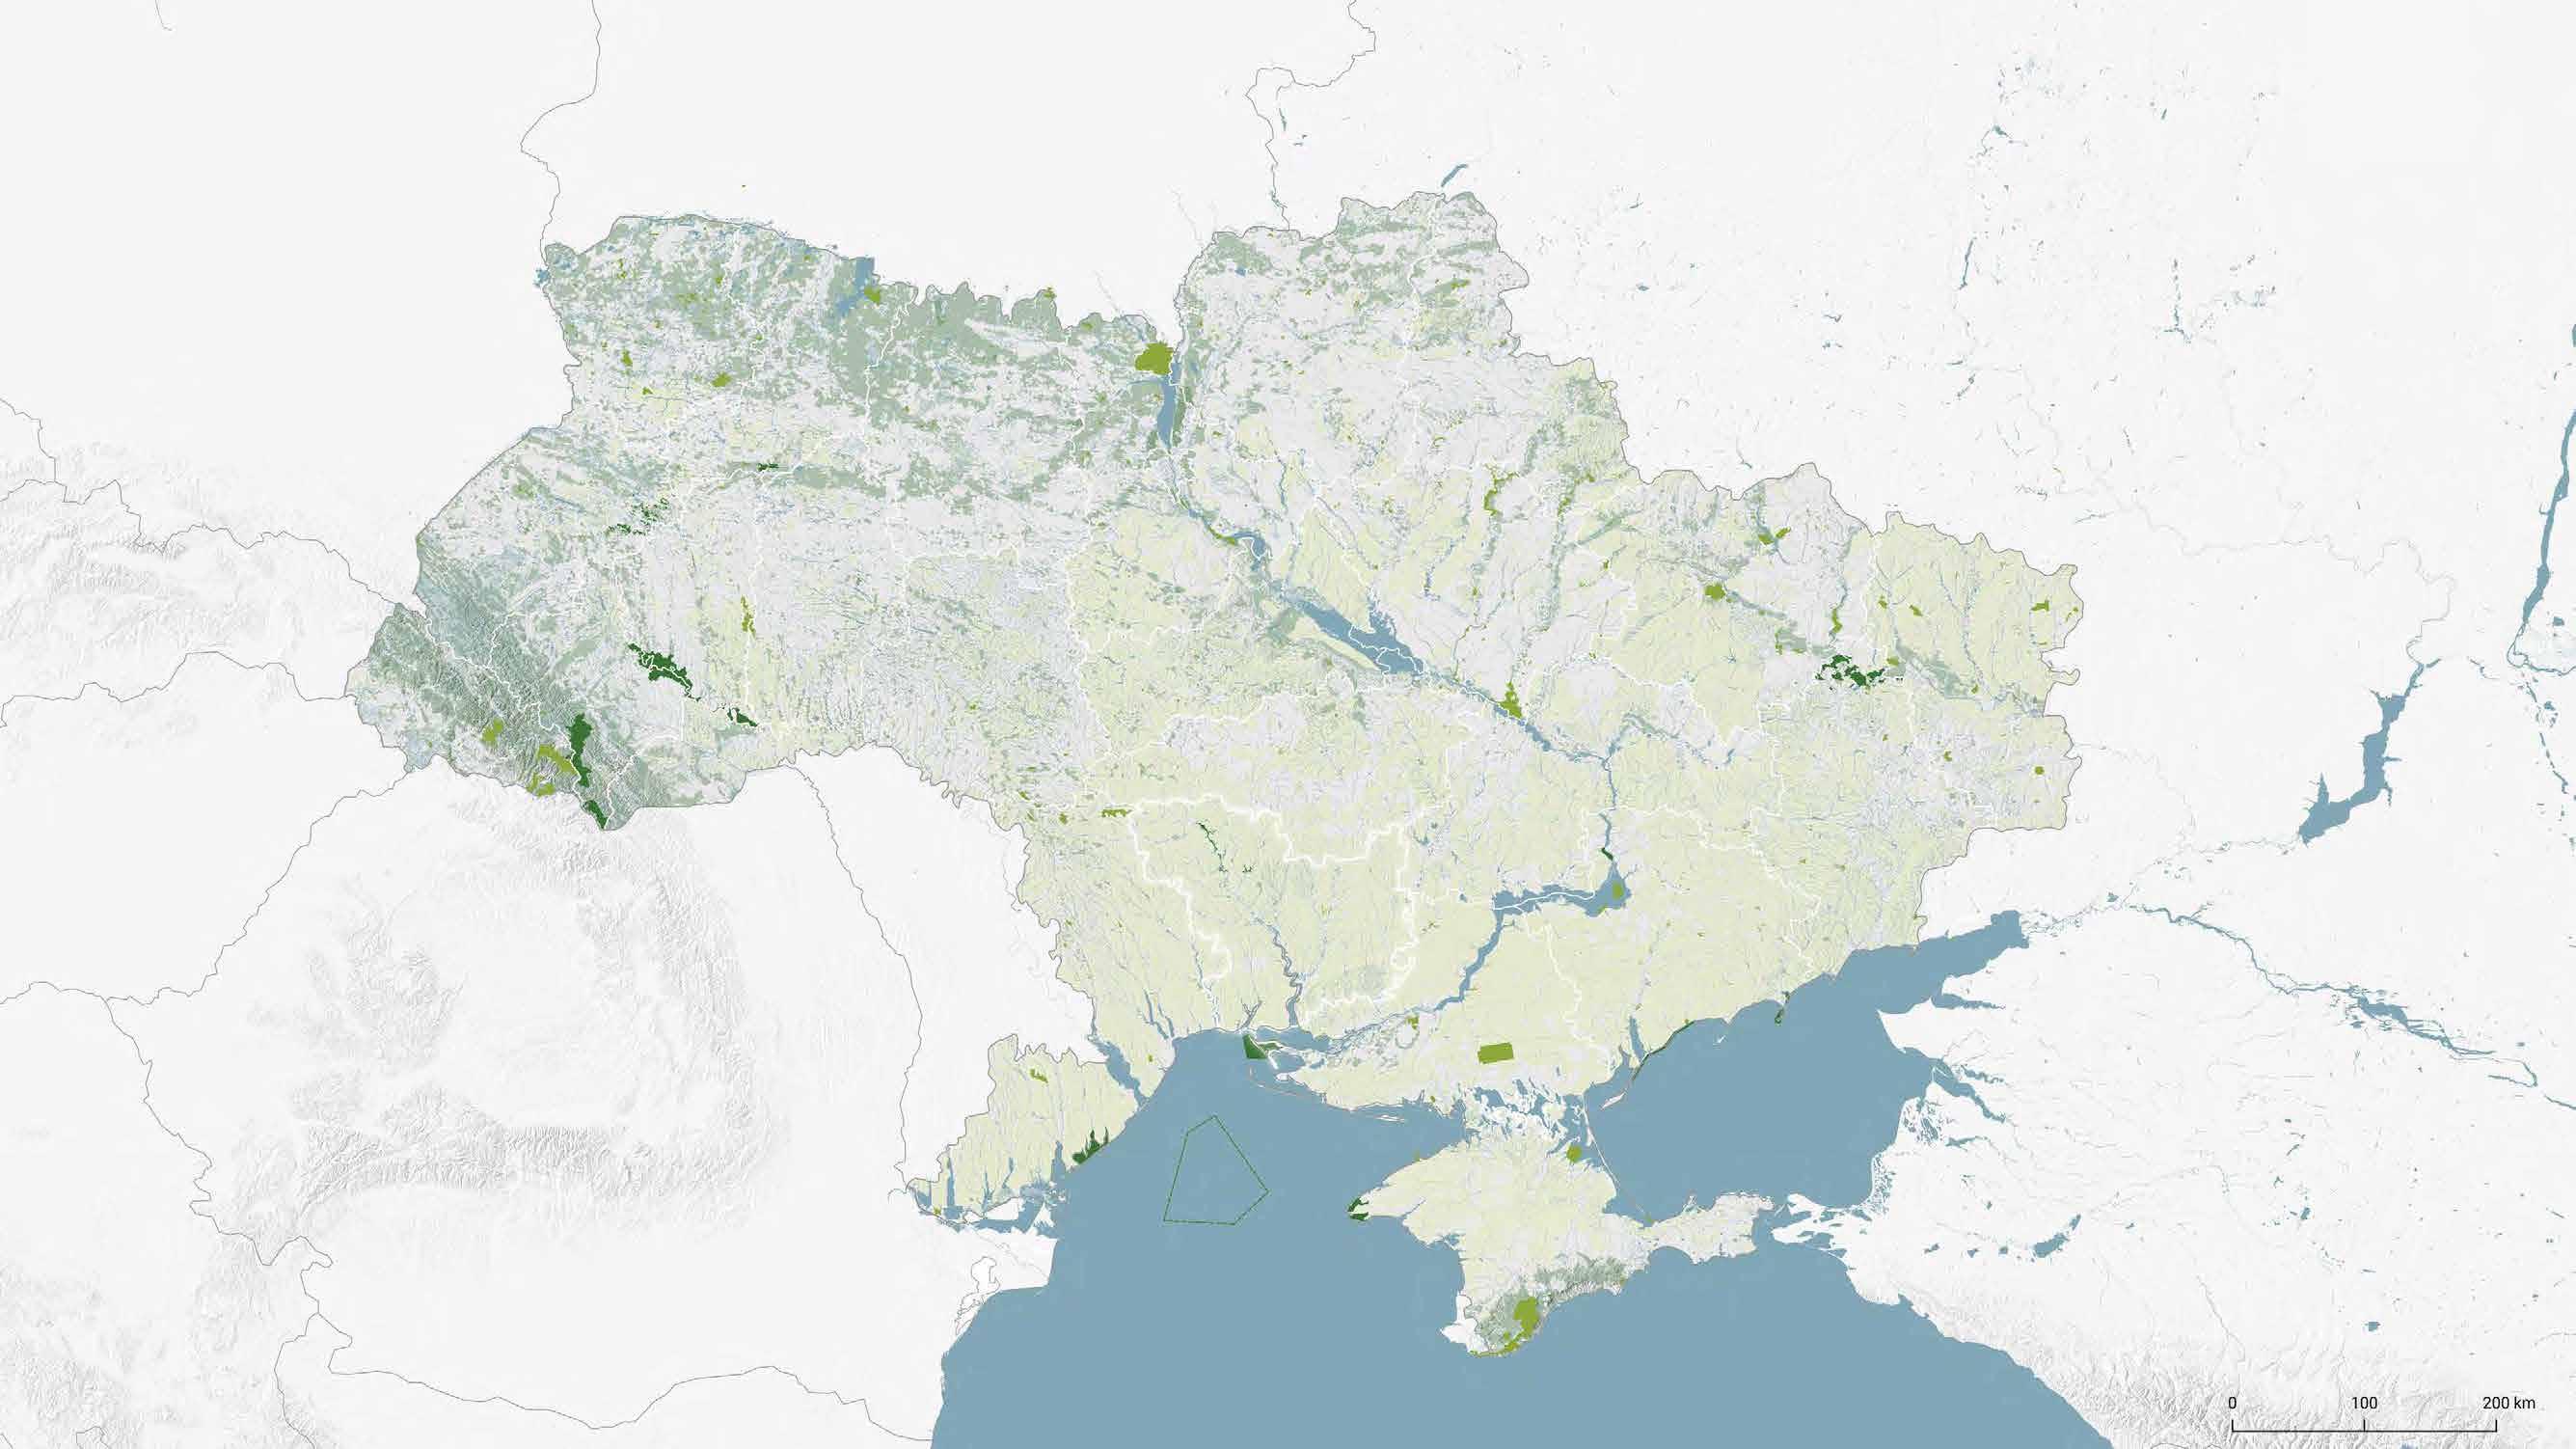
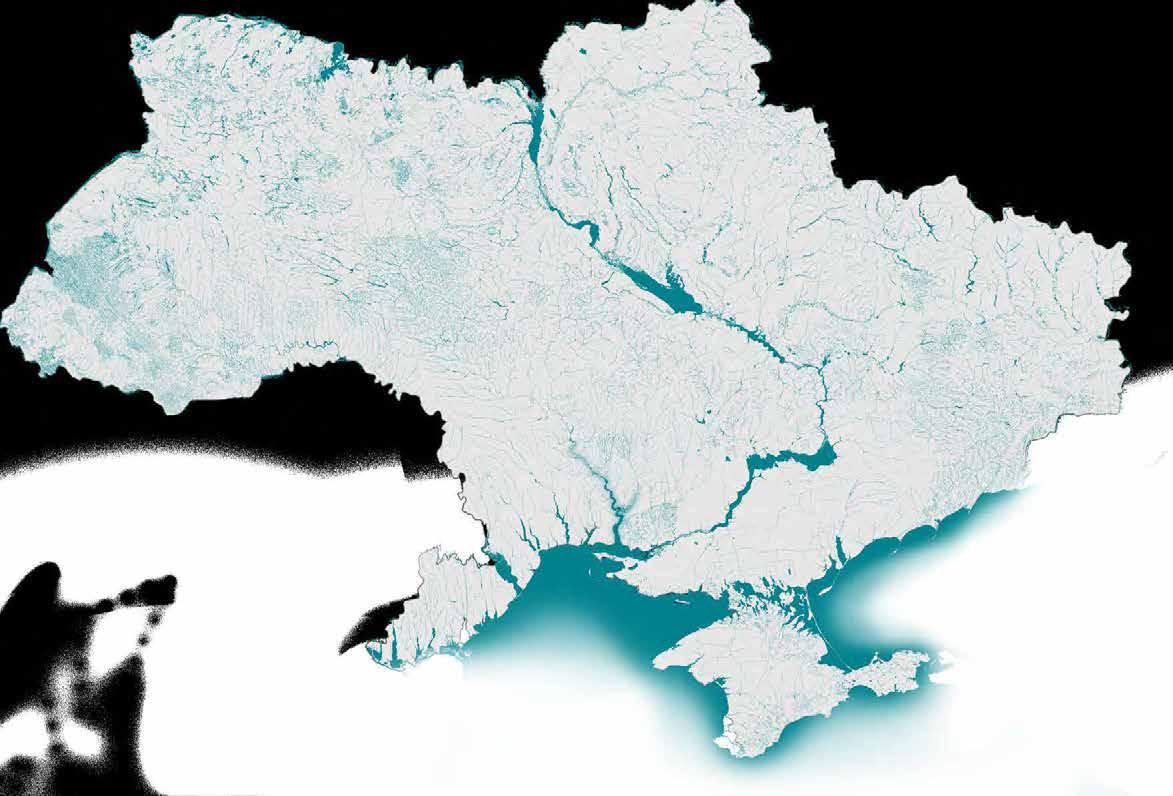
Hydrography of Ukraine and extension of Southern
Source I
Bilous O., Barinova S., Klochenko P. (2012) Phytoplankton communities in ecological assessment of the Southern Bug River upper reaches (Ukraine). Hydrobiology&Ecohydrology, volume 12(3), pp. 211-230.
Shakhman I., Bystriantseva A. (2021) Water Quality Assessment of the Surface Water of the Southern Bug River Basin by Complex Indices. Journal of Ecological Engineering, volume 22(1), pp. 195–205.
Historical map "Taurica Chersonesus nostra aetate Przecopsca et Gazara dicitur", 1595.
The map shows the location of the Southern Bug river, "Bog flu", which flows in the Podolia region. The landscape and the territory show wide green plains and forests.
«Taurica Chersonesus nostra aetate Przecopsca et Gazara dicitur», 1595.
Die Otschakowische Tartarey oder Westliches Nogaj, auch Jedisan, 1789.
Historical map showing the extension of the Southern Bug river, Bog Fl., from the Black Sea through the Ukrainian morphology. The Ingul River is illustrated; Mykolaiv will be founded on its shores.
«Die Otschakowische Tartarey oder Westliches Nogaj, auch Jedisan», 1789.
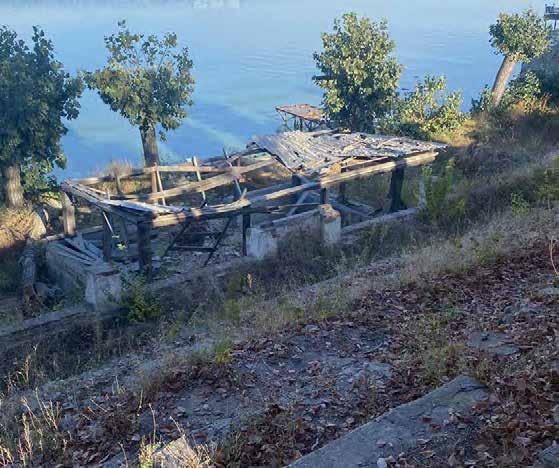
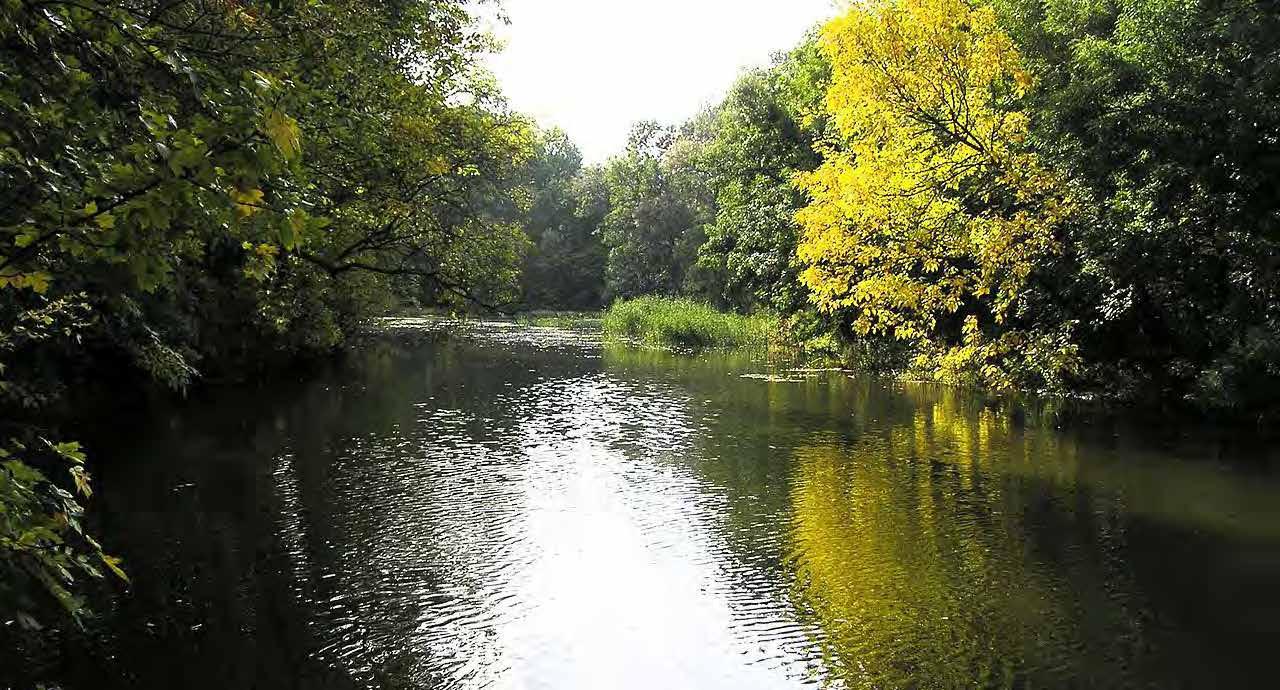
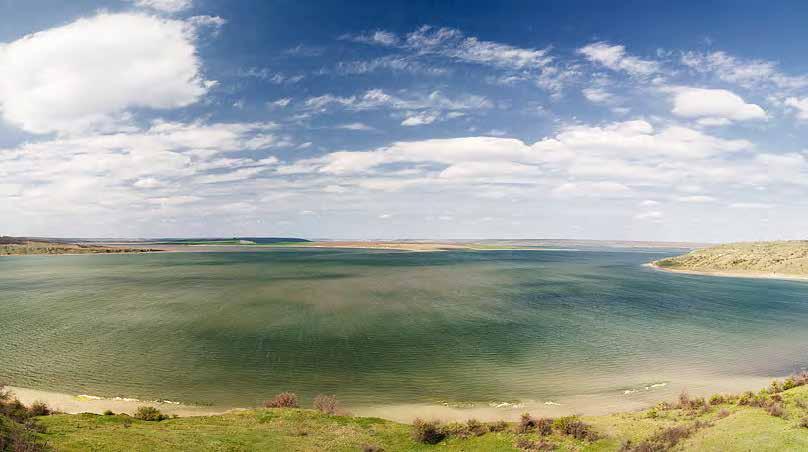
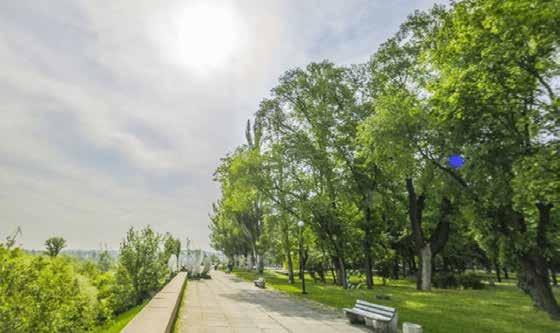
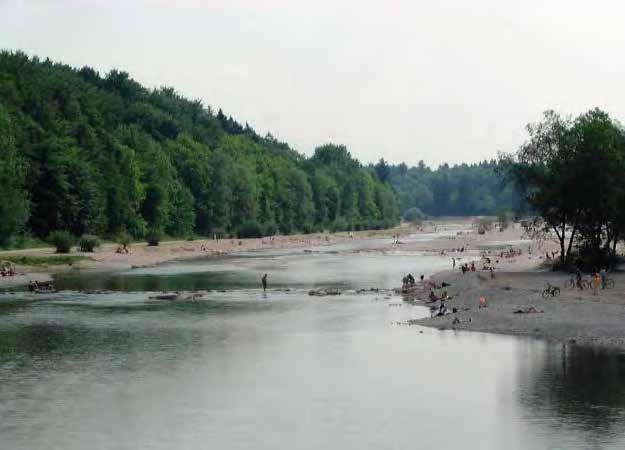
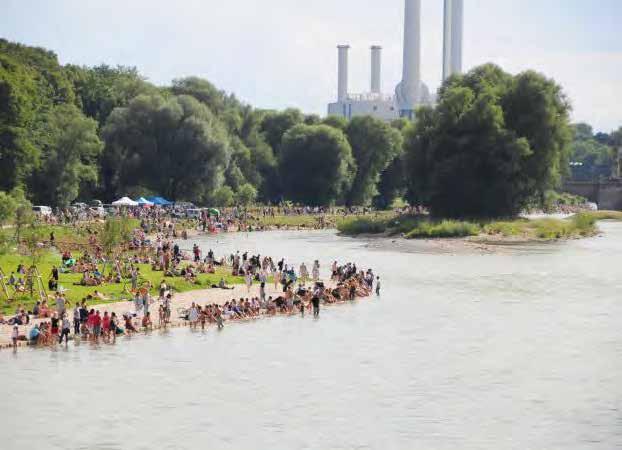
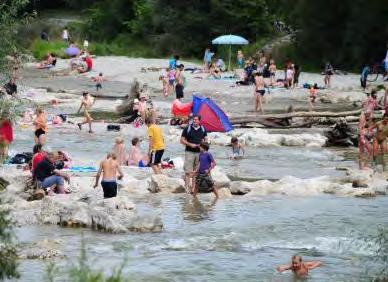
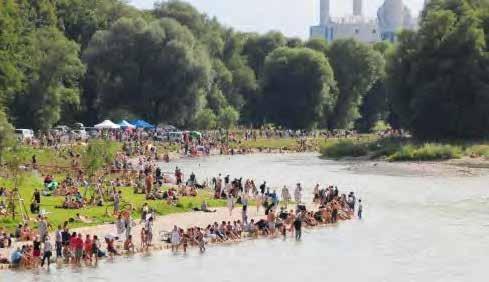
Summertime along the Southern Bug river.
Different uses of Southern Bug river in Mykolaiv, Charlie Freeman
Enhancing Urban Planning in the city of Mykolaiv
The Mykolaiv region
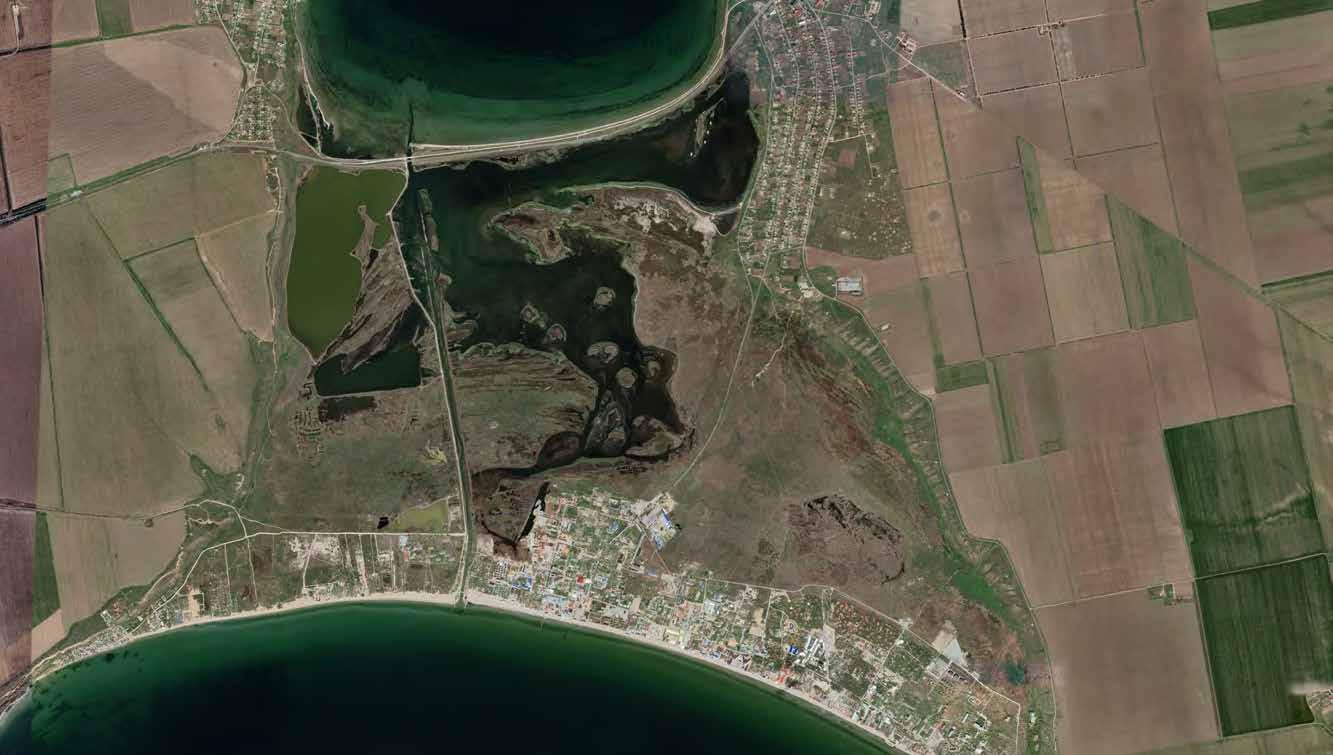
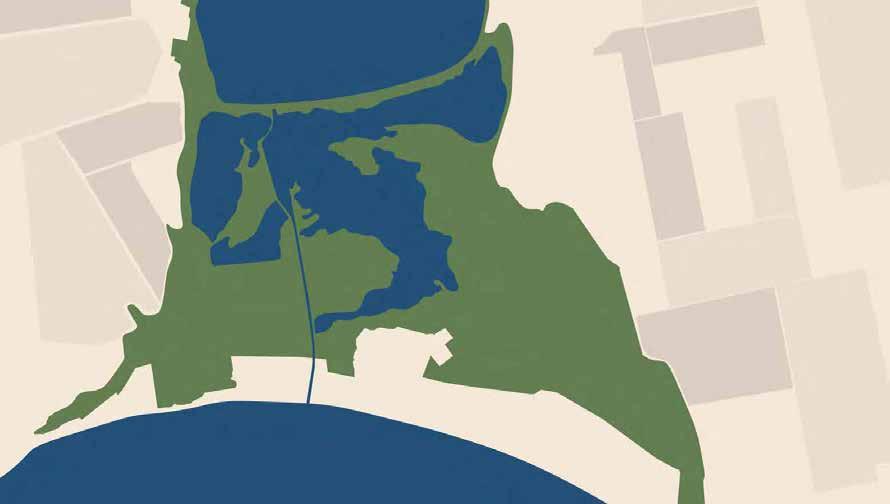
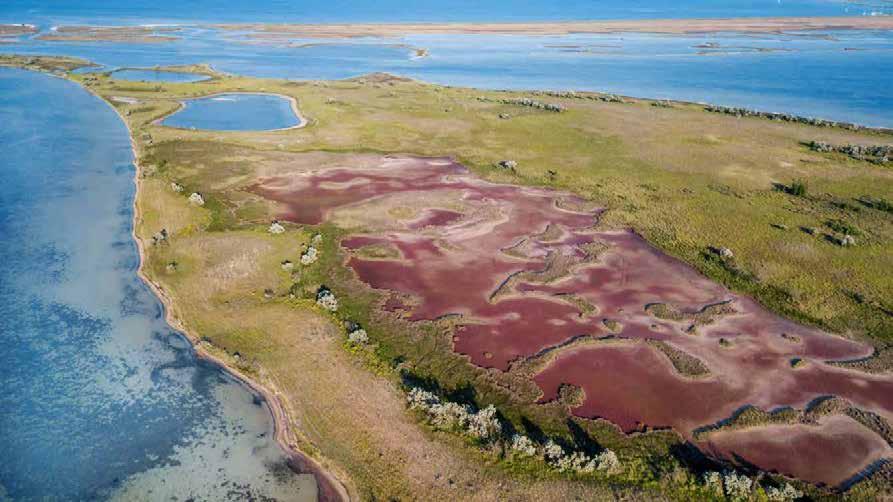
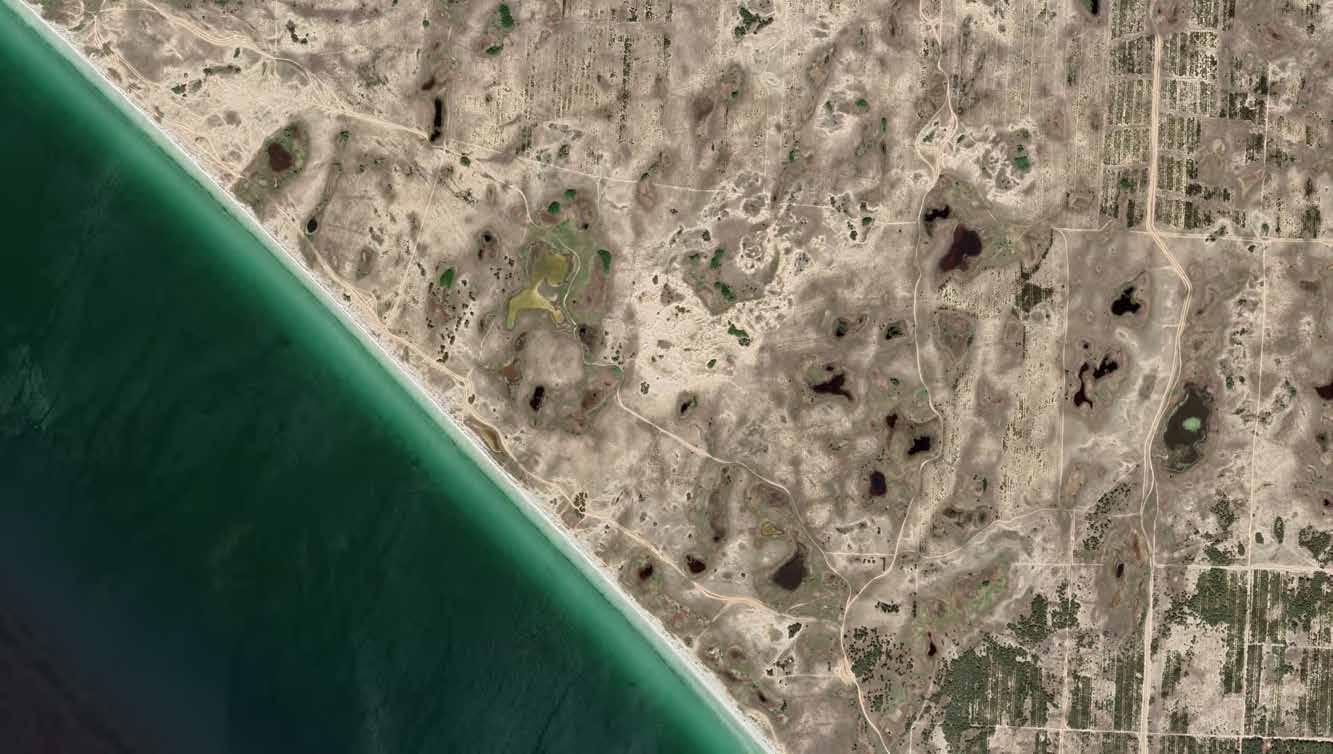
The Mykolaiv region lies within two physical-geographical zones: forest-steppe and steppe in the basin of the southern Bug River downstream. For the most part, the territory belongs to the Black Sea lowlands; the northern part is characterised by the presence of gullies and valleys known as 'Balka'. The wide space in between is characterised by the presence of rounded hollows, which fill with water in spring and form temporary lakes.
The Mykolaiv region includes 3 national parks (Buzsky Gard, Yelanetskiy steppe and the Biloberezhia Svyatoslava National Nature Reserve), 2 regional parks (Pryingulskiy and Tiligul) and numerous nature reserves such as the Solonetz-Tuzly pond and the Trykraty forest.
The regional and national parks of the Mykolaiv region show the rich variety of landscapes that characterise its territory: Forests represent green oases and biodiversity hotspots in the arid steppe. Along waterways, they are characterized by the presence of oaks, birches, hornbeams, and colonies of fungi and lichens that occupy the rocky granite outcrops and undergrowth. River parks create wetlands and marshes because of their meandering course due to the flat topography that characterizes the Mykolaiv region. They include petrophilic bryophyte species such as Mannia fragrans and hydrophytic species such as Fissiden crassipes.
Steppe grasslands of the Yelanetskiy park consist of a system of limestone gorges and ravines. The vegetation consists of steppe phytocoenoses (class Festuco-Brometea), true grasslands and steppes (class Molinio-Arrhenateretea) and fragmentary coastal and aquatic communities (class Phragmito-Magnocaricetea), aquatic phytocoenoses (classes Lemnetea, Potametea), shrub communities (class Rhamno-Prunetea) and forests (classes Querco-Fagetea), including artificial forests (class Robinietea). 'Liman', an Ukrainian term referring to the wide mouths separated from the Black Sea by long sandy shores, such as the Tiligul estuary and the Solonetz Tuzly pond; these are wetlands of naturalistic value and nesting habitat for waterfowl. Brackish waters lap the estuarine sands, often covered with black silt and therapeutic mud. Sandy dune coasts have gradually replaced the original steppe, as a result of human intervention, and they alternate with freshwater and saltwater ponds. The vegetation consists of salt meadows and orchid.
Arrhenateretea».
«Rhamno-Prunetea»
«Querco-Fagetea»,
National and regional parks in the Mykolaiv region
In order to complete the analytical phase, two main documents were transposed and summerised as follows:
1. Mykolaiv Region Development Strategy up to 2027.
2. Regional report on the state of the environment in the Mykolaiv region in 2021.
Mykolaiv Region Development Strategy for the period up to 2027
Climate
The climate of the Mykolaiv region is temperate continental. Summer is hot, windy, with frequent "dry" periods; average temperature of the warmest month (July) +23 to +21°C. Winter is not snowy, relatively cold; the average temperature of the coldest month (January) from −3 to −5°C. Annual rainfall ranges from 300-350 mm in the south to 450 mm in the north. Maximum precipitation in summer, falls mainly in the form of showers. The growing season averages about 210 days.
Hydrographic system
In hydrological terms, the region belongs to the Black Sea artesian basin and partly in the northern part to the Ukrainian crystalline massif.
The main rivers are the Southern Bug, which crosses the region from northwest to southeast, the Ingul and Kodyma (left tributaries of the Southern Bug), and the Ingulets (right tributary of the Dnipro). Many ponds and reservoirs have been constructed within the region. Rivers and ponds are used mainly for irrigation of agricultural crops and fish farming.
Agricultural system
The territory of Mykolaiv region is characterized by intensive agriculture and the agricultural production has a high degree of development. The total area of agricultural land exceeds 2.0 million hectares (about 5% of the area of Ukraine) since agricultural development of the territory of the Mykolaiv region is extremely high (81.6%). Therefore, all lands need protection from negative processes, pollution, and deterioration of the ecological state.
Afforestation
Forests of Ukraine occupy about 15.9% of the country and host more than 30 tree species, among which pine, oak, beech, spruce, birch, alder, ash, hornbeam, spruce dominate. The regions with the largest forest area include Transcarpathian, Ivano-Frankivsk, Rivne, Volyn, Chernihiv regions, the lowest forest cover in Zaporizhzhya, Nikolaev, Kherson regions.
Work on afforestation of land unsuitable for agricultural use continues. Since the beginning of 2019, 2124 hectares of forests have been recreated by forestry enterprises of Mykolaiv region.
Nature Reserve Fund
In the Mykolaiv region, 141 objects of the nature reserve fund were created, of which 8 are objects of national importance, including a nature reserve, two national natural parks, a zoo, a forest reserve, and natural monuments, 133 are of local importance, including five regional landscape parks, landscape, forest, hydrological reserves, natural monuments, parks-monuments of garden and park art. The actual area of the nature reserve fund is 75.5 thousand hectares, or 3.07% of the area of the region.
The share of protected areas in the region is insufficient and remains much less than in most regions of Ukraine. Nature conservation has more socio-economic efficiency than the budget, and affects the image, environmental stability of the region.
Tourism
Mykolaiv region has a strong recreational and tourism potential, favorable geographical location, historical and cultural monuments, unique landscapes, rich heritage, invaluable recreational resources and has all the conditions for successful development of tourism and recreation.
Regional report on the state of the environment in the Mykolaiv region in 2021
The Regional Report on the State of the Environment in Mykolaiv Oblast in 2021 was prepared by the Department of Ecology and Natural Resources of the Mykolaiv Regional Military Administration in accordance with the requirements of Article 25 of the Law of Ukraine "On Environmental Protection".
The report contains generalized and analytical materials on the use, protection and reproduction of the region's natural resources, state environmental monitoring, state policy and control in the field of nature protection and nature management, implementation of environmental and economic reforms, enhancement of regional and national environmental programs, results of the state environmental assessment, production waste management, radiation safety, impact of environmental quality on public health, environmental awareness, education, public awareness, and public participation.
State policy and measures to improve and restore the state of the air
One of the most urgent tasks is the problem of preserving, improving, and restoring the state of atmospheric air favorable to life. The legal protection of atmospheric air in Ukraine is based on an extensive system of regulations of different legal force. The legal basis for the use and protection of atmospheric air is the Constitution of Ukraine, which in Article 13 proclaims the right of ownership of the Ukrainian people to atmospheric air, as well as the right to use it.
The provisions of the Constitution are fundamental and general to those contained in environmental laws, primarily the Law of Ukraine "On Environmental Protection" of 25.06.1991 No. 1264-XII.
Climate change
Climate change is possibly the most important and complex environmental problem that humanity has faced in the last century. Ukraine signed the United Nations Framework Convention on Climate Change in June 1992, ratified it in October 1996, and became a Party to the Convention in August 1997.
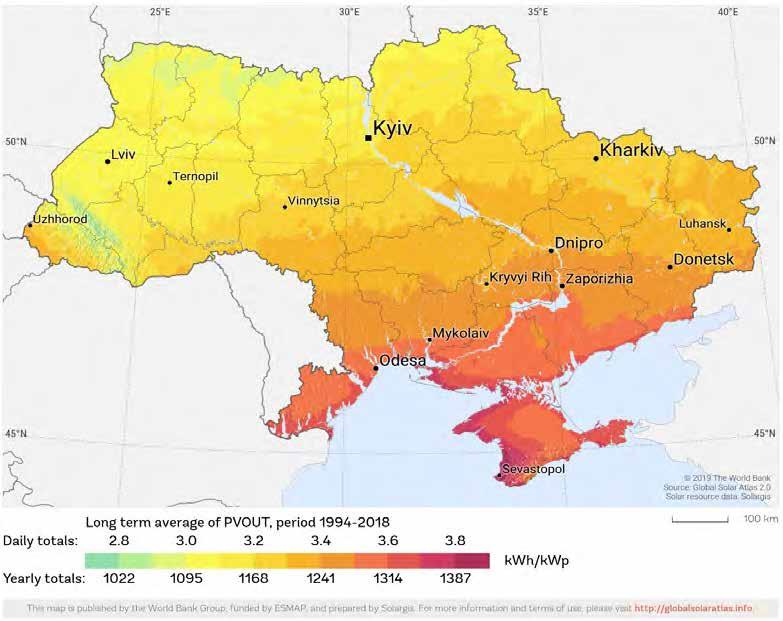
Renewable energy
According to the conclusions of the intersectoral scientific and technical center of wind energy of the National Academy of Sciences of Ukraine, part of the territory of the Mykolaiv region, which has a high wind energy potential, is estimated at 10%, or 2500 square meters. As part of the implementation of the development of the energy industry, solving the problems of increasing the efficiency of using existing energy sources, optimizing the fuel and energy balance, applying energy saving measures, improving environmental safety and to promote the use of alternative and renewable energy sources and reduce natural gas consumption in the Mykolaiv region, solar power plants are being built.
State policy and measures to improve the state of water bodies
The main directions of the state policy of Ukraine in the field of environmental protection, use of natural resources and environmental safety are defined in Article 16 of the Constitution of Ukraine, according to which the duty of the state is to ensure environmental safety and maintain ecological balance in Ukraine, overcoming the consequences of the Chernobyl disaster. State policy in the field of ecology, as well as any other sphere, is based on a system of legislation, acts and regulations. The main goals that should be achieved in the field of public water management are:
• overcoming the existing water and environmental threats in the country;
• creating favorable conditions for sustainable, environmentally safe water use;
• reproduction and protection of all water resources in the country, taking into account their transboundary importance, as well as aquatic ecosystems.
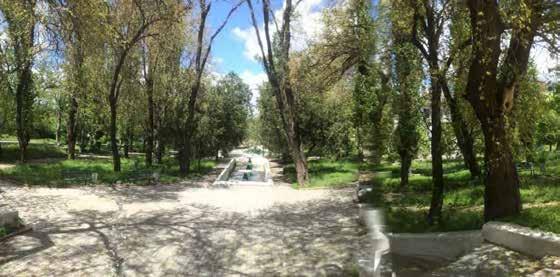
Photo by Peter and Paul Canyon
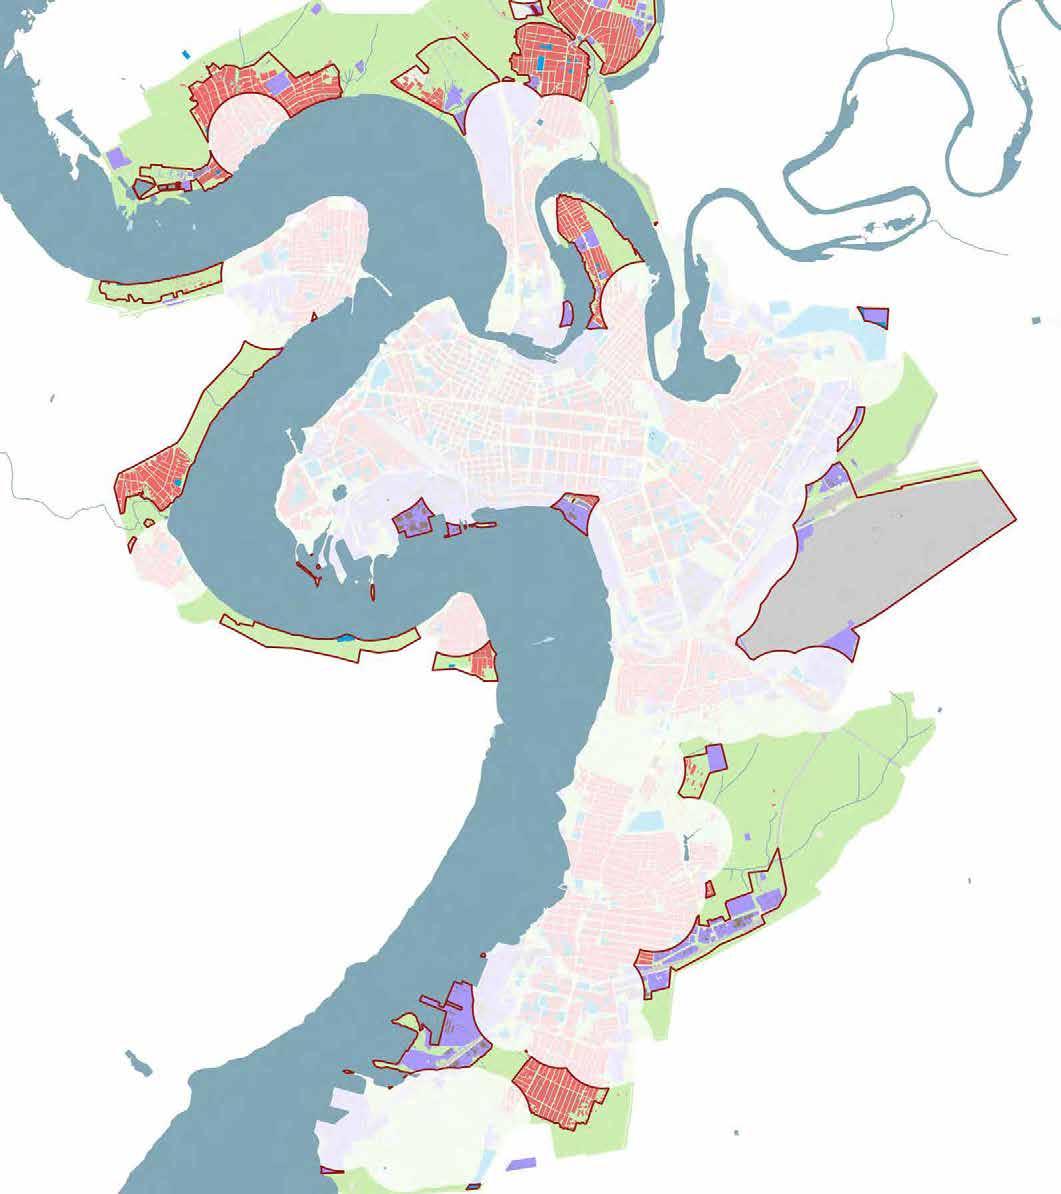
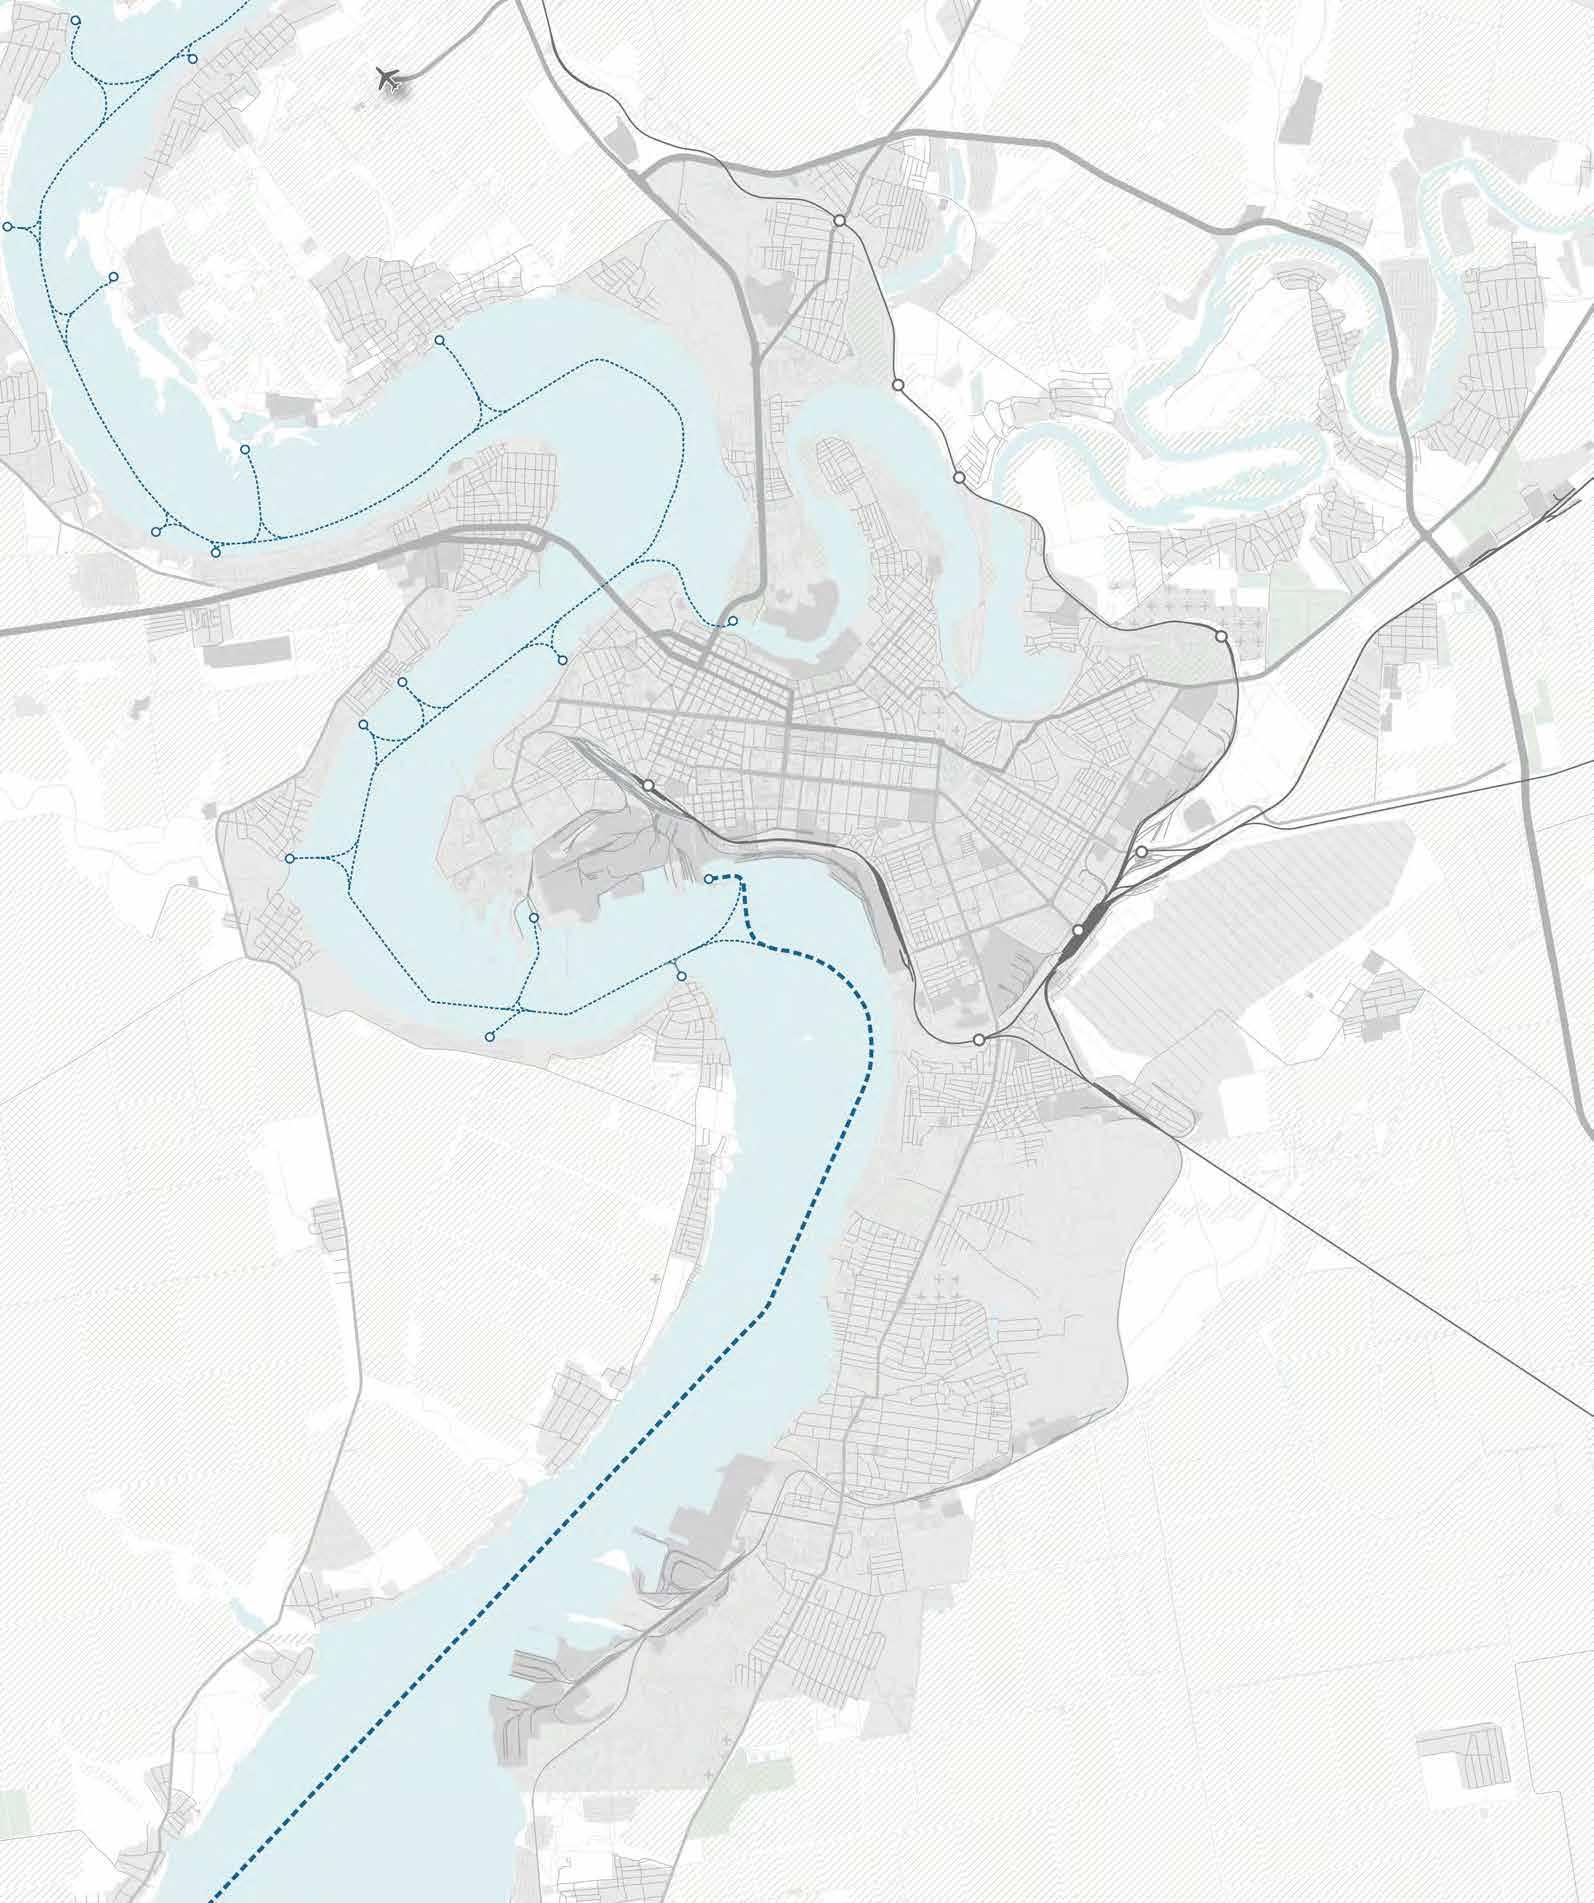
The municipal territory
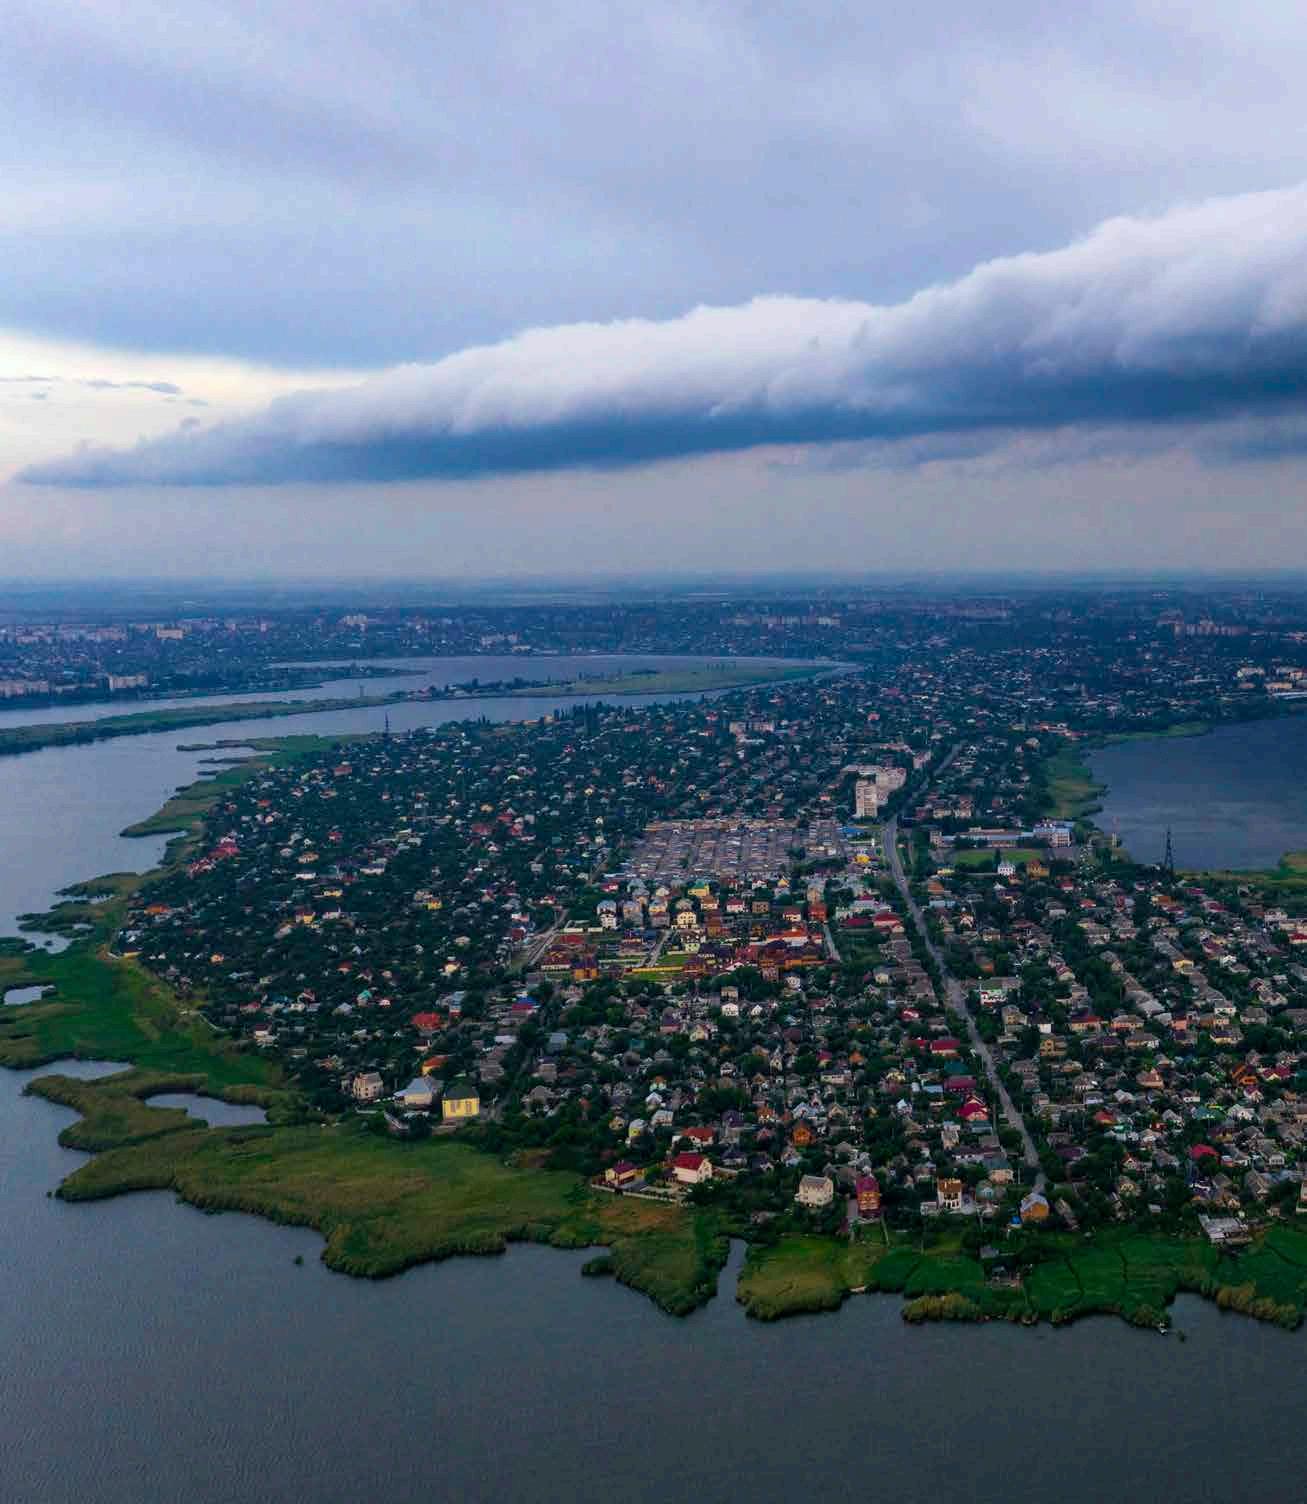
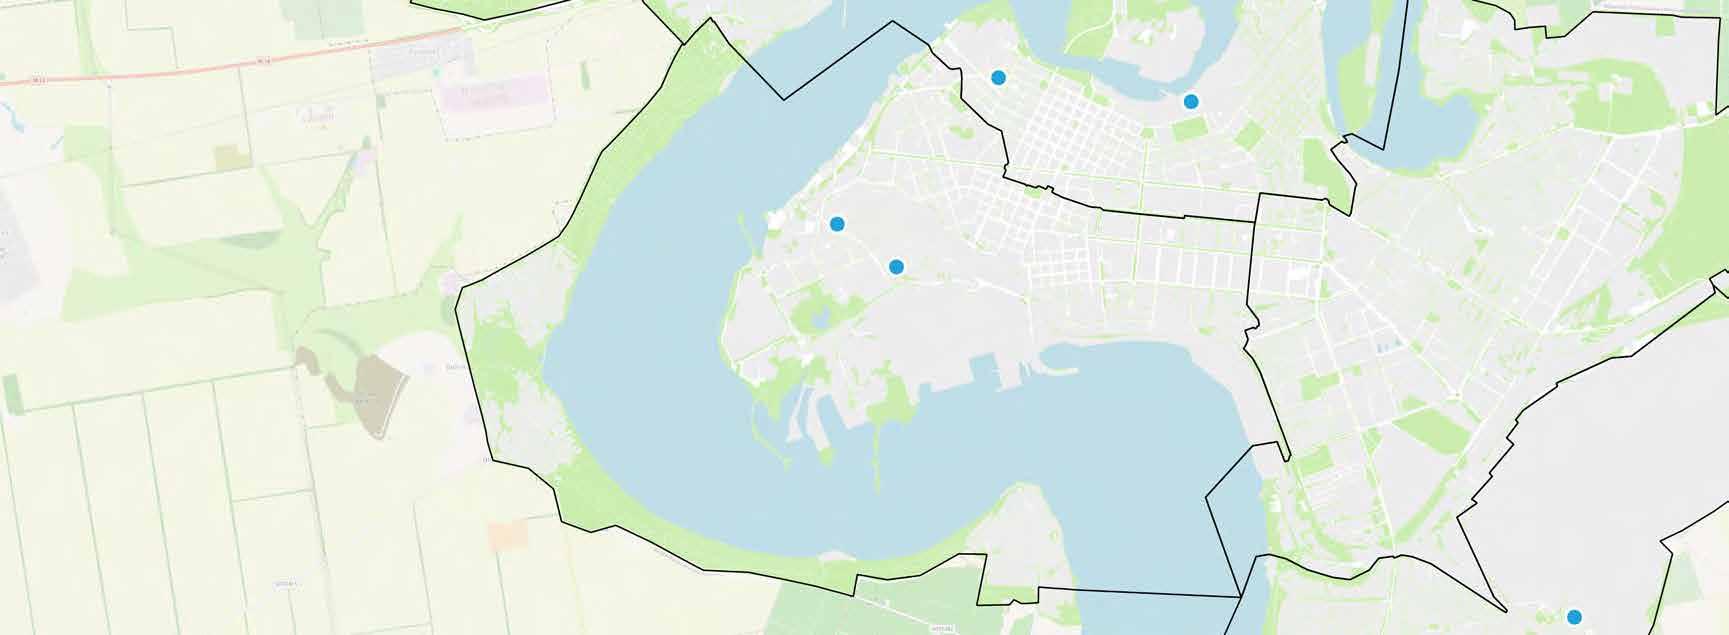
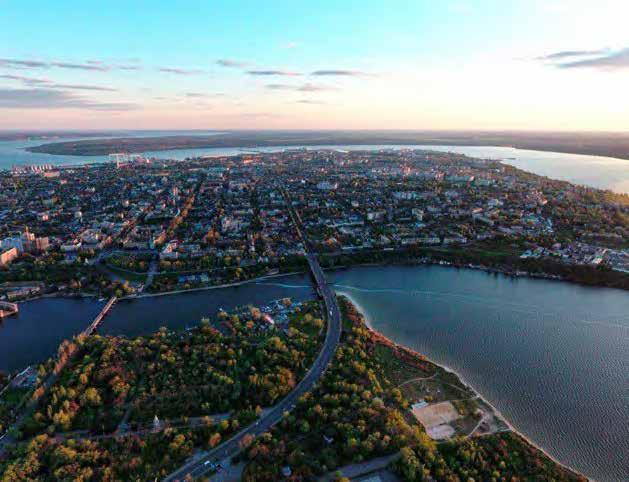
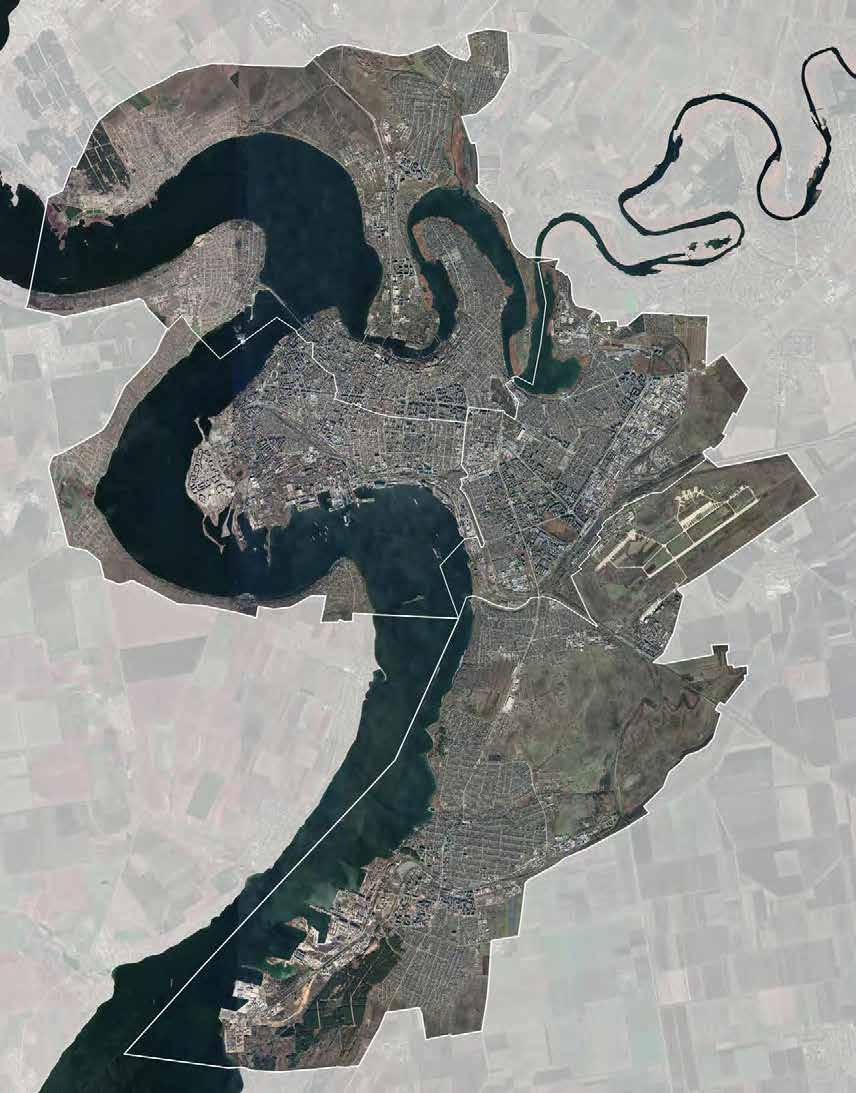
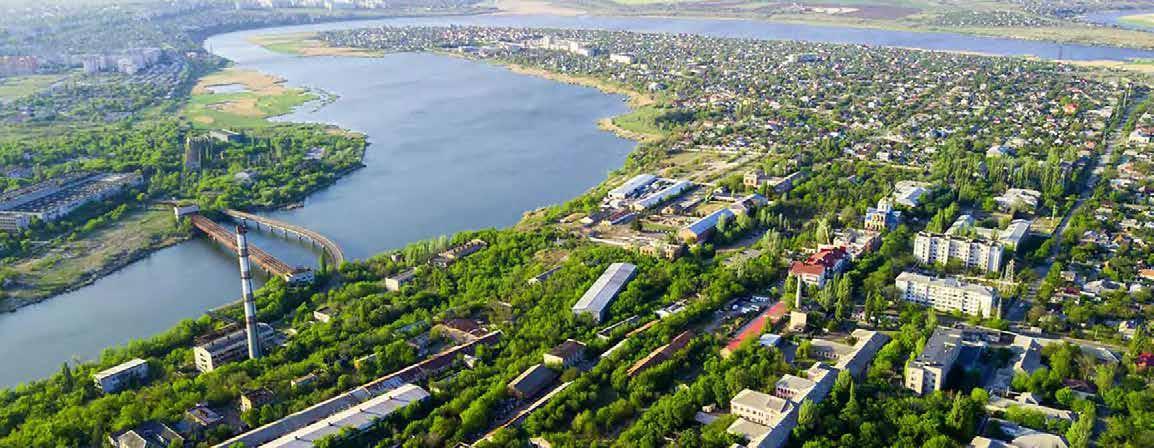
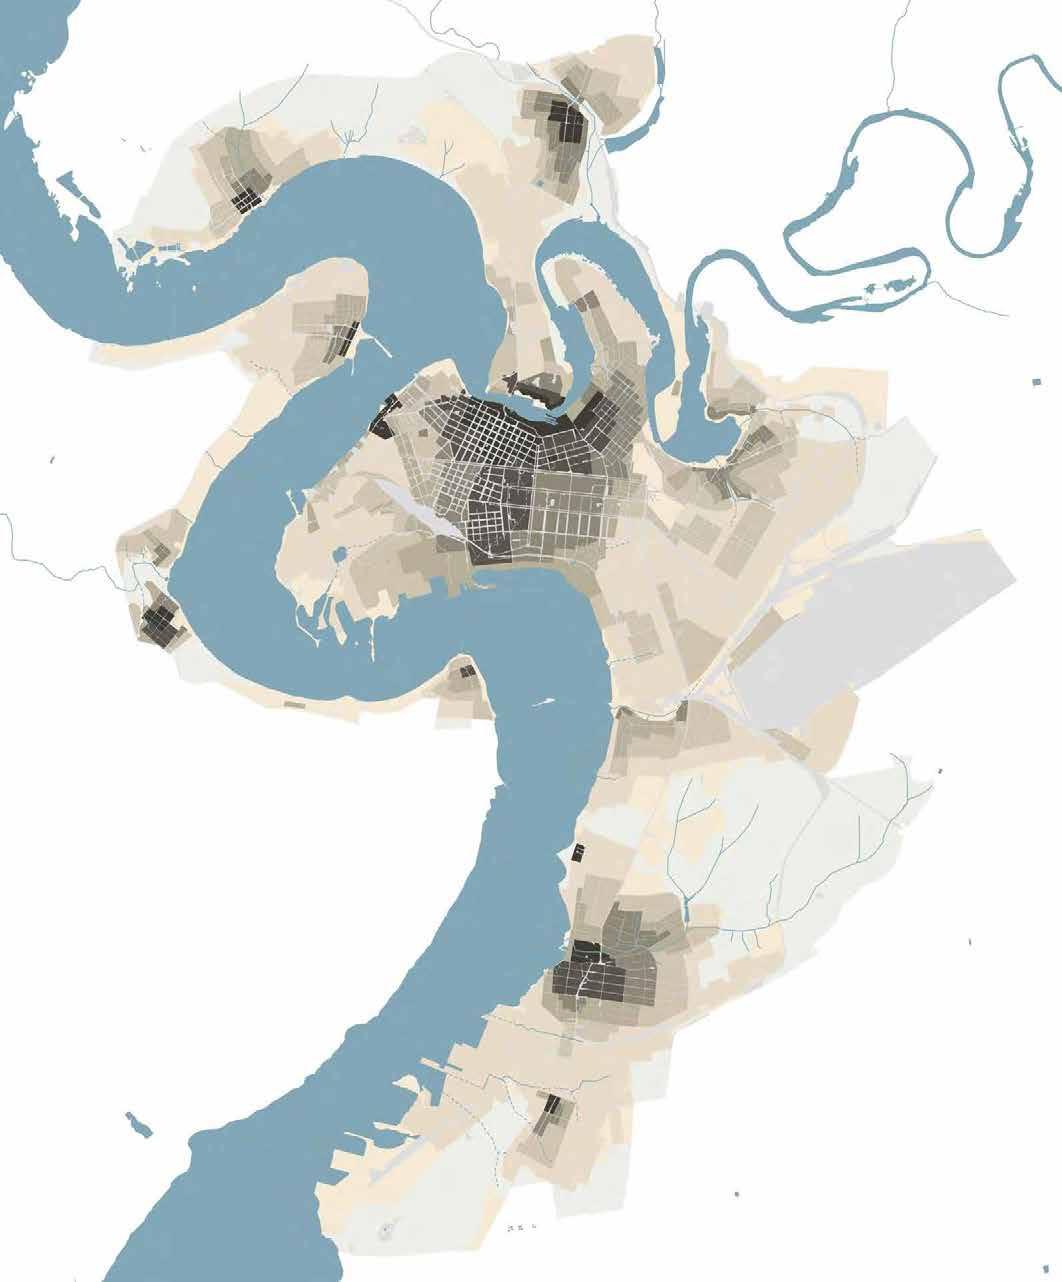
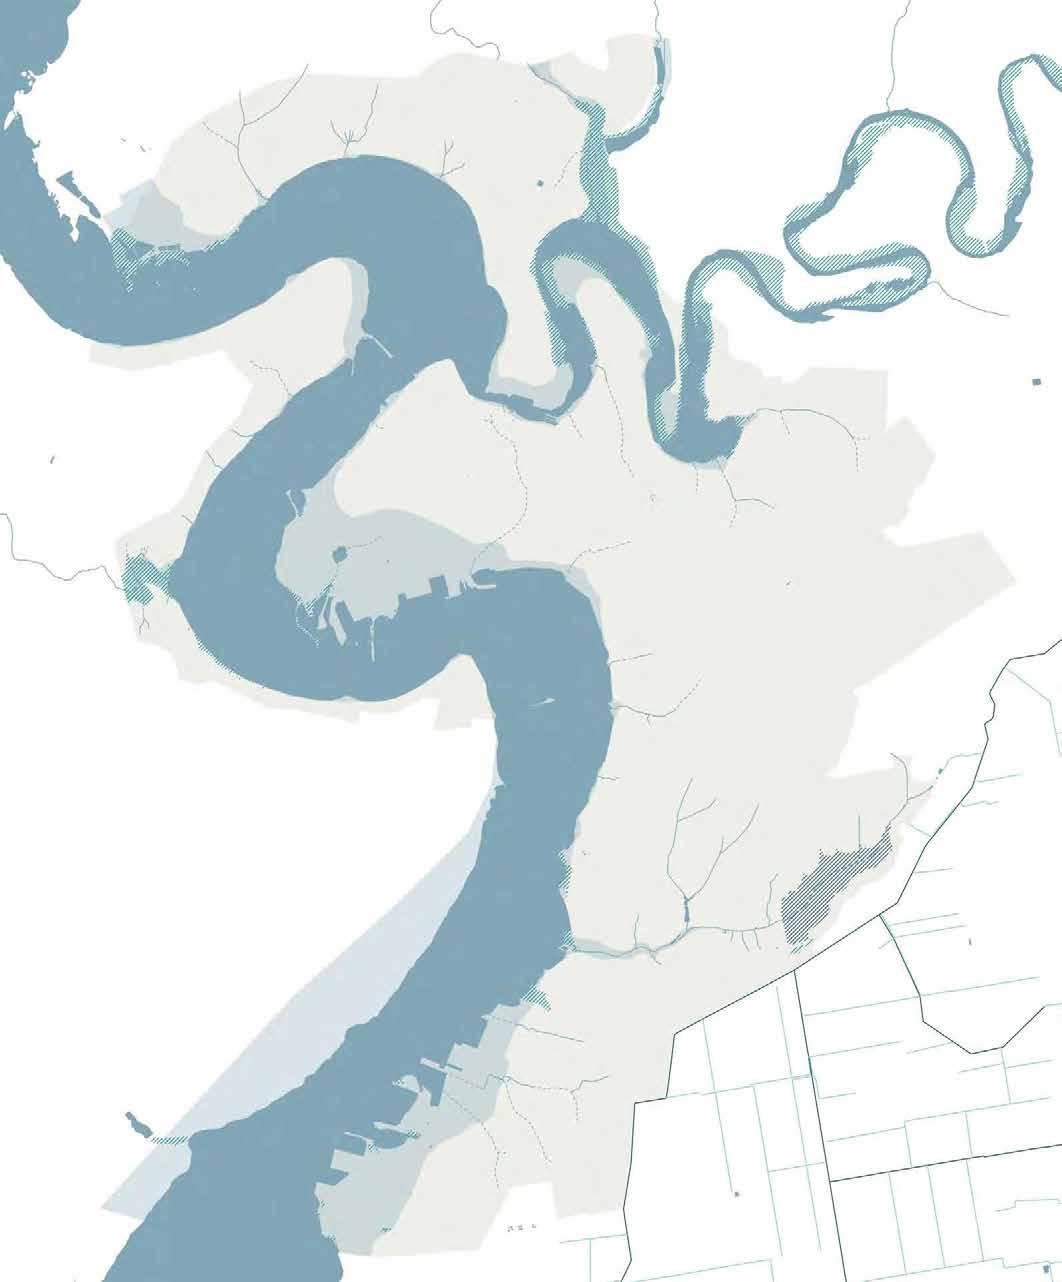
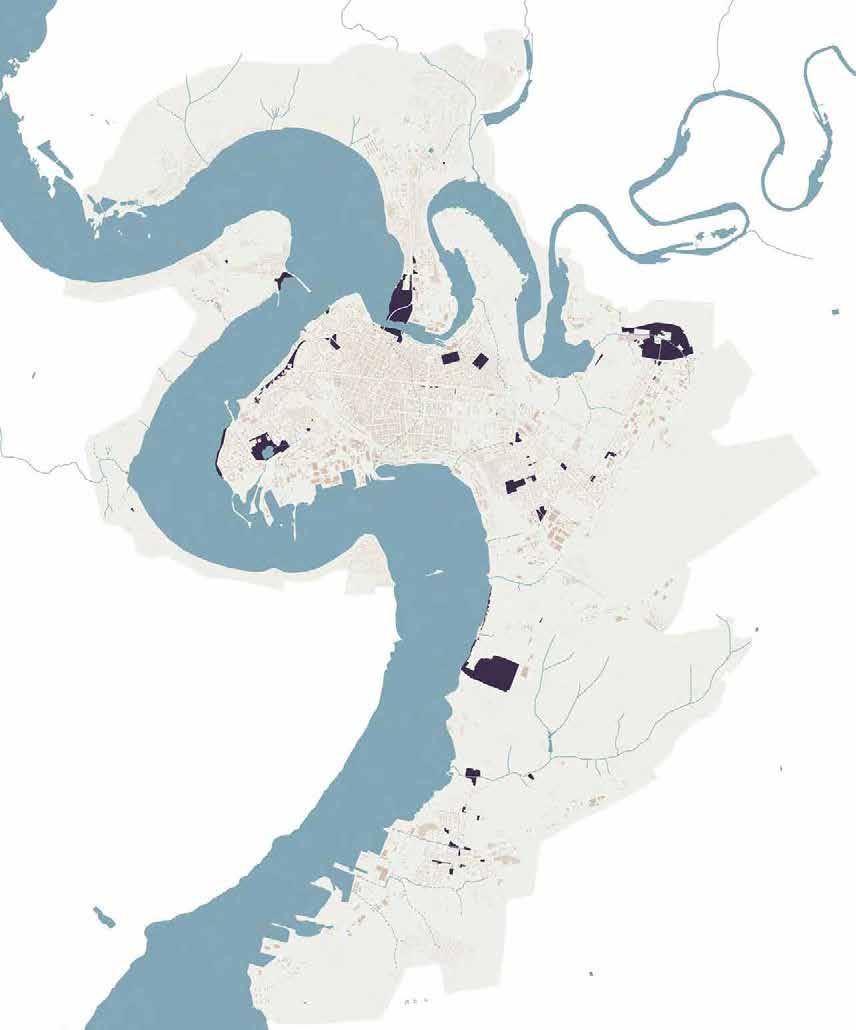
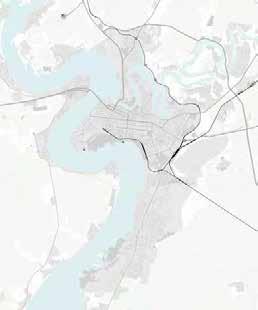
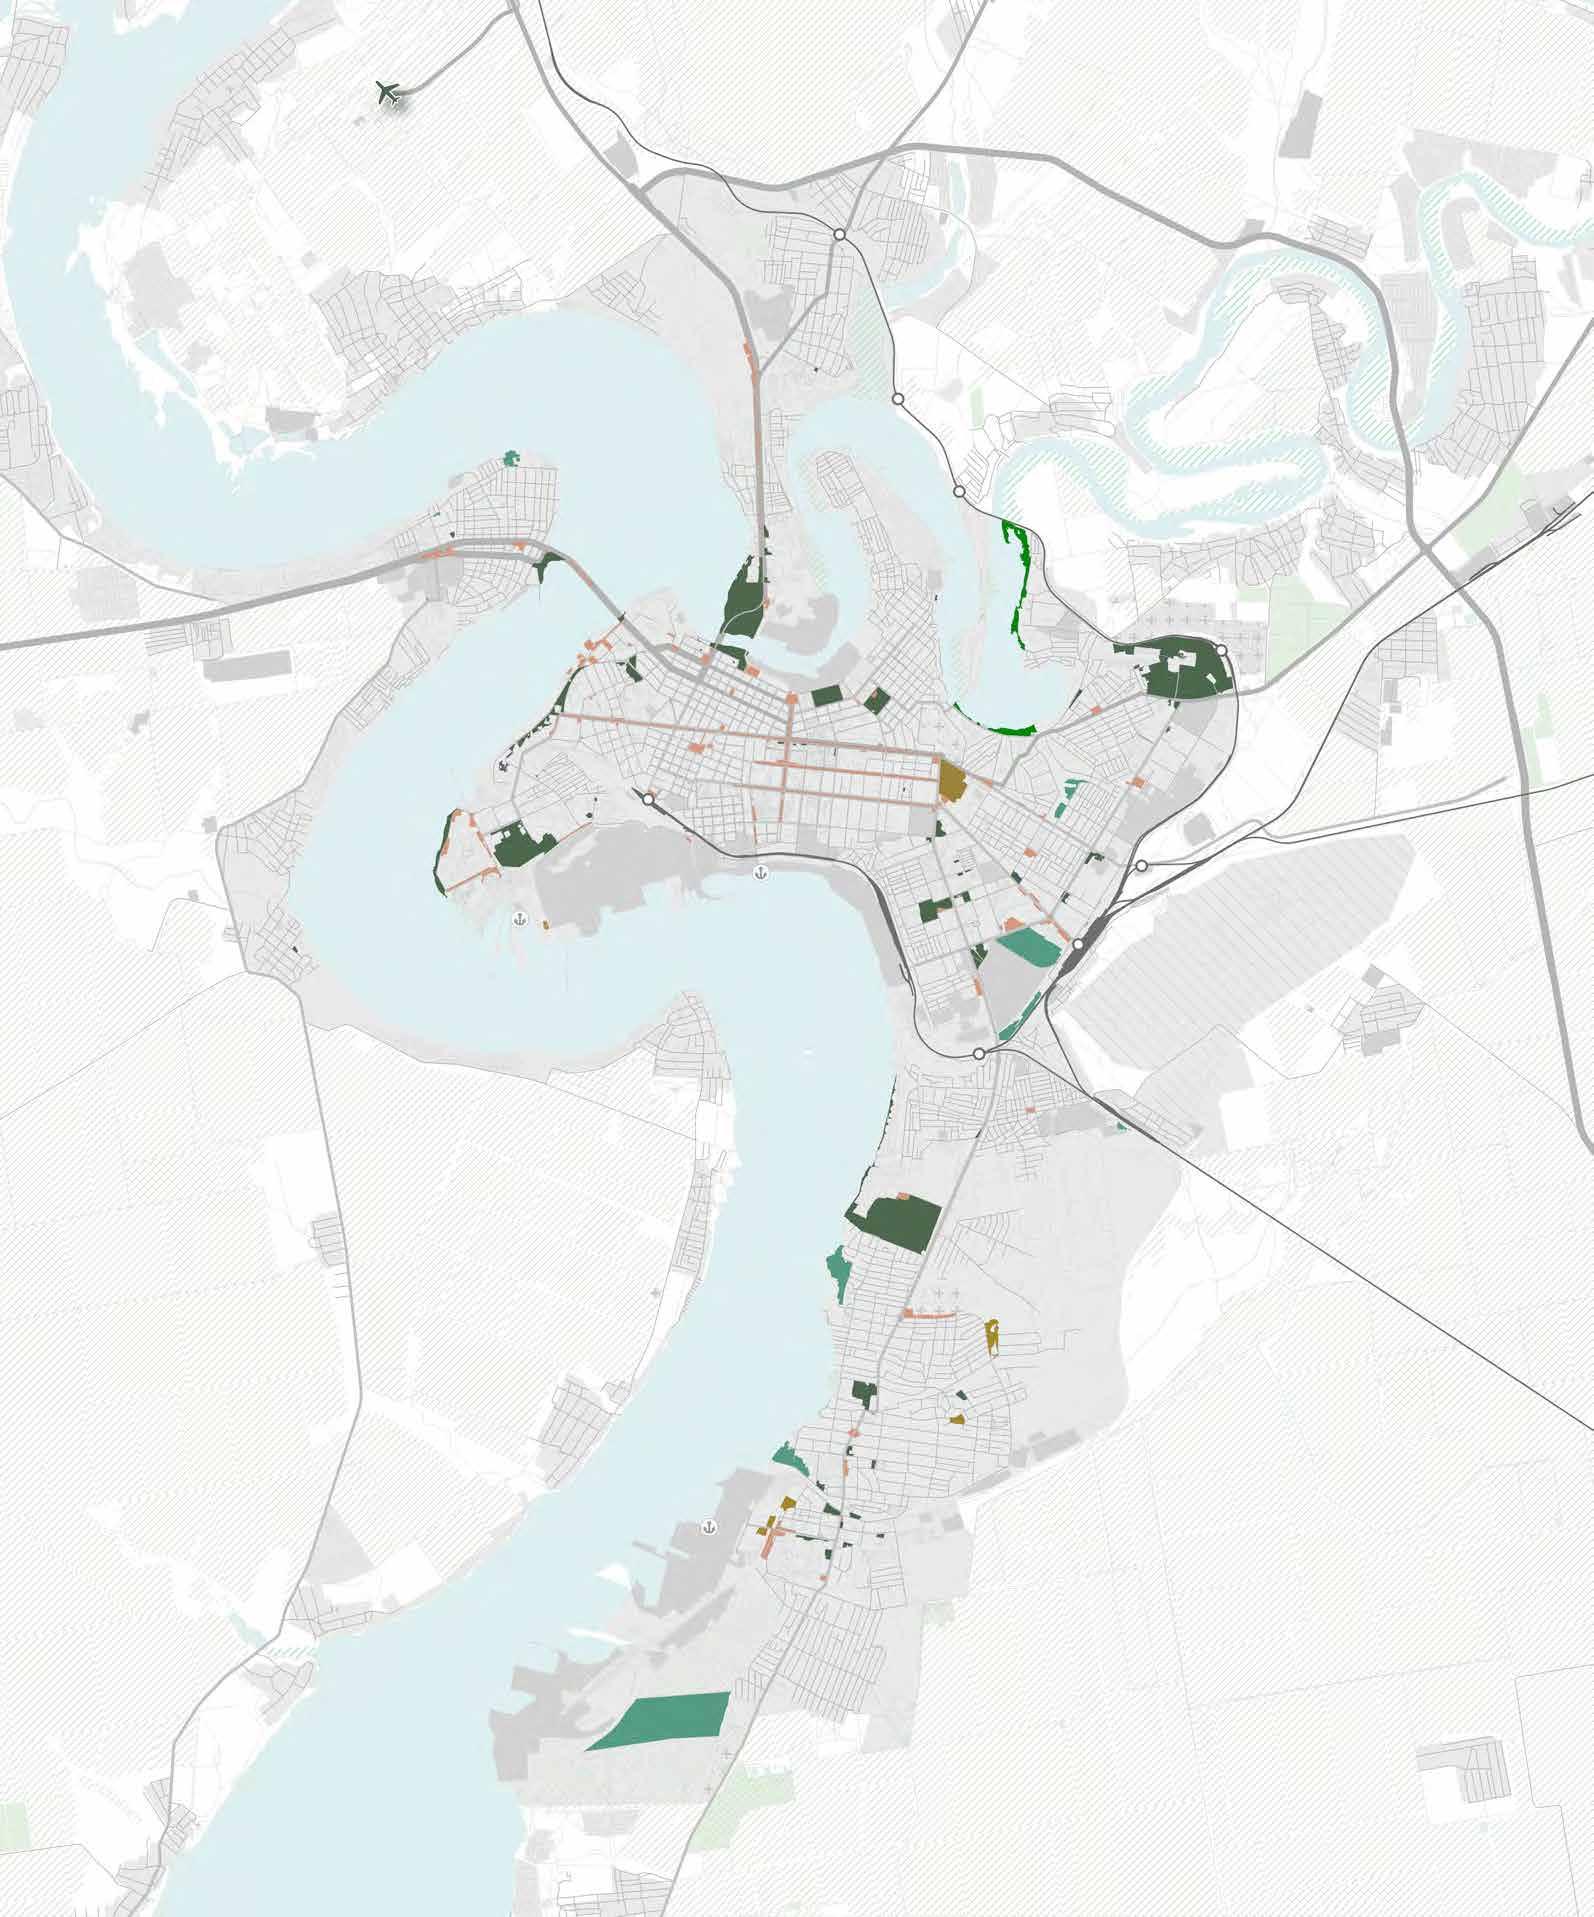
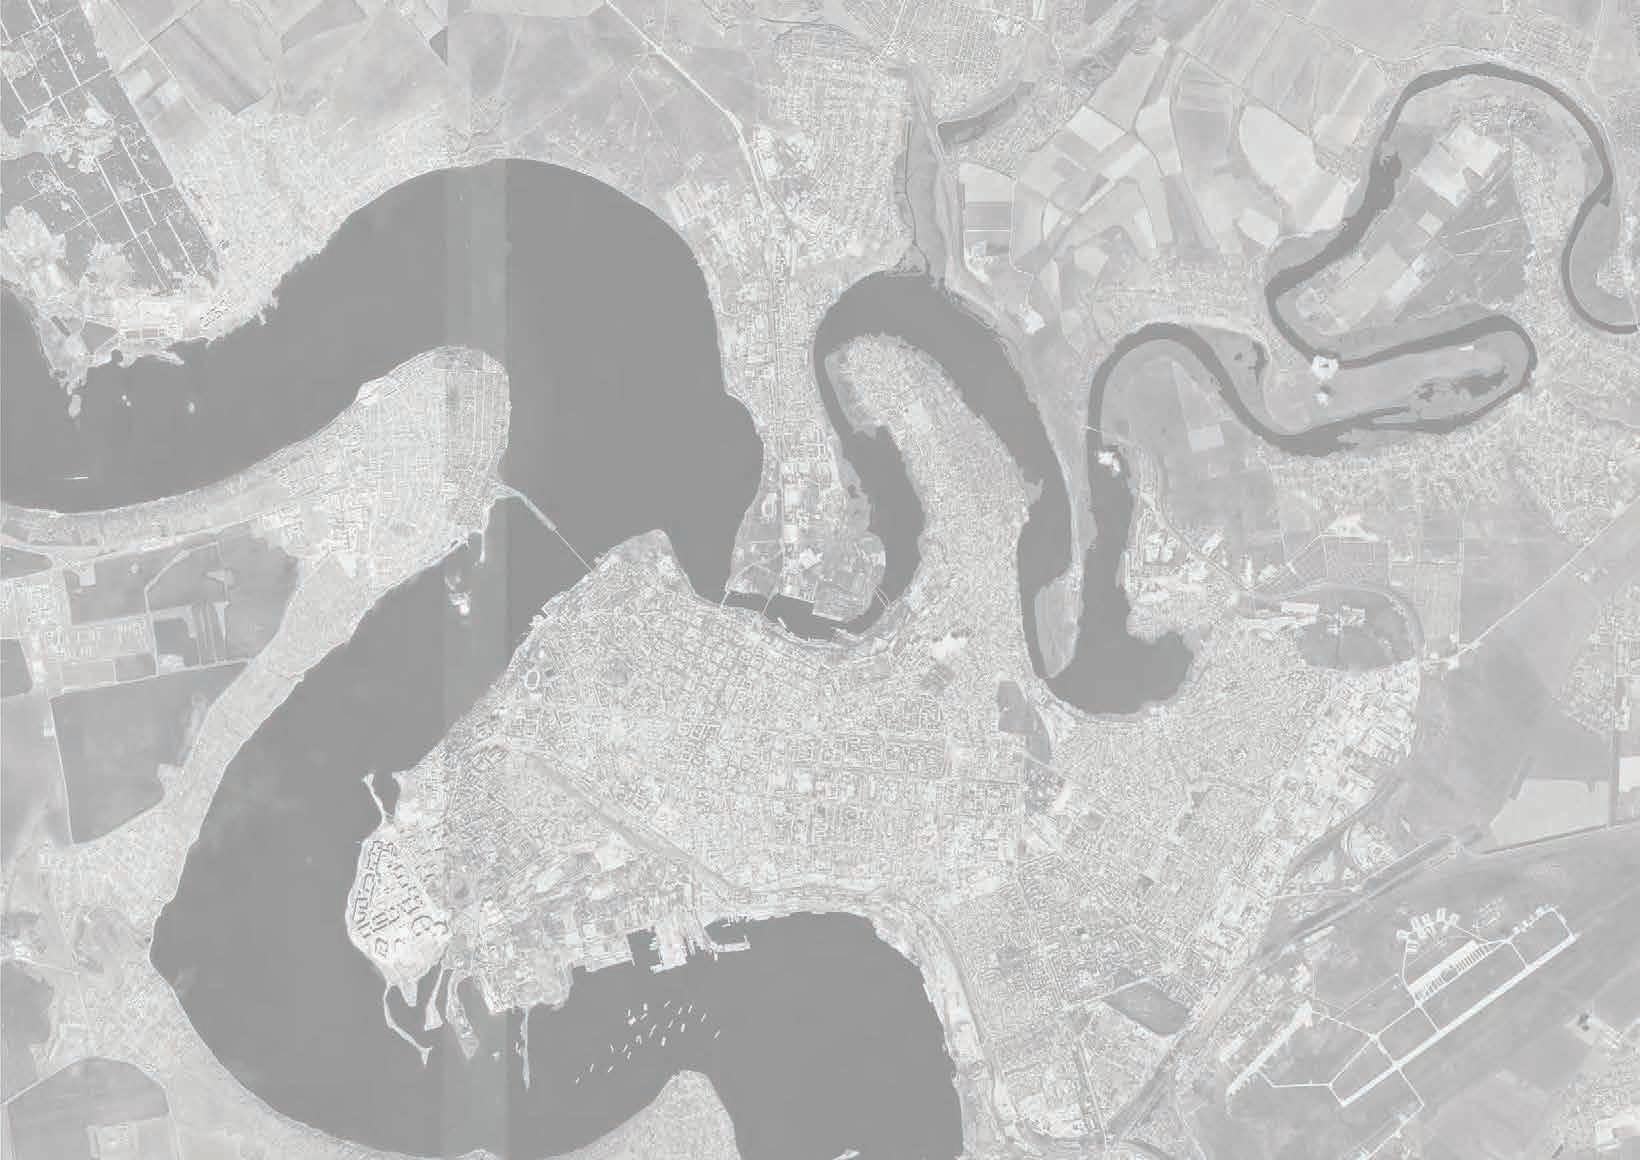
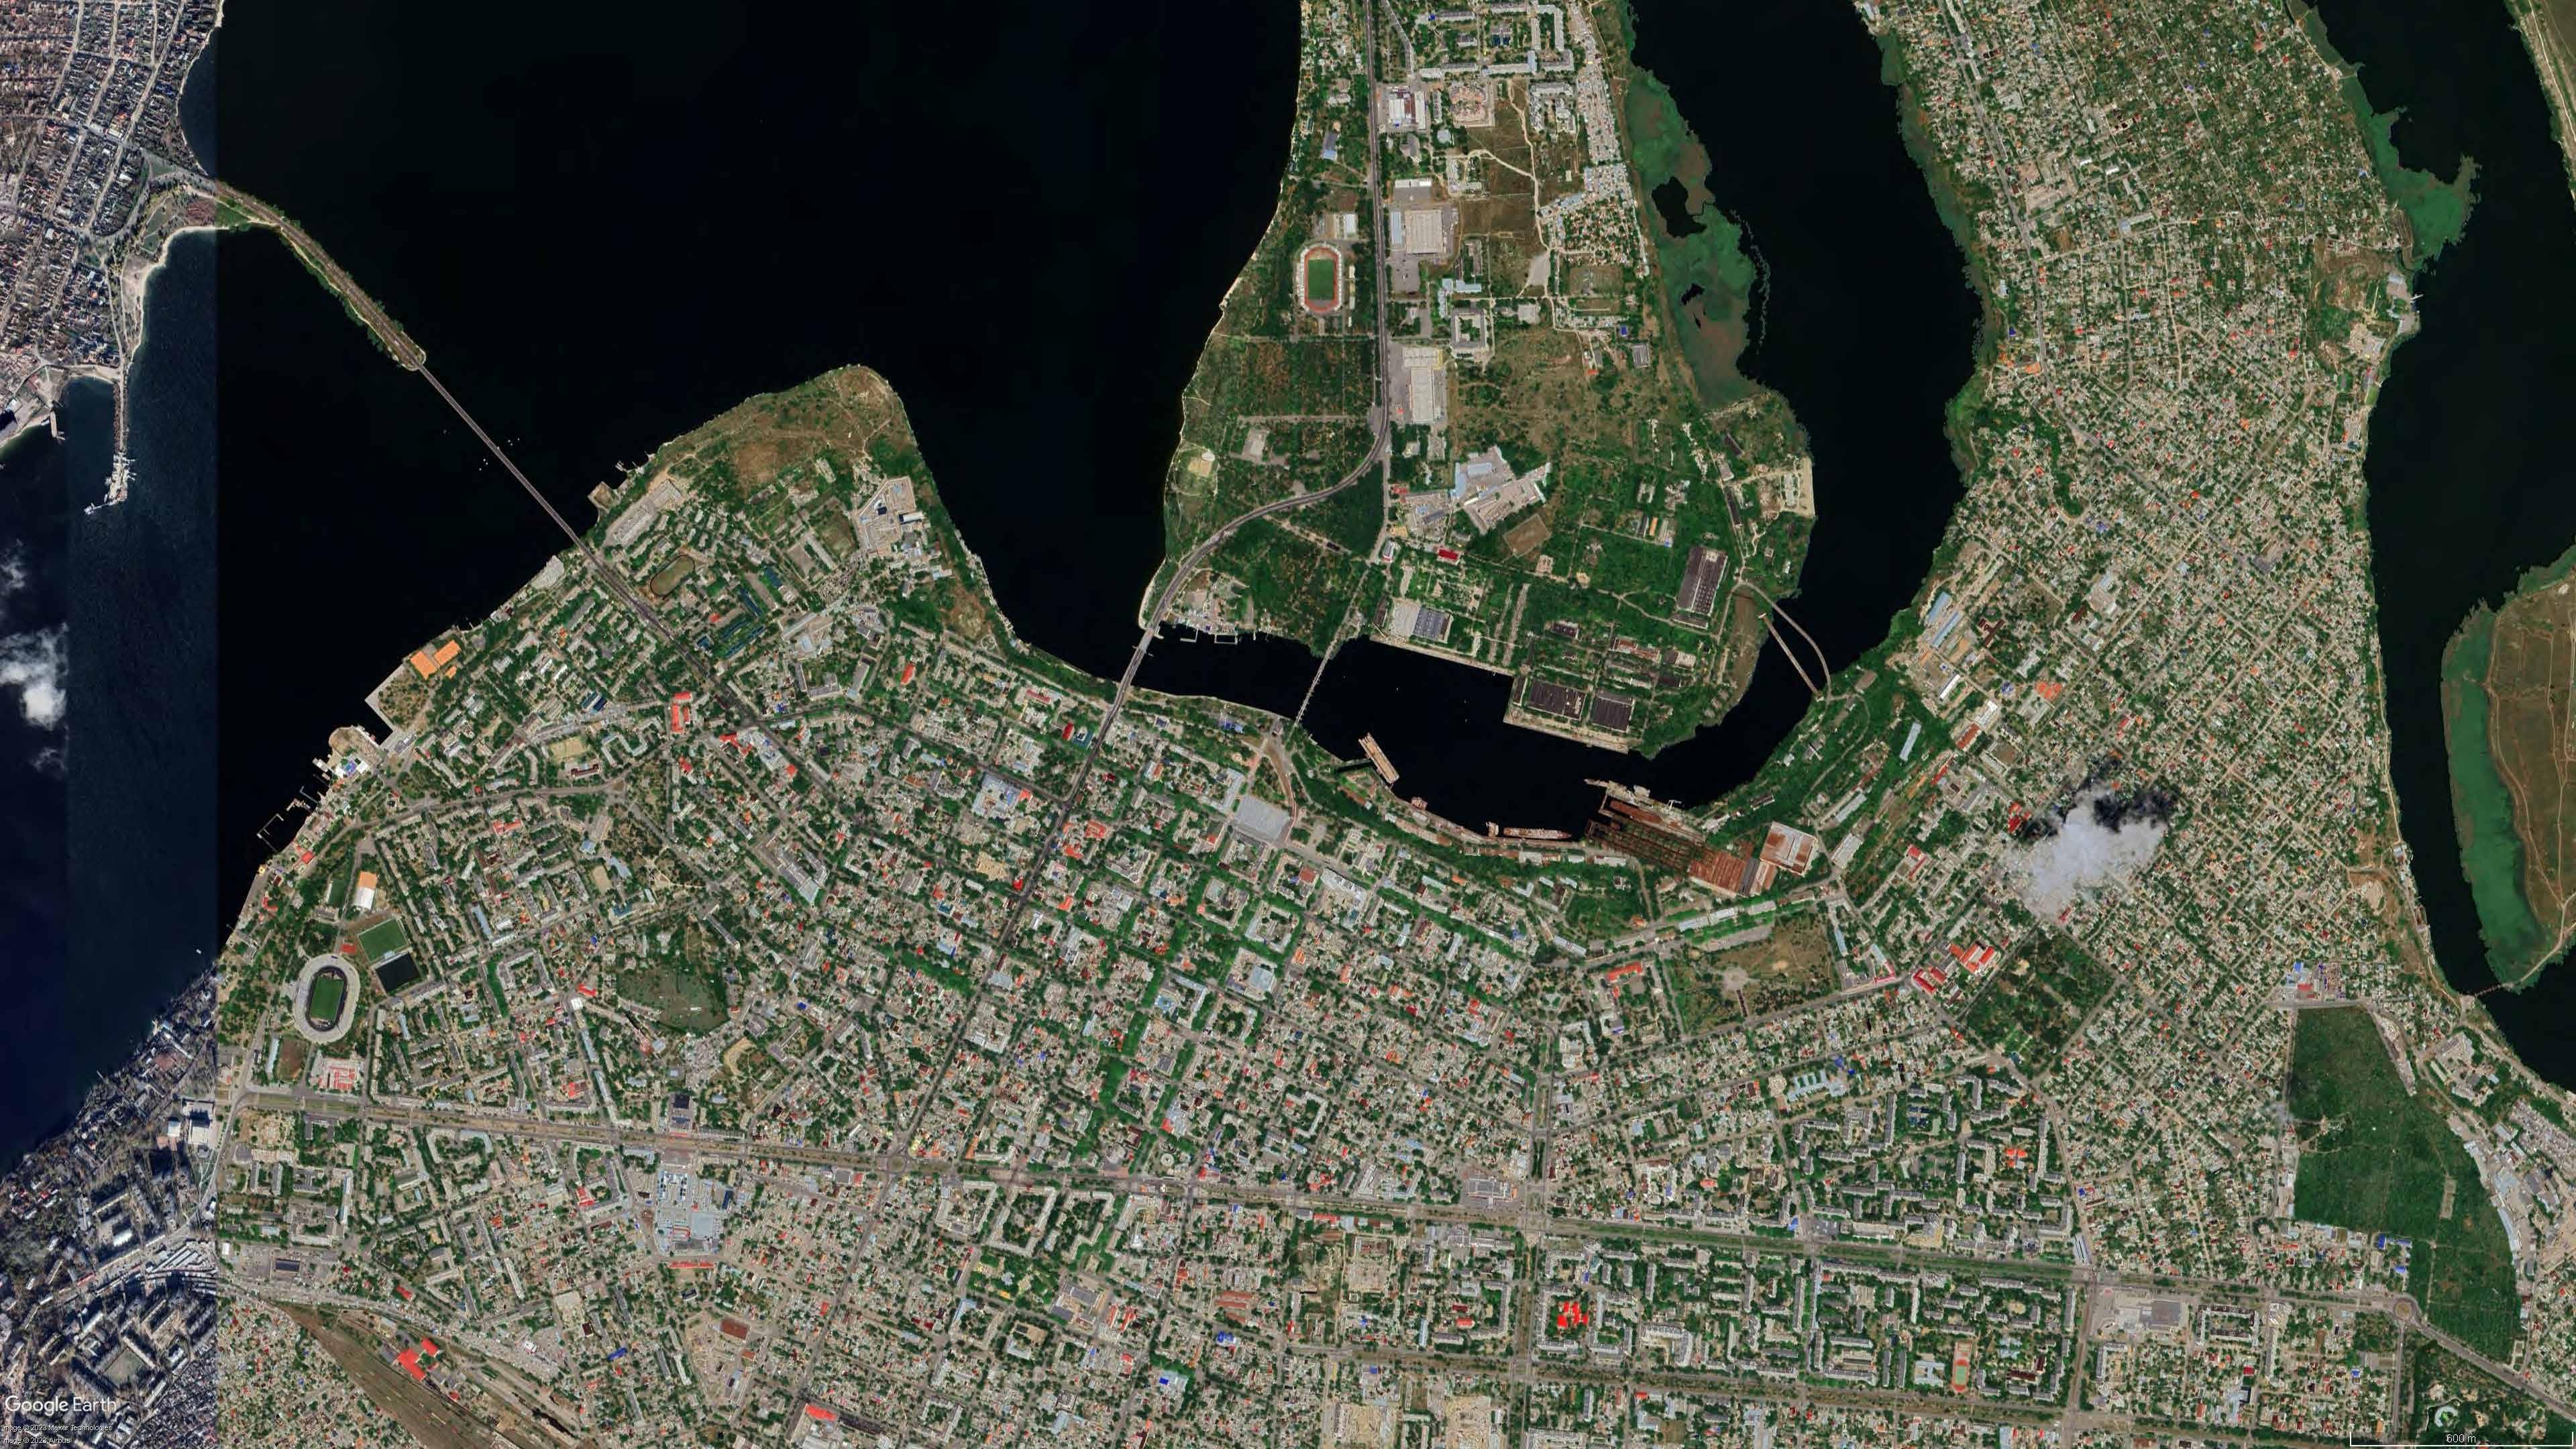
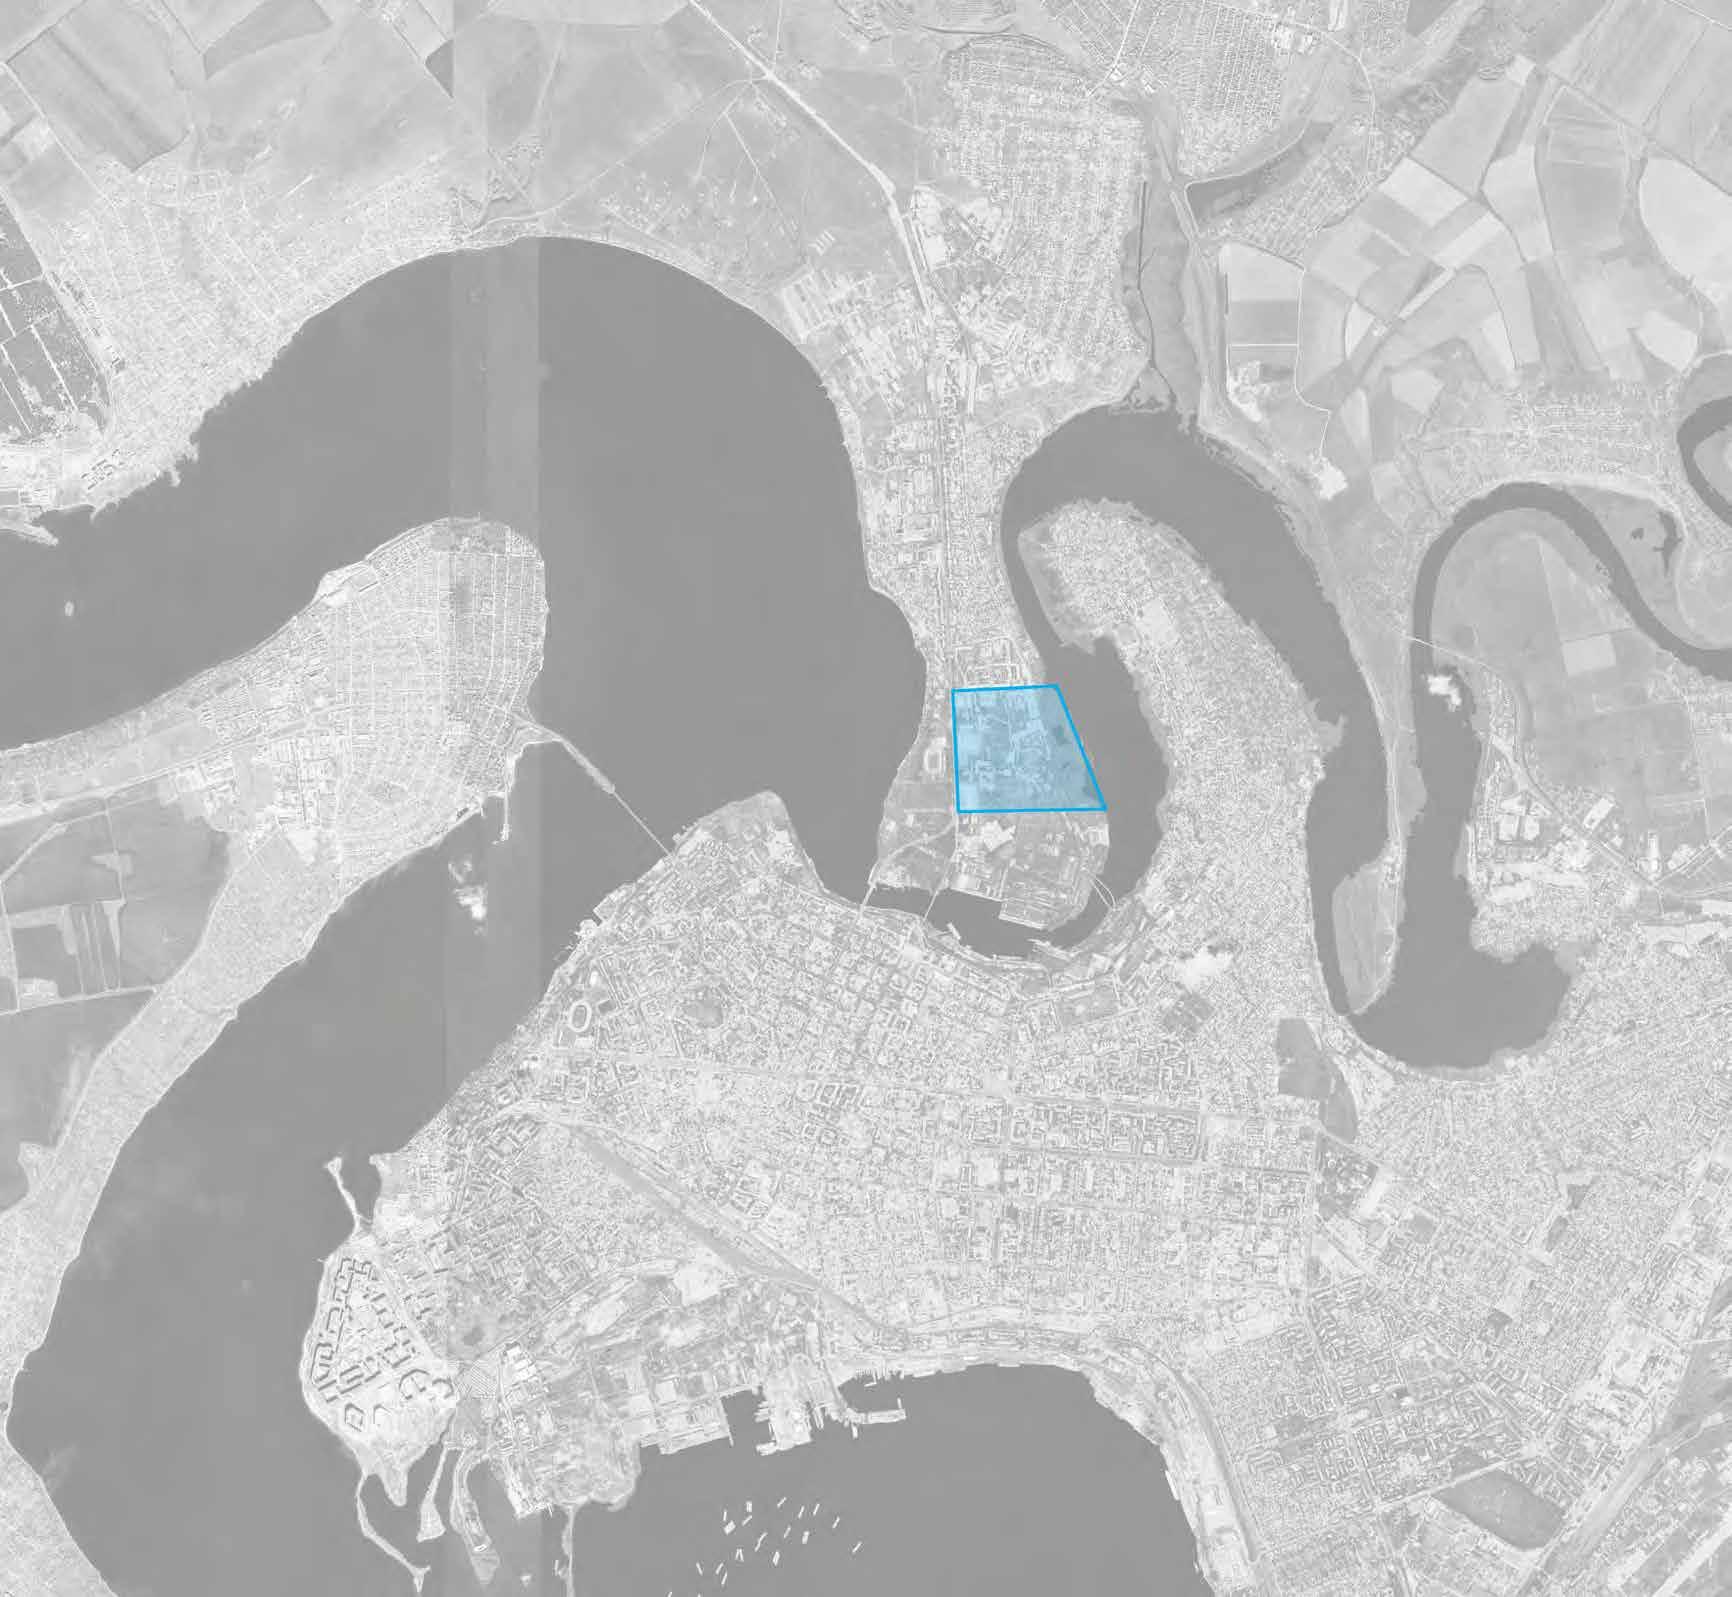
The city of Mykolaiv is located in the south-central part of the namesake oblast (region), in southern Ukraine, at a distance of 480 km from the capital Kyiv, and about 130 km from Odessa. It lies on a peninsula 65 km from the Black Sea along the estuary of the Southern Bug River, which receives its tributary Ingul here. Both rivers follow very tortuous courses just before joining the north-east of the center of Mykolaiv. For this reason, the Northern part of the city is made of several long peninsulas.
The strong presence of water and water related activities such as the three large shipyards along its river port have made Mykolaiv known as the 'city of shipbuilders'.
As previously mentioned, the city is divided into four different districts:
1. The Tsentral'nyi district is located in the northwest of the city and includes the historical center of the city.
2. Zavods'kyi lies to the west, and it has a significant industrial zone. It also includes the residential micro-districts.
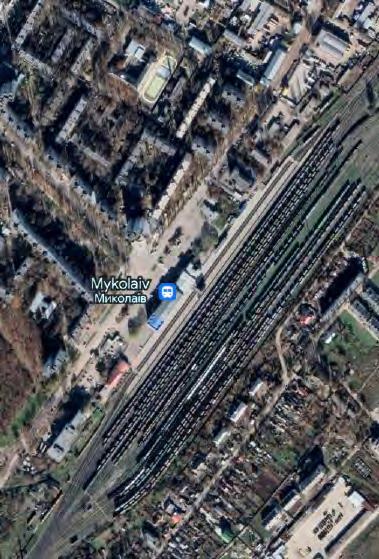
3. Inhulskyi lies to the east and includes most public transport stations.
4. Korabel'nyi is located in the south.
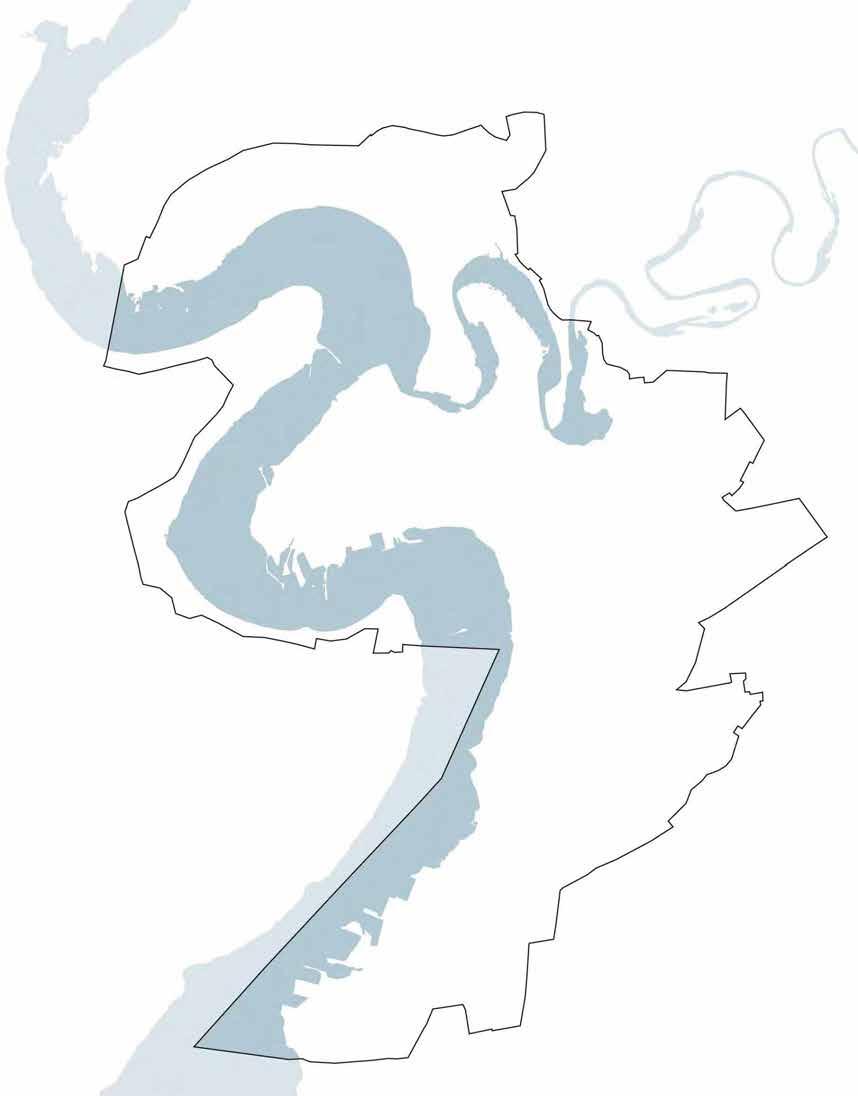
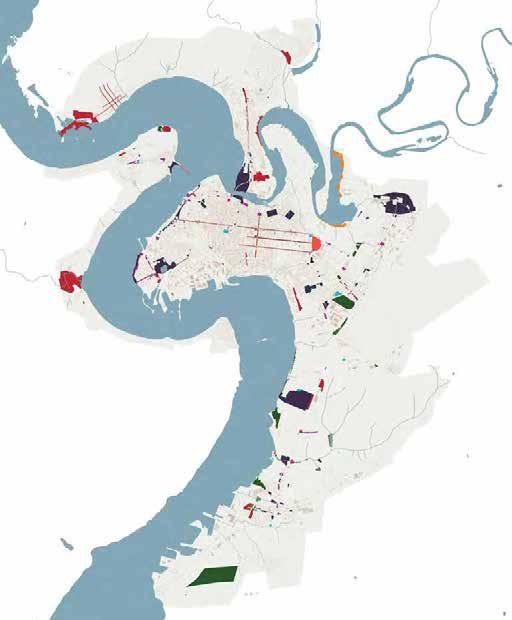
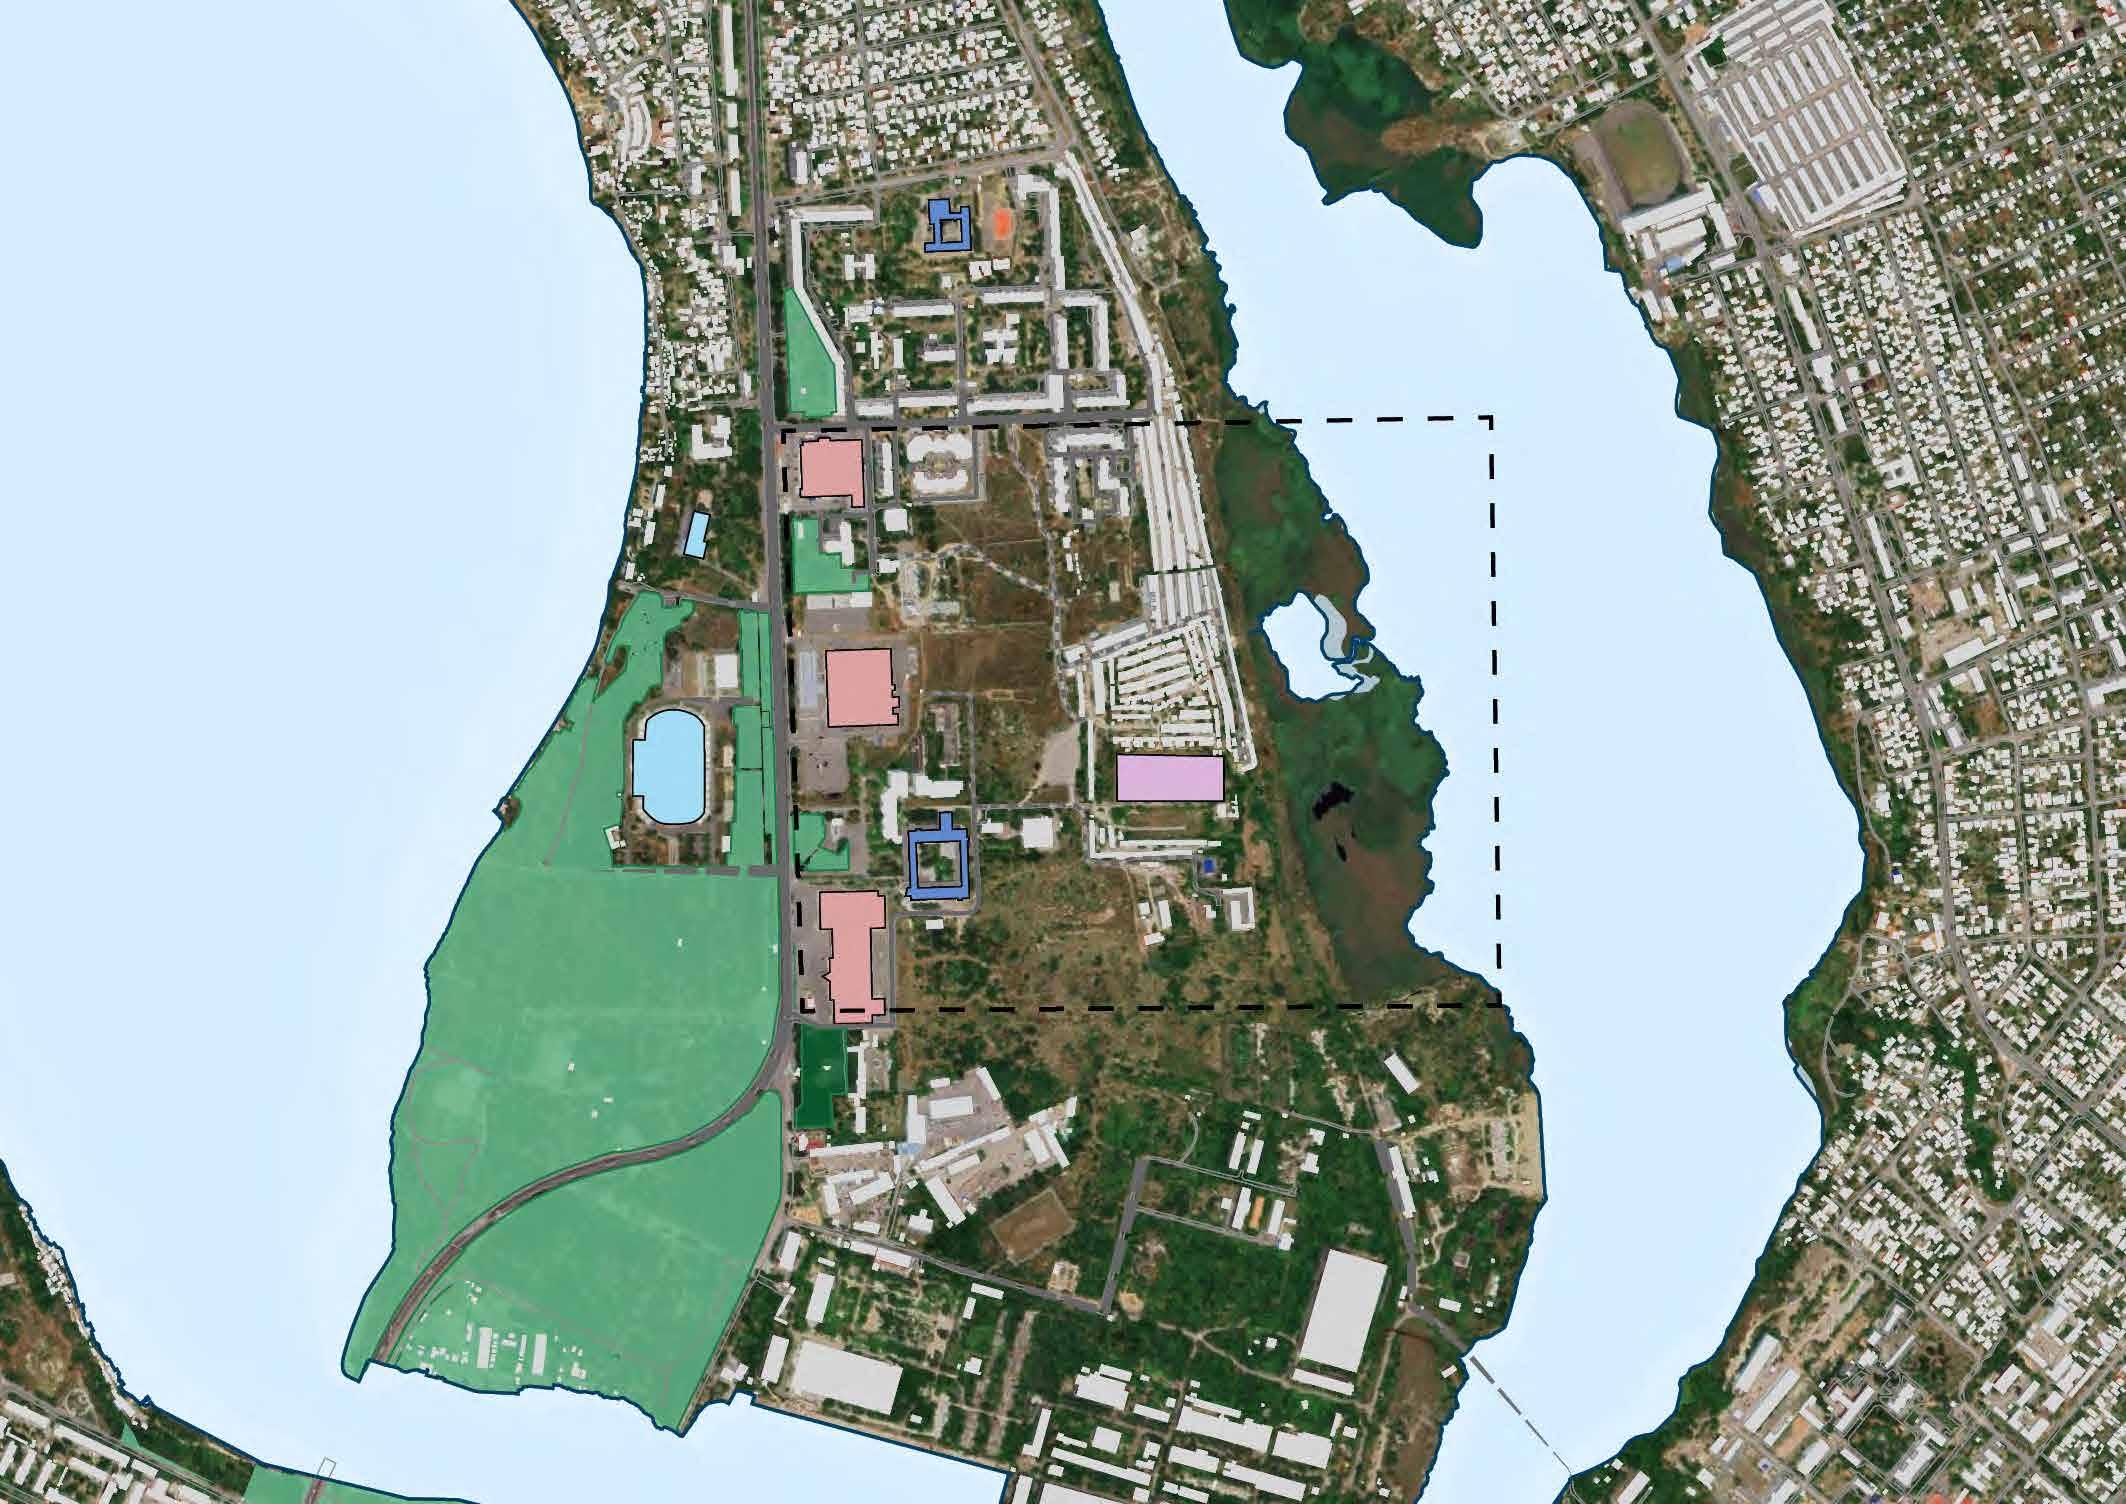
For a better initial analytical and cognitive study of the municipal territory, a subdivision by macro-landscape areas was undertaken. The urban analysis of the city of Mykolaiv has been developed by reading the current state of affairs and its most recent land use. It is important to note that in the different analytical maps, a special category for "Residential and Industrial Development Projects" (that include areas designated for private estate building, industrial parks, and big residential complexes) has been identified to describe and visualize all those natural areas that will change their function and urban role in the future, following the Municipality's development plans.
The different zones were divided according to their extension, uniformity, and characteristics as follows:
• Hydrographic system that includes a floodplain analysis, wetlands, a water reservoir, water channels, and underground channels;
• Built environment system characterized by its different periods of expansion, the roads' system, and the main infrastructures;
• Urban green space system composed of parks and public areas, semi-public and private areas, as well as infrastructural mitigation green.
• Border landscapes are subdivided into agricultural systems, forests, grasslands, and Nature Reserve Fund Areas. This specific topic will be covered at the end of the chapter in the vacant land areas section.
Source I
Agency of Sustainable Development and European Integration “Lower Danube” Euro region, 'Common border, common solution. Analysis of tourist potential of Ukrainian region of Black Sea basin'', 2019 'Mykolaiv Municipality, ''Agricultural and food product processing, invest in Mykolaiv'', n.d.
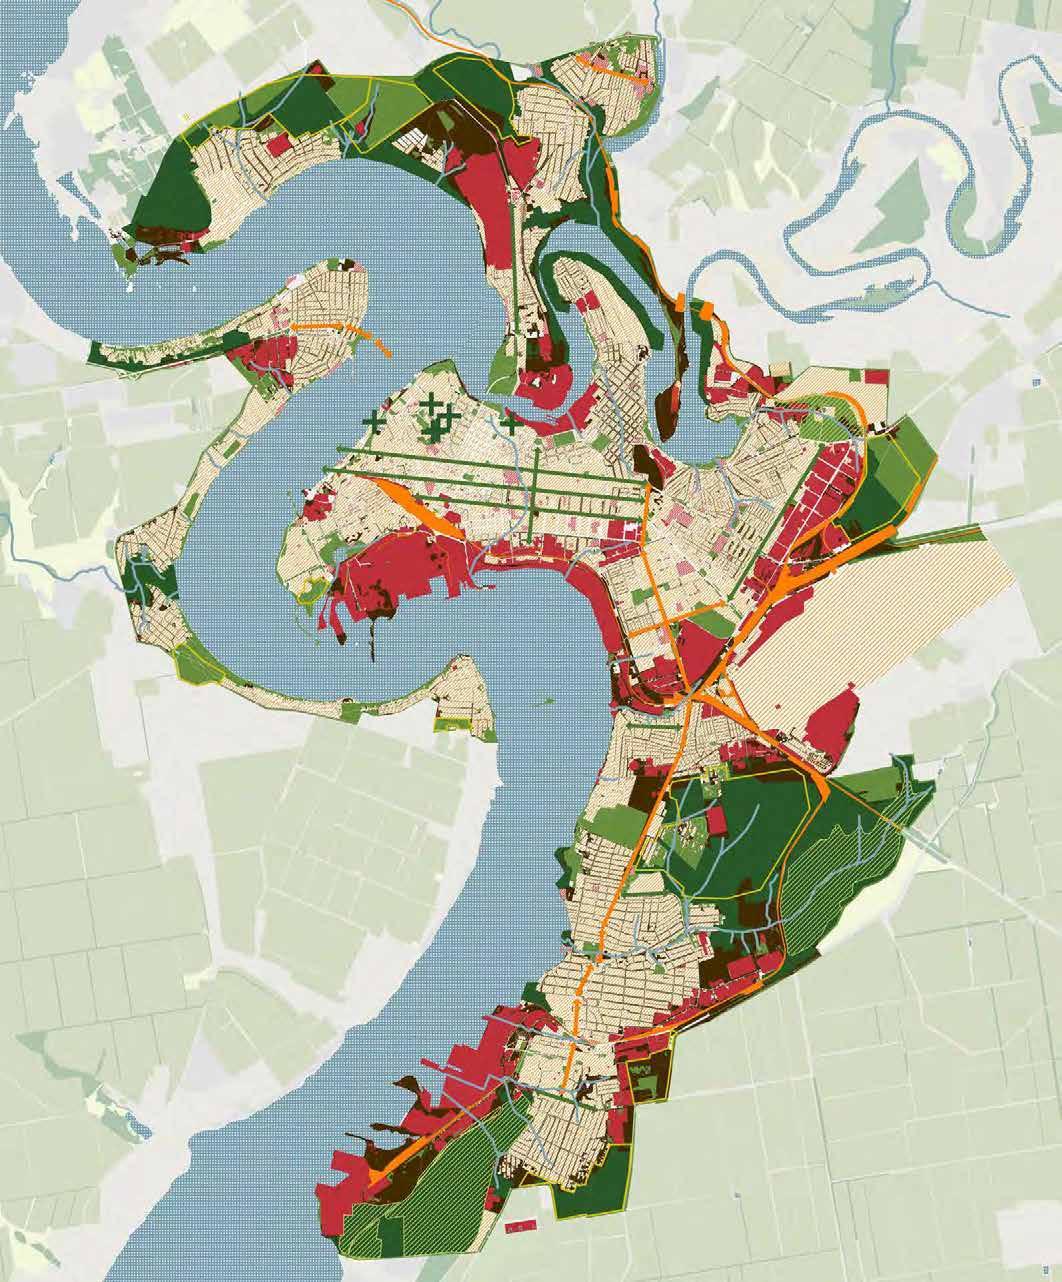
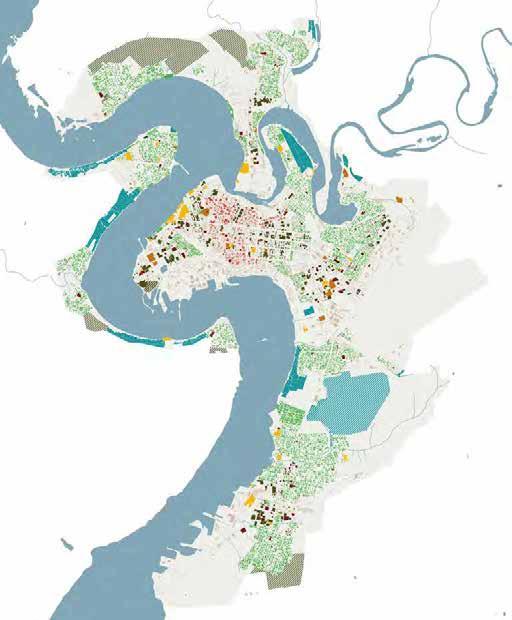
Ecological networks are interconnected habitat systems, whose biodiversity must be safeguarded, by paying attention to potentially threatened animal and plant species (ISPRA). An ecological network consists of the following elements:
• Core areas: areas of high naturalness that are already, or may be, subject to a protection regime.
• Buffer zones or transition zones, placed around high nature areas in order to guarantee the essential gradualness of habitats.
• Ecological corridors: linear and continuous landscape structures of various shapes and sizes connecting high nature areas.
• Stepping stones: small areas that, due to their strategic position or composition, represent important elements of the landscape. The city of Mykolaiv is part of a broader nature framework on a supra-municipal scale, in which it is possible to identify core areas of other environmental-naturalistic value. The main systems are identified as part of the nature fund:
• Biosphere Reserves (Black Sea Biosphere Reserve of NAS).
• National and regional nature parks (Biloberezhia Sviatoslava, Tyligulsky).
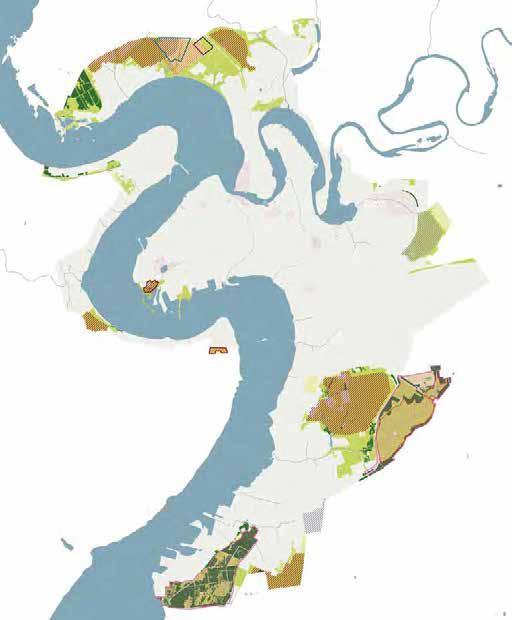
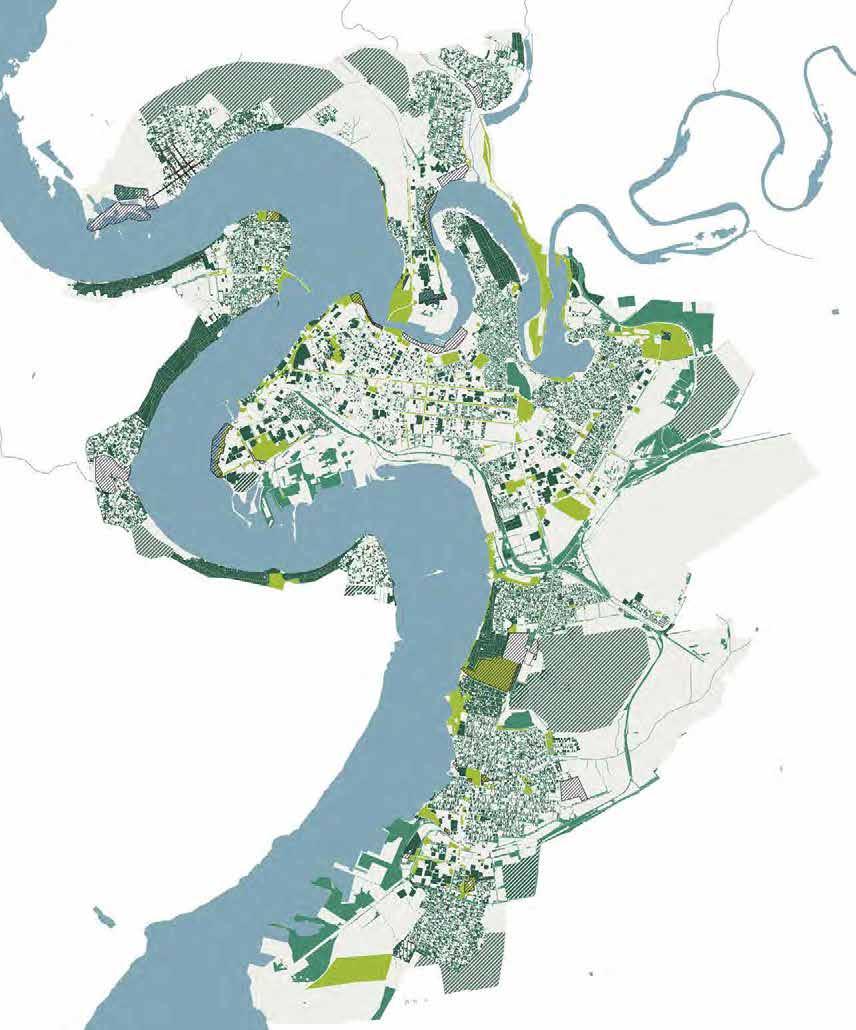
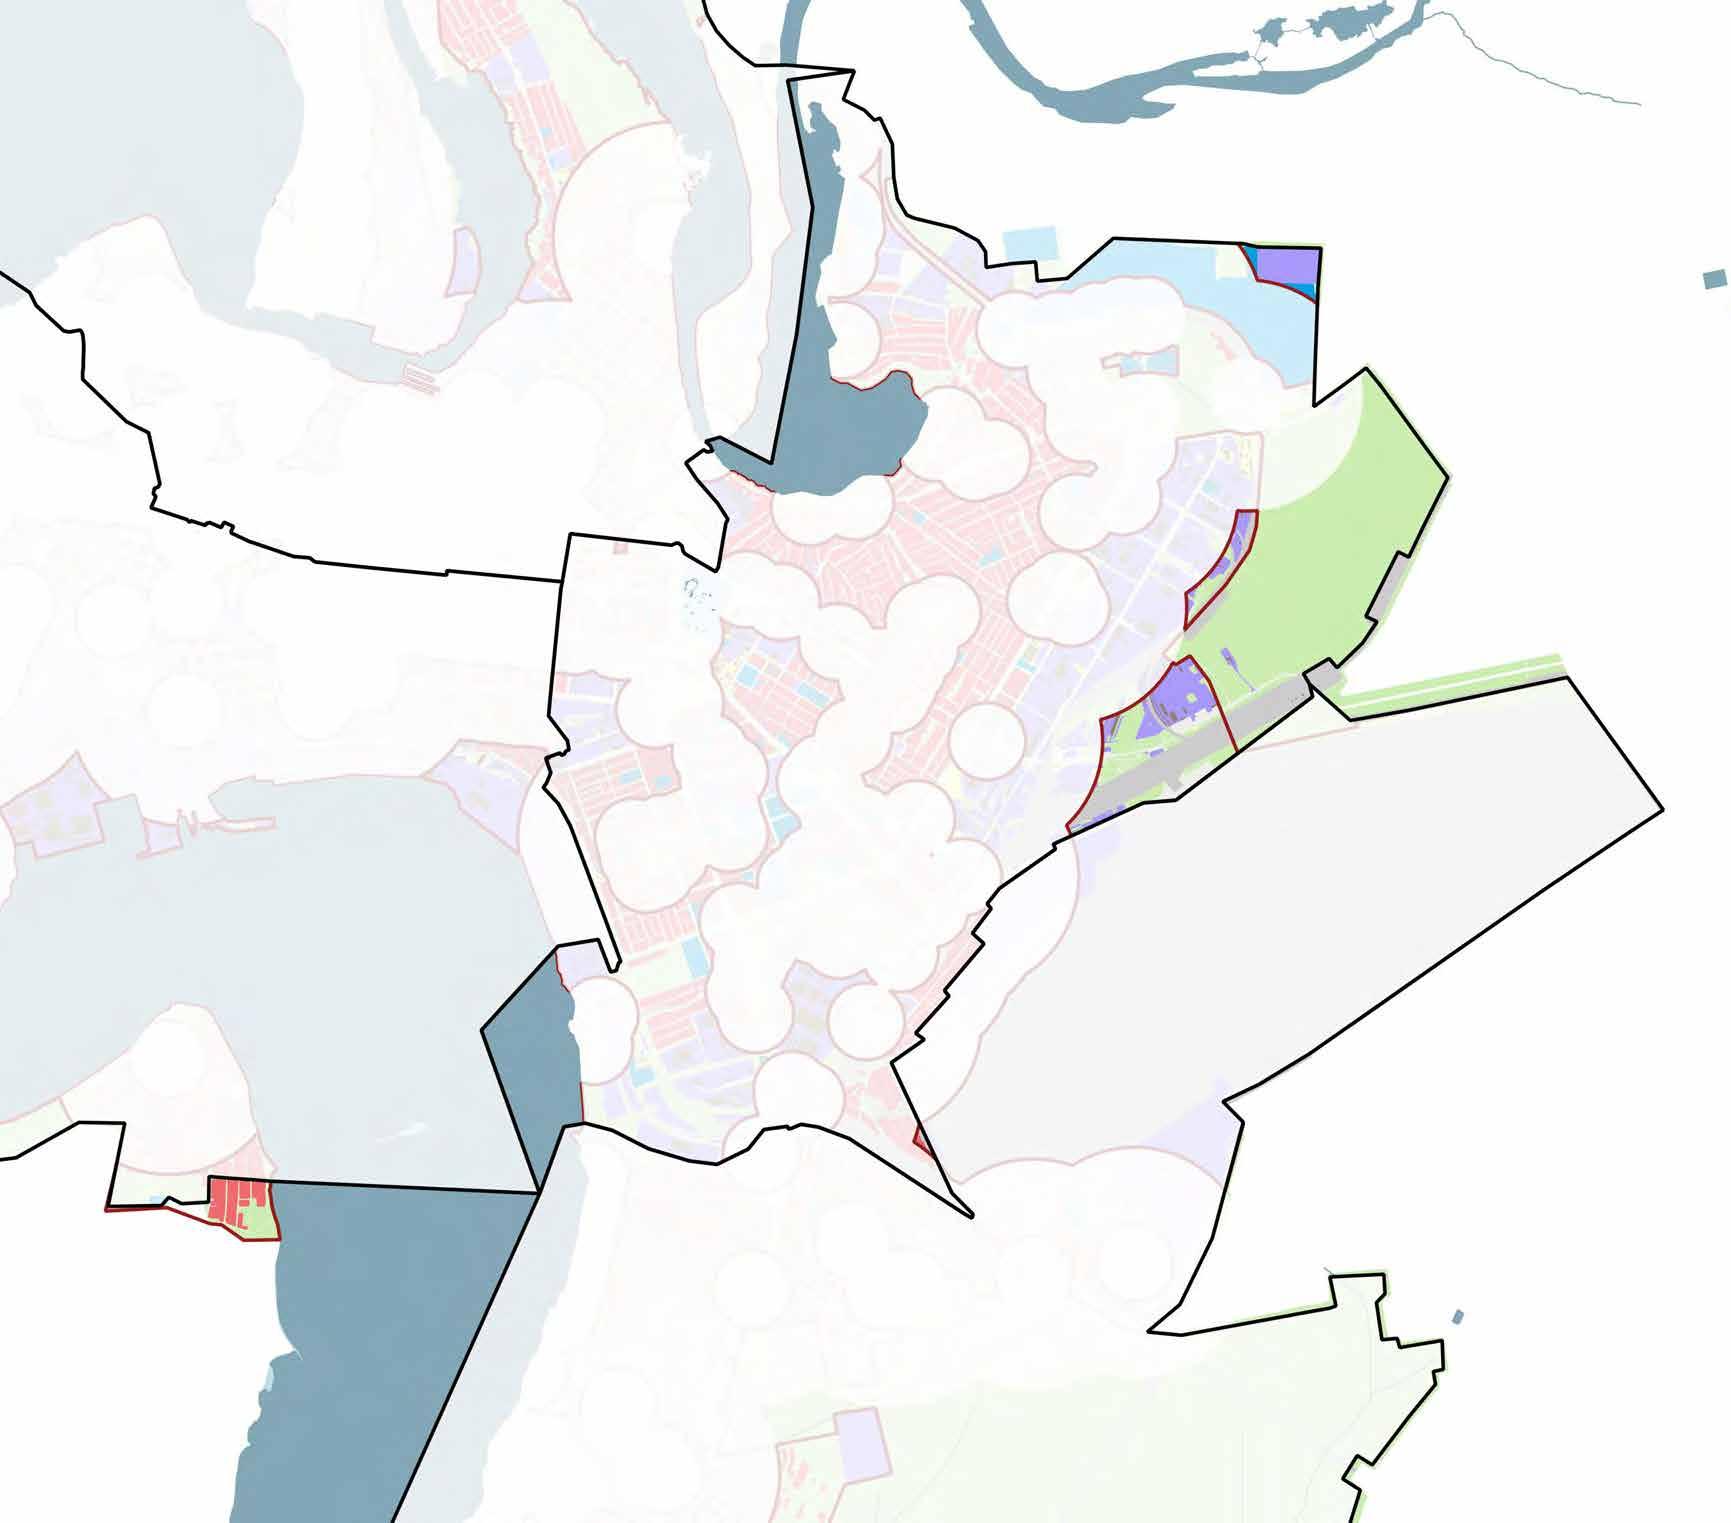
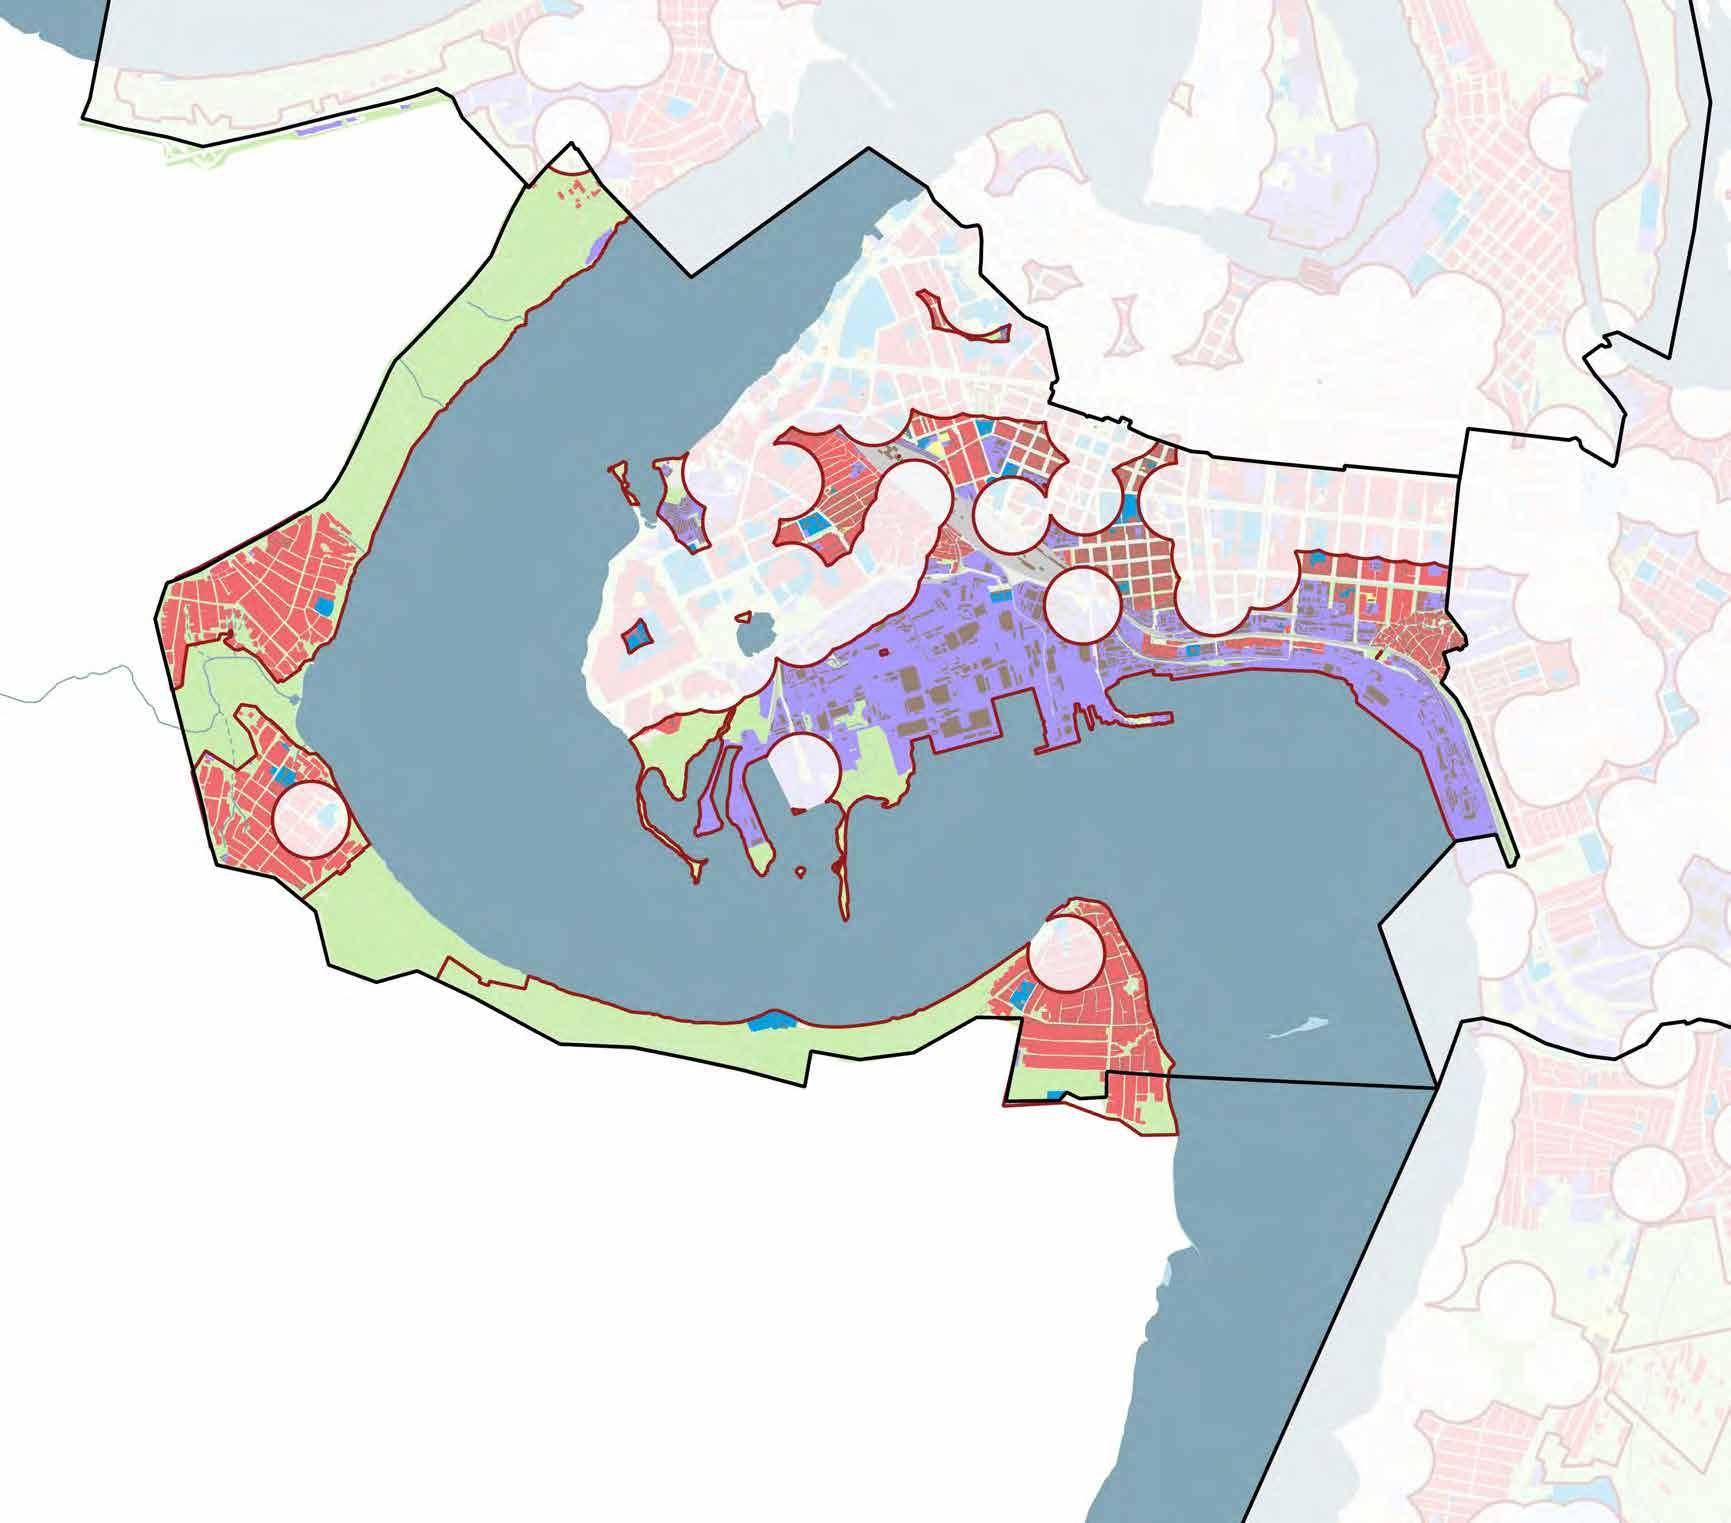
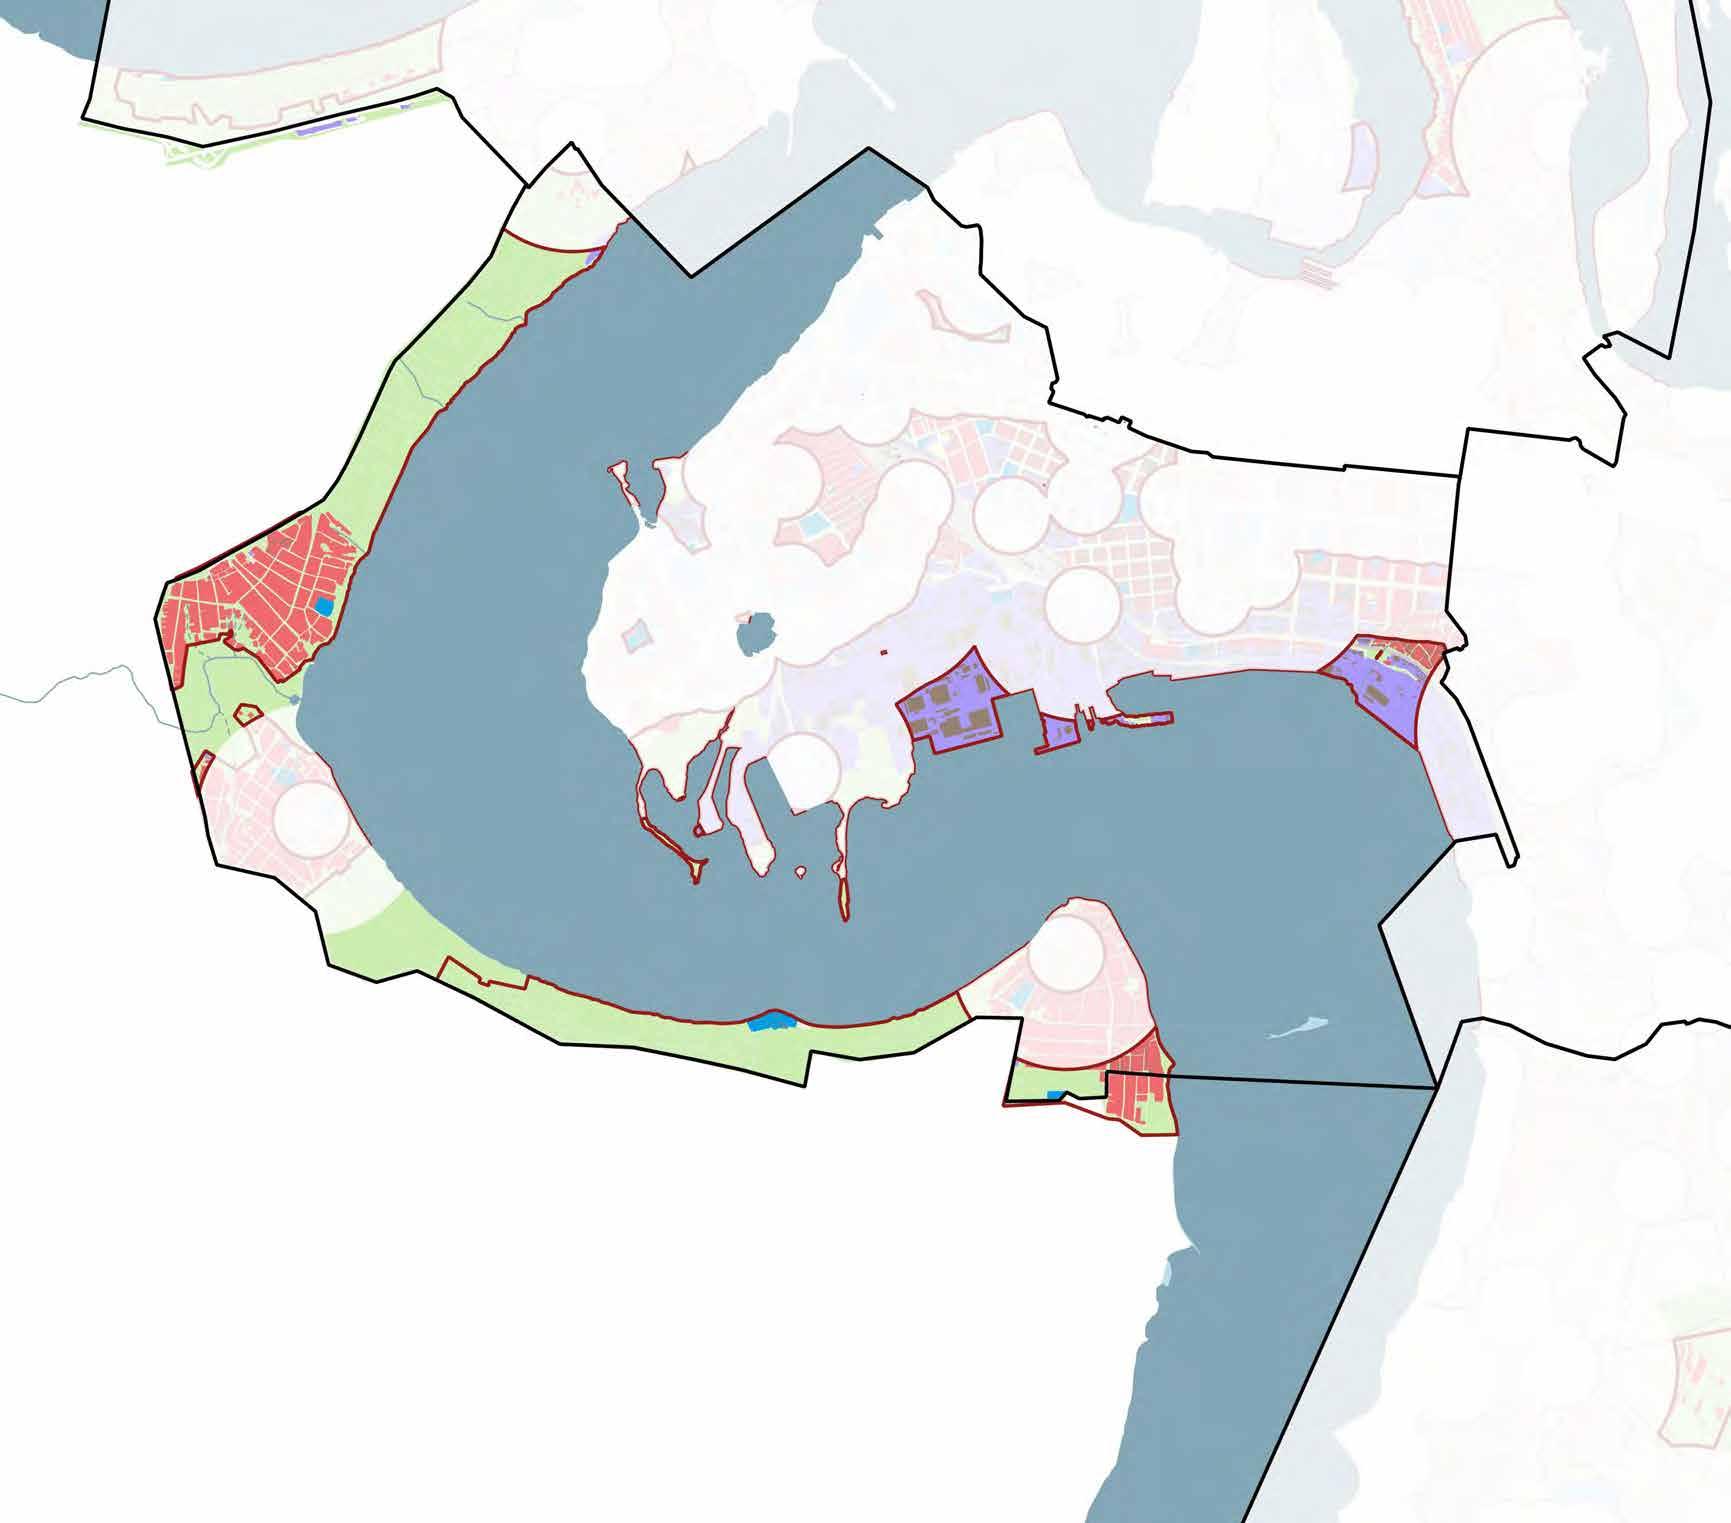
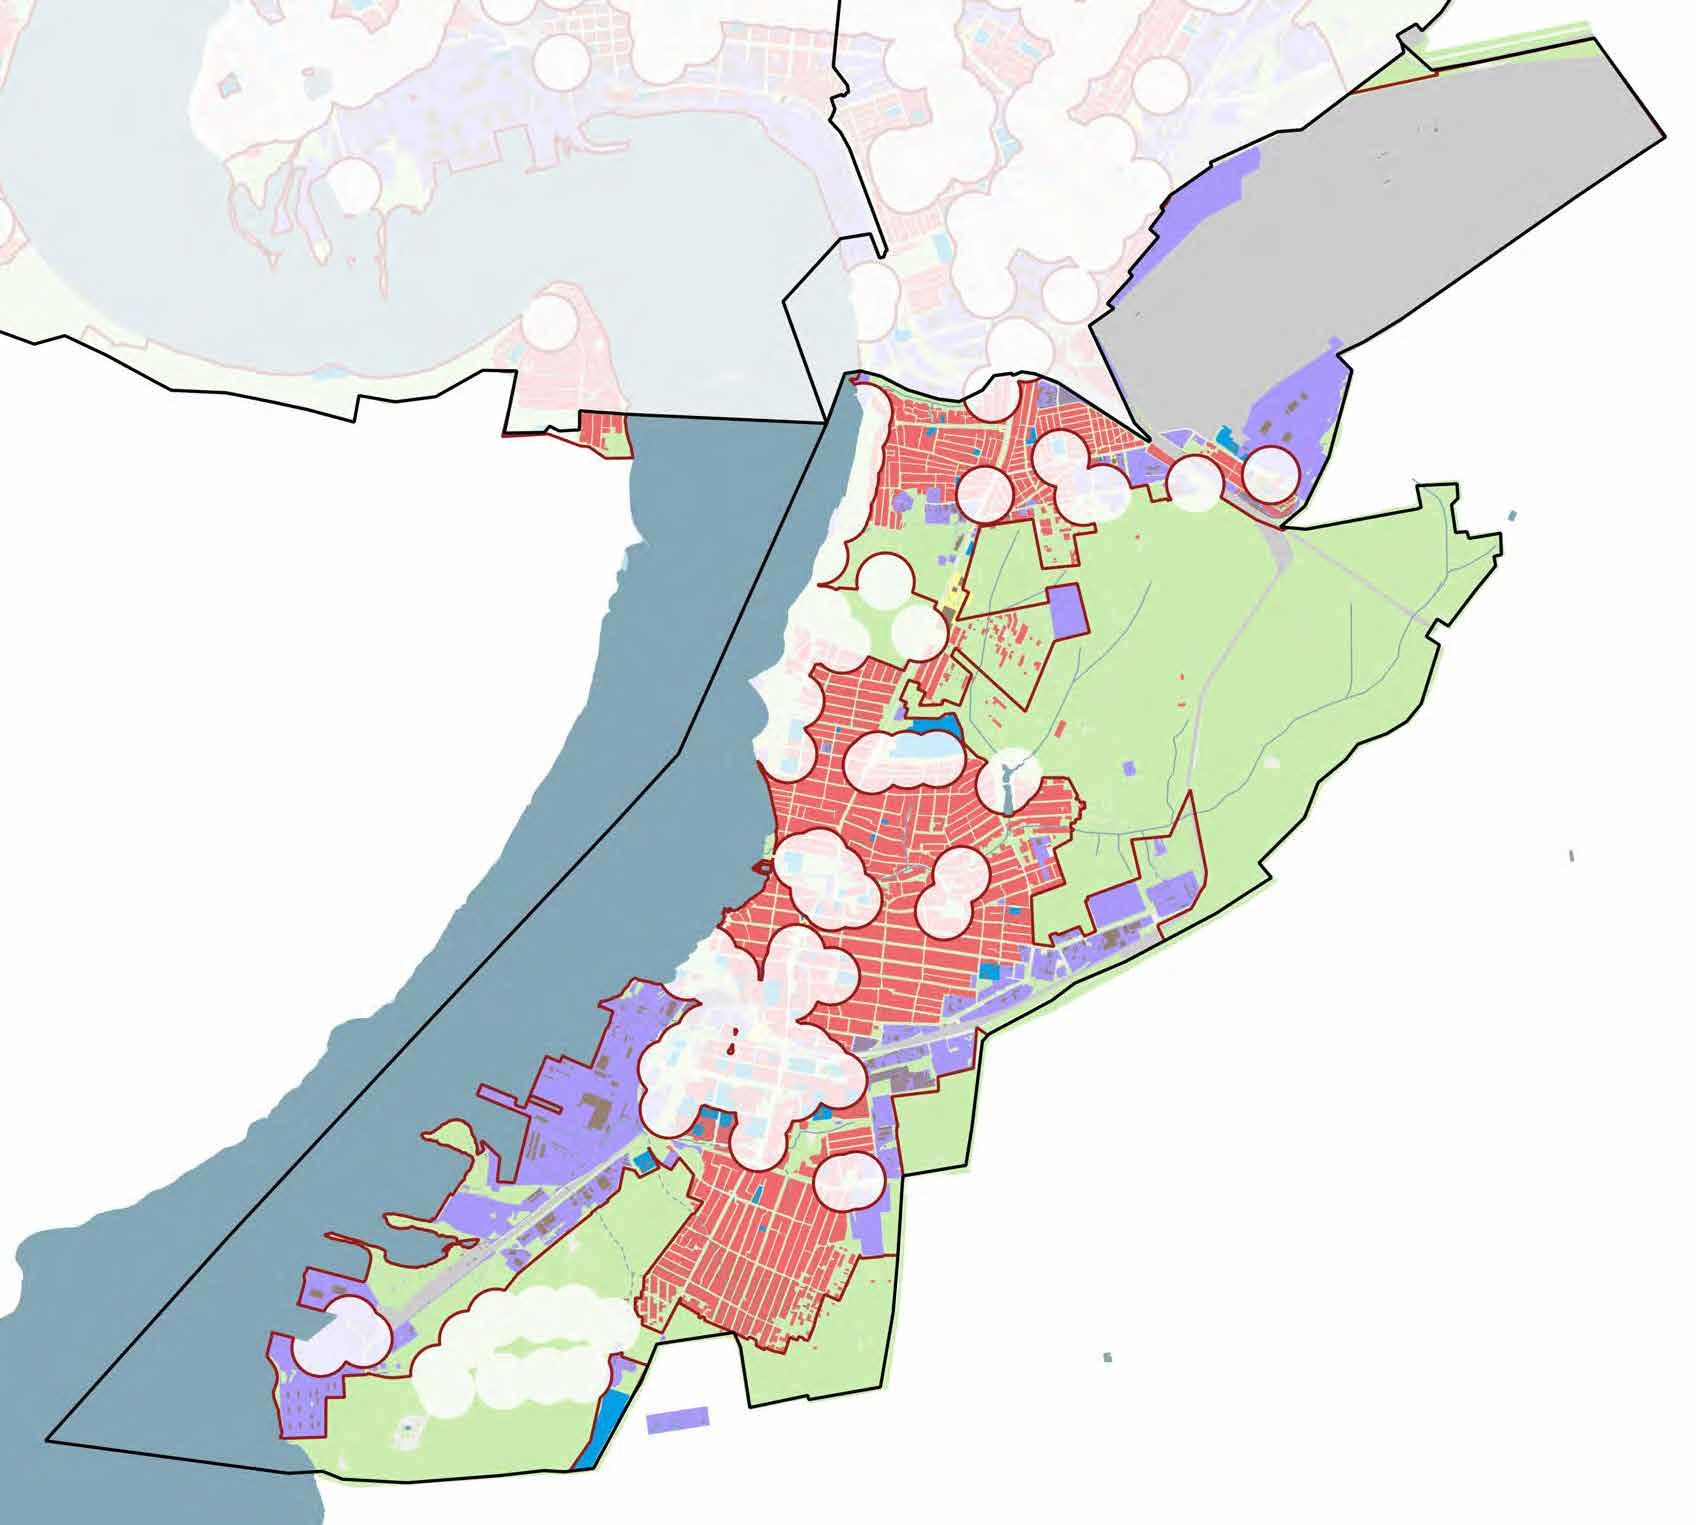
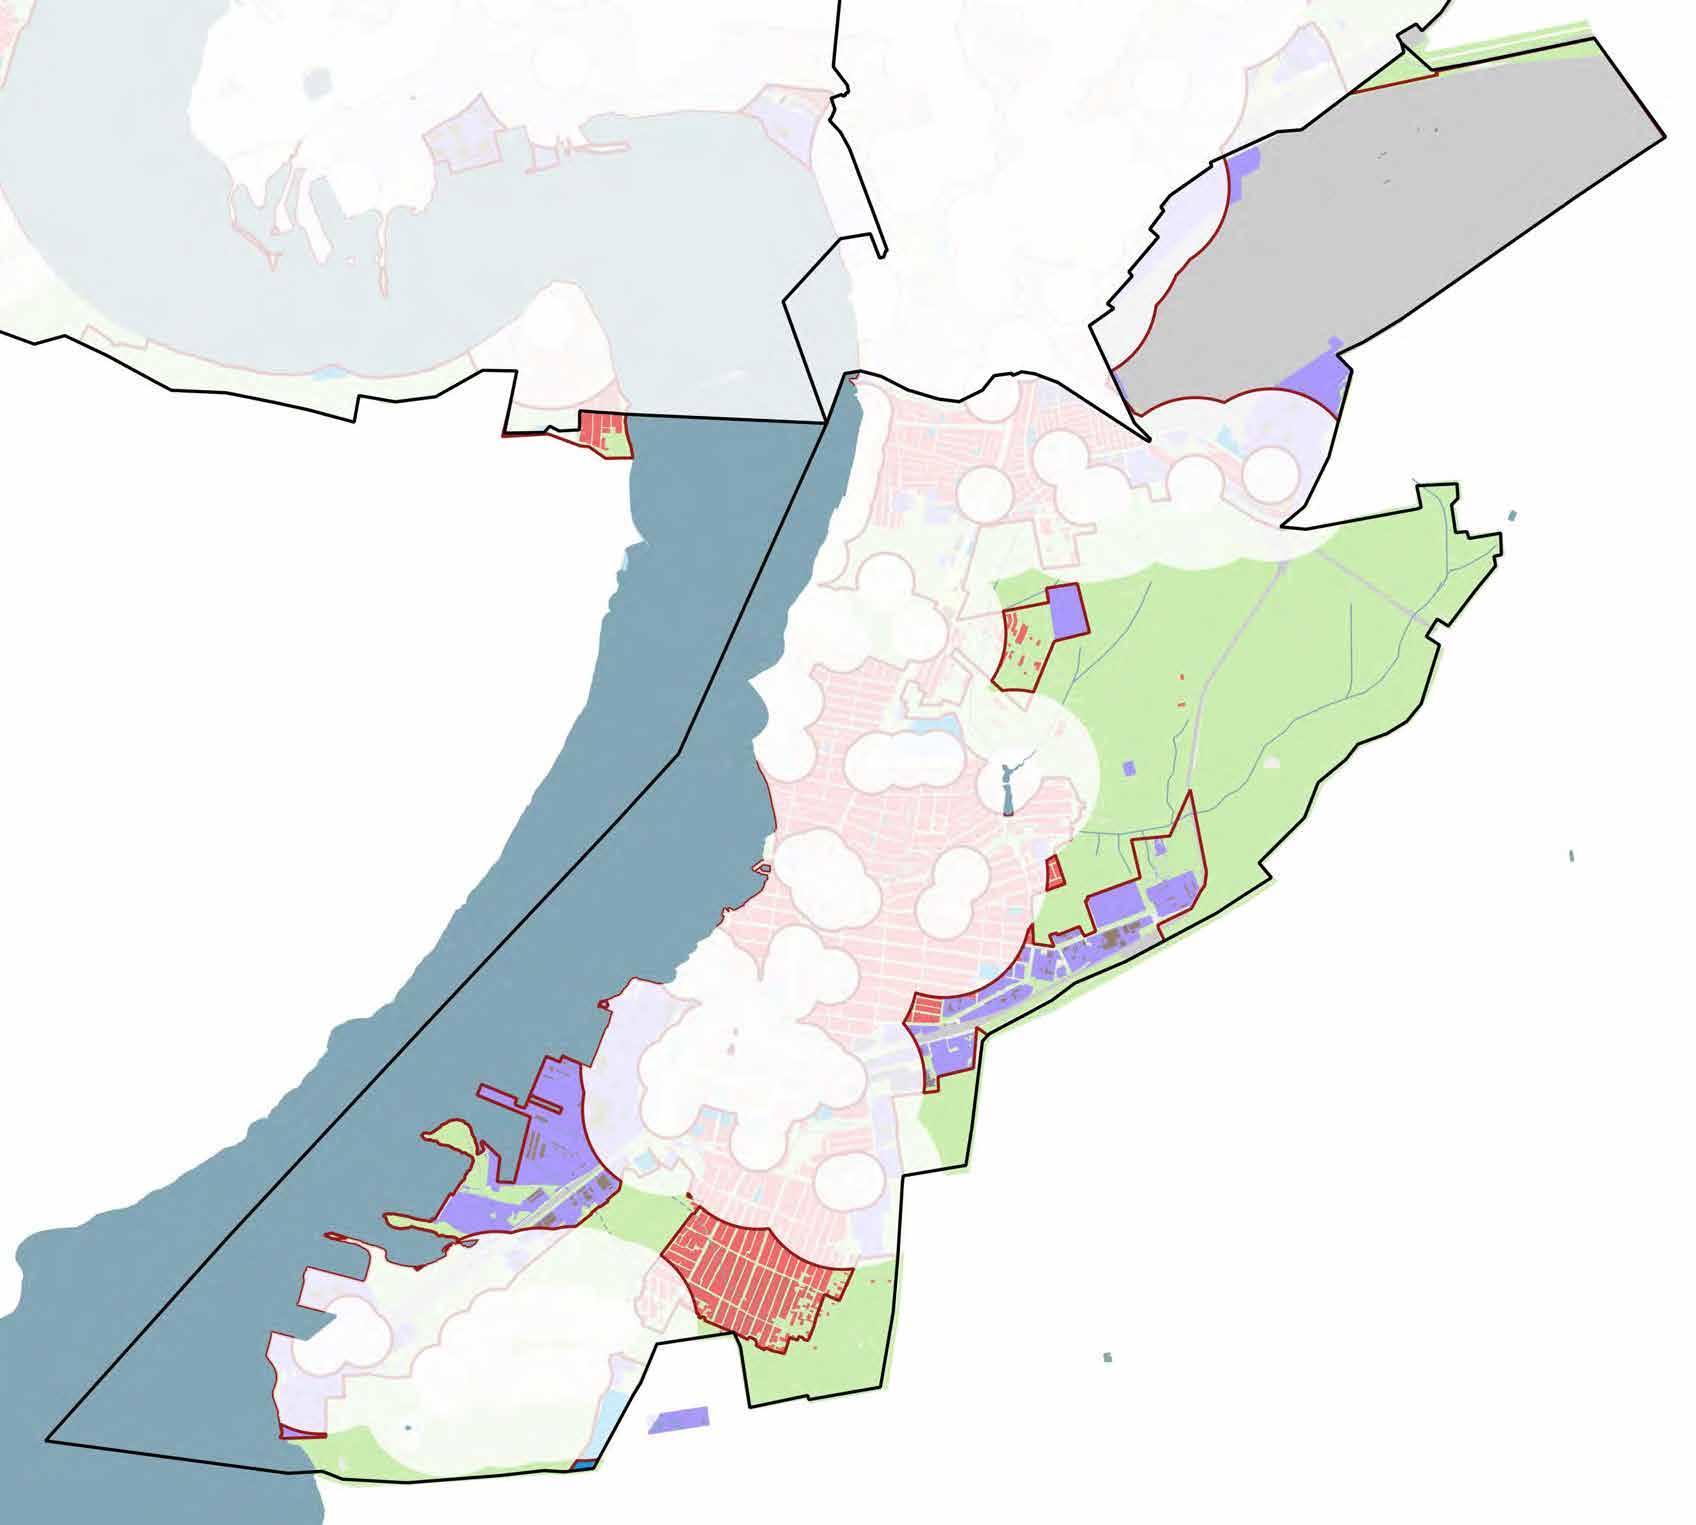
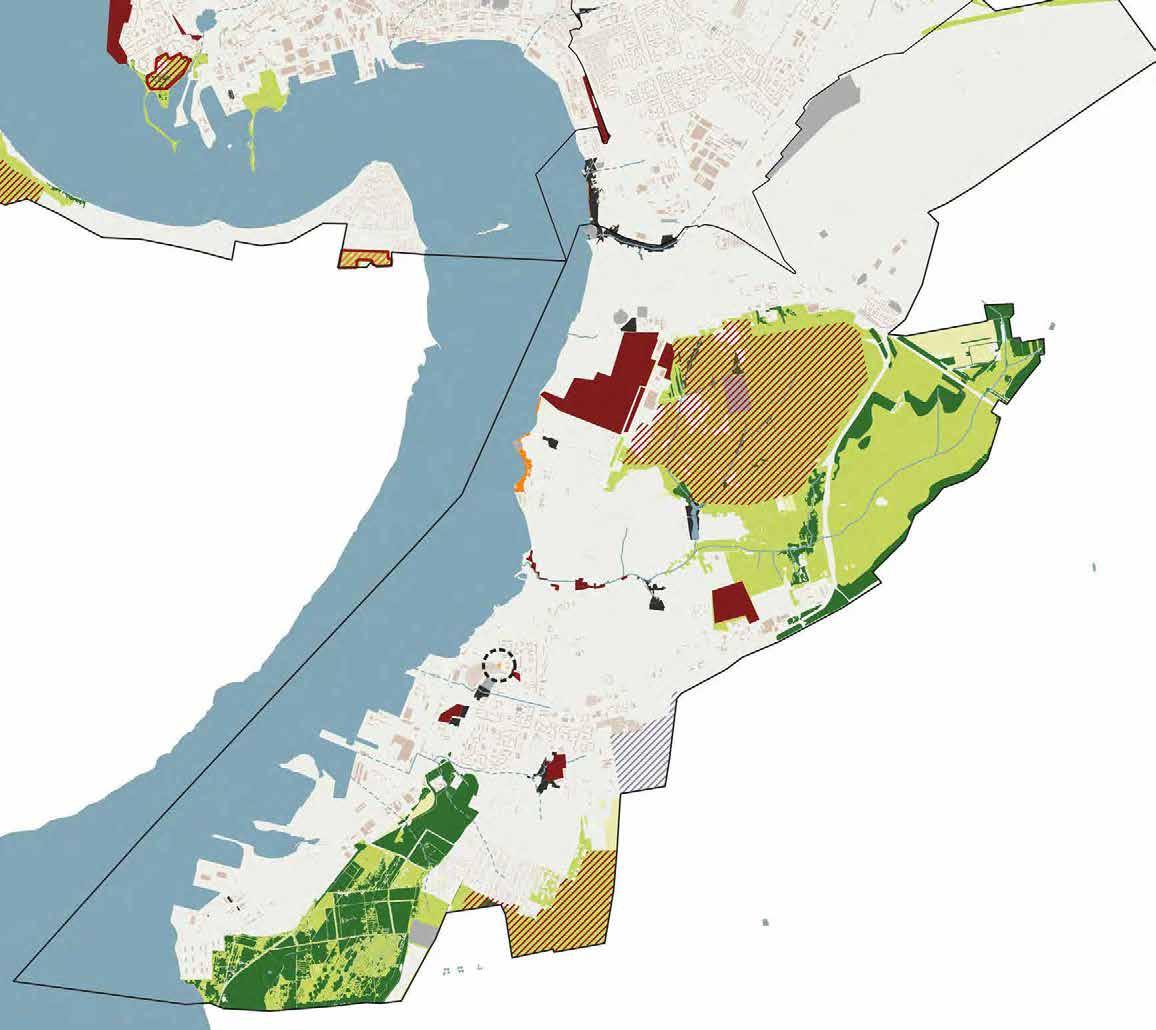
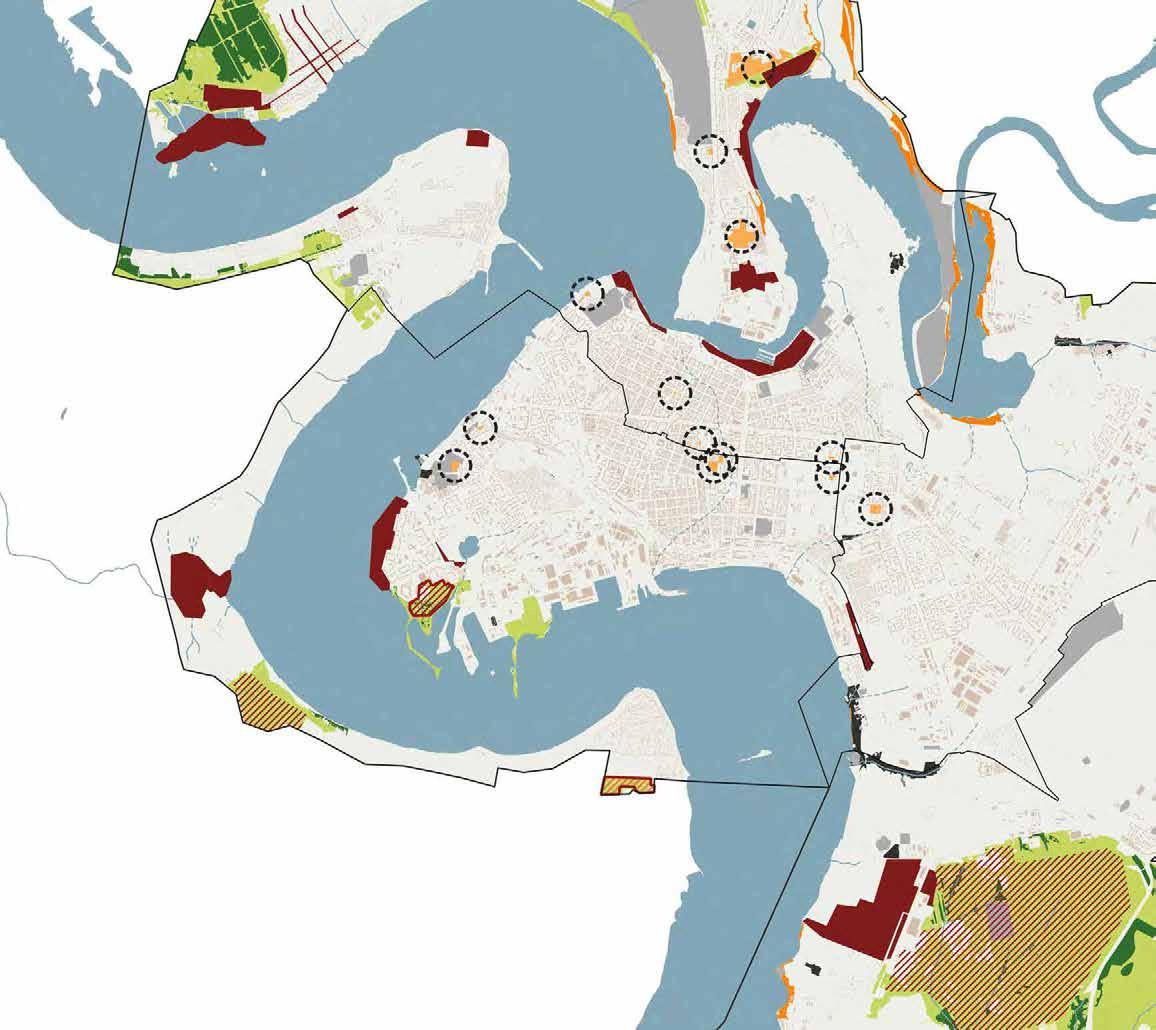
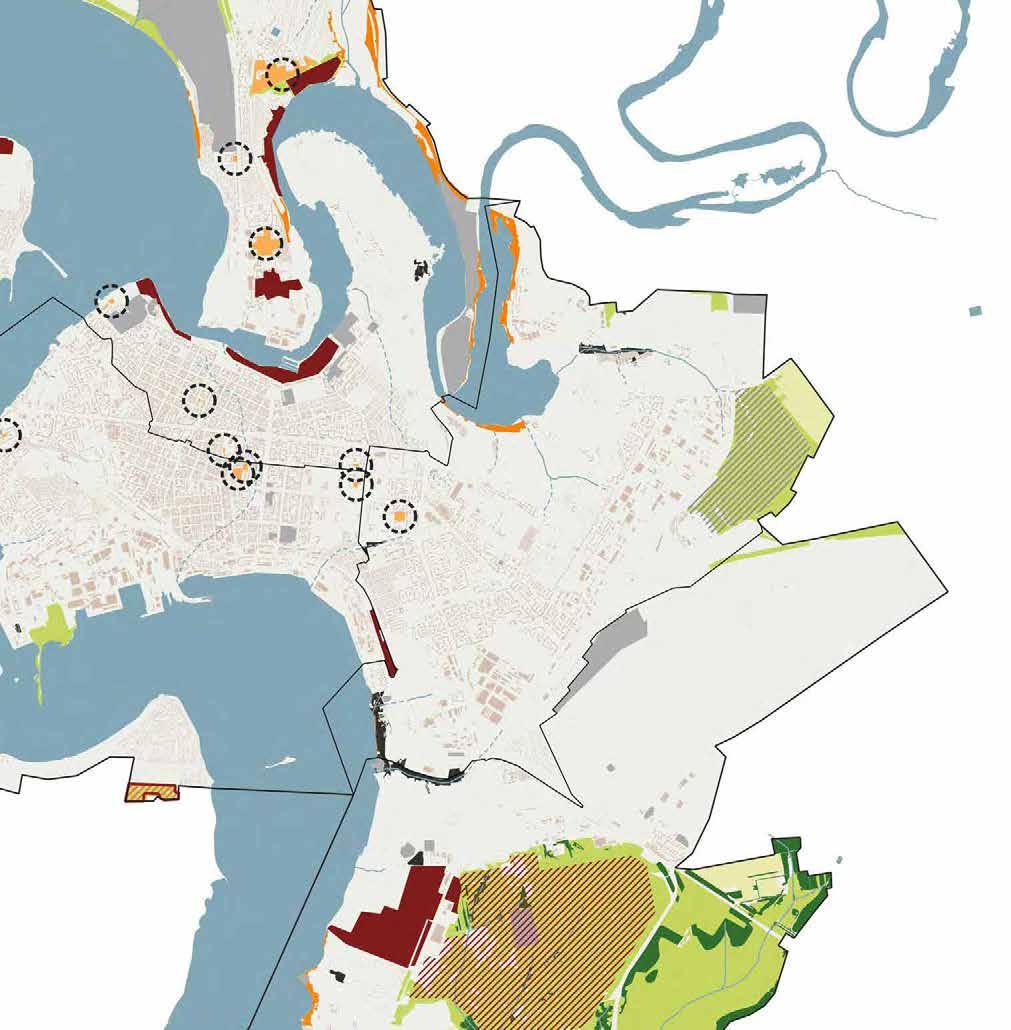
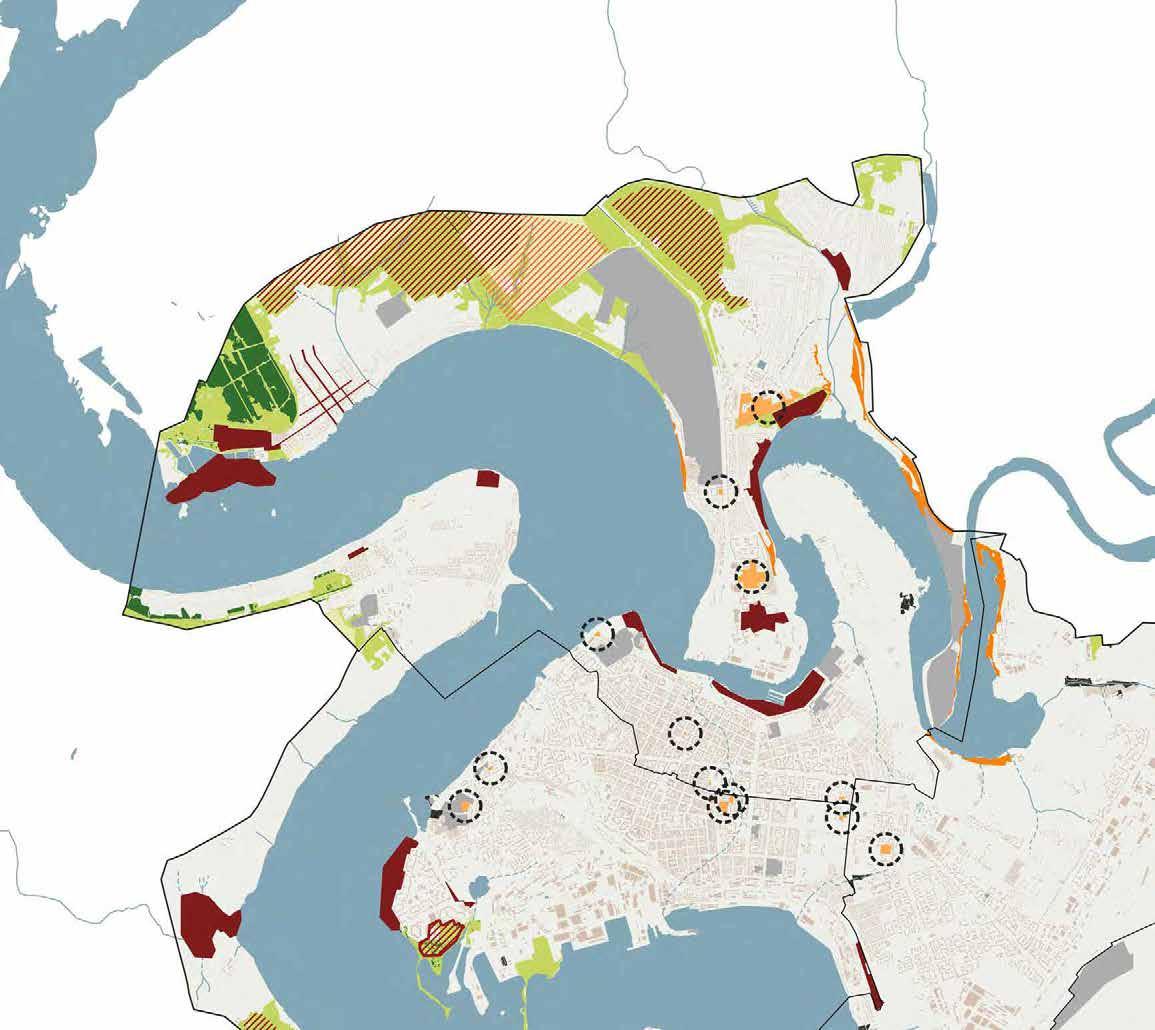
• Nature Reserves and Parks (Yelanetskyi Step Nature Preserve). Within the municipality of Mykolaiv, the following types of ecological value areas have been identified and localized in the map on the next page:
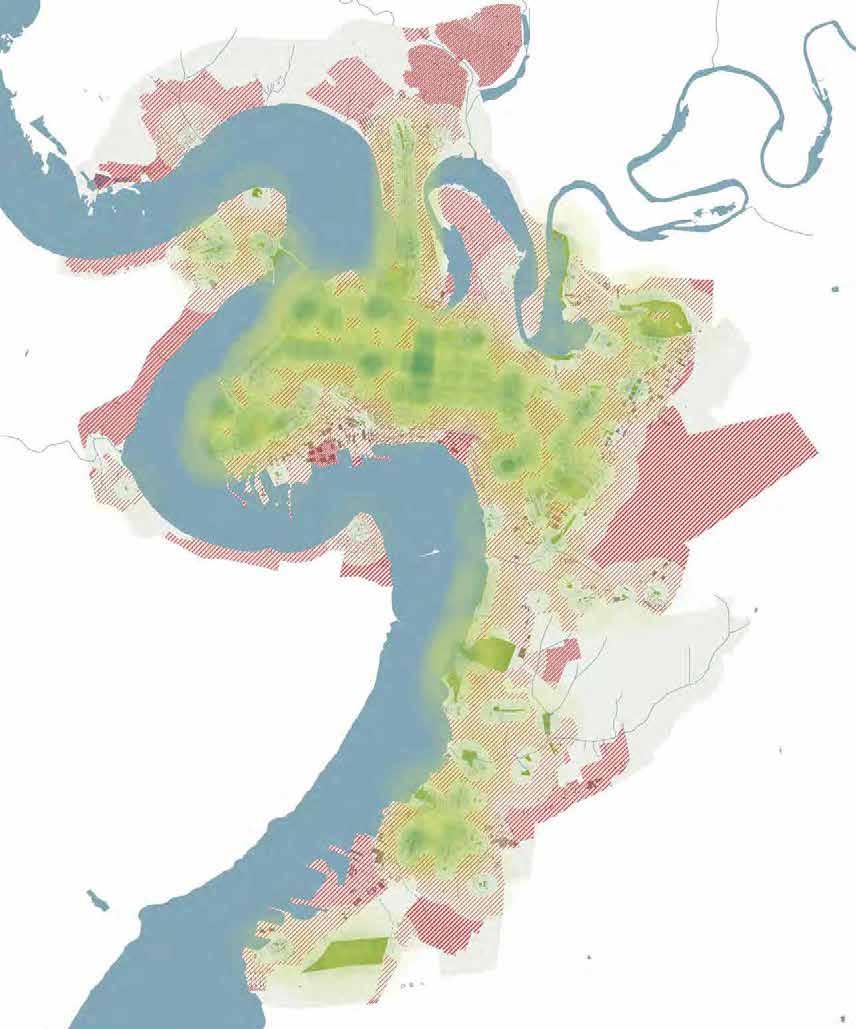
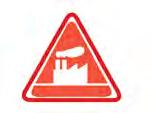
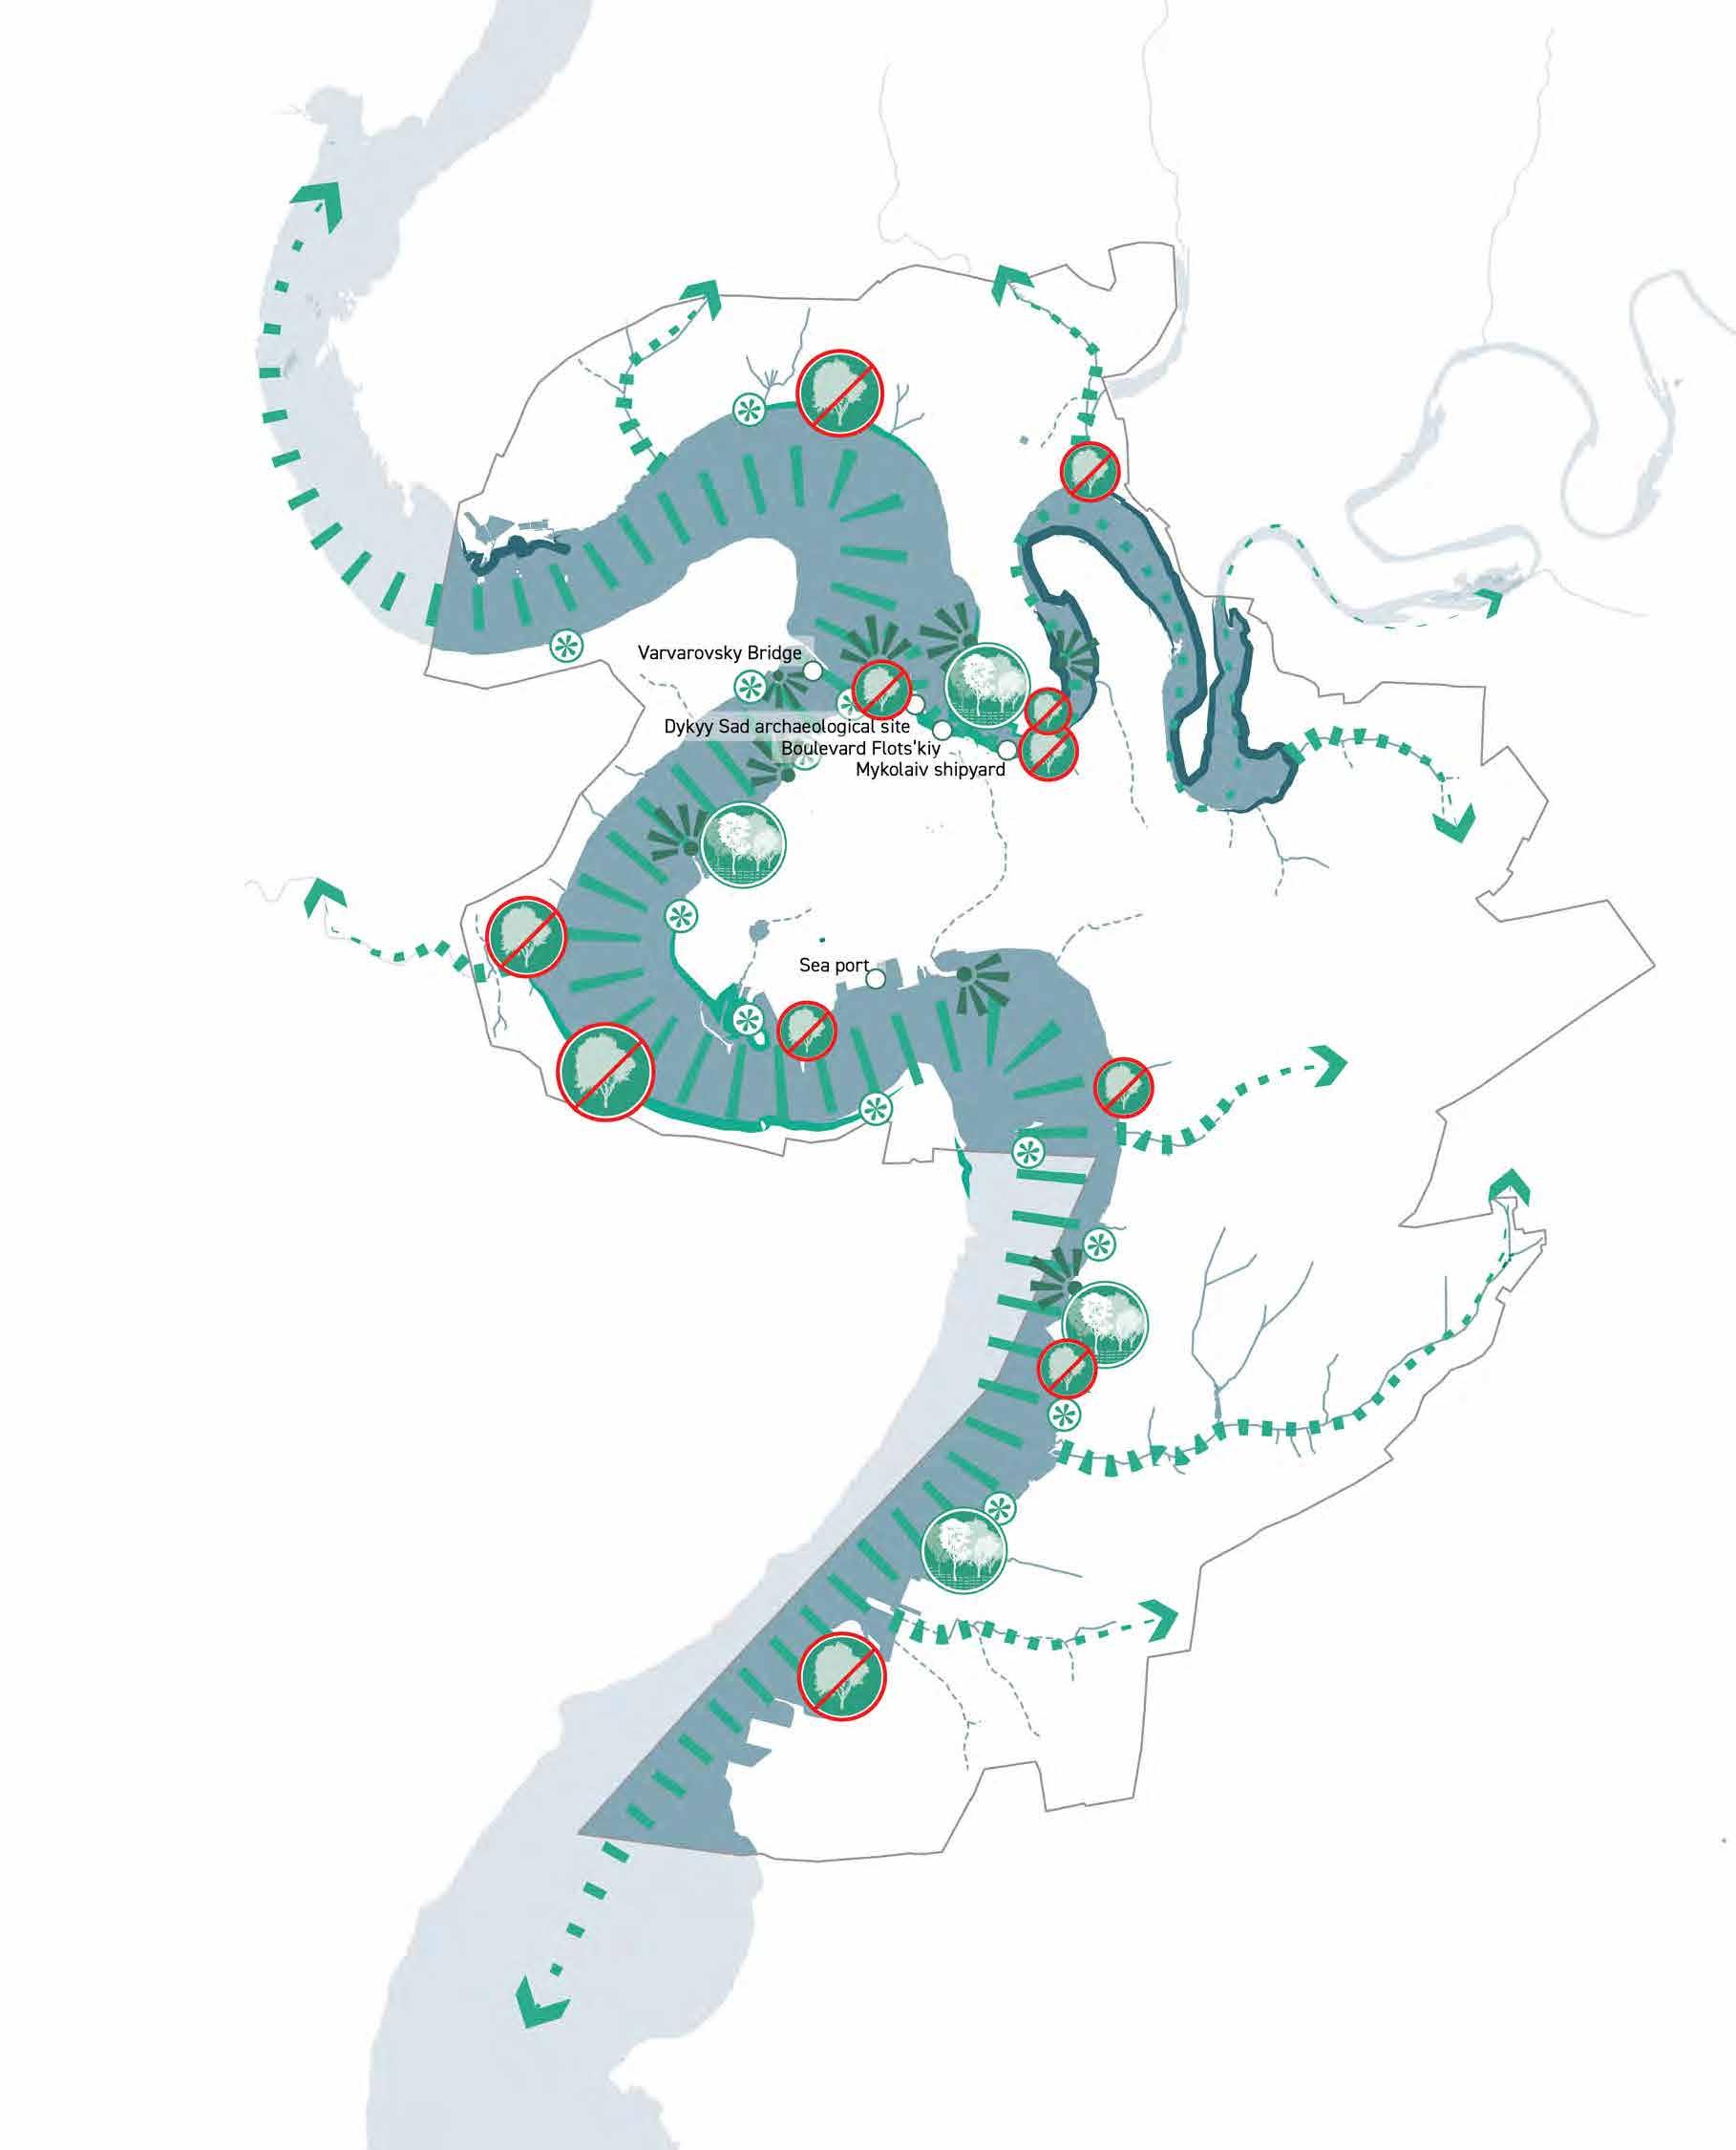
• The main river axes (Main ecological corridors in the legend)as well as the water canals that run almost entirely through the city identify the main ecological corridors, on which different degrees of naturalness and artificialization are interposed.
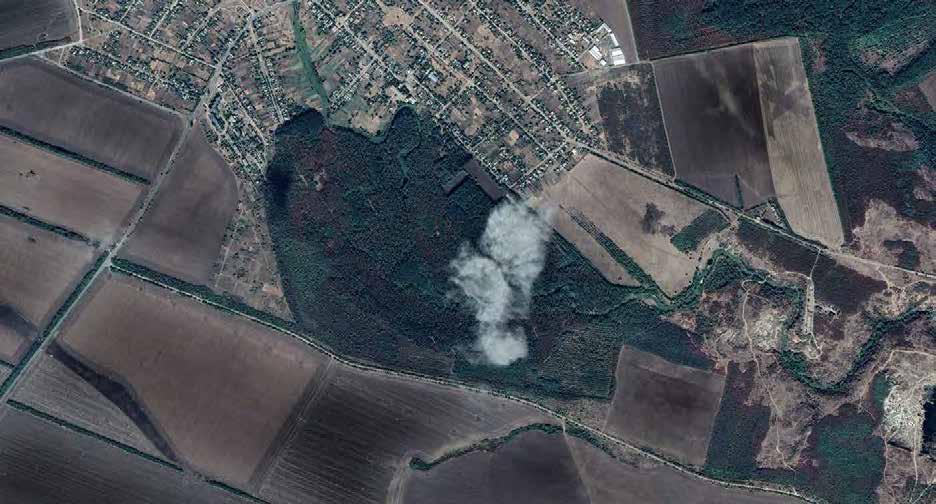
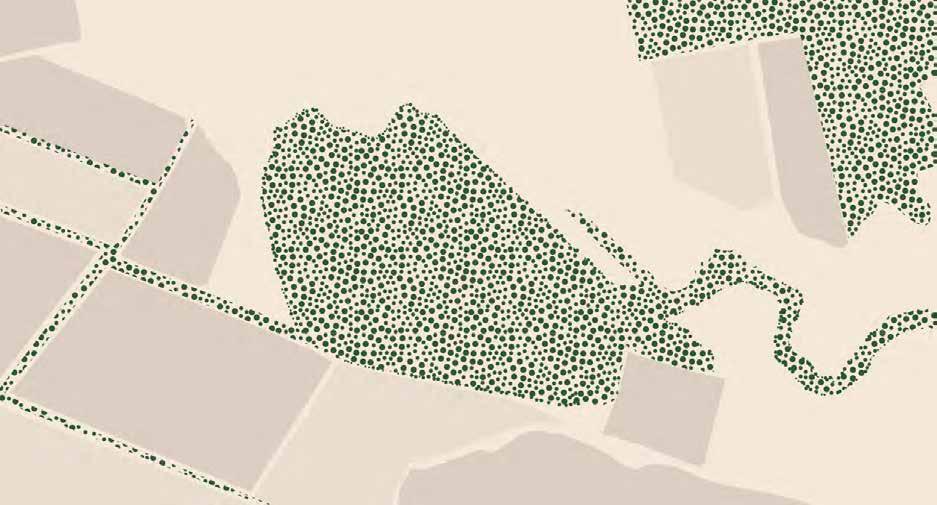
• Areas in dark green (Core Areas in the legend) correspond to areas of greater ecological value such as forests, wetlands and grassland formations. Thanks to their ecological value and a high biodiversity presence, these areas can be considered as vital habitats within the ecological network.
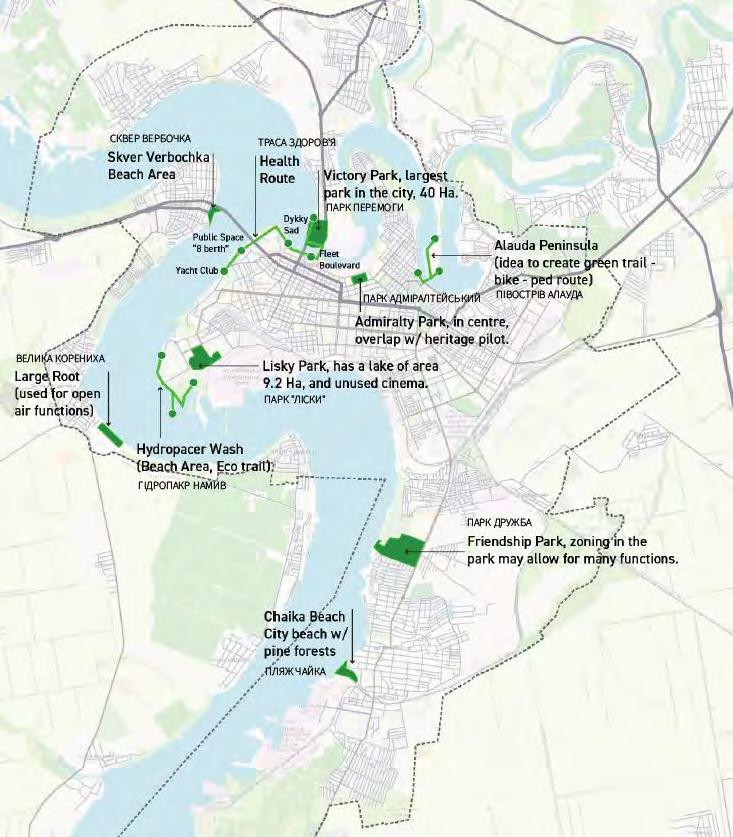
• Areas in green (Main green areas in the legend) correspond to the system of urban green areas, green axes and parks that identify specific natural areas whose location is strategic for the identification and systemization of the landscape.
• Areas in light green (Stepping stones in the legend) corrispond to optimal ecological fragments not interconnected.
• Areas in brown (Green areas of low ecological quality in the legend) correspond to all green areas of the city with a low ecological value due to their relationship with the surroundings such as industrial or infrastructural areas.
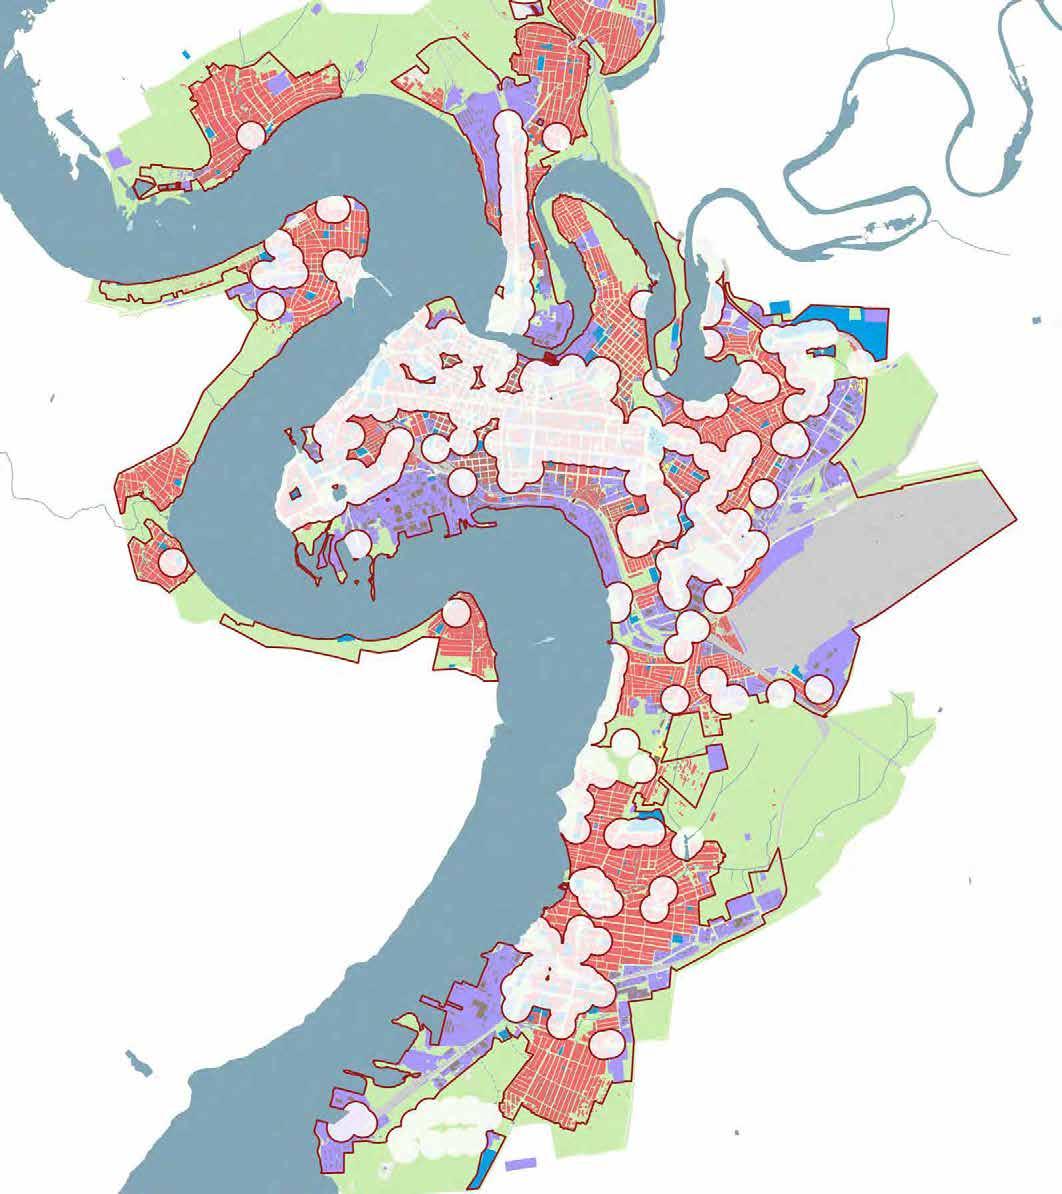
The industrial and port service areas crowning the river axes are identified as non-permeable areas, determined by character and sealed surfaces that form a strong hinge, fragmenting the urban parts and open spaces. Infrastructural areas in orange correspond to less permeable ''shears'' whose degree of relationship with natural areas can be enhanced.
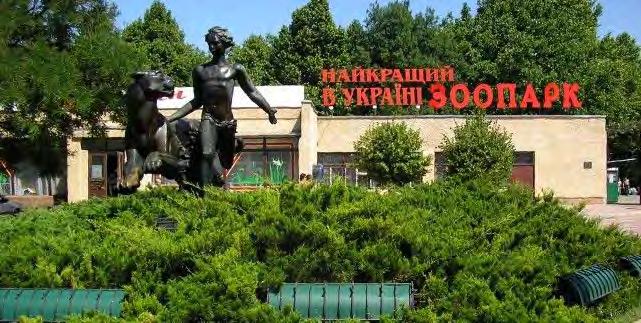
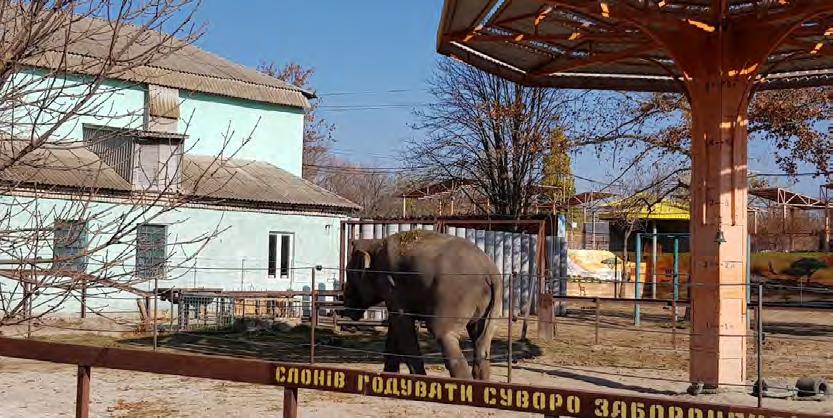
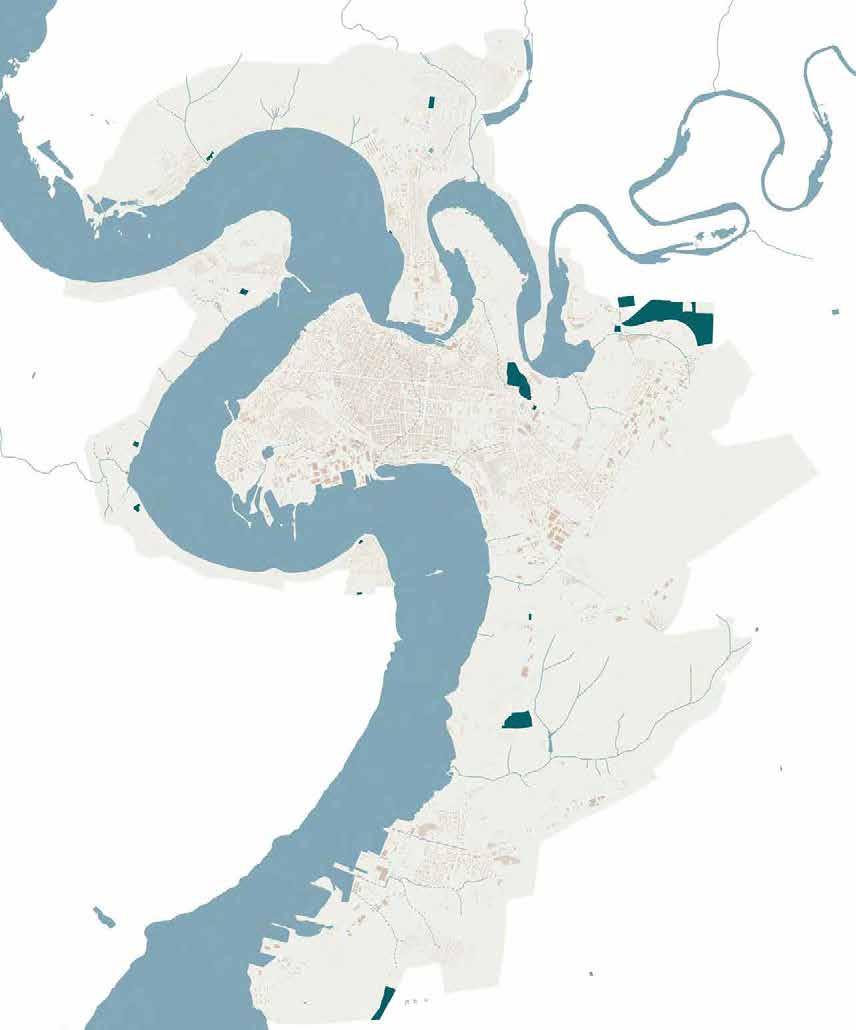
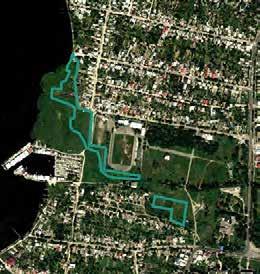
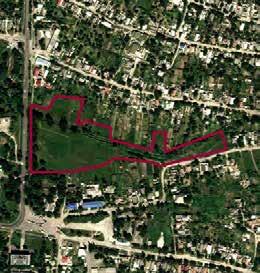
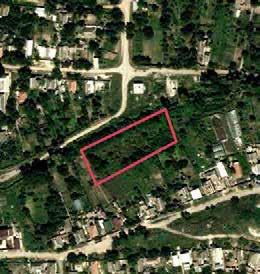
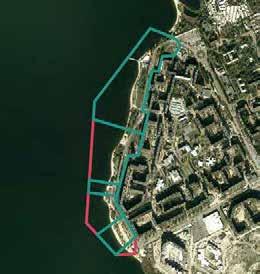
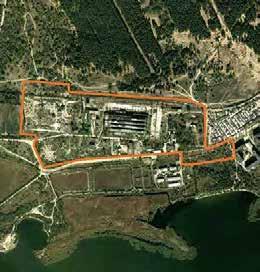
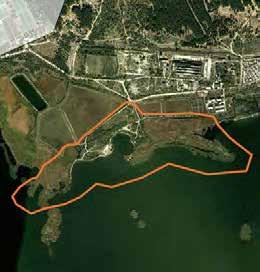
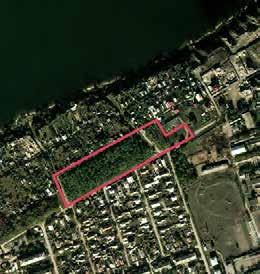
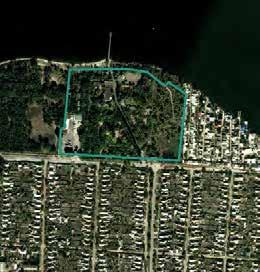
It is important to emphasize that Mykolaiv has many important natural areas of high ecological value. In fact, according to the "Report on Strategic Environmental Assessment" (2023), the greatest diversity of flora and fauna species is observed within the territories and objects of the Nature Reserve Fund. The network of the city's Nature Reserve Fund consists of 18 objects covering a total area of 1184 hectares (4.5% of the city territory). These areas play a fundamental role in the ecological dynamics of the city, providing important urban ecosystems: as indicated in the Strategic Environmental Assessment, there is an urgent need to develop maintenance and reconstruction projects to protect these areas. The most important objects are the Mykolaiv zoological park (18.5 ha), the Balabanivka nature reserve (510 ha), the Zhovtnevskoye reservoir (430 ha) and the Dubki reserve (90 ha).
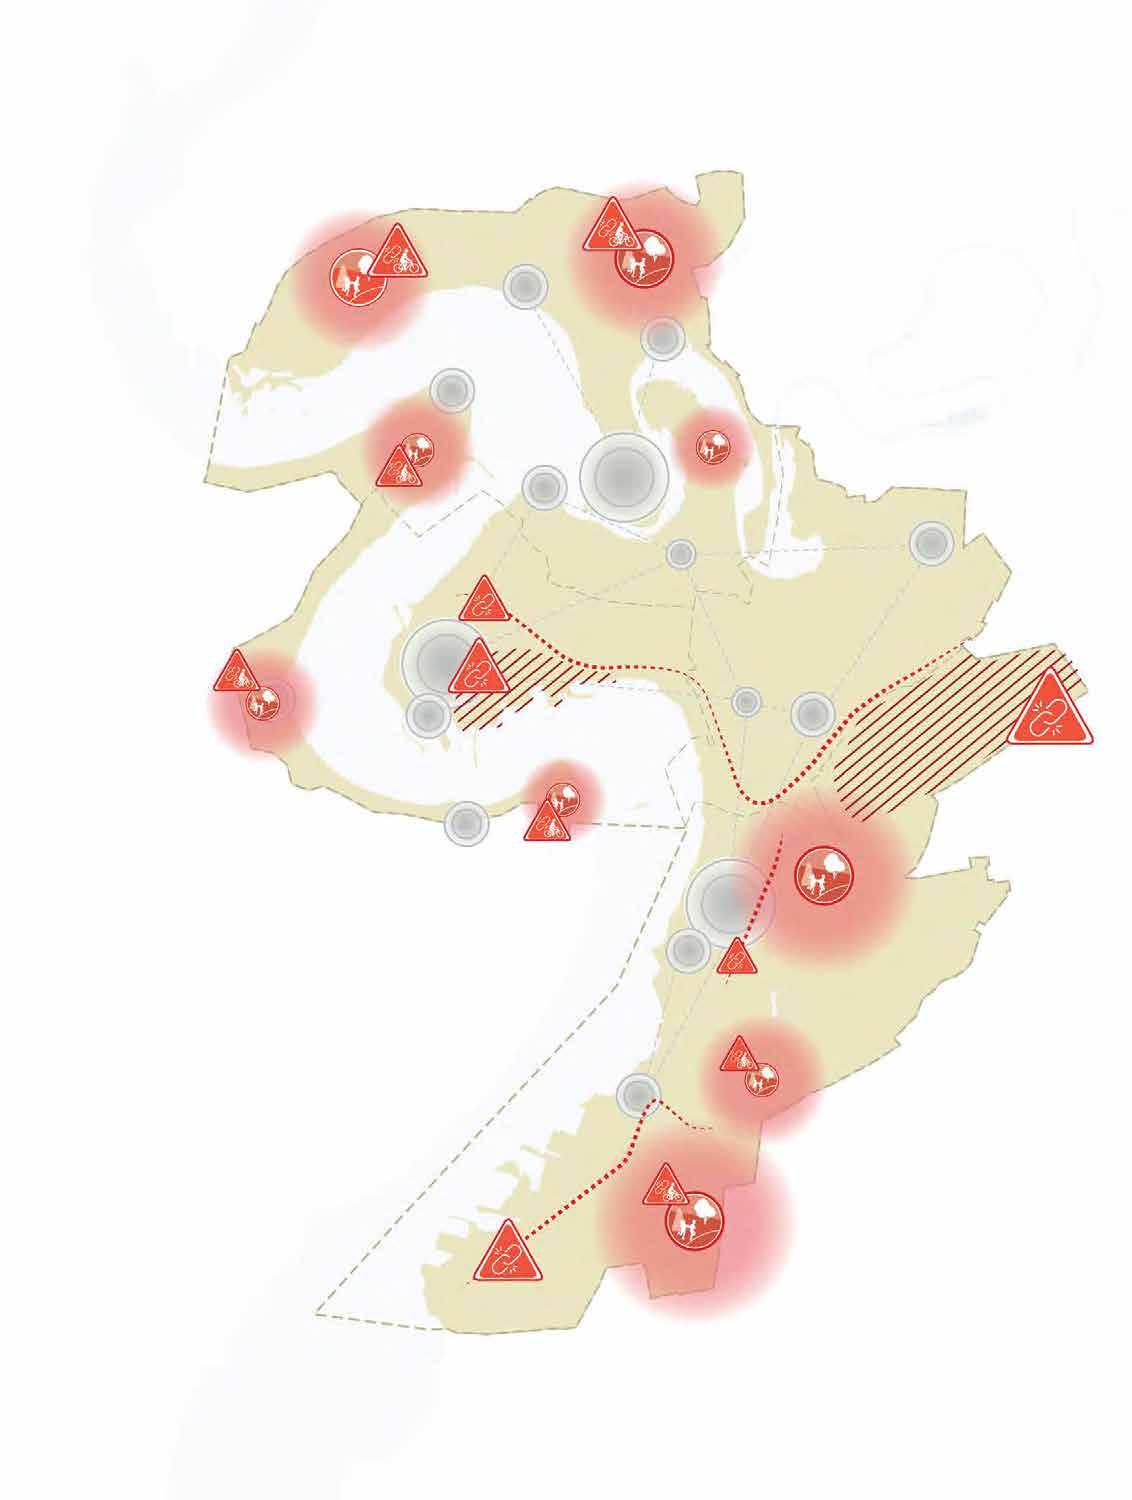
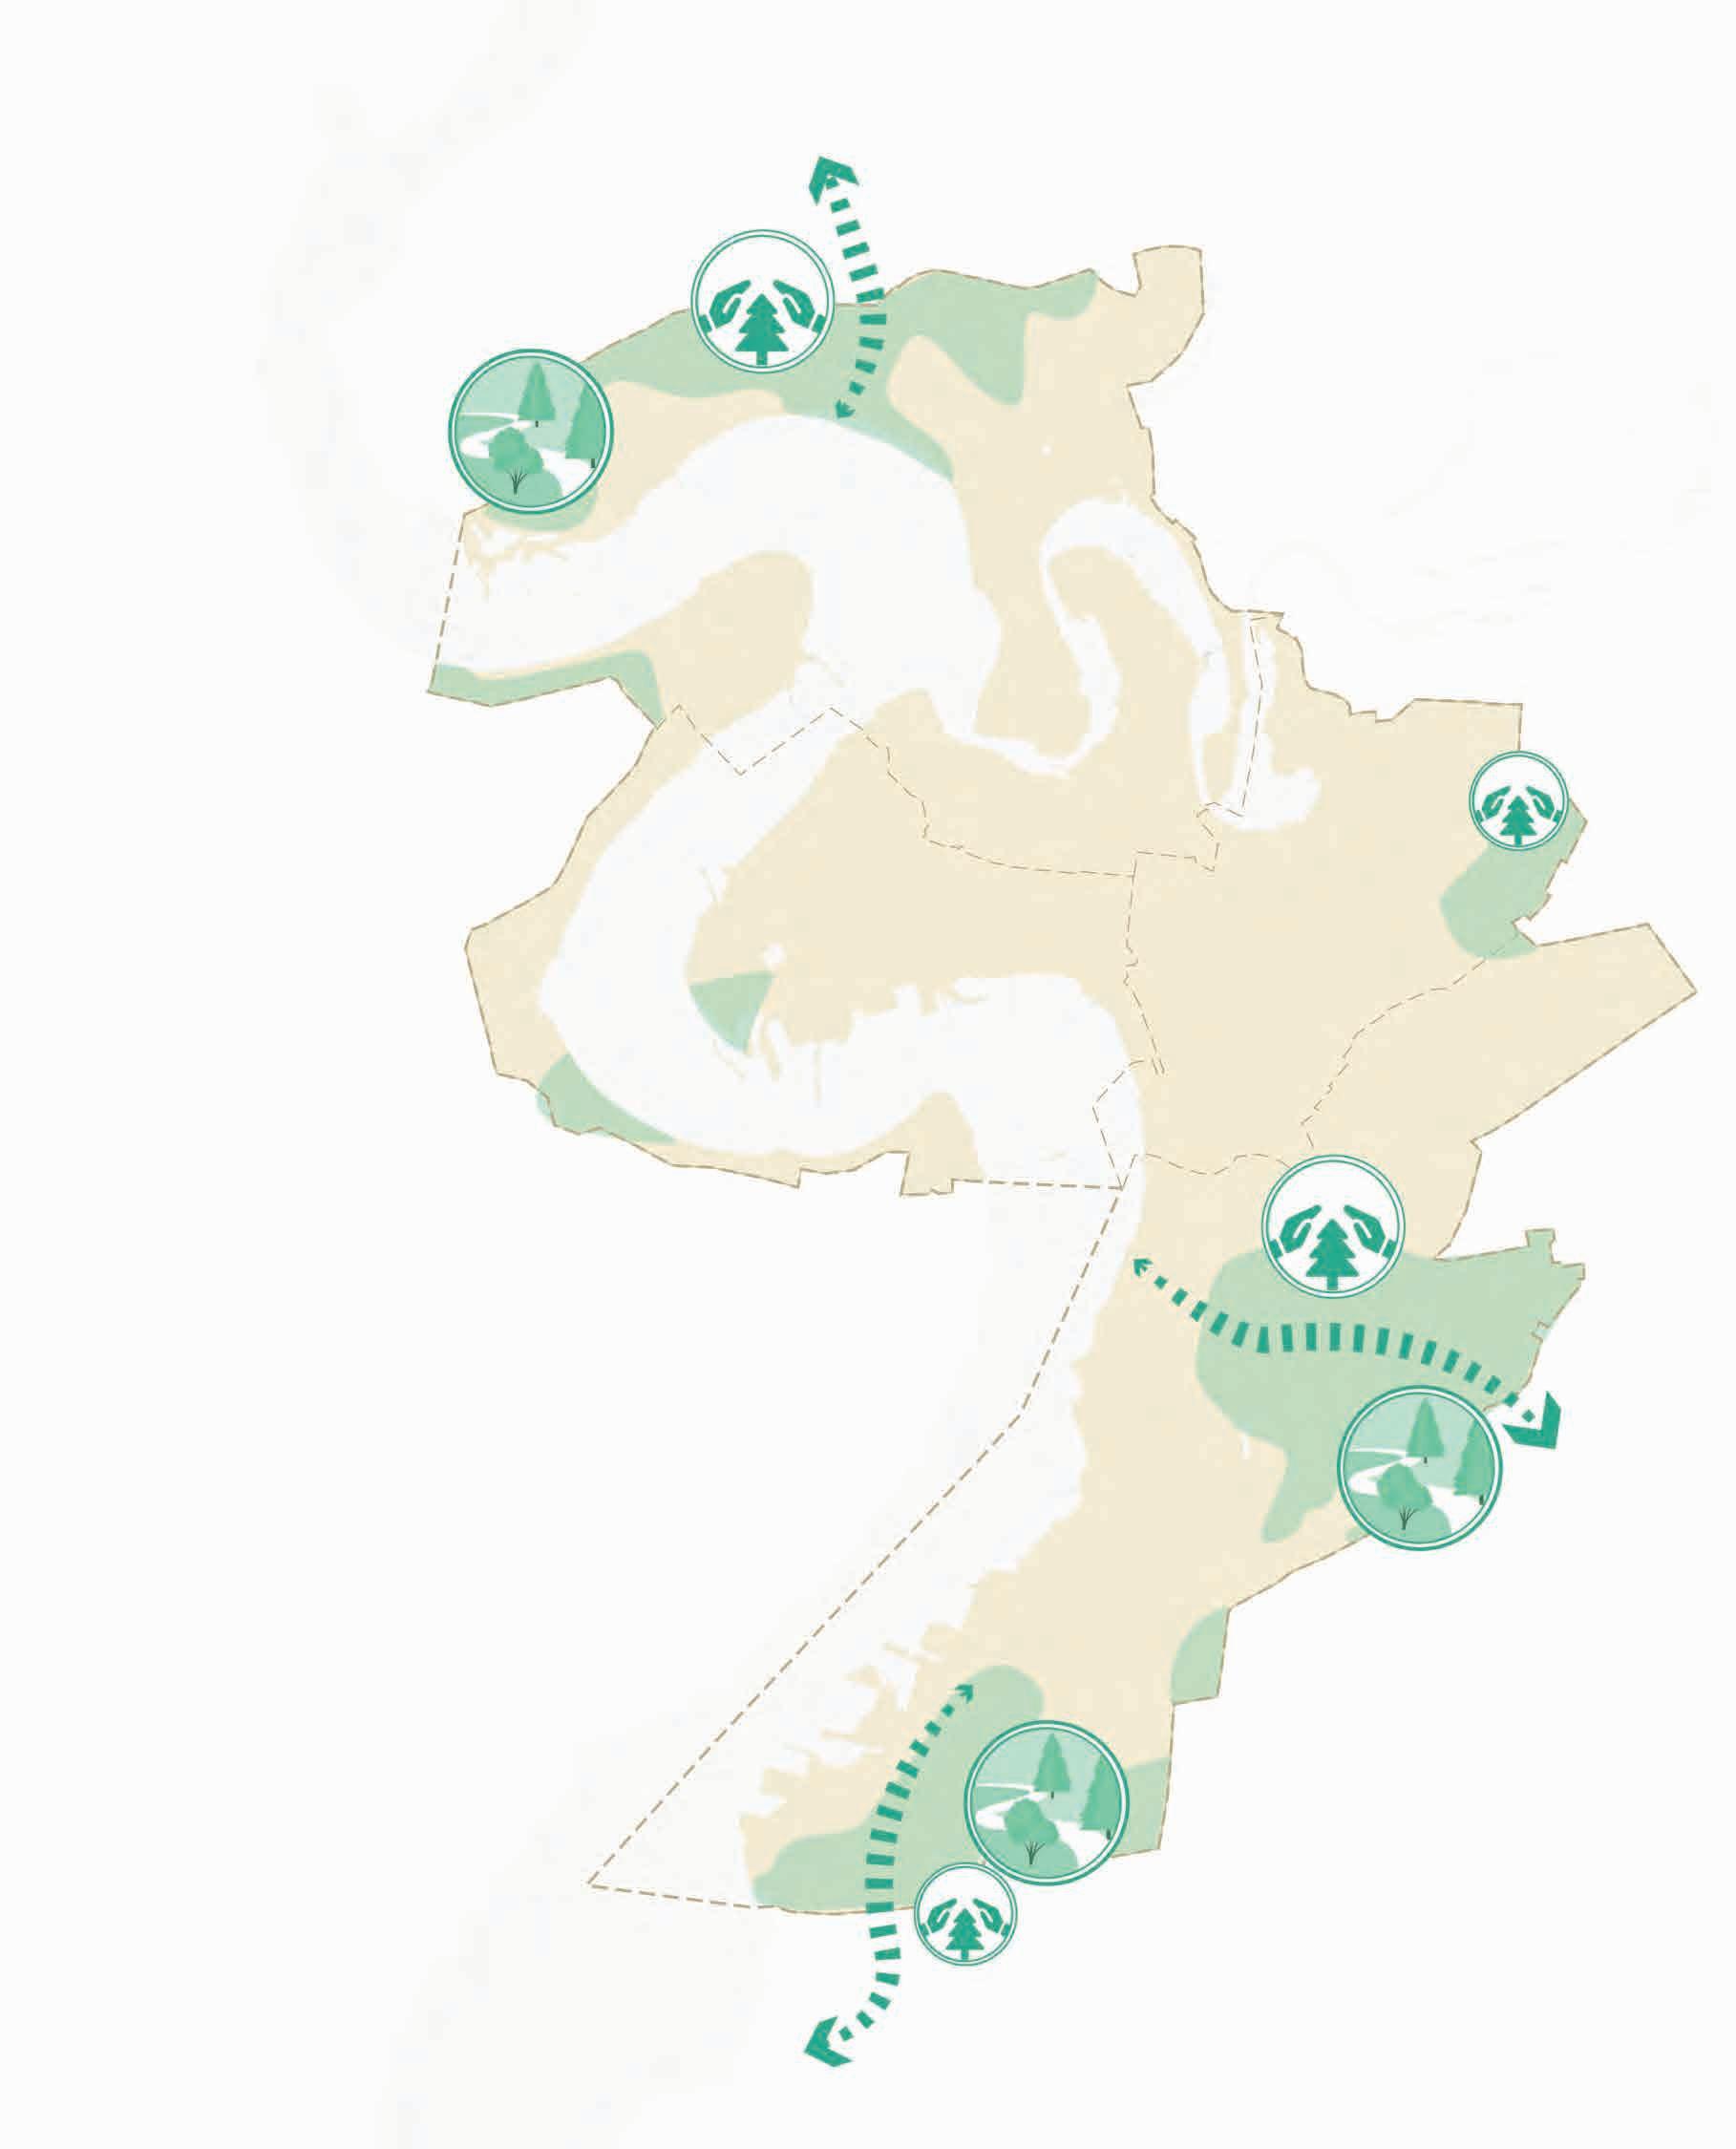
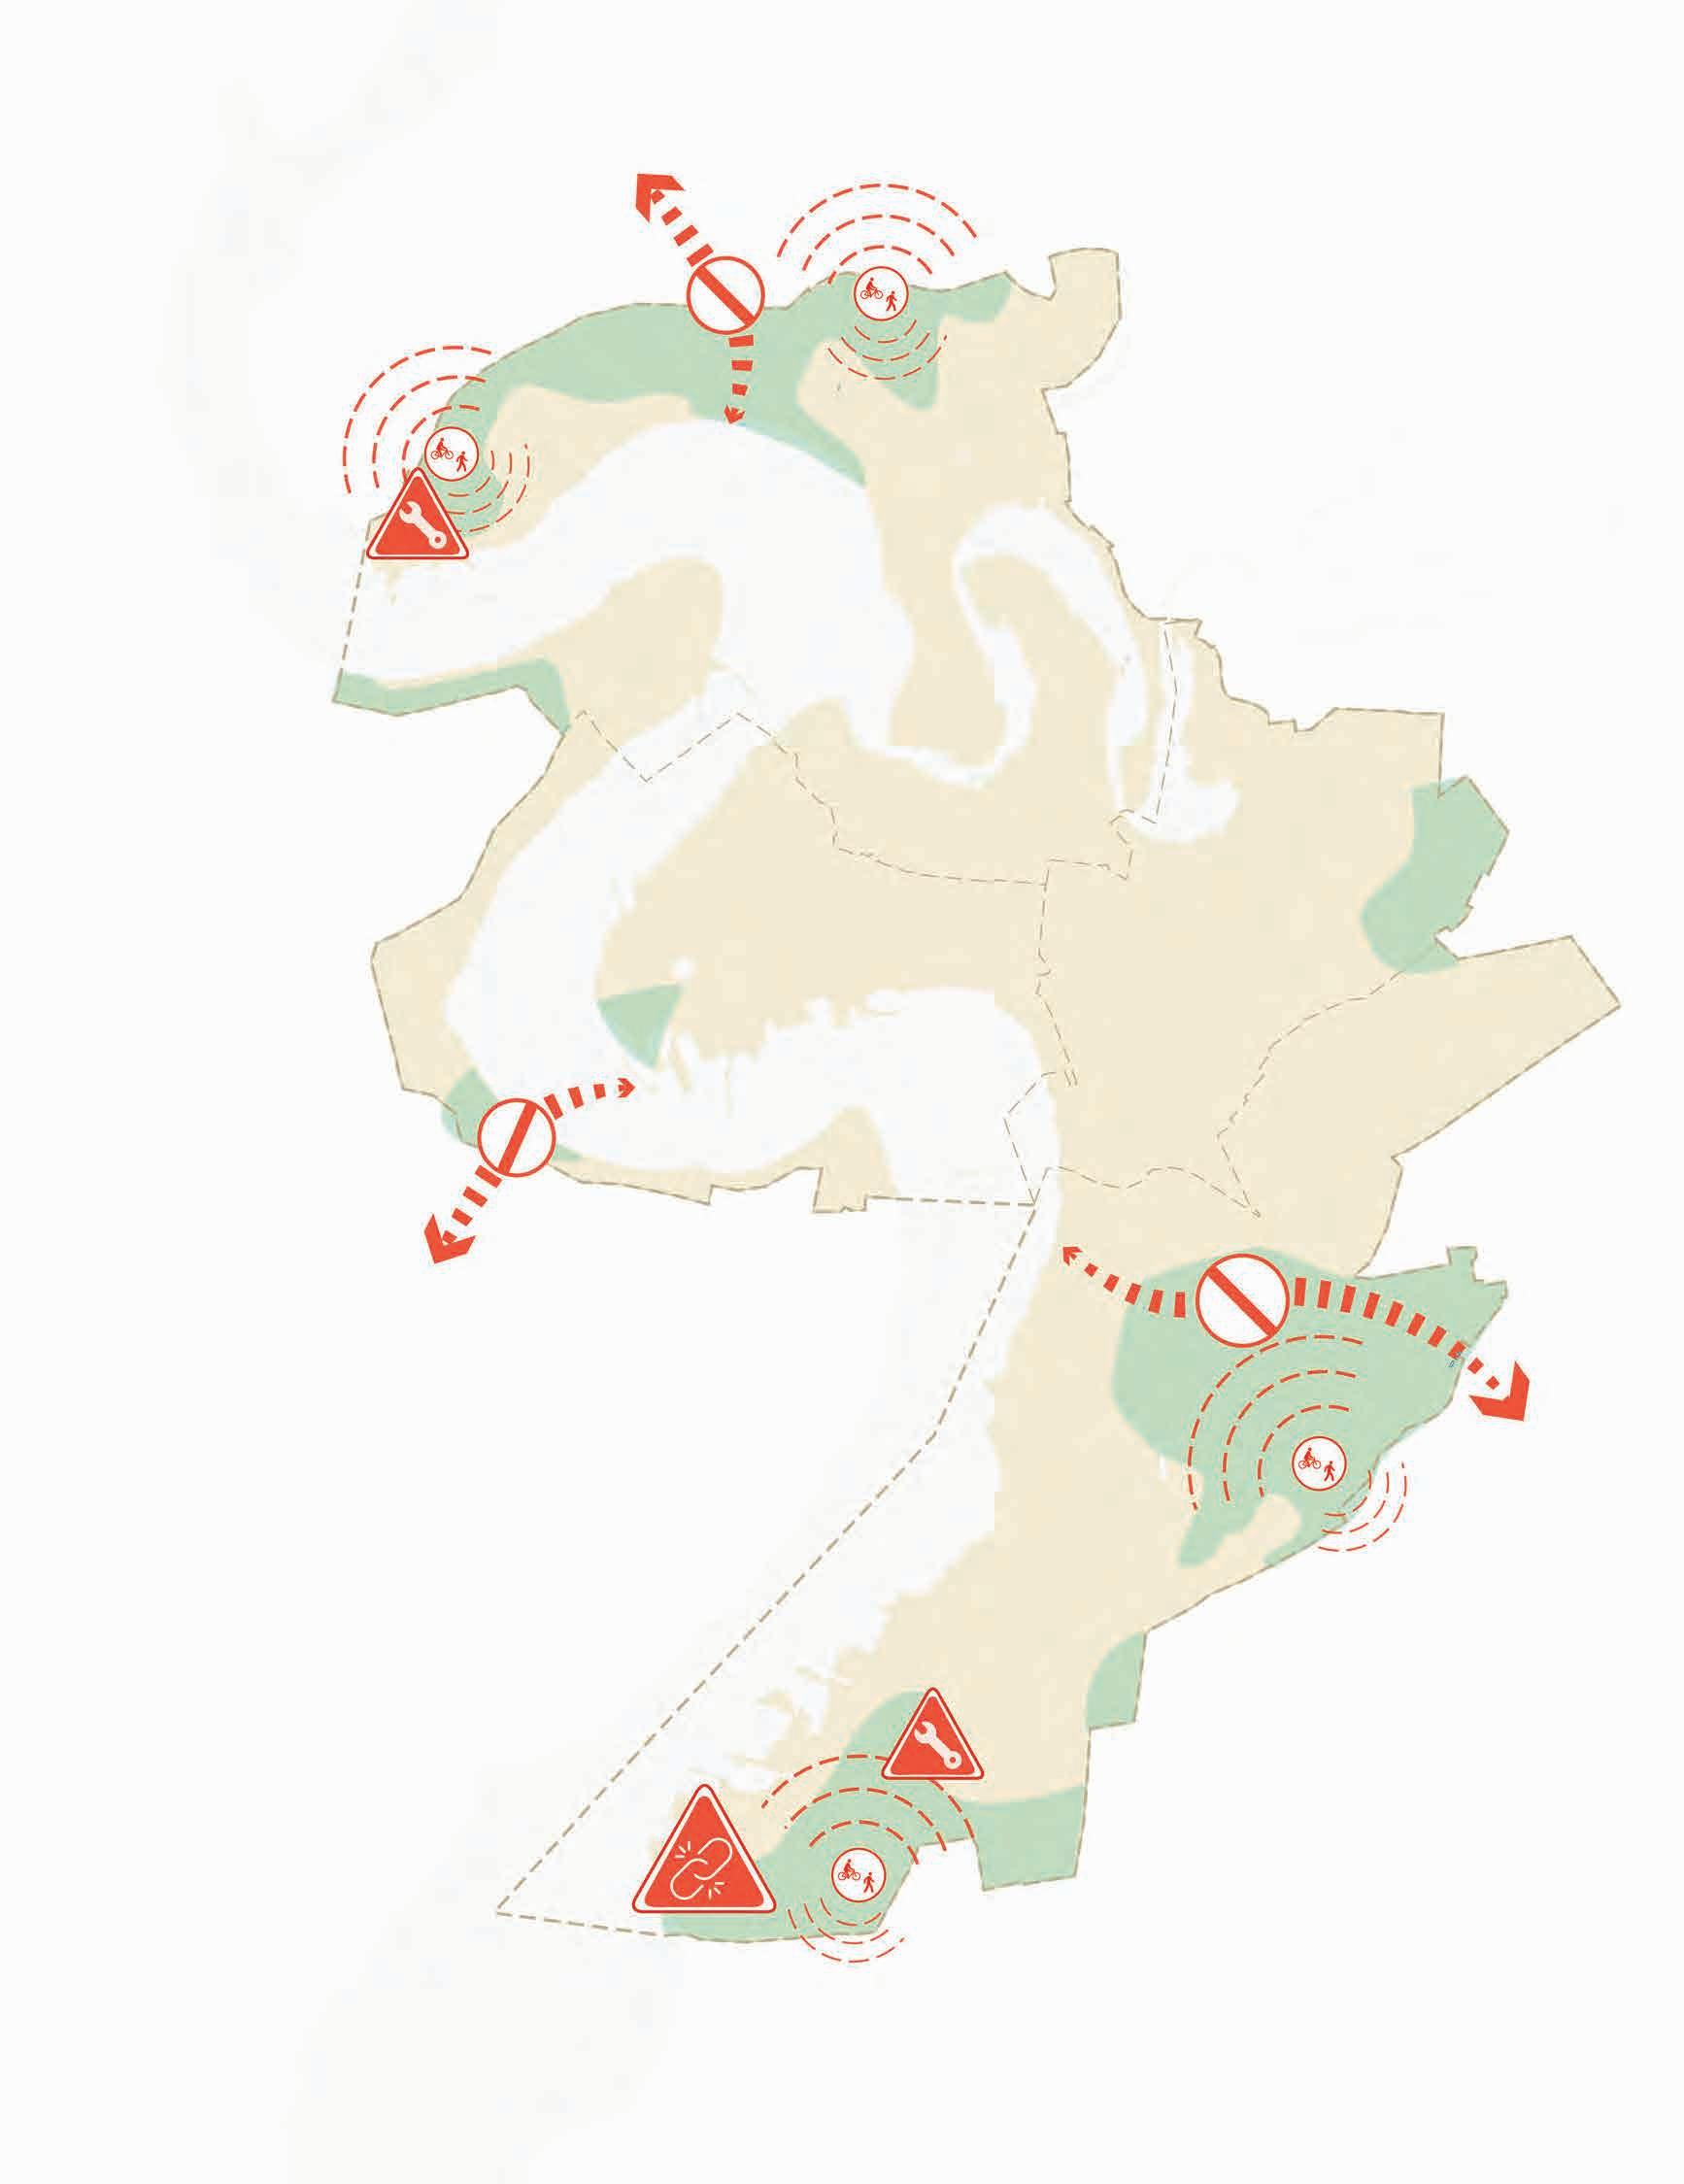
Mykolaiv's ecological network
Ecological Corridors
Secondary Ecological Corridors
Potential Ecological Corridors
Large industrial areas blocking the access to the river
Elements
Core
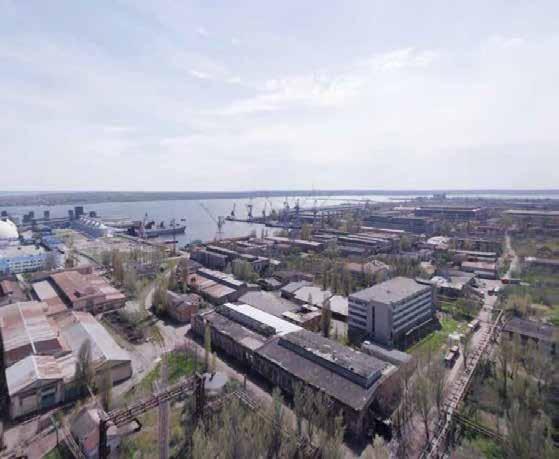
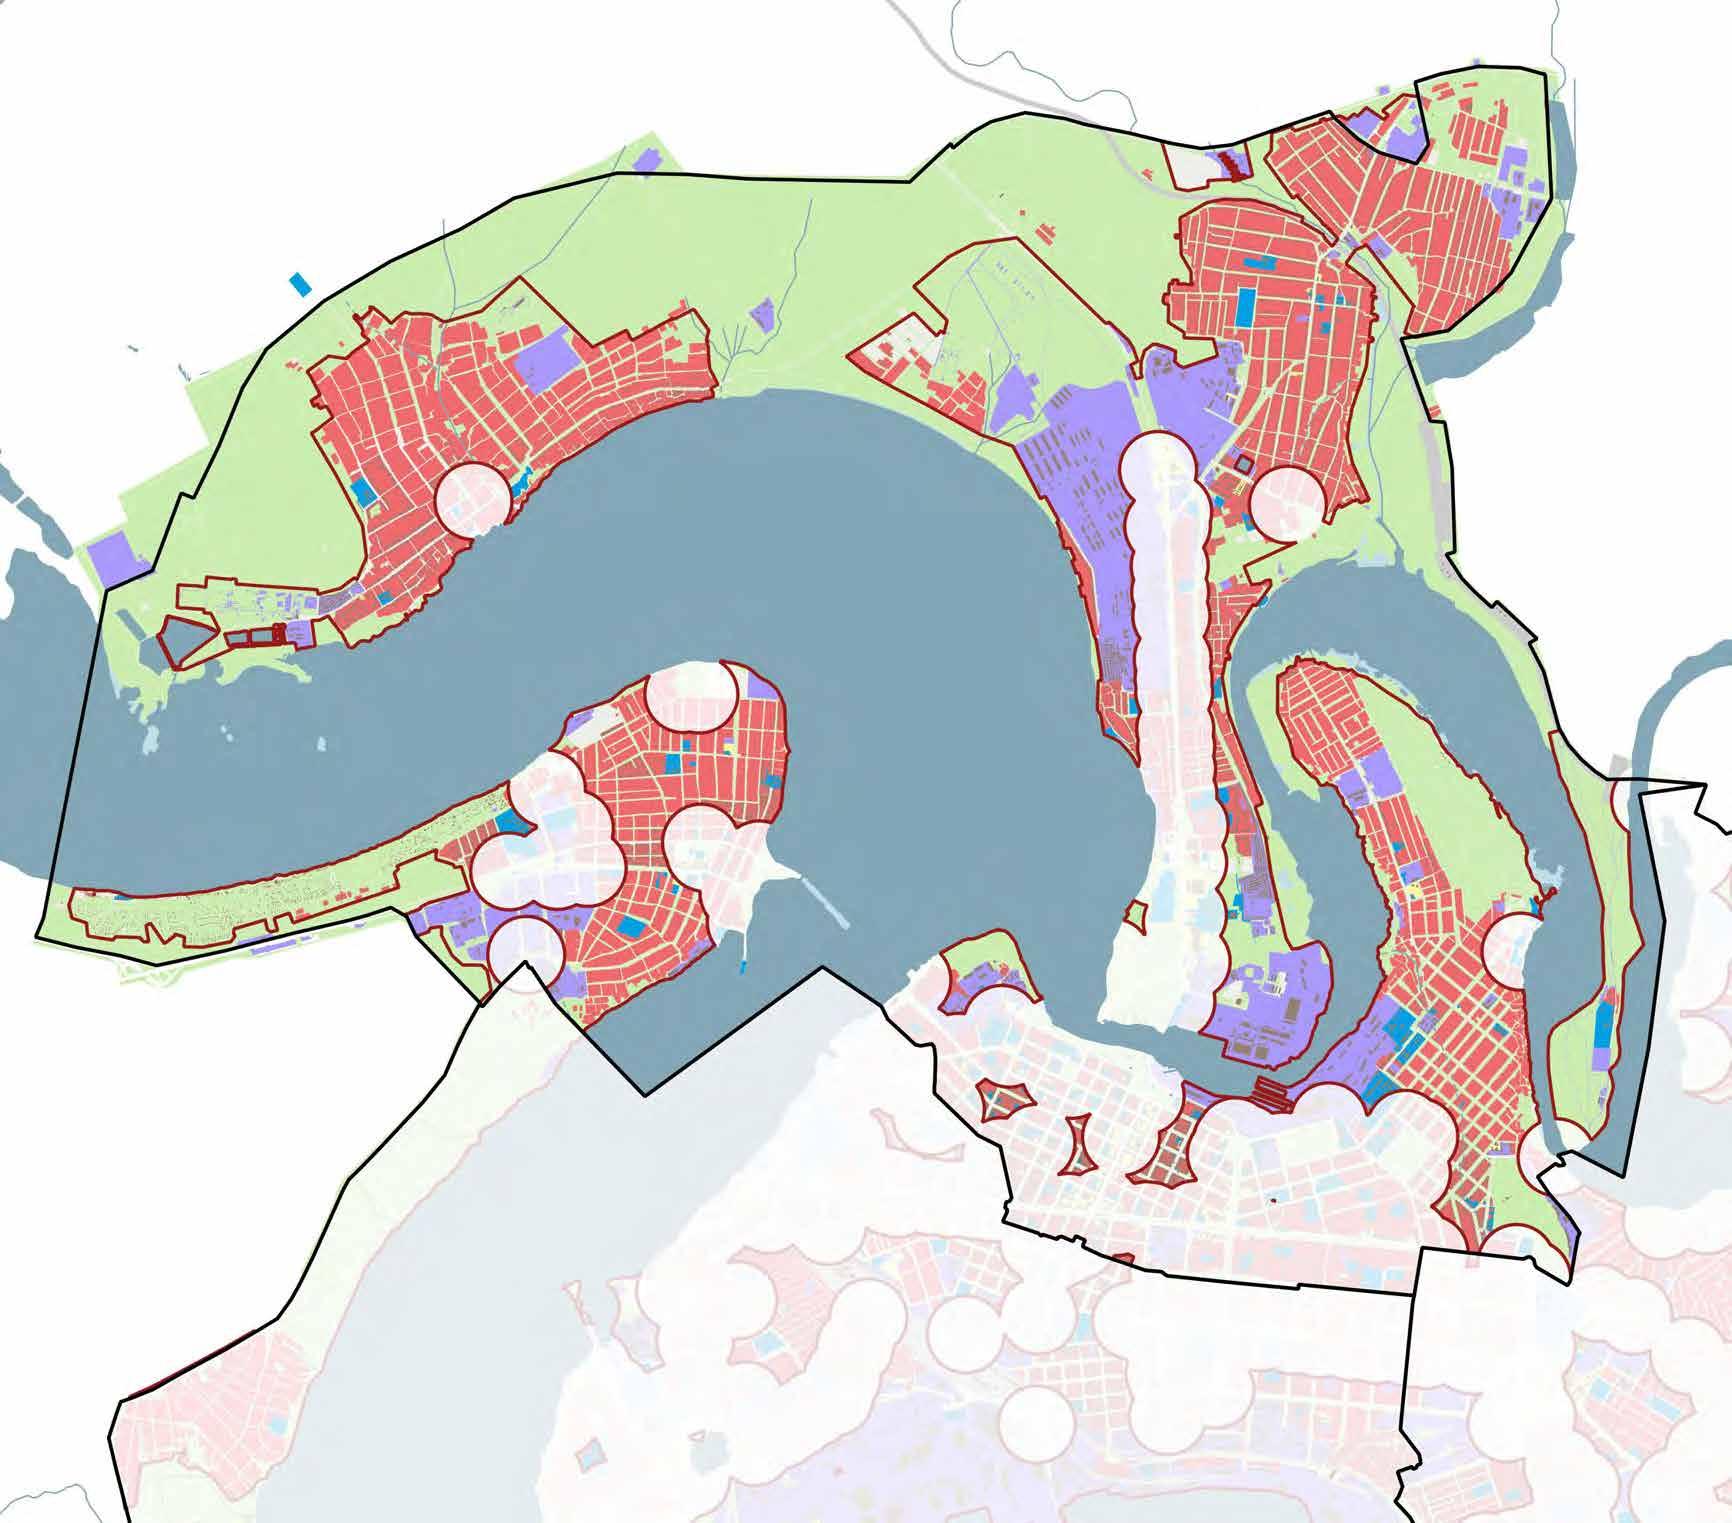
Landscape typologies | Built environment system Ландшафтні
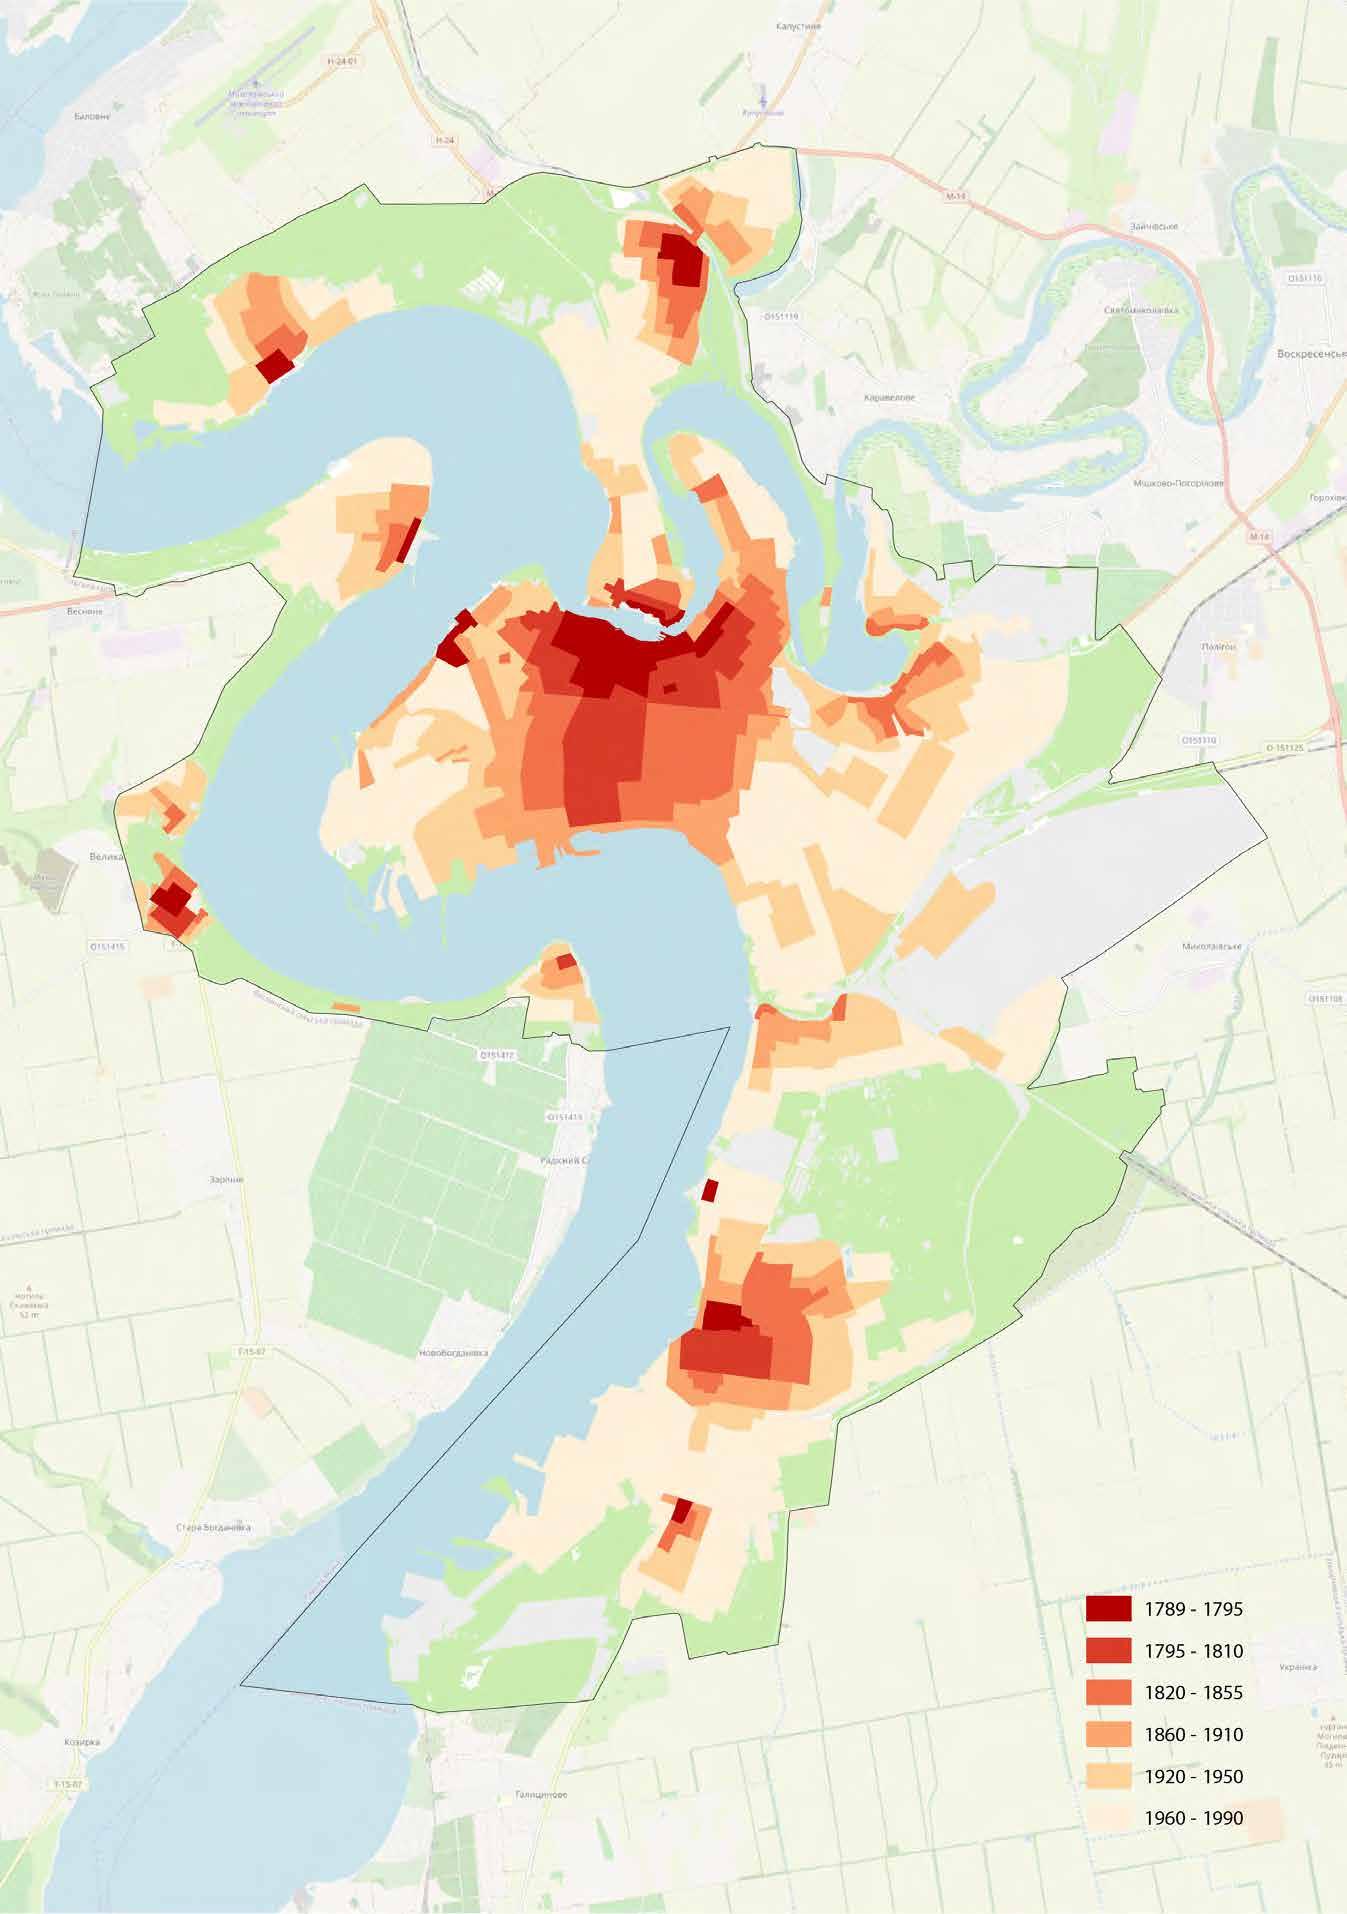
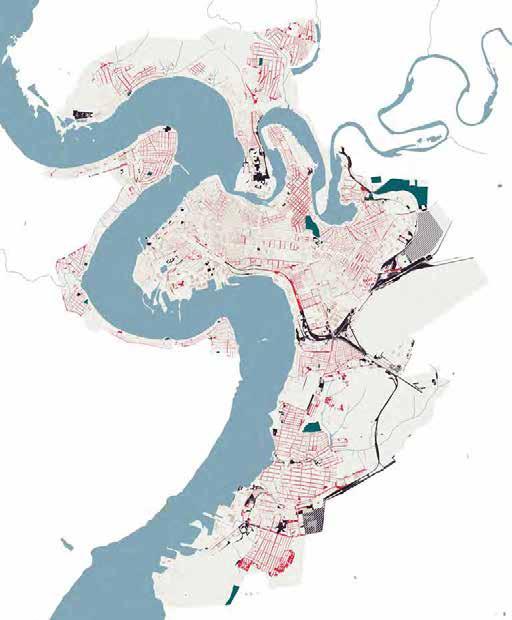
The port city of Mykolaiv on the estuary of the southern Bug River is an important industrial and commercial centre. Being a young and relatively compact city, its urban construction is the result of historical stratification.
The city of Mykolaiv follows the history of the Russian Empire's military and political activity (17th-18th century) aimed to strengthen its position in the Black Sea basin, reflected in its urban development, building began to spread towards the south and west of the peninsula.
The urban imprint of the city as seen today is the result of the largest reconstruction effort that took place after the city was liberated from Hitler's troops on 28 March 1944 and lasted for the next two decades.
The urbanized areas now occupy the north-central portion of the plain, while to the west and south open areas with an agricultural matrix remain, interspersed with low-density residential areas and expansions. The perimeter area of the urban centre as well as the development of the industrial and port areas built since the 19th century face the river following its course; however, the territories of production and service companies are scattered throughout the city.
The largest industrial zones are in the central, eastern and southern parts of the city.
Mykolaiv
1795-1810
1820-1855
1860-1910 1920-1950
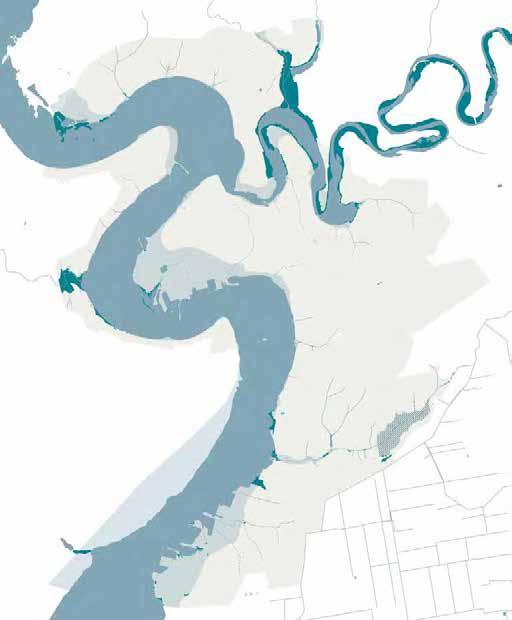
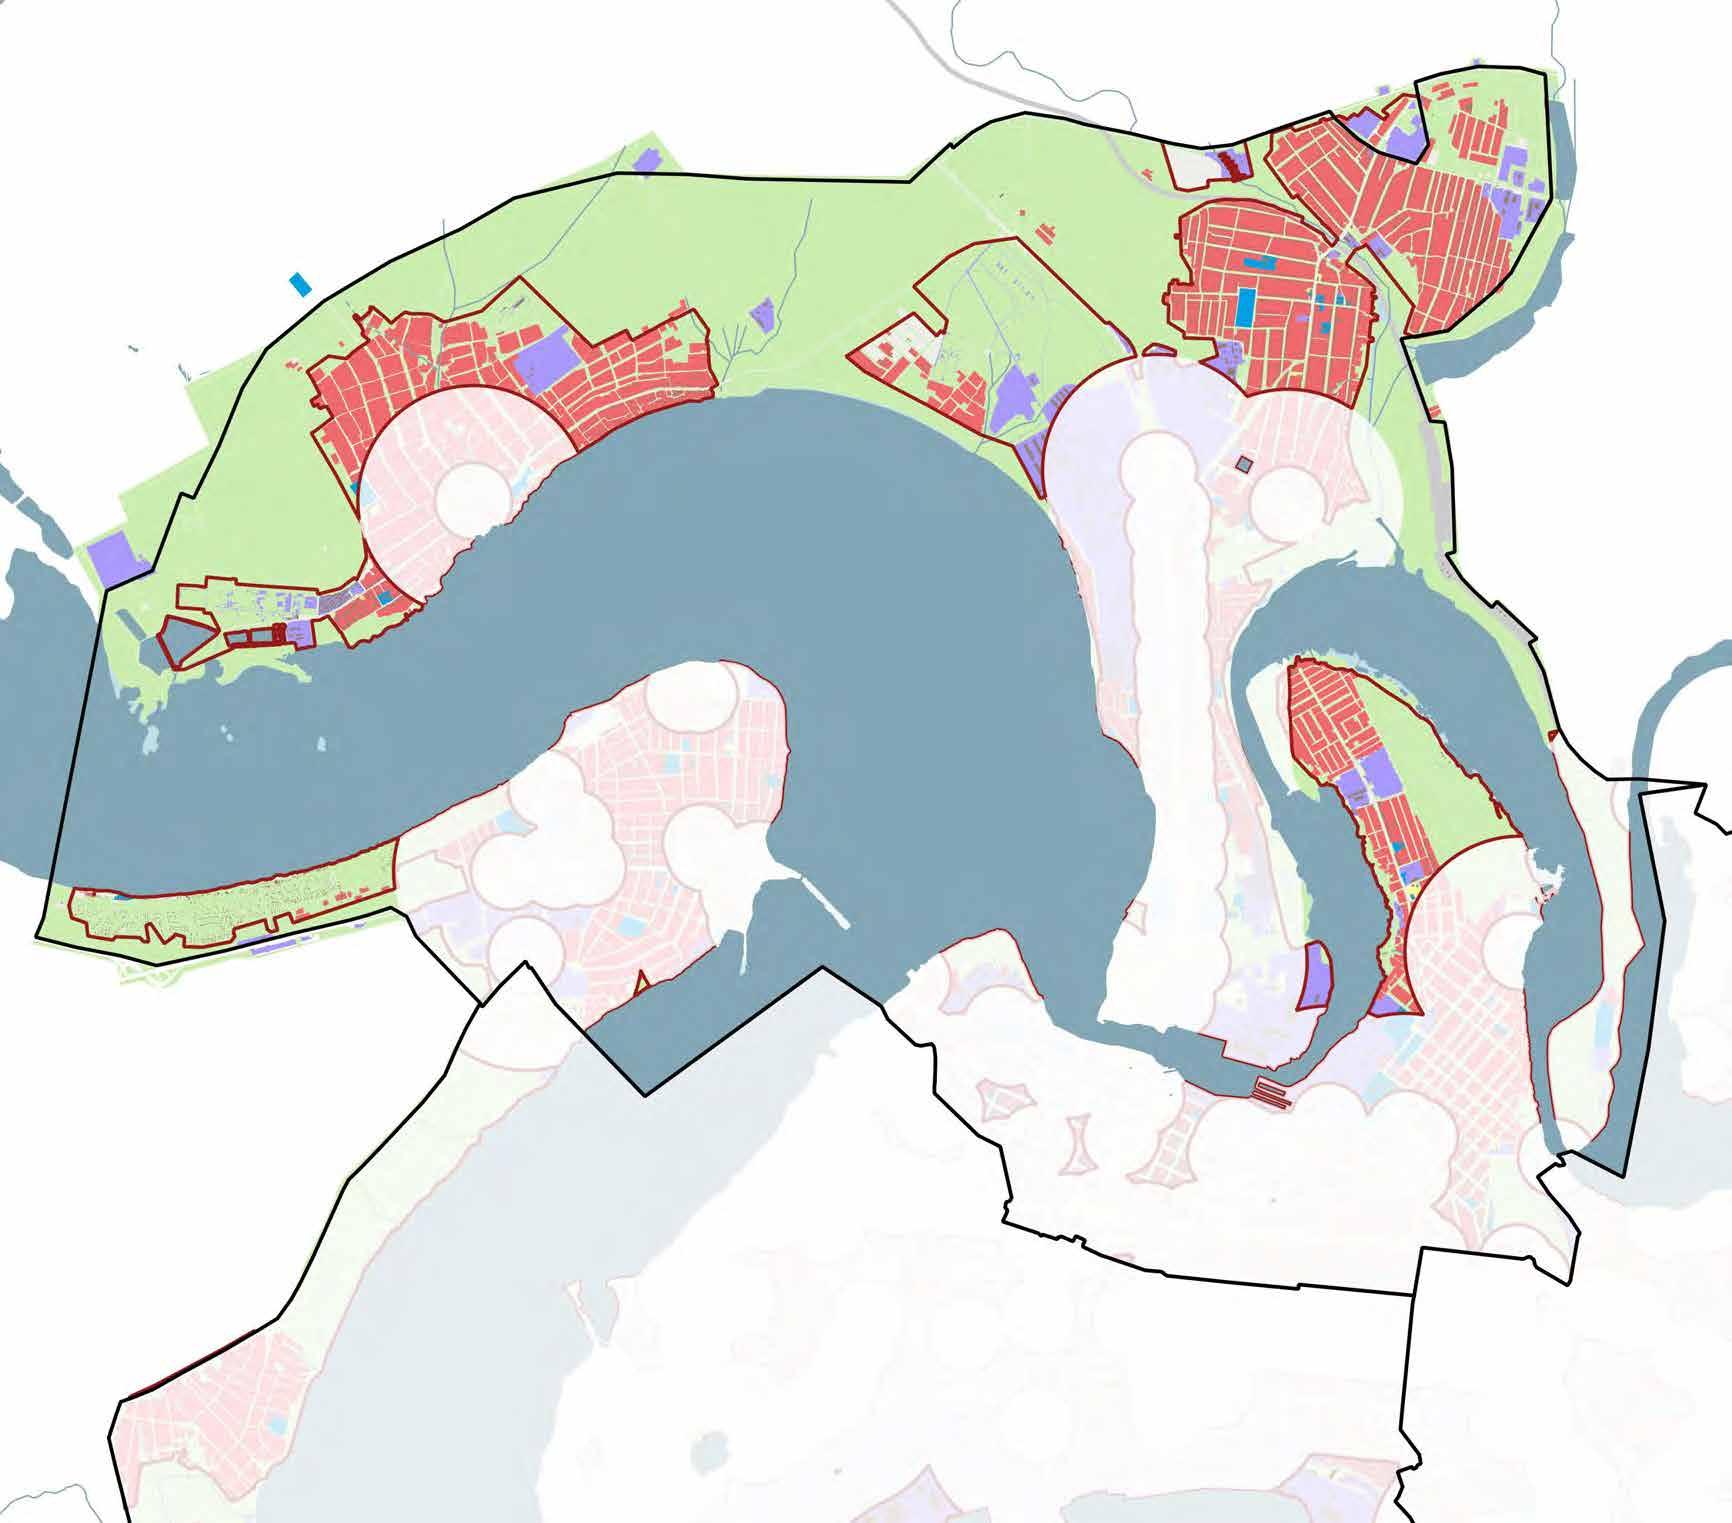
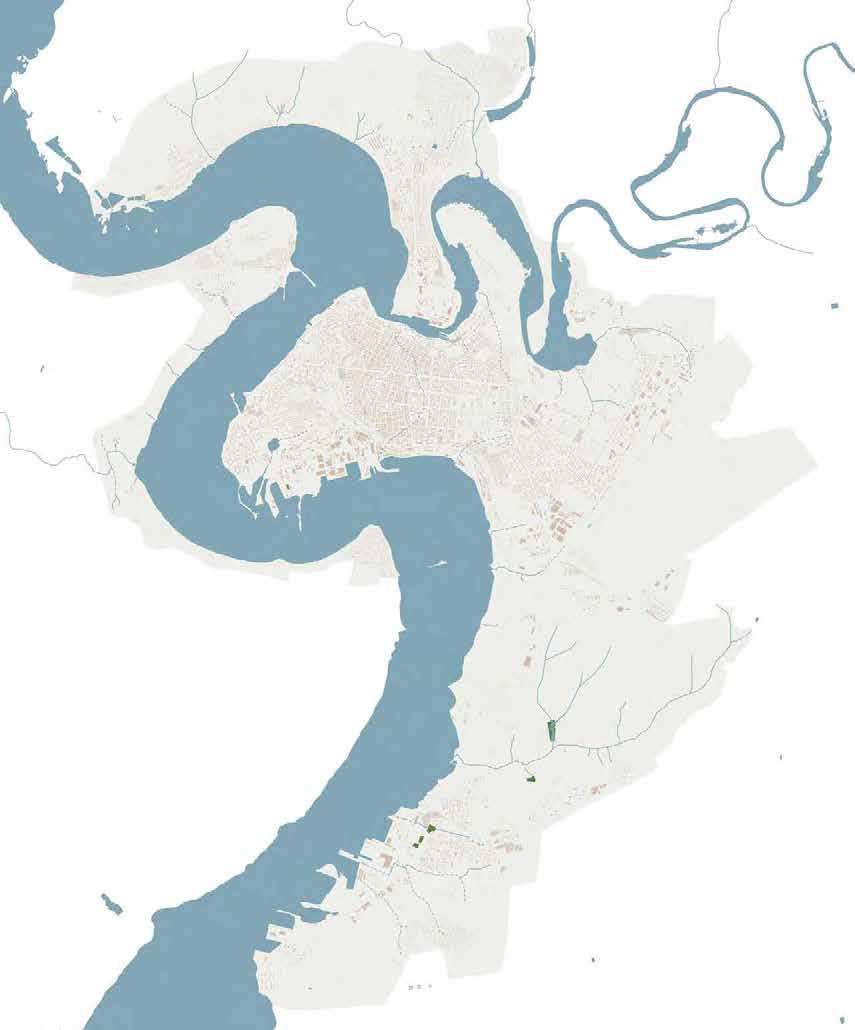
Landscape typologies | Hydrographic system
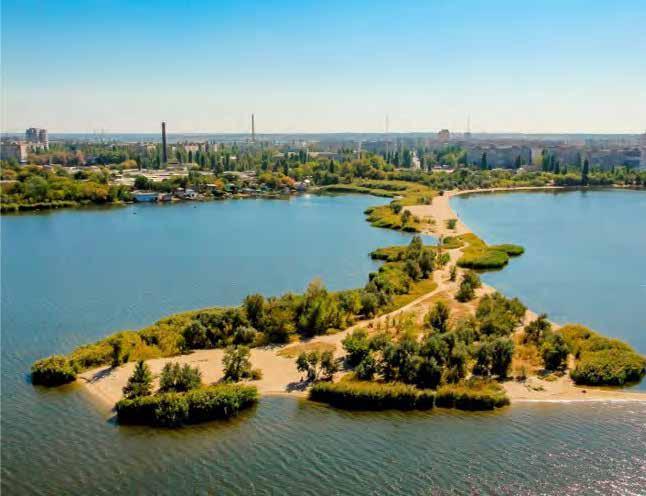
Known as the city of the two rivers, Mykolaiv territory belongs to the basins of the Southern Bug River (59.5%), the Dnipro River (23.5%) and the Black Sea (17%) rivers. Surface waters in the city of Mykolaiv consist of the Southern Bug and Ingul rivers and Buzky estuary, which was formed as a result of the sea flooding the mouth of the southern Bug (it is believed that the Southern Bug river ends and flows into the estuary near the mouth of the Ingul river).
The Ingul river runs for about 354 km and covers an area of 9,890 km². Mostly navigable with its narrow, winding course, in the most flat areas the channel widens to 30 m, with 0.7-1.2 m depths and a maximum of 1.5 m (at low water). The water of the Ingul is used for water supply and irrigation.
The Southern Bug river runs along about 800 kilometres, and flows slowly through a wide, muddy valley (slope: 0.37 m/km). According to the land cover documentation, the southern basin belongs to the forest steppe and steppe habitats.
The two rivers suffer from coastal erosion as a result of active action of waves and the rise of the groundwater level. Within the next 1520 years, the shores should be secured along almost the entire length of the Southern Bug and Ingul rivers to tackle this issue. The city of Mykolaiv is also planning to strengthen the river transport, in order to reduce pollution caused by automobile traffic.
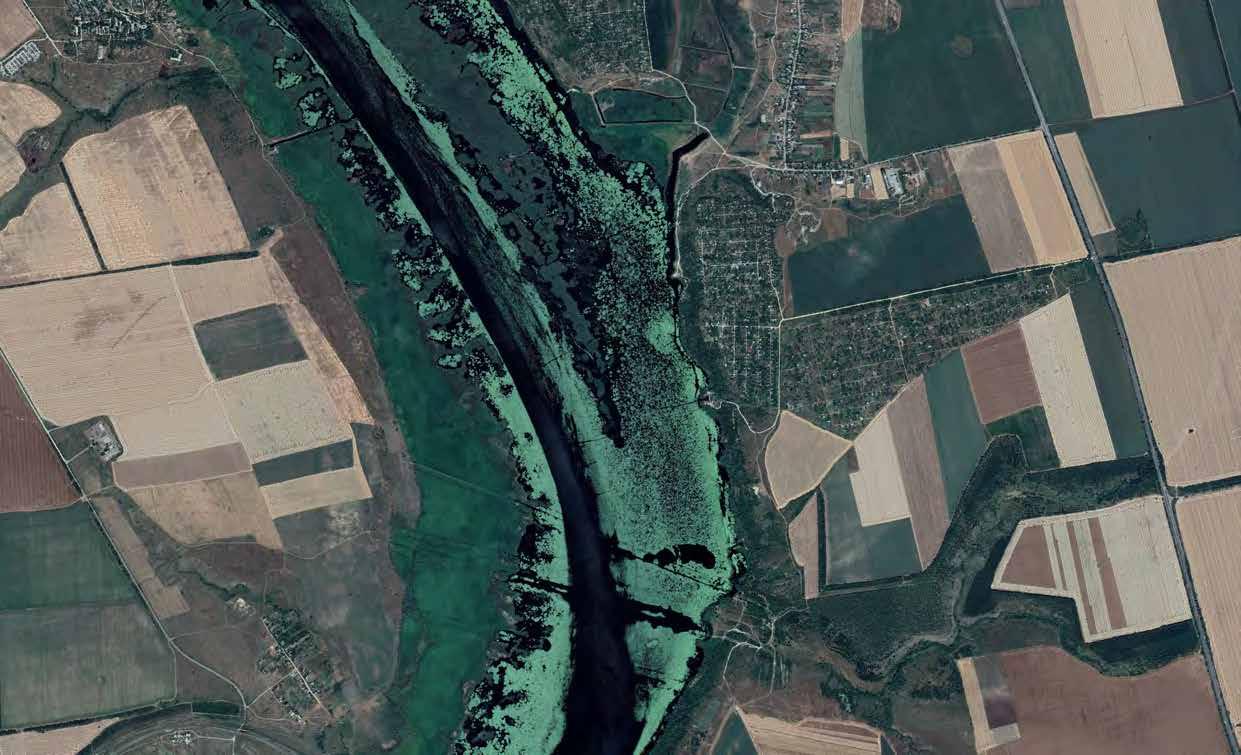
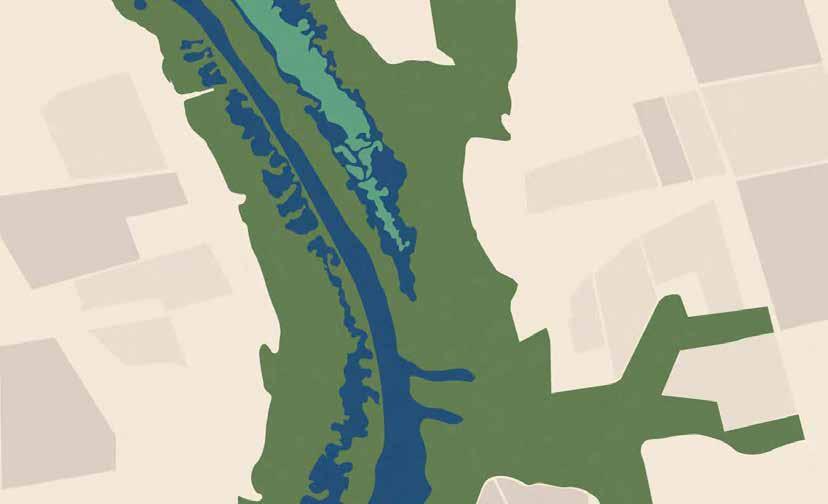
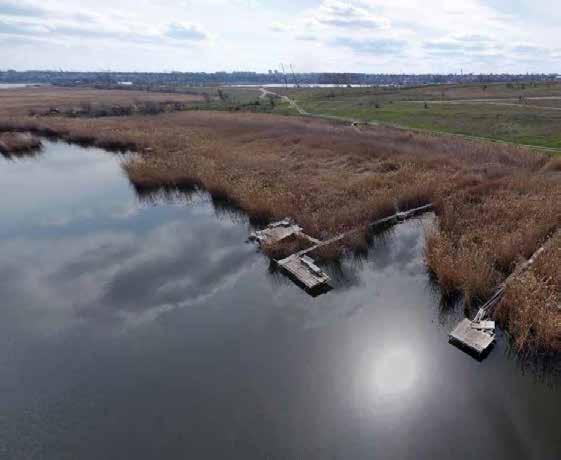
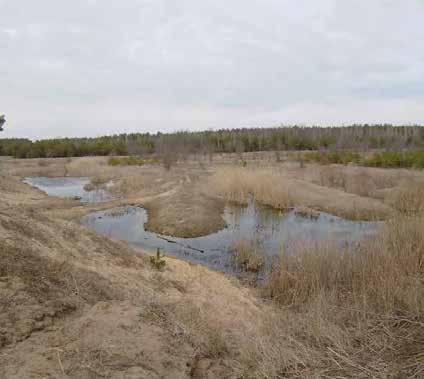
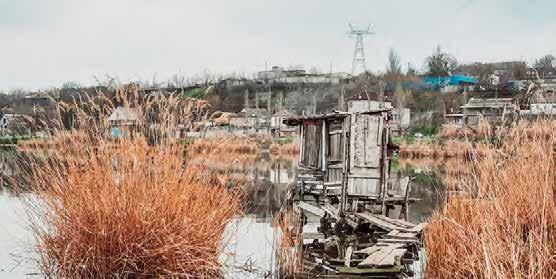
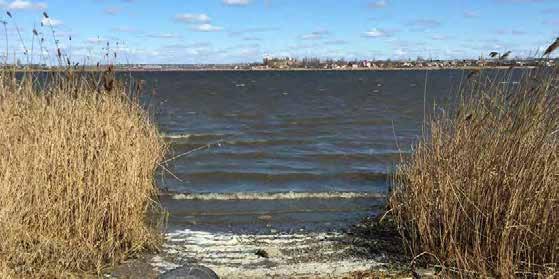
Wetlands
The area around the confluence with the river Ingul shows the highest concentration of wetland formations and hosts a diverse fish population. The richness of species within the Southern Bug River denotes the self-purification capacity of the river ecosystem despite anthropogenic pressures downstream. The General Plan 2019 suggested the wetlands be eliminated. Sinche these are an effective measure for environmental protection, this issue will need to be discussed with the city, in order to evaluate possible alternative measures not to lose these valuable habitats.
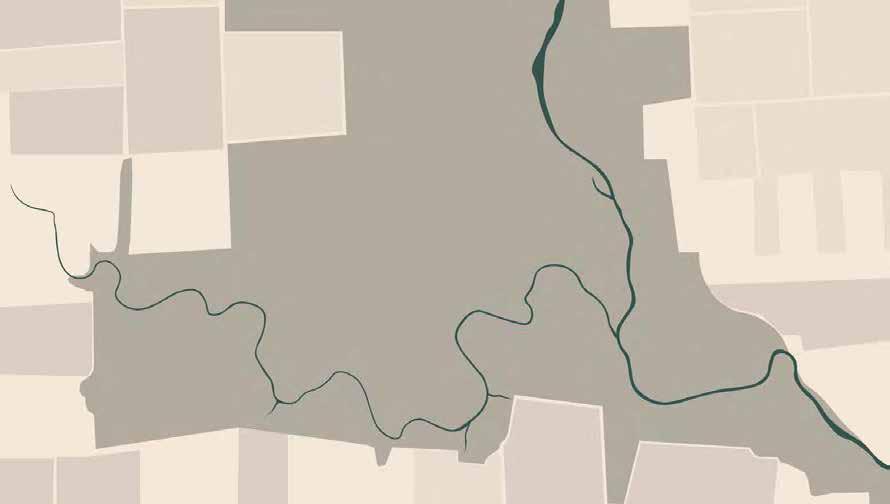
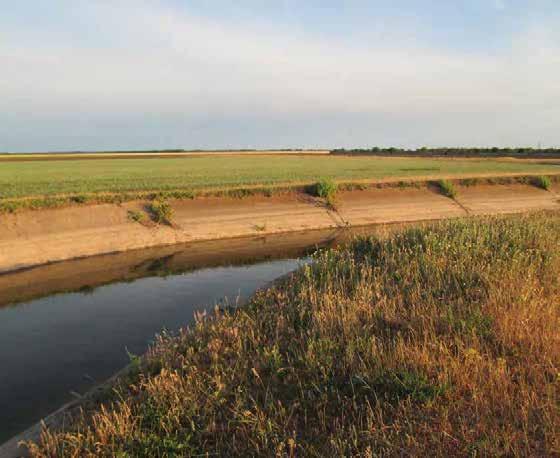
Waterchannels
In addition to the two main watercourses, in the territory of Mykolaiv there are numerous minor watercourses. These flow partly above ground, although some have been channeled underground. Water retention basins
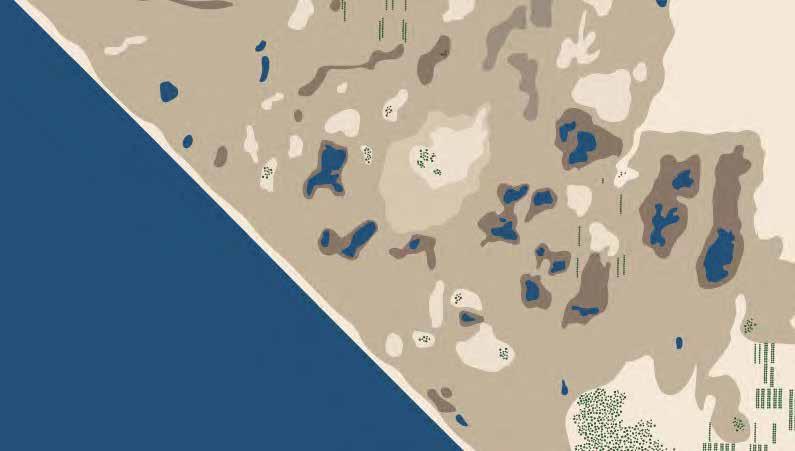
There are artificial reservoirs and ponds within the city limits (North district). In the southeastern part of the city a big area served as retention basins: it’s used to provide flow control through attenuation of stormwater runoff. Retention basins are normally dry and in certain cases the land may also function as a recreational facility.
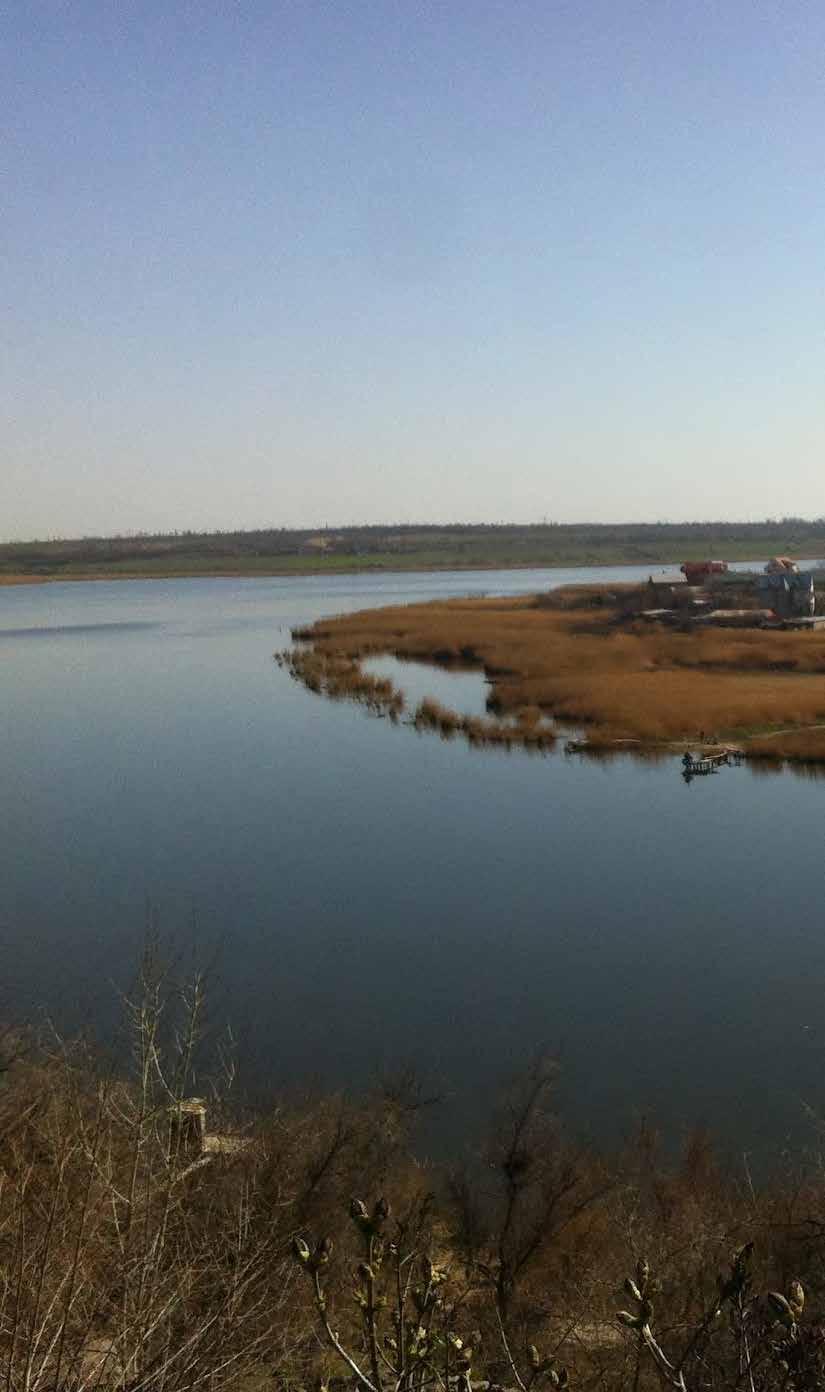
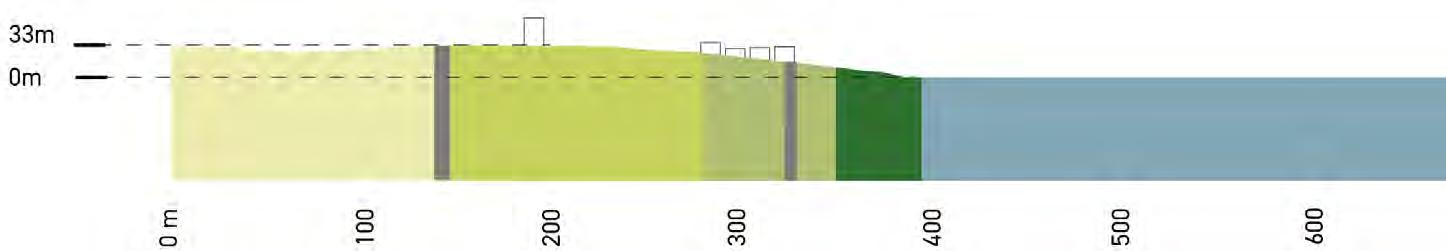
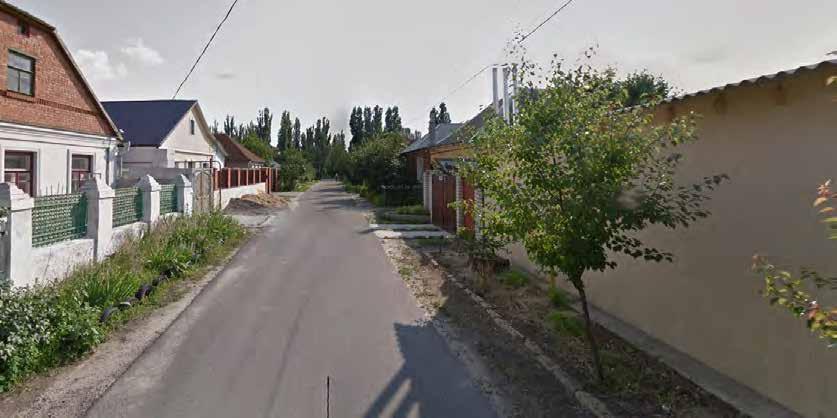
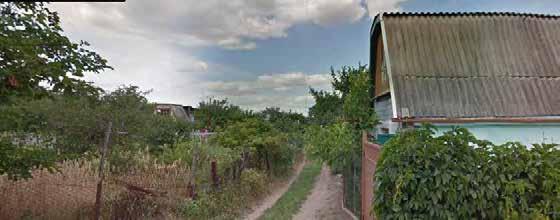
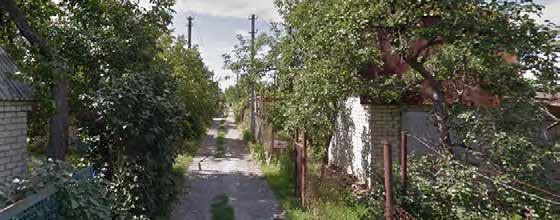
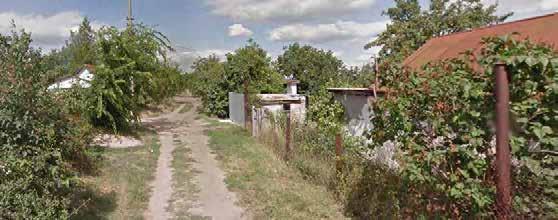
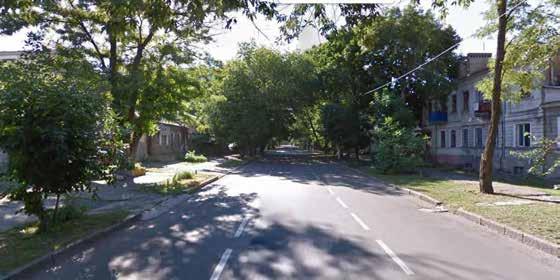
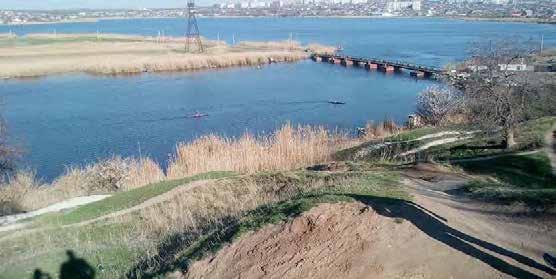
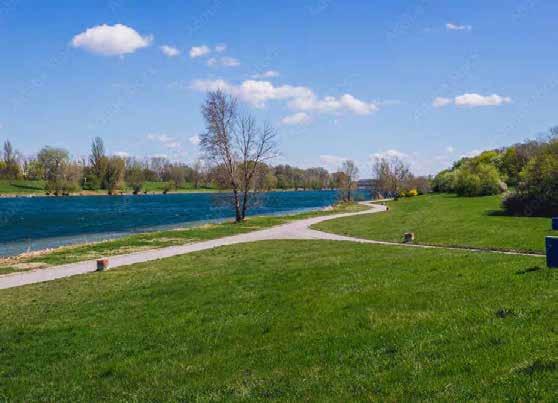
Different land uses and accessibility levels along the river Bug result in a variety of natural conditions. To the north, despite being wedged between the historical city and residential developments, the river still takes on natural connotations, due to its banks being accessible and occupied by natural riparian vegetation (wooded belts, grassland, wetland), typical of wetlands areas.
The central part, mostly occupied by activities related to the port industry, presents artificial banks in several spots. A vast area is dedicated to green land for cottages or low-rise residential expansions, often resulting in degradation of the natural coastline, yet allowing views and access to residual forest and grassland areas.
Residual wooden and agricultural belts follow in the southernmost areas where residential and industrial expansions fragment the natural space.
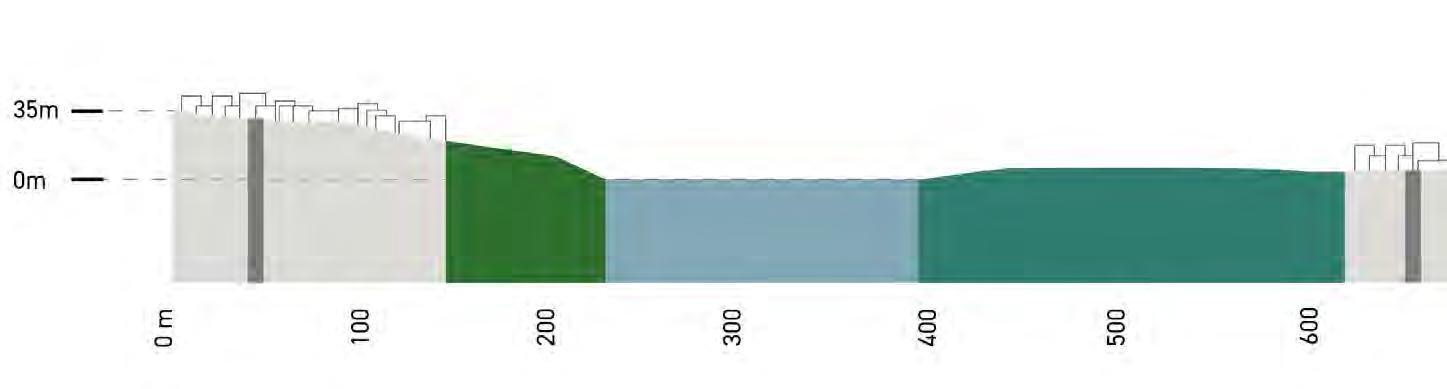
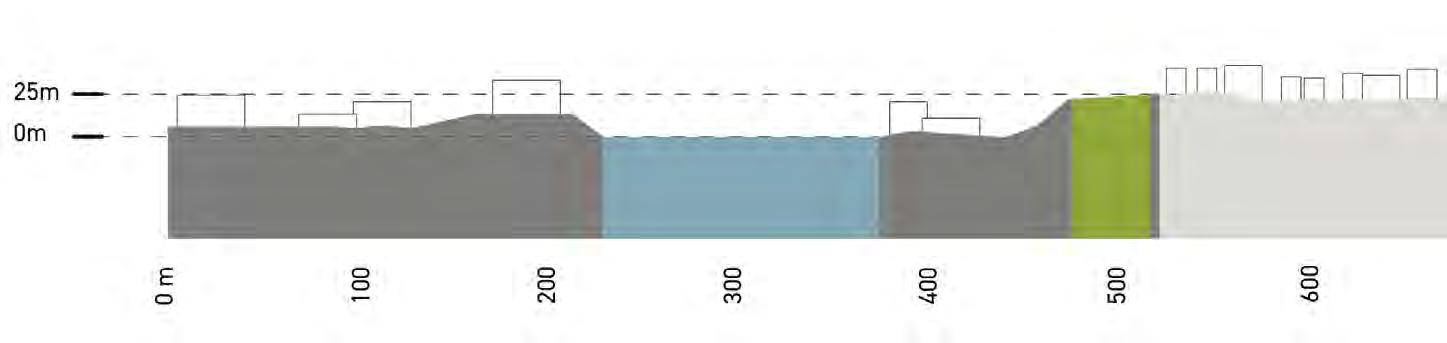
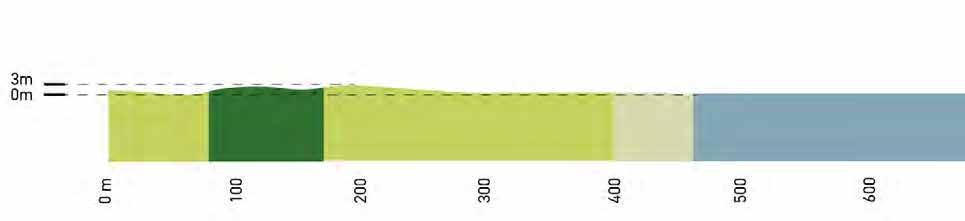
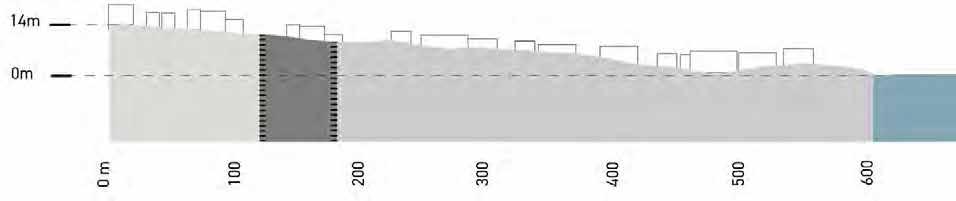
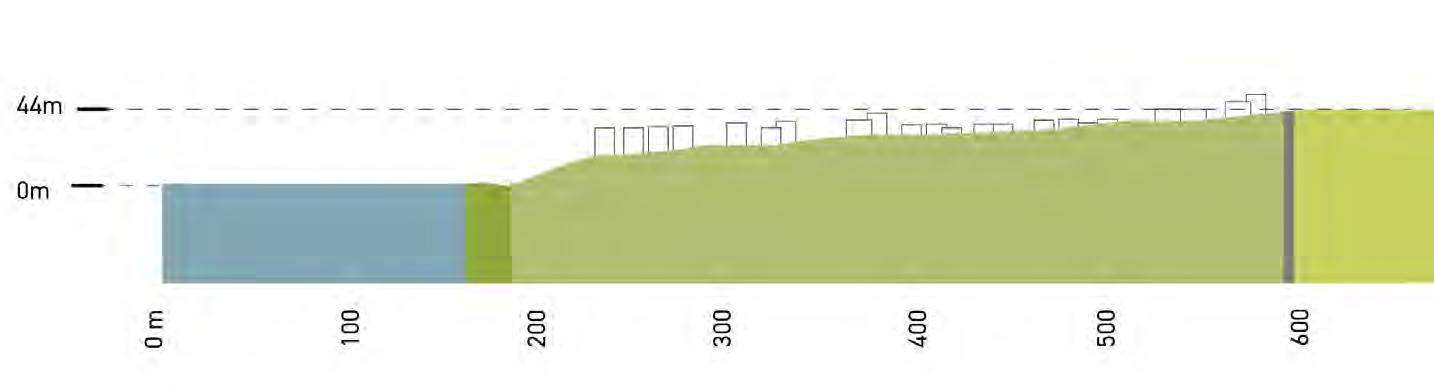
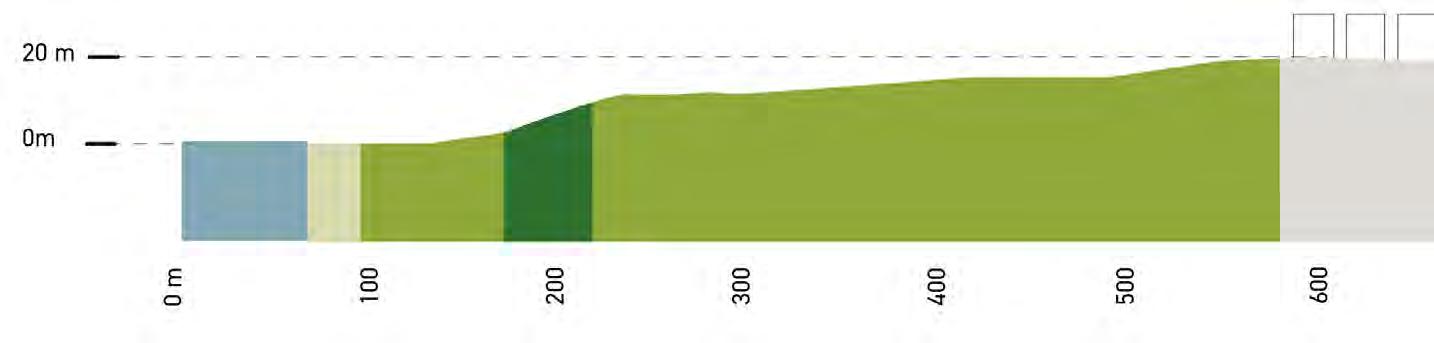
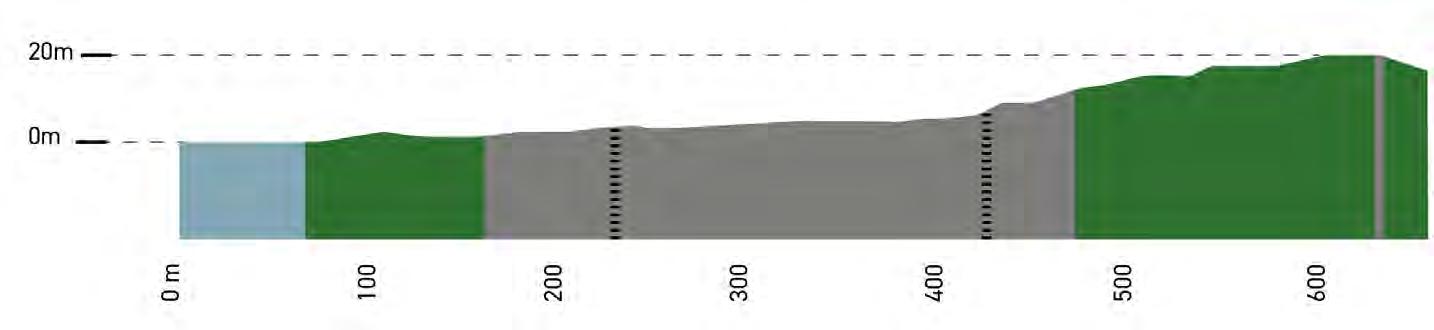
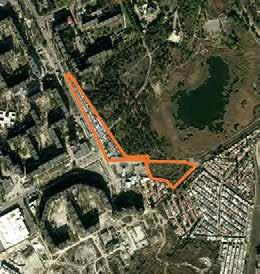
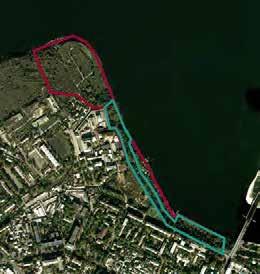
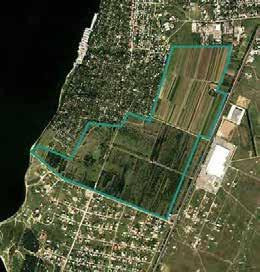
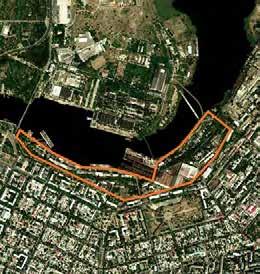
Section A I Semi-natural rivershore in front of the green areas around the cottages, with grasslands and agricultural areas in the back
Section B I Ingul peninsula residential area with a semi-natural rivershore and wetland area with manorial residential area in the back
Section C I Historical center and industrial areas along the rivershore
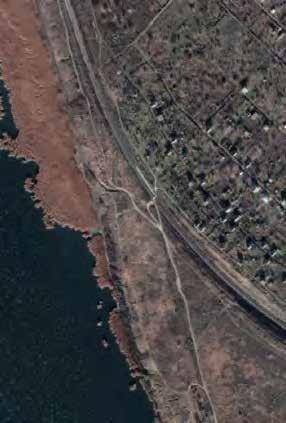
Section D I Natural rivershore with portions of forested areas and beaches along the coastline
Section E I Artificial and secluded rivershore with port facilities and railway infrastructure
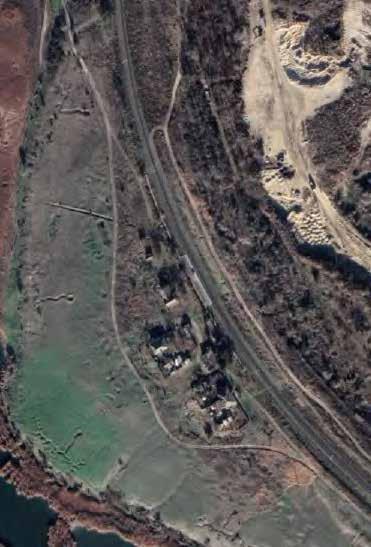
Section F I Semi-natural rivershore in front of the gree areas around the cottages with and grassland areas in the back
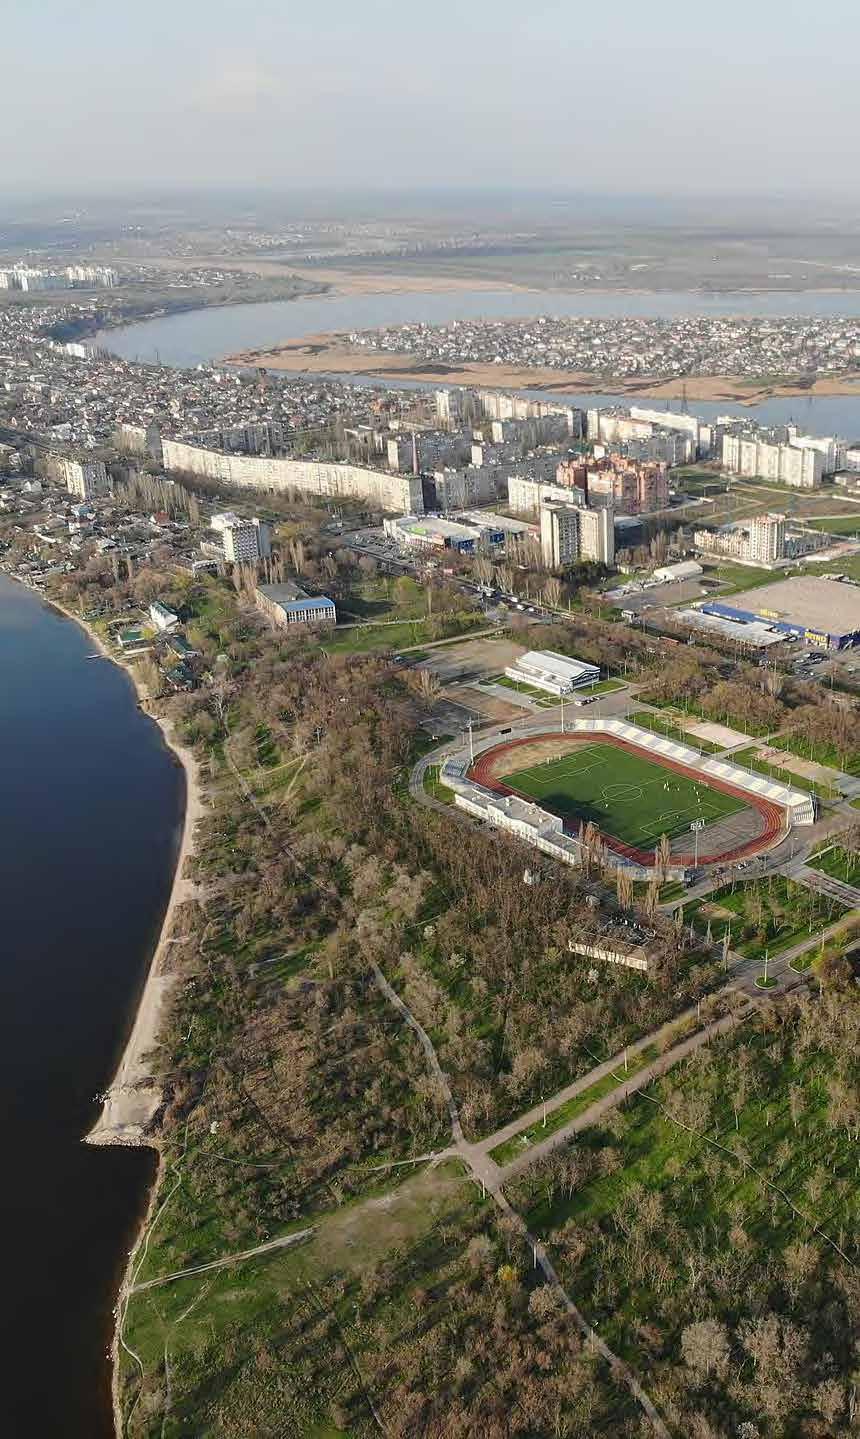
Section G I Natural rivershore with pine forest public park and high rise residential area
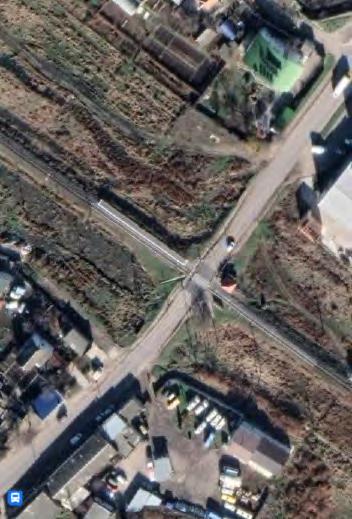
Section H I Artificial and secluded rivershore due to infrastructural leftover spaces and industrial landuse with forested area in the back
Enhancing Urban Planning in the city of Mykolaiv
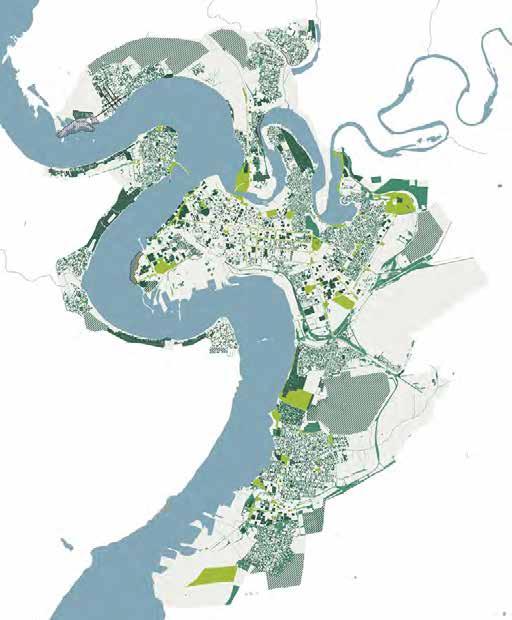
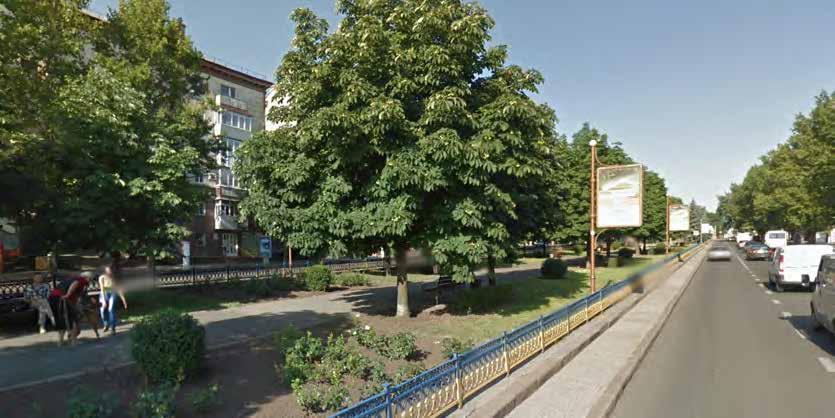
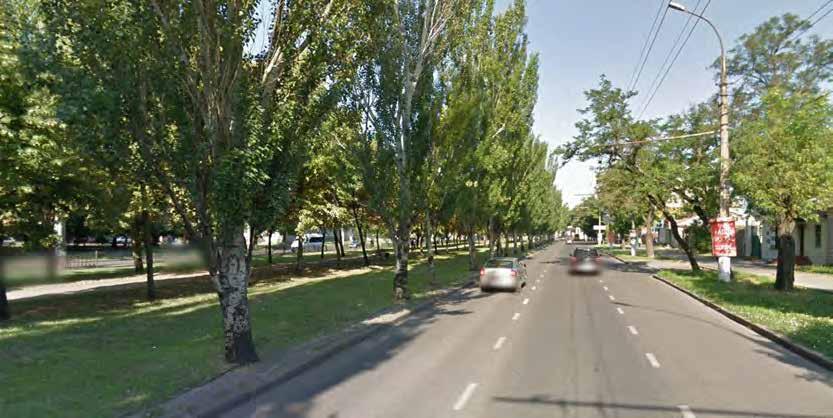
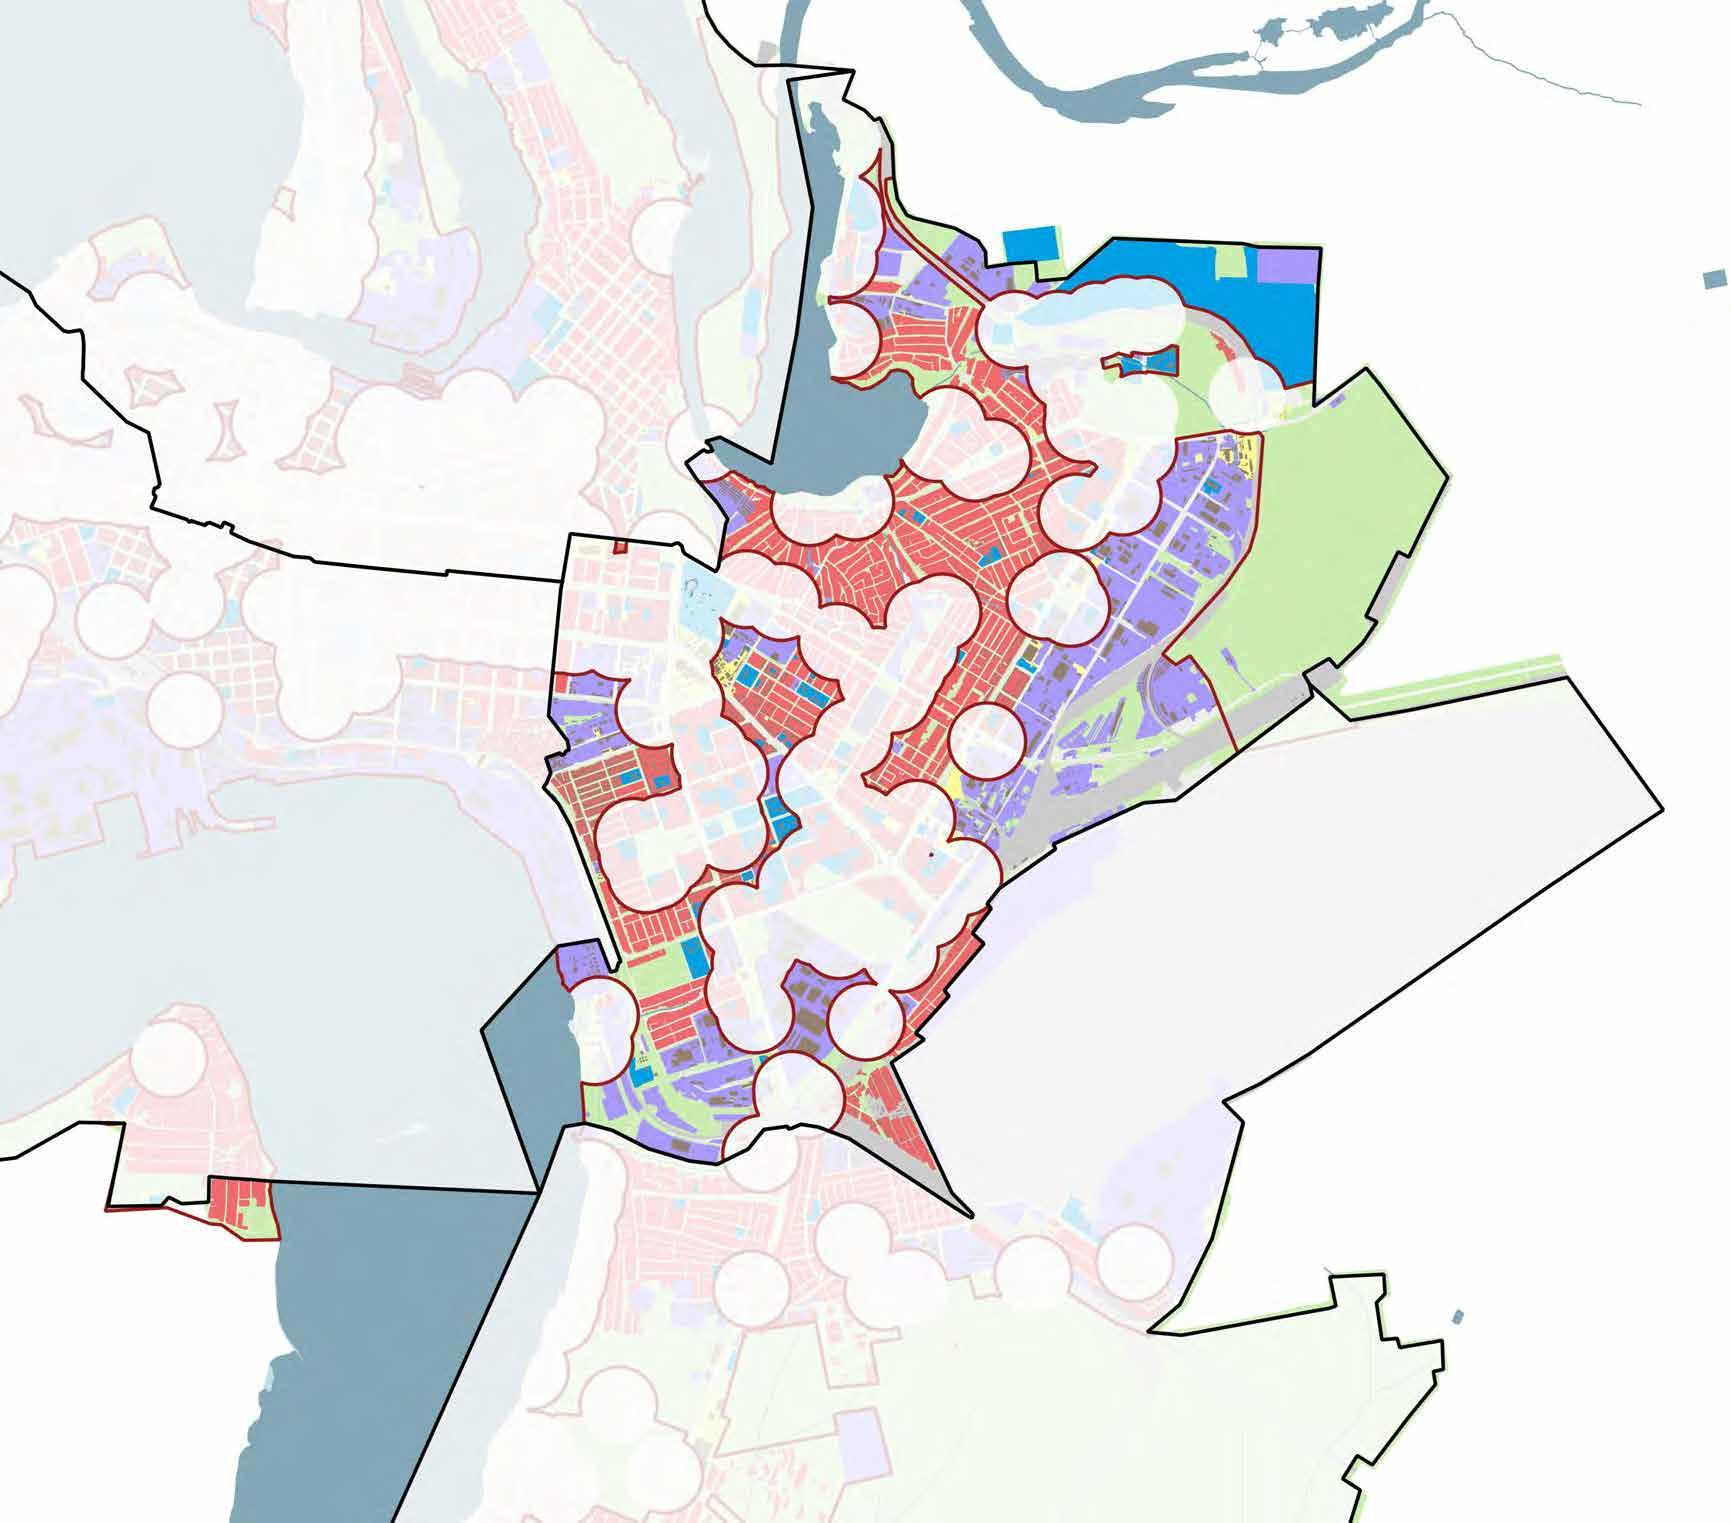
Landscape typologies | Urban green space system
Within the General Plan 2019 for the Municipality of Mykolaiv an entire chapter is dedicated to green areas. The system of green areas has been described as part of the architectural and planning structure of Mykolaiv, and, before the conflict, was composed of parks, squares, recreational areas, botanical monuments, forest parks, and river parks. This document has been utilized as a conceptual framework for the analysis that has been undertaken and implemented thanks to the discussions with the municipality. The following statements are some information taken from the Plan that has been considered useful to lead the analysis process for the Urban Green Space System.
The main categories identified, starting from the 2019 General Plan's framework, are:
1. Public Green Spaces: it includes public natural spaces used for gathering, and green areas for public use as per the 2019 General Plan "The list of green economy objects classified as recreational areas in the city of Mykolaiv". These spaces have been classified as: Playgrounds, Brownfields, Green Squares, Linear Parks, Public Parks, Forest Parks, Accessible Wetlands, Potential Expansion Areas, Zoological Park;
2. Semi-Public and Private Green Spaces: This category is a system of areas with limited access, which include Private Areas such as Residential Gardens, Cottages, Manorial residential, Low-rise Mixed use buildings and Semi-Public areas like Sport Areas, Healthcare and Education;
3. Special Purpose Green Spaces: This category refers to infrastructure and industrial zones named: Road Green, Cemetery, Security zones of engineering structure; 4. Territories of the Nature Reserve Fund.
The General Plan sets 22m2 per inhabitant as a standard for "Green areas for public use". Before the conflict, the existing green areas reached 14.7m2 per inhabitant, equal to 66.8% of the standard. The General Plan 2019 estimated that the population of the city will rise to 507.7 thousand people in the next 15-20 years. Although this might change due to the conflict, population growth will imply an even higher need for green areas.
The General Plan 2019 envisages an increase of green areas for public use to 435 Ha, mainly along the river banks of the Ingul River, Southern Bug, and Buzkyi estuary. It also plans the creation of recreational areas for the city population, namely landscape zones. All the green areas of Mykolaiv that are nature reserve funds will need landscaping improvement, maintenance implementation, and reconstruction projects.
Enhancing Urban Planning in the city of Mykolaiv
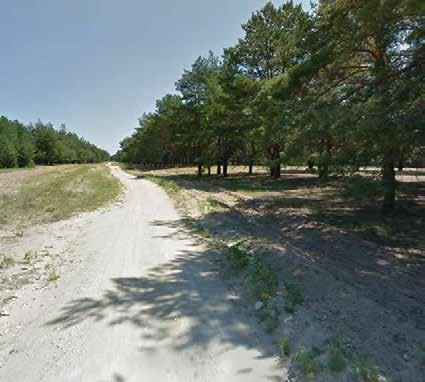
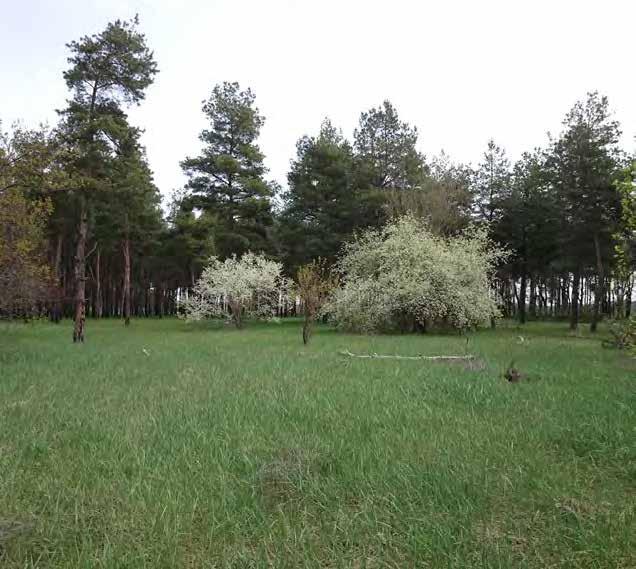
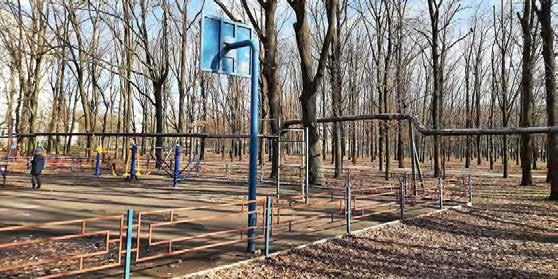
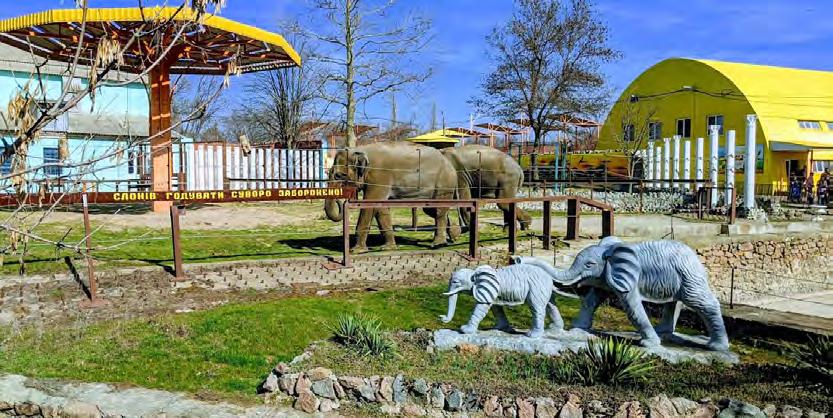
Types of public green spaces | Forest parks
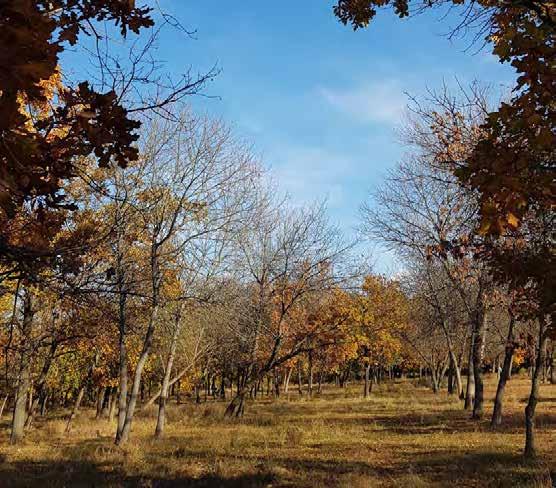
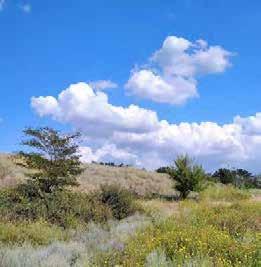
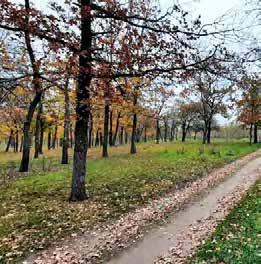
The forest areas in the city of Mykolaiv are not vast and located mainly to the opposite ends of the city, north and south. Although they are generally accessible and well connected to the urban fabric, they are often bounded by linear infrastructure such as factories, railway tracks and low-density residential areas. Mykolaiv's forests comprise both natural and artificial planting - mainly fir and other coniferous tall-tree formations. They often intersperse with steppe areas and localised shrub formations, and provide valuable habitats of various endemic fauna species including hares and foxes. Pastures and bundle areas are also present in the most natural parts.
Forested areas constitute ecological and environmental reservoirs of importance; the Balabanivka reserve to the south of the city has been assigned to the preservation of an artificially created forest massif, hosting endemic plantings and habitats of importance for bird migration. The forest offers groomed trekking and bike cross trails, playgrounds, parking areas and scattered seating along the main paths, making the forest particularly popular at weekends.
Matveevsky forest main entrance path
Matveevsky forest steppa and seasonal flooded areas
Conifer and herbaceous formation within Balabanivka forest reserve
Location of forest parks in
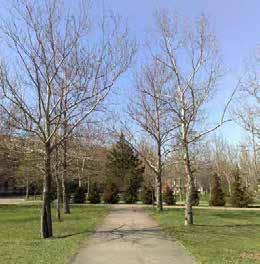
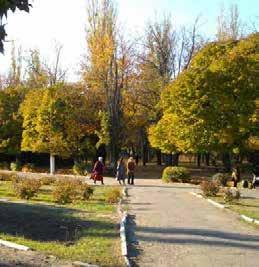
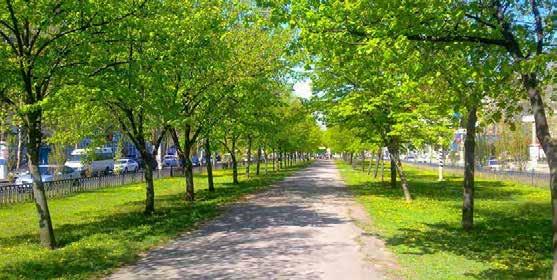
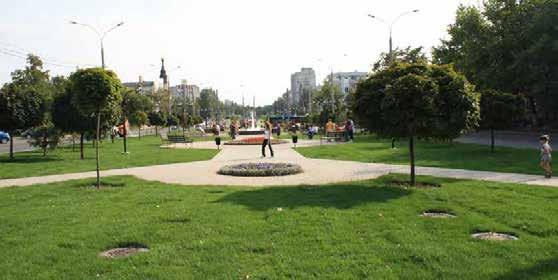
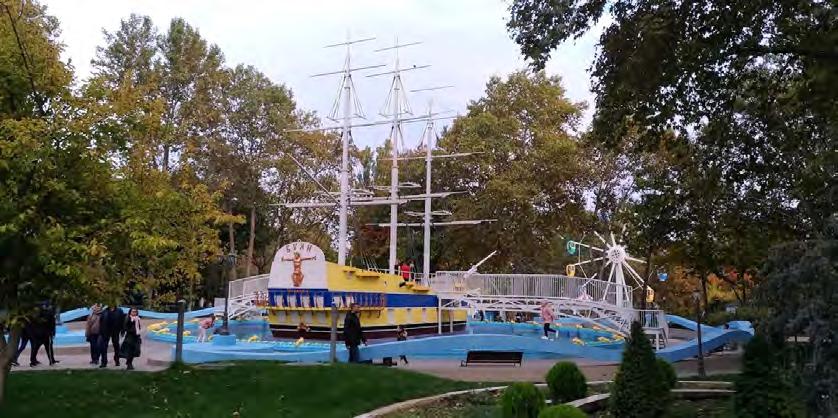
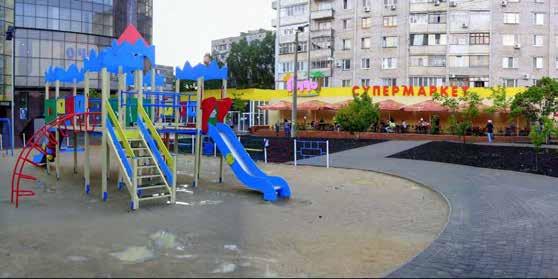
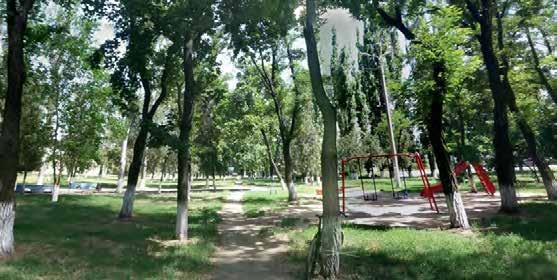
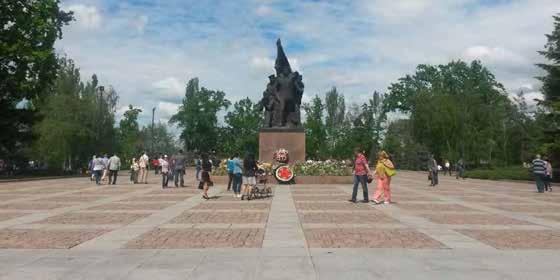
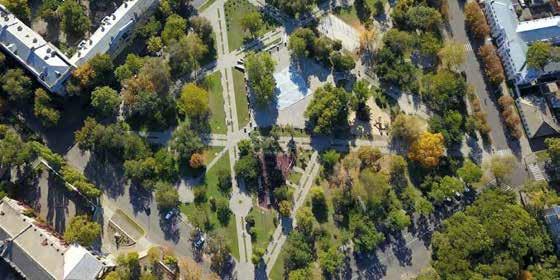
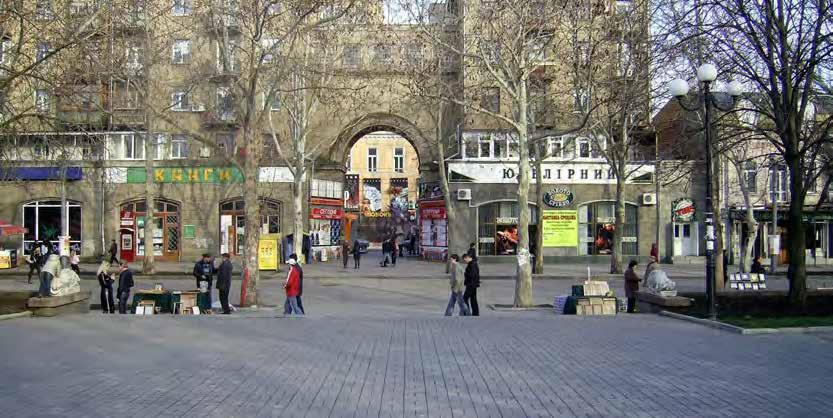
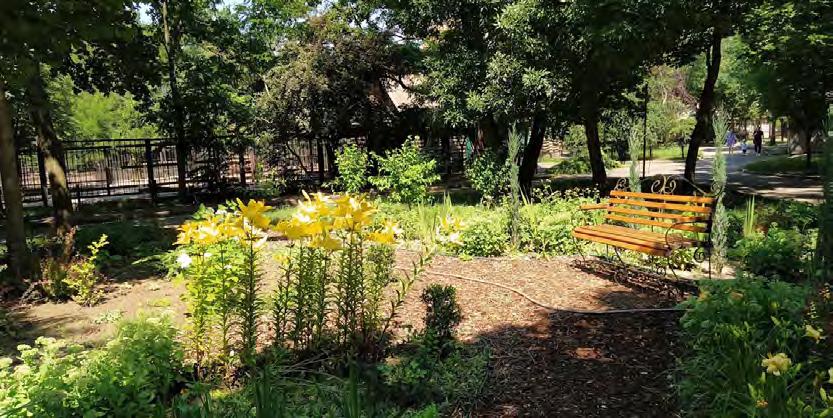
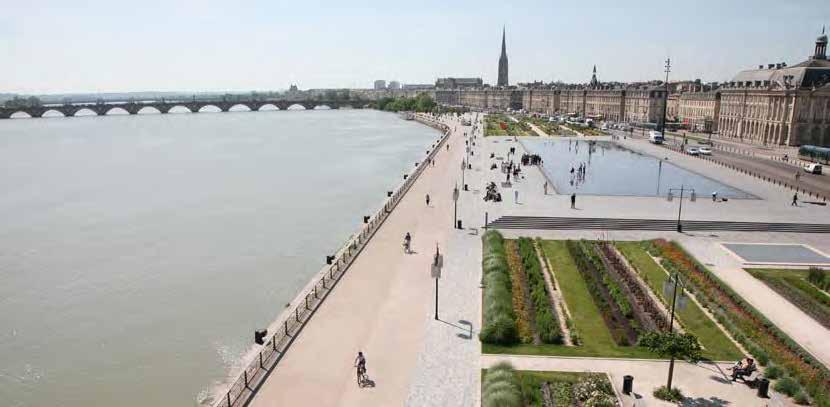
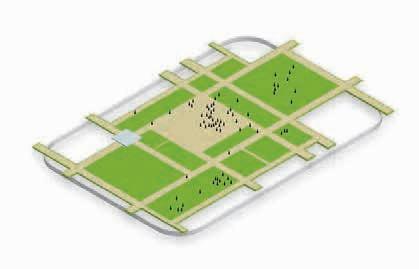
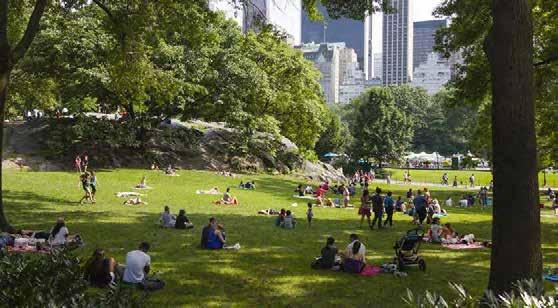
Types of public green spaces | Public parks
Public parks in the city of Mykolaiv are spread between the consolidated city centre and the residential expansions to the south, they are fragmented and lack interconnection. There are two main types of parks: wilder parks with meandering paths, and urban parks that include built-up zones and hardscape for playing and resting areas, as well as general recreation. Both are generally easily accessible, as they are connected to densely populated neighbourhoods, however the quality of public space, planting and equipment is often quite poor. The most common species are conifers (pines); however, some parks also alternate between steppe and grassland areas, creating openings towards the coast
Types of public green spaces | Linear parks
The city's linear parks are mainly located in the dense northwestern part, where the main streets form busy road corridors. These green areas are linear formations that act as medians within street axes. Green spaces and paved plazas form the central public space, and follow one another uniformly, creating priority routes and safe crossings for pedestrian traffic. However, the generated public space is monotonous and of low quality and use. Multiple land uses front the linear parks: residential areas and shops extend along all axes in both directions, however the central axes are only used for crossing and there are few opportunities for recreational or environmental use. Trees run along the linear formations in a homogeneous way, however the ecological quality and health of the tree plantations is often poor.
Types of public green spaces | Playgrounds
According to the GIS database, there are only a few, small playgrounds within Mykolaiv. These are mainly located at the edges of densely populated residential neighbourhoods to the north, while some are embedded within larger urban parks. Being easily accessible, they act as important components for activating public space, including paved play areas with various attractions for all age groups, lawn areas and colourful flower boxes. With a simple and repetitive design, the plant formations are generally endemic species with tall trees, offering shaded areas for seating. Generally, playgrounds built in recent decades have only a small area equipped for playing and recreational activities, and rather offer lawn areas interspersed with tall trees.
Types of public green spaces | Green squares
Green squares, mainly spread throughout the city centre of Mykolaiv, revitalise the heritage and public space of the historic city by fostering its identity and reactivating the public space. Some squares propose a more sustainable approach, with greenery that revitalises the traditional square.
Uses and features include multifunctional community spaces, fountains, monuments and mixed spaces to host events and activities attracting visitors and encouraging an active public space.
Location of green squares in Mykolaiv Municipality
Types of public green spaces | Zoological park
Mykolaiv Zoo was founded by the mayor Mykola Pavlovich Leontovych in 1901; initially a private collection and aquarium, it was later nationalised. As one of the oldest zoos in Ukraine, it is a protected natural park housing a variety of exotic birds and mammals, as well as natural species forming part of the botanical garden.
Located in a protected corner of the historical city, it's easily accessible and represents a historical landmark for the population. It is a very important attraction for the city, offering opportunities of connection to nature and exotic fauna.
Enhancing Urban Planning in the city of Mykolaiv
Public green spaces provision per inhabitant
In order to evaluate the provision of public space per person, two distinct types of spaces have been taken into account:
1. Spaces smaller than 1 ha.
2. Spaces larger than 1ha.
Focal points have been identified for each (centroids for smaller areas, and crossings or main accesses for larger areas); a different sized radius defines each space's sphere of influence. For green spaces smaller than 1ha, the radius of influence origins from the centre of the area (centroid). For green spaces larger than 1ha, the focal point is placed on the main access point(s) to the areas. For linear spaces (which develop mainly along one direction) access point(s) have been preferred to centroids. The radius of each sphere of influence identifies the minimum distance required to walk to those spaces in 5 and 15 minutes. These two "rays of influence" have been established based on Green Cities parameters. The 15-minute influence radius, which corresponds to about 900m of walking distance, refers to the 15-minute city model, which foresees that everyone living in a city should have access to essential urban services within 15 minutes on foot or by bicycle. The 5-minute radius of influence responds to World Health Organization's standards: urban residents should have access to at least 0.5-1ha of public green space within 300 meters from their house (WHO, 2017b).
These two indicators have been combined in order to have an image of the overall provision of public spaces in the city, and highlight the areas where current provision is insufficient.
As shown in the two maps on the following page, accessibility to public green areas within 5 minutes on foot is not guaranteed for many residential areas throughout the city, while accessibility in 15 minutes covers the urban fabric quite well. The lack of accessibility to public green areas is evident especially in residential areas located to the north, south, and west of the city.
Buffer area of influence
Municipal areas with low endowment of public green spaces
connected to neighbourhoods and settlements
Public green spaces provision per inhabitant
TSENTRAL'NYI
TSENTRAL'NYI
INHULS'KYI INHULS'KYI
Public green spaces provision per inhabitant
ZAVODS'KYI
ZAVODS'KYI
KORABEL'NYI KORABEL'NYI
Enhancing Urban Planning in the city of Mykolaiv
Types of semi public green spaces | Residential gardens
Large apartment residential complexes are evenly distributed throughout the entire municipal area of Mykolaiv. These multistorey buildings represent a recurring housing typology in the city, especially when concerning more recent real estate developments. This typology includes both linear building blocks and open/closed courtyards. Most residential complexes have outdoor semi-public/ private areas accessible to the community. These pertaining open spaces are often equipped with outdoor furniture and other spatial features aimed at creating areas for socializing and/or playing. The courtyards consist mainly of asphalt-paved ground surfaces with scarce and sparse vegetation in the form of flowerbeds, small groups of herbaceous plants, low trees and lacking in general in grass lawns. Areas from the Border Landscapes analysis that have been identified as future "Residential and Industrial Development Projects" from the Municipality program, such as areas designated for big residential complex and for private estate building, are also identified within the map.
Courtyard in big residential complex with Playground
Courtyard in big residential complex with a social area
Types of private green spaces | Manorial residential
The manorial residential typology represents the most diffused and evenly widespread housing system of Mykolaiv. These settlements are mainly composed of single-family one-two stories row houses with a small private garden. Most of the green areas of these residential complexes are privately maintained gardens and/or allotments.
The asphalt paved streets are edged by cut grass areas, big bushes or small trees, and spontaneous flowers with groups of herbaceous plants. The absence of sidewalks pose serious safety issues for pedestrians, and denies the opportunity for shared public space along the roads.
Types of private green spaces | Cottages
The extensive areas of green land for cottages are mainly articulated in long bands of urban fabric. Small cottages represent one of the most important housing typologies in Mykolaiv. These suburban settlements follow a rigid layout of row houses connected by narrow unpaved streets. These residential developments are located in different parts of the city along the Bug and Ingul rivers, framed as large terraced residential destinations for holiday use. These areas are usually surrounded by agricultural fields or grasslands providing inhabitants with a close connection to open green fields, on one side, and riverbank wetlands areas on the other side. Individual 1-2 storey houses are provided with private green areas used as either gardens or allotments. Along the roads narrow strips of vegetation, either spontaneous or maintained by private owners, border the unpaved pedestrian/vehicular track. Areas from the Border Landscapes analysis that have been identified as future "Residential and Industrial Development Projects" from the Municipality program, such as areas designated for private estate building, are also identified within the map.
Location of cottages green areas in Mykolaiv Municipality
Cottages with private vegetable garden
Cottages and unpaved streets
Cottages with private flowerbeds
Types of private green spaces | Low-rise Mixed-use building
Types of semi public green spaces | Sport Areas
Sport Areas in the city focus mainly on football; a few courts and venues are dedicated to tennis or basketball. Sport venues are mainly concentrated in the city centre, although a few facilities serve residential areas as well. Several academies and sports clubs are located along the right bank of the Bug River, a favourable place for outdoor recreational activities. The provision of sport facilities varies from north to south. To the north, more modern complexes host green spaces and mixed public areas for rest and recreation. These often include secondary services related to sport, such as shops, cafés and restaurants or small recreational areas often vegetated with seating and sculptures at the edges. To the south, sport venues are mostly private, surrounded by fences and walls as opposed to permeable green boundaries; nonetheless, tree-lined avenues and porous areas are often present inside these complexes. In some neighbourhoods, underused areas have recently been converted to small sport facilities such as basketball or skateboarding courts, the latter being generally quite popular among young people.
Location of sport areas in Mykolaiv Municipality
Types of semi public green spaces | Healthcare and Education
Healthcare
Hospitals in the city generally benefit from generous surrounding green areas. However, these are generally enclosed spaces, not accessible to the public. Some of these spaces have the potential of being transformed into urban parks.
Schools and Universities
Schools and universities generally include outdoor spaces in the form of playgrounds and sports areas. Some of these seem to be open to the public.
Schoolyard
Schoolyard
Types of special purpose green spaces | Road green
Streets make up a significant percentage of public land in most cities, offering a unique opportunity to incorporate green elements that protect the environment, and improve the health and ecological footprint of urban districts. Green streets improve infiltration and retention of rainwater and reduce pollutants, improving air quality.
In Mykolaiv, some roads lend themselves to this reasoning. However they are often overgrown, and currently only include street planting, lacking infiltration solutions and permeable pavements. Safety for pedestrians and cyclists could be improved by offering solutions for slow mobility, while improving the aesthetics and liveability of neighbourhoods.
Location of road green in Mykolaiv Municipality
Types of special purpose green spaces | Cemeteries
Cemetery greenery has an important cultural and environmental function; not only does it enlighten a sorrowful environment, but it also contributes to improving environmental and health balance. From a compositional point of view, cemetery landscape complements the burial grounds and improves visitor orientation; it has a primarily symbolic meaning and was used in the past to mark prominent grave locations.
Cemetery areas are a significant part of urban greenery and an interesting part of the history of the city of Mykolaiv. The largest graveyards are located to the east near the Ingul river, while small cemetery areas are scattered throughout the urban fabric. The latter are often edged by uncultivated or low-quality areas. Mykolaiv's cemeteries generally have only one access point; planting by the main gate and internal avenues often appear deteriorated.
Enhancing
Criticalities and opportunities | Hydrographic system
The analysis of Mykolaiv's public space per macro-area helps understand opportunities and criticalities of each landscape area. This will be the basis for proposing targeted actions, as well as synergic and calibrated interventions within the landscape development, enhancement and conservation strategies.
With regard to the hydrographic system, waterfront areas currently have low or partial accessibility, due to the presence of residential, infrastructural, and industrial areas or due to the lack of cyclopedestrian connections. These areas have a high potential and require solid implementions in terms of accessibility, preservation and enhancement of the existing natural fronts and wetlands. The enhancement of the canal system (consisting of natural and artificial water courses alike) will also be an important part of an ecological, environmental, and recreational network that can improve the local population's quality of life.
Mykolaiv's existing natural areas have the potential to be developed and activated to allow a quality fruition by users. Panoramic spots, points of historical interest and areas for new marinas will represent hotspots able to increase the tourism offer of the municipality.
Special attention should be given to the flooding risk which concerns different parts of the territory.
OPPORTUNITIES
RIVERFRONT ACCESSIBILITY
CRITICALITIES
Wetlands
Rivers system as an ecological, environmental and recreational axis to be enhanced
Minor ecological corridors along the water channels to be regenerated and enhanced
Existing natural areas of landscape - environmental interest
Presence of industrial areas that constitute a barrier between river and city
Areas of landscape - environmental interest not accessible
Green areas or areas of environmental landscape interest
Designated areas for new Marinas: areas with berths for yachts and small boats, with services and facilities
Lack of cyclopedestrian
Panoramic spots
Points
Criticalities and opportunities | Urban green space system
As analysed in the previous pages, Mykolaiv’s urban green space network consists of different typologies of green spaces varying from green areas for public use, green areas for private use, green areas of special purpose and territories of the Nature Reserve Fund.
Despite providing a widespread and varied offer, this system is fragmented and lacks quality.
By increasing per-capita provision, a dense green network can be achieved by improving connections between existing features and regenerating existing underused areas, bringing benefits to the whole urban fabric and its inhabitants.
Green landmarks and green areas that already constitute important hotspots for the ecological network should be enhanced. The road infrastructure could be transformed into urban-scale ecological corridors, counteracting the infrastructural limits of limited ecological continuity.
POTENTIALITIES
Main green areas that already constitute important hotspots of the ecological network, and landmarks for citizens
CRITICALITIES /
Infrastructural limits for
and ecological
Areas of disruption of urban and ecological continuity due to the presence of inaccessible functions (industrial,
Road infrastructures that have the potential to become urban-scale ecological corridors
Urban area rich in public space that could generate a
and
Residential areas with high regeneration potential
Residential areas with a shortage of neighbourhood services linked to the provision of public greenery
Fragmented green network due to lack of green and slow mobility connections between urban green areas
Vacant Land
Незабудовані
Enhancing Urban Planning in the city of Mykolaiv
Open vacant spaces | Border landscapes
The chapter addresses the issue of those spaces within the city that, for various reasons, do not fully exploit their maximum potential. In some cases, these are uncultivated green areas, often located on the outskirts of the city; in other cases, they are central portions of land that have not yet found adequate space within Mykolaiv's planning structure; in other cases, they are highly strategic areas that cannot be activated immediately due to legislative reasons. At the end of the chapter, it is possible to find a synthesis of all these elements contributing to forming a map of Vacant Land Areas, divided into the four districts of Mykolaiv.
The plots classified as "Border Landscapes" are mainly large natural and semi-natural areas located on the outer fringes of the city, usually scarcely accessible and usable. These macro-landscape typologies include agricultural land, forests, grasslands, and Nature Reserve Fund areas that have been described in the 2019 General Plan, as follows:
Agricultural land
It includes an environmental framework of medium to low-quality landscape interest, bearing witness to a historical and cultural tradition of intensive agricultural use. The agricultural matrix extends westwards, including wheat, rapeseed, and sunflower cultivated areas. Intensive irrigated agriculture is practiced extensively in the area at the confluence of the southern Bug and Ingul rivers, irrigation being the most reliable means of combating drought and increasing production potential given the local natural and climatic conditions. Borders between fields are in the form of isolated shrubs and widespread tree belts. Local tree belts host low to medium-density stems of invasive vegetation. Overall, cultivable land in the city of Mykolayiv occupies up to 13.2% of the total area of the city.
Forest
Nowadays, there are no large forest areas left in the city of Mykolaiv; only the remaining fragments are located at the edges of recent urbanization, to the north and south. These belong to the forest-steppe area, with a fairly rich and diverse flora, mainly due to the favorable climate, topography, and fertile soils. The vegetation consists of young deciduous forests and new plantations (oak, hornbeam, ash, maple, linden, elm, and alder). The forest groups are often fragmented by shrub and grassland formations.
Grassland
Grassland areas are threatened by increasing pressure from agricultural areas, but traces can still be found mainly along the
coastal area and between residential neighborhoods and open spaces. Floodplain meadows are important for the preservation and formation of local biodiversity and climate and for traditional animal husbandry and grazing.
Nature Reserve Fund
The main goal of the Nature Reserve Fund is the granting of a valuable natural area status of protection. Different areas of the Nature Reserve Fund such as the Zhovtnevskoye reservoir, hydrological reserve of local importance (429 ha), Forest reserve of local importance (510ha), and a reserve tract of Dubky (106ha) can be found inside Mykolaiv’s territory. In addition, to the described categorization of macro-landscape typologies, some areas will undertake new urban developments. These Residential and Industrial Development Projects represent plots that belong to various stakeholders for private estate buildings, industrial parks, or for big residential complexes. The Municipality has also planned the reconstruction of the Zhovtnevskoye water reservoir in order to reuse this basin to increase the volume of water storage.
The map on the following page is the result of various qualitative and quantitative analyses and discussions intercoursed with the municipality, with the aim of integrating all available information about the landscapes at the city borders and their future developments.
In the map, Territories of the Nature Reserve Fund (*) have been localized according to the information included in "Appendix 2 of the Analysis Documents of the Local Working Group" and the "Report on Strategic Environmental Assessment", (2023). In addition, all areas marked with a dashed hatch named: Private Estate Buildings Development, Industrial Park Development, and Big Residential Complex Development, have been confirmed by the Municipality as future development projects (**). Projects for the new developments in the Micro-District "Lisky-2" and the Mala Korenikha area have been also included as Additional Development Projects (***). In conclusion, information regarding the current properties of plots and development areas has also been confirmed by the Municipality technicians (****).
Steppe landscape of the south Reserve fund forest Grassland formation in the Tiligulskyi Regional Landscape Park (Mykolaiv region)
Private
Industrial
Enhancing Urban Planning in the city of Mykolaiv
Opportunities and Constraints | Border landscapes
Border Landscapes offer several opportunities and present some challenges.
They represent a natural, cultural, and social resource to be preserved and enhanced, not only because of their ecological value but also as local recreational areas.
Connections between border landscapes and the city center, as well as the hydrographic system, must be implemented to make these areas more accessible and easily maintained. Structuring green ecological corridors is crucial to enhance local residents' access to the urban periphery, and to improve the general ecological value of the city both in terms of ecosystemic benefits and ecological connectivity between the natural systems.
The risk of sealing ecological corridors between river and inland with new urban development should be addressed and mitigated. Landscape design guidelines applicable to the private developments should therefore be formulated and implemented.
OPPORTUNITIES
Large areas of unspoiled landscapes that have the
CONSTRAINTS
Risk of sealing ecological corridors between river and inland
Presence of wooded areas to be preserved and exploited
for their ecosystem value
Natural
Lack of connections between border landscapes and the blue network of the city
Open vacant spaces | Accessible wetlands
The accessible wetland areas are mainly located on the banks of the minor Ingul river to the Northeast. These large areas mainly develop along the riverbank, edged by the river on one side, and dense residential areas on the other.
Although these wetlands are part of the natural and landscape elements of Mykolaiv, they are only partially accessible. Access points are either from the vehicular road network within the residential and industrial areas that run along the shoreline, or via a fragmented pedestrian network along the river.
These areas suffer from neglect, have a high concentration of rubbish and lack sufficient facilities for users.
Location of accessible wetlands in Mykolaiv Municipality
Open vacant spaces | Brownfields
There are several void land plots and brownfields, publicly and privately owned especially in the southern areas of Mykolaiv, near major residential areas.
The areas analyzed here are part of the heritage of public green areas but are characterized by a lack of paths, functions and vegetation structures that can effectively make them usable and definable as public parks.
Somehow, these areas could potentially become strategic areas for the placement of new public functions and recreational activities for these parts of the city that lack large scale recreational and natural assets.
Green area near Torhova street
Green area near Korabeliv Avenue
Open vacant spaces | Potential Expansion Areas
Potential Expansion Areas:
Mykolaiv's Potential Expansion Areas constitute strategic zones that present a significant opportunity for urban transformations. These areas are not confined to single districts, rather, they are distributed across different parts of the city. Each area present different existing conditions and land use typologies, providing opportunities for varied urban projects.
To ensure a comprehensive understanding of the Potential Expansion Areas and their surrounding urban fabric, these areas have been mapped with the support of the Municipality. Basic information including size, location, and existing artifacts were based on the 2019 General Plan.
A potential land use for each area has been identified, including Residential, Industrial / Commercial, Public Green Spaces, and Mixed-Use / Community Facilities. These categories are not intended as definitive project guidelines; they rather suggest vocations and possibilities for future development.
In redefining the urban landscapes of the city of Mykolaiv, these areas have the potential of defining new physical spaces as well as new dynamics which will bring new life to the after-war city. By strategically planning these areas, Mykolaiv has the opportunity to enhance its overall liveability and economic vitality.
Even if not all vacant land will be dedicated to public open spaces, sustainable goals should be taken into account; keeping vast natural areas that might act as green lungs or ecological buffers for the city should be a priority. Each of the Potential Expansion Areas should preserve and enhance its ecological value, with a focus on connection to nature and clear landscape guidelines.
These areas should act as dynamic urban tiles that can attract and activate the surrounding community, improving the environmental quality of the city and reaching Mykolaiv’s sustainable goals. Priority should be given to the uses needed to re-balance current shortcomings, helping re-build a new sense of togetherness for Mykolaiv's communities.
Mykolaiv's Potential Expansion Areas are not just spaces waiting to be developed, but rather strategic assets in the city's pursuit of a sustainable and resilient future.
Epiphany Park
Dimension: 2,6 ha
Type of development: Public Green Spaces
Information: The area is municipally owned, and designated for public green use. Currently, the areas are uncultivated and partially vegetated, located near the coastal area and the wetlands of the Bug River. All around one can find residential neighborhoods and sport facilities.
Epiphany Park Extension
Dimension: 3,3 ha
Type of development: Mixed Use / Services
Information: The municipally owned area is located near vast residential complexes, and is designated for the expansion of Epiphany Park, in favor of the development of the 47th School, which is nearby.
Klechova Balka Street
of development: Residential Information: The municipal property plot currently presents dense
and is located in a vast residential context near Epiphany Park. The area is designated for the maintenance of public buildings.
Dimension: 130 ha
Type of development: Public Green Spaces Information: The area is municipally owned, and designated for public green use. At the moment this area is an agricultural field with the presence of some private buildings. This extension will be included into the existing Friendship Park, which is part of the "Epiphany district".
Liski-2 Expansion Area
Dimension: 33 ha
Type of development: Public Green Spaces and Mixed Use / Services
Information: The costal areas is municipally owned, and designated for mixed and public green use. It is characterized by a linear waterfront with paths and lawns, not always in good condition. The level of accessibility is high, due to the presence of bathing resorts and leisure spots, widespread across the area.
Lisky Park Expansion
Dimension: 3 ha
Type of development: Industrial / Commercial
Information: The area is municipally owned, and designated for commercial/industrial use. Currently, one can find multiple architectural artifacts, particularly the "Strasse" market and some garages. On the east side, the removal of the markets and garages provides an opportunity to expand the nearby Lisky Park and create a new green area.
Mr. Solar Park
Dimension: 11 ha
Type of development: Public Green Spaces and Mixed Use / Services
Information: The area is partly owned by the municipality and partly by privates. The Solar District part is managed by the municipality, while the maintenance of the boat dock by privates.
There is a vacant land with a small number of architectural artifacts, which is designated for the development of public green areas.
Technopark Embrankment
Dimension: 32 ha
Type of development: Industrial / Commercial Information: The area is state-owned, and designated for commercial/industrial use. The area belongs to the territory of the state enterprise Mykolaiv Shipyard named after "61 Kommunar", located near the Ingul River. There are a large number of industrial complexes, as well as land parcels suitable for the development of green areas and a "Technopark".
Temvod District Park
Dimension: 18,5 ha
Type of development: Public Green Spaces and Mixed Use / Services
Information: The Temvod district is a dense area with schools and other services. There is a vacant parcel, open and easily accessible located along the Ingul River. Near main recreational areas, the area is designated for the expansion of a university/industrial development, as well as a public green area.
North Town Park
Dimension: 17
Information: Part of the site is partly private and municipally owned, designated for the construction and maintenance of
buildings. A small number of building complexes are located on the site. Part of the site is free for the development of public green spaces.
Soliany-Ternivka Park
Dimension: 16 ha
Type of development: Public Green Spaces
Information: The municipally owned area is characterized by an irregular landscape, and designated for public green use. This forested shoreline of the Ingul River in the Ternivka district is potentially accessible, given the various states of degradation, and considering that many private residences have been built along the coast.
Matviyivka Boulevards
Dimension: 13,4 ha
Type of development: Residential Information: The Boulevards are municipal property with private houses along the streets. Silikatna St., 1a Pishchana St., Verkhnya St., Marshal Chuikov St., and Lisova St. Towards are the mobility axes that form a system of boulevards that could potentially be exploited as green streets generating connections with the city and the riverfront.
Matviyivka North Park
Dimension: 32 ha Type of development: Industrial / Commercial
Information: The partly municipal and privately owned area is designated for the expansion and consolidation of the already existing industrial buildings. The area is intended to serve this complex, including some potential green areas.
Matviyivka Coastal Park
Dimension: 57 ha
a
and is designated as industrial land for the maintenance of the property complex.
Varvarivka 1 Street Park
Dimension: 2 ha
Type of development: Residential
Information: This green area is located in the northern part of the city in the residential context of cottages along the Bug River. The area presents tall trees and invasive vegetation, and it is potentially accessible, and suitable for the expansion of the residential area.
Varvarivka 2 Street Park
Dimension: 7 ha
Type of development: Public Green Spaces Information: The Varvarivka Park on the left bank of the Bug River is home to a paintball field and green areas in good condition. Partly fenced, the space constitutes one of the main green areas in the newly expanding district. However, there are no other recreational zones for the neighborhood.
Naberezhna Street Park
Dimension: 11,4 ha
Type of development: Public Green Spaces
Information: The municipally-owned area is an uncultivated land north of the Ingul River estuary.
It is wedged between two low-density residential fronts and presents mainly steppe formations, and it is bordered to the south by the Ternivka Channel Fisheries Reserve.
Velyka Korenikha Park
Dimension: 60 ha
Type of development: Public Green Spaces
Information: The wetland area along the Bug River is municipally-owned. There is a small presence of residential private properties, but most of the site is available for green space use.
Kobzarska Street Park
Dimension: 5 ha
Type of development: Public Green Spaces
Information: The municipally-owned area presents some building complexes, including the Ocean Sports Complex. It is designated for public use as a large green area, and for the construction and maintenance of market infrastructure buildings.
Zaliznychna Street Park
Dimension: 8,6 ha
Type of development: Industrial / Commercial
Information: The state-owned "landscape park" is located near Zaliznychna Street and the southern bridge crossing. It is designated for the placement and operation of railway transport buildings and facilities, including the development of some green mitigation areas.
Novobudivna Street Park
Dimension: 1,2 ha
Type of development: Mixed Use / Services
Information: The municipally owned area presents some residential buildings, and is almost completely free for the development of a public green area. A small part of the plot is allocated for the reconstruction of the trade pavilion into a café and a capital catering building.
Rodynna-Lipova
Dimension: 11,6 ha
Type of development: Industrial / Commercial
Information: The uncultivated area is municipally owned, and presents widespread tall tree formations. Located between residual agricultural fields, one strip is in continuity with the Friendship Park. The area is designated for the construction and maintenance of commercial buildings.
8 Microdistrict Square
Dimension: 8,6 ha
Type of development: Public Green Spaces
Information: The public green plot is municipally owned, and located near the 48th school and residential complexes in the Korabelnyi district. The area is designated for the development of a public green area.
Kahovska Square
Dimension: 20 ha
Type of development: Public Green Spaces
Information: The area is municipally owned, and free of any buildings. It is located near Kahovska street in Korabelniy district. The plot is designated for the development of a green public area.
Vacant land map by district
The following maps provide details on vacant areas in the city of Mykolaiv. In addition to the above mentioned information, they highlight specific areas designated for planned residential buildings, along with areas referred to as "special zones" by the municipality planning documents.
In relation to the Korabelnyi district, the border landscapes are of significant importance and extent. As such, effective management of these areas becomes a key consideration in the masterplan.
Korabelnyi
Zavodskyi
Zavodskyi
The Zavodskyi district has a significant number of special zones that could be of interest, as they are also located in the city centre of Mykolaiv. Additionally, the district features designated areas for multi-apartment residential buildings, coupled with expansive border landscapes that have the potential to evolve into the new riverfront of this urban area.
Potential
Area
Vacant land map by district
The Inhulskyi district includes minimum vacant land. However, there is a large area of grassland, part of which is designated as an industrial park. There are also some small special zones and an area planned for multi-apartment residential building. Finally, accessible wetlands, which could form the new riverside areas of the Inhulskyi district.
Inhulskyi
Tsentralnyi
Tsentralnyi
The Tsentralnyi district also includes large areas of the border landscape to the north. A number of areas planned as multiapartment residential buildings are located in the centre of Mykolaiv. There are also extensive special zones, whose regeneration after the conflict will be of primary importance. In addition, numerous vacant spaces identified in the 2019 General Plan offer strategic opportunities. Similarly to the Zavodskyi district, certain areas will be crucial for the development of an urban riverside.
Special
Potential
Area
Traffic and Transport Network Analysis
Regional and city-scale transport network
Trans-European transport network in Ukraine
The recent conflict in Ukraine has made the European Union rethink the Trans-European Transport Network based on the new geopolitical landscape. In May 2022, the European Commission identified the main challenges facing the EU and neighbouring countries to support Ukraine's economy and recovery and improve its communications with EU countries by extending the European Transport Corridors.
As part of the EU's solidarity response to Ukraine, the European Commission presented a set of actions to facilitate the export of its agricultural products through the so-called "Solidarity Lanes" Communication.
This document proposes a series of urgent measures to be developed:
• Increase the available transport material (wagons, ships,...).
• Increase rail capacity (number of train paths, access and capacity of intermodal terminals, etc.).
• Facilitate administrative processes for border-crossing (customs formalities).
• Increase storage capacity on European soil for Ukrainian agricultural products.
In the medium term, the aim is to establish new connecting infrastructure that will help the reconstruction of Ukraine. In this regard, in July 2022 the Commission revised the TEN-T maps to facilitate the extension of the European corridors to Ukraine and their future incorporation into European transport standards.
The main changes proposed, yet to be approved by the European Parliament, are the extension of four of the European Transport Corridors to Moldova and Ukraine.
In particular, it proposes the extension of
• The North Sea - Baltic Sea corridor through Lviv and Kyiv to Mariupol.
• The Baltic Sea - Black Sea - Aegean Sea corridor to Odessa via Lviv and Chisinau.
• The Baltic Sea - Adriatic Sea and Rhine-Danube corridors as far as Lviv.
On the other hand, these proposals imply a reduction in the length of the Mediterranean Corridor. Until now, it reached the Ukrainian border via Hungary. In the new maps defined by the EU, the Mediterrenean Corridor currently stops at Zagreb (Croatia). In addition to adapting the corridors, other measures are proposed:
• Bringing the infrastructure in Moldova and Ukraine up to European technical, regulatory and administrative standards. This will require very considerable investments.
• Russia and Belarus are no longer a priority target for the EU. As a consequence, cross-border crossings between the EU and these two countries are no longer part of the Core Network but are included in the Comprehensive Network, and therefore their implementation is delayed from 2030 to 2050. In practical terms, this has a considerable impact on the financing of cross-border infrastructure, as European funds are directed preferentially towards the Core Network.
• Maps indicating the possible future extension of the TEN-T towards Russia and Belarus are removed from the TEN-T. This point leaves the door open to a possible democratic transition in Belarus, which could allow its reincorporation into the Regulation.
• Member States are required to draw up plans for adaptation to standard gauge. Finland, Estonia, Latvia, Lithuania, Portugal and Spain, member states with a nominal track gauge other than 1435 mm, will have to draw up a plan for the transition of their railway infrastructure to the European standard gauge. These plans (but not the infrastructure) will have to be finalised two years after the adoption of the new regulation. Although it also has a different gauge, Ireland is excluded because being an island doesn’t connect to the rest of the European rail infrastructure.
The adoption of a standard gauge in Moldova and Ukraine, as well as in the other European countries, is essential to improve rail interoperability and efficiency.
This proposed amendment joins other initiatives developed by the EU to facilitate exports and bilateral trade between the EU and Ukraine. The spill-over effects of the conflict also reach transport.
Source I Джерела: https://transport.ec.europa.eu/news-events/news/commission-amends-ten-t-proposal-reflect-impacts-infrastructure-russias-war-aggression-against-2022-07-27_en https://piernext.portdebarcelona.cat/en/mobility/the-trans-european-transport-network-extends-to-the-east/ https://transport.ec.europa.eu/system/files/2022-07/Revised%20map%20of%20Ukraine.pdf
The road network in Ukraine presents a unique set of challenges and characteristics. With a road density considerably lower than many other European countries, Ukraine has 159,447.1 kilometers of paved roads out of a total road length of 163,024.2 kilometers. It's important to note that roughly 50% of these roads need to meet the desired roughness standards, posing a challenge for transportation. Furthermore, the average highway speed in Ukraine needs to catch up to that of Western European nations, often ranging from 2 to 3 times lower. Ukraine's road network is entirely state-owned.
Ukraine has one of the largest railway networks in Europe, a testament to its vital role in transportation. Railway transportation plays a significant role in Ukraine, accounting for 37.5% of the country's passenger traffic and facilitating essential connections. This extensive railway network is a crucial link to Ukrainian seaports, facilitating trade and commerce on a grand scale. Ukraine has invested in electrification, with 48% of its vast 24,000-kilometer long railway network being electrified. Ukraine's railway system is a pivotal component of its transportation infrastructure, enabling connectivity, trade, and accessibility.
Ukraine's maritime transport sector is robust, comprising 13
state-owned commercial seaports and an additional ten river ports. These maritime gateways are essential for trade and transportation. Notably, the country's four major seaports— Illichivsk, Mykolaiv, Odessa, and Yuzhny—handle a significant portion of cargo volume, accounting for 78.3% of the total. Among them, over 85% of grain and 95% of metal products are efficiently managed, highlighting their pivotal role in Ukraine's economy and trade networks. Ukraine has 1.7 thousand km of navigable waterways. The two primary river arteries, the Danube River and the Dnipro River are essential for transporting goods. These waterways and the seaports contribute to Ukraine's maritime transport ecosystem.
Road network of Ukraine
Rail network of Ukraine
Railway transportation shares 37,5% of Ukraine passenger traffic Ukrainian railways serves 18 Ukrainian seaports Ukraine 's network extend for 24,000 km
Chornomorsk OdessaYuzhny
Ports of Ukraine
Ports of Ukraine Порти України
Commodities in the 4 Major Ports
Relative Importance of Commodities in the Four Major Ports in Ukraine
City road network
The map shows a comprehensive overview of Mykolaiv's road hierarchy, encompassing the pre-conflict road network and the meticulously planned road network per official documents and municipal blueprints. Notably, it highlights an ambitious development project in the form of a new planned bridge that will connect the city's two sides, divided by the Southern Bug River. The current bridge of the city further north from the planned bridge required maintenance as per pre-conflict information.
50 km of planned "highway-streets-district" within Mykolaiv city border
50
23.2 km of planned "highway-streets-public" within Mykolaiv city border
39.4 km planned reconstruction
TSENTRAL'NYI DISTRICT
ZAVODS'KYI DISTRICT
INHULSKYI DISTRICT
KORABEL'NYI DISTRICT
T1507
T1501
Enhancing Urban Planning in the city
Daily Volume of Private Transportation
The available macrosimulation model allowed the extraction of the map presented on the right, which shows the volume/capacity ratio for the daily traffic in Mykolaiv.
The model defines a daily capacity of the streets which is used to evaluate the overall congestion related to the daily private traffic. Regarding this parameter, the ratio maintains values below 60% mostly, which does not determine any criticalities.
To identify the congestion issues in the city it is necessary to evaluate the private traffic behaviours during the different periods of the day (morning, afternoon, etc.). Then, it is important to identify the peak-hour periods, where the congestion issues could be presented.
The current simulation model does not determine the periods of the day nor the peak-hour intervals.
Highways Шосе
H24
M14
H14
H11
Mykolaiv bridges
The map illustrates the bridges within Mykolaiv and the various modes of transportation utilising them. The Varvarivsʹkyy Mist Bridge, serving as the primary link between the western and eastern sectors of Mykolaiv, separated by the Southern Bug River, is currently grappling with congestion issues and is in need of maintenance.
Pontoon
Inhul's'kyy
Transportation hubs of Mykolaiv
The forthcoming chapter is dedicated to the main transportation hubs of Mykolaiv, encompassing the Port, the International Airport, and the Railway Network, including the central railway station. Strategically located 76 kilometres from the channel's entrance, Mykolaiv Port covers a vast expanse with 323 hectares of water and 69.3 hectares of land. This vital port handles diverse cargo types, including grain, cement, wood, oil products, metals, and containers. Impressively, it boasts a daily loading and discharging capacity of up to 30,000 metric tons, making it a linchpin for regional trade and transportation.
The freight traffic map represents the road network within Mykolaiv, showcasing those specific routes that are heavily utilized by freight transport, thereby contributing to traffic congestion and safety concerns. Of particular note are the roads in the heart of the city center, where the coexistence of heavy commercial vehicles and urban traffic has raised significant challenges for daily commuters and residents.
While these road connections are vital for trade, commerce, and transportation links, the heavy usage of these routes by freight transport necessitates a thoughtful and comprehensive approach to address congestion and safety issues. This includes infrastructure upgrades, traffic management strategies, and potential alternative routes to alleviate the strain on the city's road network.
The report outlines the specifics of a planned ferry crossing project to strengthen water transport capacity for freight. This project could alleviate road congestion within urban areas, primarily caused by the heavy vehicles responsible for transporting goods to and from the port zones.
The International Airport of Mykolaiv, situated 13 kilometers from
the city, is a critical transport facility. Although it experienced substantial damage during the conflict, it previously handled 22,700 passengers (2019 data). Equipped with a runway capable of receiving aircraft with landing weights of up to 220 tonnes, the runway stretches 2,555 meters long and spans 44 meters wide.
The airport holds immense revitalization potential, contributing to regional and international connectivity.
The Mykolaiv Railway Network encompasses 214.9 kilometers of freight routes and 120 kilometers of combined freight and passenger tracks. Though mostly disused, eight stations within the city underscore the extensive railway network's capacity. This sustainable mode of transport possesses significant potential for reducing the road congestion related to port activities if its capacity is augmented. Furthermore, isochrone analysis revealed that 6% of employees and 4% of the residents can reach the stations within a 15-minute walking distance, offering an efficient and accessible transport option within Mykolaiv.
Mykolaiv port
Port waters' total area: 323 ha.
Port land total area: 69,3 ha.
Daily loading/ discharging capacity: Up to 30 (MT, in thousands) 76 kilometres from the
Specialized in grain, cement, woods, oil products, metal and containers
Before the war, the ports primarily focused on food processing and transportation. Mykolaiv was known for hosting Ukraine's largest wheat processing enterprise. However, currently, the ports are largely inactive due to nearby river ports being under occupation. While passenger transport has yet to be established, there are plans underway to implement it.
The train stations shown on the map are based on OpenStreetMap data
The operational stations are Mykolaiv Station and Vantazhnyi Station. The rest are disused or freight stations.
Walking distances from train stops
Mykolaiv Vantazhnyi Station
Isochrone analysis (5-10 mins) - Employees
The train stations shown on the map are based on OpenStreetMap data
OpenStreetMap.
The operational stations are Mykolaiv Station and Vantazhnyi Station. The rest are disused or freight stations.
6% of the employees are within a 15-minute walking distance from the train stations
Mykolaiv Vantazhnyi Station
Enhancing Urban Planning in the city of Mykolaiv: Concept
City mobility patterns
Mykolaiv's mobility patterns and behaviours, derived from the Sustainable Urban Mobility Plan, provide valuable insights into the city's transportation landscape.
On average, residents make approximately 1.83 daily trips, equivalent to 2 daily trips per person. A gender-based analysis reveals that men favor individual transport options, such as cars, constituting 24% of their mode choice. Mykolaiv's motorization rate is relatively high, with 185 cars for every 1,000 adult residents. In contrast, women are more inclined to travel on foot, surpassing men by 15%. However, they exhibit greater reluctance to use bicycles for city commuting.
The city hosts 80 bicycles for every 1,000 residents aged 14 and over; approximately 26% of the population holds a driver's license. The relatively low car usage can be attributed to the city's shorter travel distances.
Public transport plays a pivotal role in Mykolaiv's mobility landscape, commanding a significant share of 44.7% of all trips—almost three times higher than private cars, which account for 15.3%.
Walking is the second most preferred mode of transportation, comprising 38.1% of all movements, while cycling constitutes a smaller portion at 1.1%.
Looking to the future, Mykolaiv envisions a shift in its modal share, with a targeted 41.2% of movements facilitated by public transport, 15% by private cars, 32.7% by walking, and 11.1% by cycling.
The subsequent section of the report delves into an in-depth analysis of Mykolaiv's road transport network infrastructure. The hierarchy of Mykolaiv's road transport network reveals the following distribution within the city borders: 23.6 km of international streets, 19.7 km of national streets, 76.5 km of local streets, 746.7 km of residential streets, and 1,757.1 km of other streets. Notably, most roads, accounting for 91.4%, consist of single-lane configurations.
Drawing from the indicators extracted from the traffic model provided by the Municipality of Mykolaiv, approximately 49.1% of journeys are undertaken via public transport, reflecting the city's reliance on this mode for mobility. Private cars account for 9.7% of the modal share, while walking plays a significant role, constituting 40.2%. Additionally, cycling, though representing a smaller portion, contributes 1% to the overall modal share. For freight transport, light vehicles, with a load capacity of less than 2 tons, dominate the freight landscape, constituting 69.2% of the total. Medium-sized vehicles, capable of carrying up to 8 tons, account for 13.7% of the freight transport share. Lastly, heavy vehicles, with a load capacity exceeding 8 tons, represent 17.1% of the city's freight transport activities. These modal share and freight transport statistics offer valuable insights into Mykolaiv's transportation dynamics, highlighting the prominence of public transport, private car usage, and the significant role of walking.
City mobility patterns | Traffic model (2018)*
City mobility patterns | Sustainable Urban Mobility Plan (2019)
The number of daily trips per residents is 1.83 (2 trips a day)
Pre-conflict
City's motorization rate: 185 cars for every 1,000 adult residents
Men are more likely to use individual transport such as car (24%)
Women are more likely to travel on foot (15% more than men)
Women are more afraid to move by bicycle in the city
80 bicycles for every 1,000 inhabitants aged 14 and over
The rather low rate of car use is due to the relatively short distances of part of the movements
Road network
Дорожня мережа
Enhancing Urban Planning in the city of Mykolaiv:
Road network Дорожня мережа
This chapter extends into a spatial analysis of various road typologies derived from the road network hierarchy. It is worth acknowledging that the research for this analysis primarily relied on Google Street View images from pre-conflict situations and were occasionally outdated due to constraints that hindered on-site visits while drafting the report. Consequently, while the insights provided are comprehensive, it's essential to recognize that they may represent only some of the current details. It's important to underline that the pros and cons discussed here pertain to typical street typologies and serve as general observations rather than specific strategies for particular areas. These insights provide a comprehensive overview of the road network in Mykolaiv and offer valuable considerations for mobility strategies that will be proposed in the future. The chapter systematically explores the characteristics and spatial organization of different road typologies within Mykolaiv. Notably, the analysis encompasses international roads, which exhibit notable features such as expansive green spaces and sufficient vehicular lanes, offering opportunities for redesign to accommodate micro-mobility and cycling lanes. However, certain drawbacks are associated with international roads, including the wide lanes that facilitate high-speed traffic, a lack of active ground-level amenities to encourage walking and cycling, the absence of dedicated cycling infrastructure, limited drop-off areas, and safety concerns for pedestrians and cyclists. Furthermore, there are noticeable issues regarding the maintenance of pedestrian infrastructure in these areas.
National roads situated within the central areas of Mykolaiv exhibit notable characteristics. They typically feature ample vehicular lanes, presenting opportunities for potential redesign to incorporate micro-mobility lanes. Moreover, these roads are adorned with wide green spaces that serve as protective buffers for pedestrians. However, the downside lies in the wide lanes that can facilitate high-speed traffic. Additionally, these roads often lack an active ground-level atmosphere that encourages walking and cycling. The absence of dedicated cycling infrastructure, onstreet parking, and drop-off areas further adds to the challenges. In contrast, national roads located in the suburban regions of
Mykolaiv also boast ample vehicular lanes, offering prospects for road redesign to include cycling and micro-mobility lanes. Nevertheless, these roads have their drawbacks. They frequently suffer from a deficiency in pedestrian infrastructure and require pavement maintenance. The broad lanes on suburban national roads may inadvertently promote high-speed driving.
As for local roads within the central areas of Mykolaiv, they provide wide green buffers that enhance pedestrian safety. Additionally, they feature generous sidewalk spaces, allowing for potential road redesign to accommodate cycling lanes. However, these roads often need more pedestrian infrastructure, inactive groundlevel spaces, and no dedicated cycling infrastructure. Conversely, local roads in Mykolaiv's suburban areas benefit from ample green spaces along the road's edges, which can facilitate road redesign to include cycling lanes. Nevertheless, these roads commonly grapple with issues such as insufficient pedestrian infrastructure and a need for dedicated cycling infrastructure.
In analyzing residential roads within the central areas of Mykolaiv, it becomes evident that they are equipped with wide green buffers that prioritize pedestrian safety. However, these roads face challenges such as an inactive ground-level atmosphere that discourages walking and cycling, a lack of dedicated cycling infrastructure, and limited drop-off areas.
In the suburban zones of Mykolaiv, residential roads are characterized by low traffic, allowing for shared spaces accommodating both vehicular traffic and active modes of transport. Nevertheless, these roads encounter challenges, including an absence of clearly defined pedestrian infrastructure, the need for road pavement and construction works, and active ground-level spaces encouraging walking and cycling.
The comprehensive analysis of Mykolaiv's road network underscores various opportunities and challenges, highlighting the importance of urban planning and development to enhance the city's overall transportation infrastructure. Furthermore, Central Avenue, one of the city's major thoroughfares, undergoes an exhaustive study. The avenue has
several advantages, including an expansive central green median that offers promising prospects for road redesigns, facilitating the incorporation of cycling and micro-mobility lanes. Central Avenue is well-suited for creating active ground-level spaces to enhance the urban environment, given its central location within the city. However, specific challenges and limitations have been identified in the analysis. While the avenue's central greenery presents opportunities, it requires the development of a more active ground floor to encourage walking and cycling effectively. Central Avenue currently lacks dedicated cycling infrastructure, posing challenges for cyclists. Currently, Central Avenue experiences significant traffic congestion, primarily due to the presence of heavy trucks. Concerns regarding pedestrian and cyclist safety persist, and traffic congestion often occurs after working hours due to insufficient links between the city's micro-districts, particularly Tsentralny-Zavodsky.
The average distance between pedestrian crossings on Central Avenue is approximately 216 meters, and between public transport stops on Central Avenue is approximately 373 meters. These insights shed light on the intricacies of Central Avenue's urban dynamics to optimize the avenue's functionality and safety when proposing future mobility strategies.
Furthermore, an analysis of road traffic accident data has been conducted, relying on surveys and information provided by the municipality. The key findings and main takeaways from this analysis are presented within the Road Accidents and Traffic Safety sections of the report.
Drawing from the comprehensive analysis of Mykolaiv's road transport network as previously outlined, the challenges and opportunities within the sector are identified and presented below. Mykolaiv faces several significant challenges in its road transport system, including the absence of bypass roads to divert freight traffic away from the congested city center, particularly concerning the international highway M14.
Additionally, the city contends with the suboptimal condition of four bridges, many fatal traffic incidents, and wide lanes that encourage excessive speeding. There are currently no traffic-
limited zones or speed limits within the city, further exacerbating safety concerns. Furthermore, Mykolaiv lacks dedicated cycling infrastructure and active ground floors in most areas to promote active mobility.
However, amidst these challenges lie promising opportunities for road transport in Mykolaiv. The city is not car oriented, with private cars accounting for only 15% of the city's modal share. Moreover, Mykolaiv's strategic location in the southern Ukrainian road network positions it as a vital transportation hub with untapped potential. To unlock this potential and enhance transportation and overall urban life, the city can construct additional bridges and establish bypass highways beyond its limits. The width of specific traffic lanes also allows for road redesign, creating safe spaces for pedestrians and cyclists.
To optimize traffic flow and safety further, Mykolaiv can introduce 20-30 km/h zones, offering a balanced approach to speed regulation. The generous width of specific traffic lanes could facilitate the definition of transit corridors with dedicated lanes for public transport, strengthening efficiency and reliability of public transport. Additionally, to boost traffic efficiency, the city should prioritize reconstructing and repairing existing roads, accompanied by new construction, where necessary. Lastly, increasing the number of pedestrian crossings will substantially improve traffic safety conditions throughout the city. These measures, when implemented, can help Mykolaiv overcome its road transport challenges while harnessing the potential for a more sustainable and efficient urban transportation system.
Road network Дорожня мережа
Number of lanes
Кількість смуг руху
91.4% is the amount of km of roads with a single lane
The map provides crucial data on the number of lanes on roads in Mykolaiv, forming a cornerstone for a comprehensive analysis encompassing road capacity, safety, public transit, active transportation, and land use. This information is the foundation for devising effective strategies to enhance overall mobility and transportation systems. The significance of the number of lanes lies in its direct impact on road and transportation system capacity. Furthermore, it holds implications for road safety, as insufficient lane capacity can result in unsafe conditions such as overcrowding, lane weaving, and challenging merging situations. This understanding of lane quantity is pivotal for planning public transport infrastructure and ensuring efficient and reliable services. Additionally, the number of lanes plays a crucial role in shaping the design of sidewalks, bike lanes, and pedestrian crossings. It also influences land use and urban development patterns, determining the accessibility and appeal of different areas for businesses, residents, and stakeholders.
TSENTRAL'NYI DISTRICT
ZAVODS'KYI DISTRICT INHULSKYI DISTRICT
Number of lanes in each road section/
KORABEL'NYI DISTRICT
International roads
Міжнародні дороги
International roads Міжнародні
National roads - center
- Velika Morska St. / Center
Wide green spaces which protect pedestrians
Ample vehicular lanes allow for redesigning the road to micro-mobility lanes
Velika Morska St.
National roads - suburbs
Ample vehicular lanes allow for redesigning the road to include cycling and micro-mobility lanes National - H11 / Suburbs
Local roads - center
Pushkinskaya St.
Local roads - suburbs
Local roads: Передмістя
Residential roads - center
Shevchenka St.
Residential roads - suburbs
Klubna St.
Central avenue
Central avenue Центральний проспект
Located in the city centre as suggested by its name, Central Avenue has been selected as a representative example and a primary thoroughfare connecting the east and west sides of the city. This choice serves as a focal point for a detailed examination of road sections, public transport infrastructure, and pedestrian facilities.
Based on the information from the municipality of Mykolaiv, there are safety concerns for pedestrians on Central Avenue. The analysis encompasses the evaluation of average distances between pedestrian crossings and public transport stops, recognizing the pivotal role these metrics play in the accessibility of transportation services. Shorter distances facilitate convenient and efficient travel experiences for pedestrians accessing public transportation. Thoughtfully positioned crossings mitigate the risk of pedestrians crossing roads at unsafe points, contributing to the overall safety of both pedestrians and drivers. Additionally, these considerations enhance the area's walkability, creating more appealing and sustainable urban spaces. Ensuring an appropriate distance between stops and crossing points fosters walkability and guarantees that individuals can easily access public transportation, regardless of their mobility abilities. This commitment to accessibility and safety aligns with the broader goal of creating a more inclusive and equitable urban environment.
Central Avenue
Despite the numerous crossing points and junctions along Central Avenue, data indicates a high frequency of road accidents, necessitating the implementation of additional safety measures along the entire stretch of road. Implementing a dedicated transit lane across the road can guarantee a vibrant, multimodal corridor in the city center. The extensive central median could be repurposed to accommodate safe cycling, micro-mobility, and serve as a linear urban public park.
Road accidents
Official reasons for road accidents in Mykolaiv for 2015-2017
Official reasons for road accidents in Mykolaiv for 2015-2017
Length of pedestrian crossings in 108
Violation of maneuvering rules
Failure to maintain distance
Violation of the traffic rules of the intersection
Exceeding safe speed
Others
Traffic safety
Road network summary
MAIN CHALLENGES
• Lack of bypass roads to divert freight traffic from the city center (international highway M14)
• 4 bridges in unsatisfactory conditions
• High number of fatal traffic accidents
• Excessive width of lanes allow excessive high speed
• No traffic limited zones or speed limits within the city
• Lack of cycling infrastructure
• Lack of active ground floor in most parts of the city to encourage the use of active mobility
MAIN OPPORTUNITIES
• Mykolaiv is not a car-oriented city (only 15% of city modal share is by private car)
• Mykolaiv has a strategic location in the road network of southern Ukraine
• Possibility to build additional bridges and bypass highway outside the city limits
• In some cases, wide traffic lanes allow for road redesign in favour of safe spaces for pedestrian and cyclists
• In some cases, wide traffic lanes allow for defining transit corridors with dedicated lanes for public transport to improve efficiency and reliability of public transport
MAIN STRATEGIC ACTIONS TO BE IMPLEMENTED
• Consider building an additional bridge and a bypass road to deviate freight vehicle traffic from the city center
• Implement dedicated micro-mobility and public transport lanes within existing right of ways
• Create 20-30 km/h zones
• Increase traffic efficiency by redesigning and repairing existing roads and implementing new construction
• Implement road safety measures, including increasing the number of pedestrian crossings, to improve traffic safety conditions in the city
Public transport network
Enhancing Urban Planning in the city of Mykolaiv:
Public transport network
The public transport network in Mykolaiv comprises tram, trolleybus, bus, and marshrutka services, collectively contributing to 45% of the current Modal Share of the city. Based on information and plans provided by the municipality, there are proposals to introduce 17 new routes spanning buses, trams, and trolleybuses to enhance the city's public transportation system.
Several areas within Mykolaiv currently face challenges related to public transport accessibility. Residential areas are underserved by public transport, limiting the mobility options available to residents. Similarly, industrial areas, where many employees depend on public transportation, also experience service gaps. Notably, the city's west side predominantly relies on marshrutkas (small size shuttlebus) as the primary mode of public transport, highlighting a need for diversification and expansion of transport options in this region.
In contrast, the central parts of the city enjoy accessibility through a multitude of overlapping public transport modes and routes, fostering convenient mobility within the urban core. However, suburban areas are currently underserved, with limited public transport routes and modes available. Addressing these disparities presents opportunities for Mykolaiv to enhance the inclusivity and efficiency of its public transport network.
The study proceeds to furnish comprehensive data on the Mykolaiv public transport system. It encompasses essential metrics such as the total number of routes, average operational speeds, the overall length of the network, and the average distance between stops for each mode of public transport.
Furthermore, detailed information is meticulously presented for each route for tram and trolleybus. This information includes route lengths, the number of rolling stock, service frequencies, and operational speeds, offering a granular view of the intricacies of Mykolaiv's public transportation network.
In addition to route-specific data, a thorough examination of the infrastructure and rolling stock for each mode of public transport is conducted. This analysis is grounded in desk-based research, which utilizes resources such as Google Street View to provide insights into the condition and characteristics of the transportation infrastructure and vehicles.
Isochrone analysis in transportation involves visualising and analysing travel time or distance from a specific location to surrounding areas. It helps understand accessibility patterns and identify areas with high or low connectivity. This analysis is crucial for urban planning, transportation infrastructure development, and service provision. Isochrone maps depict areas reachable within the same time or distance threshold from a given origin point, considering factors like road networks, public transit routes, travel speeds, and transportation mode choices. In this case 5 minute walking distance from a transport stop.
Isochrone's analysis sheds light on the accessibility of public transport within Mykolaiv. The findings reveal that:
• Approximately 17% of the city's residents are conveniently situated within a 5-minute walking distance from tram stops, facilitating their access to this mode of transport. Similarly, 24% of employees enjoy such accessibility.
• For trolleybus stops, roughly 17% of residents and 22% of employees are within a convenient 5-minute walking radius.
• Bus stops also provide accessible options, with 22% of residents and 27% of employees located within a 5-minute walking distance.
• Marshrutka stops are particularly accessible, with 49% of residents and 59% of employees residing within a convenient 5-minute walking distance.
When considering the overall public transport network, which encompasses Tram, Trolleybus, Bus, and Marshrutka services,
the analysis reveals that 50.3% of the population has access to at least one mode of public transport within a 5-minute walking distance. Conversely, 49.7% of the population lacks such accessibility. For employees, the analysis shows that 61.5% have access to at least one mode of public transport within a 5-minute walking distance, while 38.5% do not enjoy such accessibility. These isochrone findings offer critical insights into the distribution of public transport access within Mykolaiv, highlighting areas of convenience and potential gaps that can inform future strategies for enhancements.
The report also encompasses the planned water transport infrastructure, catering to passenger and freight transport needs. As outlined in the plans and information provided by the municipality, this strategic development is designed to enhance connectivity and accessibility in Mykolaiv.
Building upon the comprehensive analysis of Mykolaiv's public transport network, the following challenges and opportunities within the sector were identified:
Mykolaiv's public transport network faces several challenges that need attention and improvement. These challenges include limited coverage of tram and trolleybus services, predominantly concentrated in the city center, leaving outlying areas underserved. Additionally, there are few connections between districts, hindering seamless citywide mobility. One significant issue is the existence of numerous overlapping routes, especially among bus and marshrutka services, resulting in redundancy and inefficiency. The absence of dedicated lanes for public transport negatively impacts service efficiency and reliability.
Furthermore, the infrastructure, rolling stock, and vehicles are in poor condition, affecting overall service quality. Both trolleybuses and trams suffer from low operating speeds and infrequent service, diminishing their attractiveness to passengers. The
existing infrastructure also lacks adaptations for individuals with reduced mobility, posing accessibility challenges. Lastly, the absence of an integrated ticketing system complicates passenger fare payments.
Despite these challenges, there are significant opportunities for improvement in Mykolaiv's public transport network. Notably, public transport already accounts for 44.7% of movements in the city, indicating a solid foundation for further growth.
Proposed enhancements in Municipality plans, such as route optimizations and introducing electric transport solutions, align with the city's long-term plans and can address some of the existing challenges. Circular routes, proposed in Municipality plans to improve district-level accessibility, are a step in the right direction.
Additionally, the municipality's initiatives for mass rapid transit corridors hold promise for enhancing network efficiency and reliability. Plans to implement a passenger-focused water transport network demonstrate a commitment to diverse and integrated mobility solutions. The development of a user-friendly fare payment system is set to enhance passenger convenience while establishing transport hubs that will facilitate efficient multi-modal connections. The city's navigable waterways offer a unique opportunity to integrate a new public transport system. On-demand services for areas with lower transportation demand can optimize resources.
Finally, embracing guiding principles to create a unified platform for public transport and mass-sharing mobility, focusing on mobility as a service, can lead to a more seamless and usercentric transportation experience for Mykolaiv's residents and visitors.
Public transport network Мережа
TSENTRAL'NYI DISTRICT
ZAVODS'KYI DISTRICT INHULSKYI DISTRICT
KORABEL'NYI DISTRICT
Mykolaiv Vantazhnyi Station
Public transport network density
TSENTRAL'NYI DISTRICT
ZAVODS'KYI DISTRICT INHULSKYI DISTRICT
KORABEL'NYI DISTRICT
TSENTRAL'NYI
Tram infrastructure
Trolleybuses Тролейбуси
TSENTRAL'NYI DISTRICT
ZAVODS'KYI DISTRICT INHULSKYI DISTRICT
KORABEL'NYI DISTRICT Mykolaiv Vantazhnyi Station
extracted making an approximation observing the deployment of lines and stops in the territory;
Trolleybus infrastructure
Buses Автобуси
TSENTRAL'NYI DISTRICT ZAVODS'KYI DISTRICT INHULSKYI DISTRICT
KORABEL'NYI DISTRICT Mykolaiv Vantazhnyi Station
Buses infrastructure Автобусна інфраструктура
Shuttles - Marshrutka
Marshrutka infrastructure
Isochrone trolleybus (5
Isochrone
(5
Isochrone marshrutka (5 min) - residents
Isochrone
Isochrone trolleybus (5 min) - employees
Isochrone
Isochrone marshrutka (5 min)
27% of the employees are within a 5 min walking distance from stops
Isochrone all modes of Public Transport - 5 min
RESIDENTS/
TSENTRAL'NYI DISTRICT
50.3% of population has access to
ZAVODS'KYI DISTRICT INHULSKYI DISTRICT
49.7%
KORABEL'NYI DISTRICT
EMPLOYEES/
TSENTRAL'NYI DISTRICT
61.5% of employees has access to at least one mode of public transport service (Tram, Trolley Bus, Bus, Marshrutka) within 5 minutes of walking distance
ZAVODS'KYI DISTRICT INHULSKYI DISTRICT
38.5% of employees has access to no mode of public transport service (Tram, Trolley Bus, Bus, Marshrukta) within 5 minutes
KORABEL'NYI DISTRICT
Planned water transport
Planned water transport for both passenger and freight
The depicted map illustrates Mykolaiv's local authorities' proposed water transport plan for passengers and freight. Leveraging Mykolaiv's abundant water resources as a significant transportation asset, integrating water transport into the broader mobility plan offers an alternative and potentially more efficient mode of transportation. This reduces reliance on congested road networks and contributes to the development of a resilient and adaptable mobility infrastructure. The inclusion of water transport not only diversifies transportation options but also adds to the appeal of Mykolaiv for residents and tourists alike. Enhancing water transport capacity for freight and passengers holds promising economic implications, stimulating trade, supporting water-dependent industries, and fostering overall economic development by optimizing the movement of goods and people. This analysis aims to identify opportunities to enhance and diversify mobility solutions in Mykolaiv, especially by incorporating water transport. As the project progresses, in the upcoming project phases, specific mobility strategies will be identified and proposed.
TSENTRAL'NYI DISTRICT
ZAVODS'KYI DISTRICT
INHULSKYI DISTRICT
KORABEL'NYI DISTRICT
MALA KORENYKHA
Public Transport network summary
MAIN CHALLENGES
• Limited coverage of tram and trolleybuses (only in the city center)
• Few connections between districts
• Significant number of routes that duplicate each other especially for bus and marshrutka
• No dedicated lanes for public transport which negatively affects the service efficiency and reliability
• Poor condition of infrastructure, rolling stock and vehicles
• Low route speed of trolleybuses and trams
• Low frequency of public transport
• The infrastructure is not suitable to the transportation of groups with reduced mobility
• Lack of integrated ticketing system
MAIN OPPORTUNITIES
• The share of movements by public transport is 44.7%
• 2019 Plan already envisaged optimisation of routes and means of transport
• Ample possibility to implement water transport network for passengers
• Possiiblity of implementing mass rapid transit corridors
MAIN STRATEGIC ACTIONS
• Activation of navigable waterways as a new mean of public transport
• Creation of a fare payment system convenient for passengers
• Introducing transport hubs to ensure efficient multi-modal connections
• Providing on demand service for low demand areas
• Establishing guiding principles to implement a unique platform for public transport and mass sharing mobility: mobility as a service
Car parking
Car parking: introduction Автомобільні
The parking analysis in Mykolaiv is primarily conducted through desk-based research methods, utilizing tools such as Google Maps and Google Street View. Presently, Mykolaiv faces several parking-related challenges that impact urban mobility and infrastructure. Such challenges include:
• Absence of a Paid Parking System: Mykolaiv currently lacks a structured parking payment system, leading to revenue collection and parking space management issues.
• Informal Parking: The city predominantly relies on informal parking areas, with minimal or no markings and signs to regulate these spaces. This results in a chaotic parking scenario, where vehicles unsystematically occupy streets, sidewalks, and pockets.
• Parking Pockets: The presence of parking pockets disrupts the continuity of sidewalks, affecting pedestrian mobility and overall urban aesthetics.
In response to these challenges, the municipality of Mykolaiv has outlined several planned parking policies to improve the city's parking landscape. These include creating a comprehensive parking management system and developing a parking space management policy. Additionally, the municipality intends to introduce the concept of paid parking zones, focusing on implementing a paid parking zone in the city center.
Opportunities identified for parking in Mykolaiv include:
• Implementation of a Parking System: The municipality's planned implementation of a parking system presents an opportunity to streamline parking operations, introduce payment mechanisms, and enhance overall management.
• Paid Parking Zone in the City Center: The proposed paid parking zone in the city center promises to bring order to the chaotic parking situation and contribute to the efficient use of parking spaces.
• Integration with Public Transport: There is potential to integrate parking solutions with public transport initiatives. Mykolaiv can encourage a modal shift from private cars to public transportation by introducing paid parking options at key mobility hubs and nodes.
• Park and Ride Systems: The possibility of implementing park and ride systems near major mobility hubs and nodes can further support and incentivize the transition from personal vehicles to public transport.
In conclusion, Mykolaiv's parking landscape can be transformed with planned policies that address existing challenges and capitalize on opportunities. These initiatives have the potential to enhance urban mobility, promote efficient parking space utilization, and contribute to the overall quality of life for residents and visitors alike.
Car parking: typologies Автомобільні
Sidewalk
Enhancing Urban Planning in the city of Mykolaiv: Concept Masterplan
Future parking policies
No paid parking No formal parking - no markings and signs that regulate it
Creation of a parking management system in the city
Responsible for the development and implementation of a parking space management policy
Chaotic parking - On the street, sidewalks, pockets
Parking pockets which interrupt the continuity of the sidewalks
Enforcing the concept of parking space
Creation of a paid parking zone in the city center
Parking summary
MAIN CHALLENGES
• No paid parking system
• Irregular parking (no markings and signs)
• Chaotic parking: Most of the parking is handled on-street (sidewalks, roadway and pockets)
• Informal parking deteriorates the public realm
MAIN OPPORTUNITIES
• Planned implementation of a parking system by the municipality
• Planned paid parking zone in the city center by the municipality
• Integrate parking solutions with public transport (paid parking)
• Possibility of proposing park and ride systems close to the main mobility hubs and nodes to sustain and encourage the modal shift from car to public transport
Further transport solutions
Further transport solutions
This chapter identifies opportunities for enhancing mobility and logistics in Mykolaiv.
The availability of any existing shared, innovative, and sustainable mobility strategy / service in the city has been thoroughly analysed. At present, the only available solutions are as follows:
• Electric Vehicles (EVs): The availability of public charging stations within Mykolaiv was investigated, as these facilities are essential for supporting the use of electric vehicles and reducing environmental impact.
• Sustainable Urban Logistics: An analysis of innovative urban logistics and last-mile delivery solutions for Mykolaiv was carried out. These solutions include robot sorting centers, parcel locker systems, and pick-up points. These initiatives aim to streamline urban deliveries and minimise congestion and environmental effects.
Further potential solutions are not locally available, although they have been implemented elsewhere in the country. These include:
• Shared Mobility Solutions: bike-sharing, scooter-sharing, and car-sharing initiatives, focusing on promoting eco-friendly urban mobility;
• Ride-hailing services and mobility apps, which contribute to convenient transportation alternatives.
The future implementation of these strategies in Mykolaiv would support the city transition towards a more comprehensive and sustainable transport system, while promoting sustainability and innovation.
Bike-Scooter-Car sharing in Ukraine
Ride Hailing
EV Charging stations
Urban logistics Міська логістика
Poshta
Pedestrian environment
Pedestrian areas
This study analyzes pedestrian infrastructure and spatial organization in Mykolaiv's city center and suburbs.
The pedestrianized Soborna Street has been taken as a valuable example in terms of right of way design and impact on urban mobility.
The main identified challenges regarding pedestrians are as follows:
• Maintenance and Quality Issues: The pedestrian infrastructure in Mykolaiv suffers from inadequate maintenance and low quality, particularly at intersections and sidewalks.
• Shared Spaces with Vehicles: Suburban areas witness the coexistence of pedestrians and vehicular traffic without speed limits and traffic signage.
• Sidewalk Interruptions: Building entrances frequently disrupt sidewalks, hindering the seamless flow of pedestrian movement.
• Road Accidents at Crossing Points: Crossing points within the city experience a high frequency of road accidents, posing risks to pedestrians.
Opportunities to Enhance Pedestrian Infrastructure include:
• Promoting Walking: Walking already represents Mykolaiv's second most popular mode of transport, accounting for 38.1% of the modal share. This could be further increased.
• Road Safety Initiatives: The city intends to implement road safety programs to enhance pedestrian safety.
• Soft Mobility Network: A well-connected network of residential and local roads creates opportunities for introducing a soft mobility network, promoting active transportation.
• Proximity City Vision: The city is poised to implement a proximity city vision, encouraging residents to access daily necessities within proximity and reducing the need for vehicular travel.
• Flexible Public Spaces: Mykolaiv offers the potential to develop flexible and adaptable public spaces that cater to the diverse needs of residents and visitors.
In conclusion by addressing these challenges and capitalizing on the outlined opportunities, the city can enhance its urban mobility, promote pedestrian safety, and create more vibrant and accessible public spaces.
Public realm
TSENTRAL'NYI
ZAVODS'KYI DISTRICT INHULSKYI DISTRICT
KORABEL'NYI DISTRICT
Skhody
Tourist attractions
TSENTRAL'NYI DISTRICT
ZAVODS'KYI DISTRICT INHULSKYI DISTRICT
KORABEL'NYI DISTRICT
Education institutions
TSENTRAL'NYI DISTRICT
ZAVODS'KYI DISTRICT INHULSKYI DISTRICT
KORABEL'NYI DISTRICT
Pedestrian infrastructure - center Пішохідна
Wide sidewalks
No pedestrian crossings
Narrow and bad quality sidewalks
Soborna Street (pedestrian street)
Pedestrian infrastructure - suburbs
Existing pedestrian area - Soborna street
Soborna Street
Soborna Street
Soborna Street
Soborna Street
Pedestrian areas summary
MAIN CHALLENGES
• Lack of maintenance and low quality of pedestrian infrastructure: intersections, sidewalks, etc.
• Shared spaces with vehicular traffic especially in the suburb areas without speed limits and traffic signs
• Sidewalks are interrupted by building entrances
• Frequent road accidents on the crossing points
MAIN OPPORTUNITIES
• Walking is the second mode of transport in modal share of Mykolaiv and accounts for 38.1%
• City intentions to implement road safety programs to increase safety for pedestrians
• Presence of a consolidate network of residential/local roads which offers great potential for the introduction of a soft mobility network and active frontage
MAIN STRATEGIC ACTIONS TO BE IMPLEMENTED
• Implementation of a proximity city vision
• Promotion of flexible and adaptable public spaces
Cycling network
Cycling network
In Mykolaiv, cycling infrastructure has been notably absent, lacking dedicated bike lanes, public bike parking facilities, and a bikesharing network. However, there's a promising plan on the horizon, proposed by the Mobility Department of the municipality but yet to be approved. This ambitious plan envisions a comprehensive cycling network for the city, encompassing 99.9 km of recreational lines, 95.9 km of secondary lines, and 96.6 km of trunk lines. This vision is particularly important, considering that the current modal share data indicates that only 1% of inhabitants utilize bicycles as their mode of transport.
To better understand the cycling landscape, desk-based research revealed that most cyclists currently share vehicular lanes with other traffic, posing significant safety concerns for riders. Challenges Identified for Mykolaiv's Cycling Network include :
• Lack of Cycling Infrastructure: Currently, the city lacks dedicated cycling infrastructure, forcing cyclists to navigate vehicular and pedestrian routes.
• Low Bicycle Ownership: Mykolaiv reports a low bicycle ownership rate, with only 80 bicycles available for every 1,000 residents aged 14 and above.
• Absence of Bike-Sharing Options: A bike-sharing system is conspicuously absent, limiting access to bicycles.
• Inadequate Bike Parking: There is a shortage of bike parking facilities, particularly along main streets and close to key points of interest in the city.
Opportunities to Foster Cycling in Mykolaiv include:
• Planned Cycling Network: The proposed cycling network by the city, although pending approval, aims to connect different districts and boost cycling infrastructure.
• Recreational Cycling Routes: Another pending plan involves recreational cycling routes that could enhance cycling opportunities.
• Increasing Cycling Share: Municipality studies suggest that the planned network could significantly increase the cycling share from 1.1% to 11%.
• Strategic Bike Parking: Strategically arranging bicycle parking spaces near major points of interest, including universities, educational centers, and commercial hubs.
• Leveraging Road Infrastructure: The city's wide road infrastructure provides an opportunity to redesign roads to accommodate cycling lanes.
• Micro-mobility Sharing Services: Introducing micro-mobility sharing services can further promote bicycle usage.
• Integration with Public Transport: Integrating the bike network with public transport hubs through bike-and-ride systems.
• Cost-Efficient Solution: Cycling offers an efficient and cost-effective solution that can be implemented during and after challenging periods, such as conflict time.
By addressing these challenges and capitalizing on the outlined opportunities, Mykolaiv can pave the way for a more bike-friendly and sustainable urban environment, encouraging residents and visitors to embrace cycling as a viable mode of transportation.
Planned cycling network
(*) The planned network is extracted from the Mobility Development Plan which is yet to be approved.
Cycling conditions Стан мережі
E58
Cycling network summary
MAIN CHALLENGES
• There is no cycling infrastructure in the city, the cyclists use vehicular and pedestrian infrastructure
• Low bicycle ownership, 80 for every 1000 inhabitant aged 14 and above
• Lack of bicycle sharing options
• Lack of bike parking in the main street and close to the main points of interests in the city
MAIN OPPORTUNITIES
• Planned cycling network by the city which connects all the different districts however it is still pending approval
• Planned recreational cycling routes by the city however it is still pending approval
• The planned network could increase the share of cycling from 1.1% to 11% according to the municipality studies
• Wide road infrastructure allows for road redesign to accommodate cycling lanes
• Cycling is an efficient and low cost solution that can be implemented during the war and immediately after the conflict
• Arrangement of bicycle parking spaces near main points of interests (including universities, eduction centers, commercial centers and more)
• Provide micromobility sharing services to promote the use of bycicle
• Integrate bike network with public transport hubs (bike & ride systems)
• Ensure safety strategies
Mykolaiv as a research case study: Accessibility Assessment
Enhancing Urban Planning in the city of Mykolaiv:
Accessibility by proximity in Mykolaiv
Re-thinking Mykolaiv as an inclusive, resilient, and sustainable city involves building scenarios for a city of proximity (the so-called Xmin city), envisaging the implementation of integrated urban and transport planning policies devoted to:
• promoting active mobility through the improvement of cycle-pedestrian connections, the material quality of the streets, and the conviviality of public spaces, also considering the needs of groups with specific mobility needs (e.g. impaired pedestrians);
• strengthening public transport networks, sharing systems, and intermodality to encourage sustainable travel at the urban scale;
• redistributing services of daily relevance (e.g., schools, shops) to make them available at the neighborhood scale to counter existing inequalities in the access to services and opportunities and promote the socio-economic development of local communities.
These three strategies, inspired by the concept of accessibility by proximity, if appropriately integrated and translated into effective urban policies, can contribute to make a city more inclusive, healthy, and environmentally sustainable. More inclusive because essential services and facilities are expected to be spatially distributed to be accessible at the neighbourhood scale; healthier because active mobility is supported and encouraged; more resilient because the integration of different transport modes, sharing mobility options, and the diffusion of info mobility platforms to optimize the organization of daily mobility travels make diversified mobility solutions available and attainable to citizens.
In 2019 the city of Mykolaiv drafted a SUMP (Sustainable Urban Mobility Plan) that proposes strategies consistent with the accessibility by proximity concept. In particular, the "Resident-friendly urban space" strategy envisages actions aimed at the creation of pedestrian streets, now mostly absent in the city; at improving students' homeschool routes through a school mobility plan; at increasing the usability of pedestrian pathways as barrier-free infrastructures and at the implementation of a well-connected cycle paths network. Furthermore, the "Effective public transport" strategy foresees several interventions to increase the attractiveness and efficiency of the local transport network, creating widespread interchange hubs to facilitate intermodality and improve the efficiency of the existing network. Therefore, the city has ambitious plans to address some relevant issues affecting urban and active mobility and the quality and accessibility of public spaces. Furthermore, it is essential to note that the dynamics highlighted by the SUMP show a modal split highly oriented to active mobility and public transport for daily displacements, connected to a relatively modest use of the car as a means of travel. This is an excellent starting point for implementing the actions proposed in the SUMP.
Portland, 20-minute neighbourhoods (City of Portland 2012)
Ajuntament de Barcelona (20132018) Supermanzanas
Paris, La ville du quart d'heure (Moreno, 2021)
(City of Portland 2012) Париж, La ville du quart d'heure (Moreno, 2021)
The city of proximity in several urban agendas/
Ajuntament de Barcelona (20132018) Supermanzanas
Melbourne, 20 minute neighbourhood (2019)
(2019)
Inclusive Accessibility by Proximity Index - IAPI
The Mykolaiv's SUMP's actions need to be updated and take into account the effects of the conflict. The latter requires careful consideration with regard to the spatial contexts and interventions that should be given priority for the reconstruction of a city that is planning to be increasingly accessible and sustainable. For this reason, the research group of the Politecnico di Milano proposed the implementation of IAPI - Inclusive Accessibility by Proximity Index, a parameter already tested in previous research (https:// www.ex-tra-project.eu/).
Developed in seven steps, IAPI is a GIS-based assessment tool that provides quantitative criteria to measure and visualise the level of accessibility to essential daily services by active modes. Compared to other accessibility assessment methodologies, IAPI uses high-detail spatial data, mostly from open sources such as Open Street Map, to simulate different access experiences based on the material and social conditions of streets and public spaces that influence the active mobility practices of three typical users: pedestrians, impaired pedestrians (e.g., disabled, elders) and cyclists. The application of IAPI allows:
• The evaluation of accessibility levels at the city-wide scale based on the existing conditions of the public space that favor/ disfavor walkability, cycling, and social interactions;
• The identification of disadvantaged areas of a neighborhood in terms of access to basic services and opportunities;
• The collection of evidence-based information to spatialize targeted interventions on public spaces, streets, and related to the distribution of welfare services, aimed at improving walkability, cycling, and proximity;
• The test of future transformative scenarios linked to the redesign of the urban landscape and the (re)distribution of service structures.
IAPI development steps (steps including citizens’involvment are highlighted in yellow)
IAPI indicators Індикатори IAPI
From a methodological point of view, IAPI is calculated through seven main steps, mainly automated in a GIS environment. The calculation considers a list of walkability and cyclability indicators whose relevance is recognized by the scientific literature. These are mapped on a digital road graph (network indicators) and a hexagonal grid overlapped onto the same graph (relational indicators). The former family of indicators describes the technical performances of the routes and the interaction with vehicular traffic, while the latter concerns the characteristics of the spaces surrounding streets and their social uses. Both families of indicators produce favorable or unfavorable effects on active mobility, with different intensities for the three profiles considered. In particular, the mapping of network indicators on each individual segment composing the road graph produces a ranking of all the city's streets based on their technical performance. The result is a map of walkability levels that can be useful in identifying the most critical and least walkable nodes of the pedestrian network. The effects of the selected indicators are also considered when the accessibility analysis is carried out through the computation of isochrones based on three distinct time thresholds (5, 10, and 15 minutes) to a selected set of service facilities considered essential for daily life. The relevance and positive or negative impact of each indicator located on each segment will generate an increase/decrease in the accessibility levels measured throughout isochrones as the catchment areas of each service facility. The final result is a highly detailed mapping where each hexagon takes on an accessibility value to all services or a selection of services (e.g., schools, healthcare facilities, etc.), providing a city-wide overview that simultaneously considers the availability of services and the quality of the road network that can support active travel to the same destinations.
Network indicators describe the technical performances and the level of interaction with car traffic. They can have an impact on walkability and cyclability that can be quantified in a speed variation.
Relational indicators describe the perceptions and quality of the space surrounding the network as the spatial and relational environment of proximity.
The contributions of IAPI for Mykolaiv
With regard to Mykolaiv, IAPI was implemented with three prevalent goals in mind. From an analytical perspective, IAPI can support a city-wide analysis to identify disadvantaged neighborhoods in Mykolaiv regarding access to basic services and poor walkability in pre-conflict and post-conflict scenarios based on the damages suffered by city services and road infrastructure. From a scenariobuilding perspective, IAPI can contribute to evaluating different sustainable and equitable actions to improve active mobility and the fair distribution of daily services. Finally, IAPI can also support prioritizing actions needed in the short, medium, and long term to improve district-scale service availability and active mobility while testing their effectiveness.
The application of IAPI required the adaptation of the standard list of indicators based on the availability of data and Mykolaiv's specific morphological and functional characteristics. For this reason, as shown in the table to the right, indicator 1.2 was not included due to the absence of cycle paths in the city, and indicator 1.6 was not calculated for the predominantly flat orography of the city. A new indicator was included signalling the presence of sidewalks along each street. Furthermore, indicators 3.2 and 3.3 were not included because their mapping requires the direct involvement of inhabitants and the collection of their perceptions through specially designed surveys, a task that was not viable at the first stage of the research.
Regarding data sources, the application in Mykolaiv involves a combination of data from OSM with data produced by the municipality of Mykolaiv and, in the case of population density, obtained through the GHS survey of population density produced by the European Commission, Joint Research Center (JRC).
As elaborated below, the quality and completeness of the data available to build the pre-conflict scenario do not appear equally reliable for all the indicators considered, and this would require careful verification of the results by comparing them with the actual observable conditions of the road network and public spaces. The calculation of the IAPI nevertheless proceeded with the idea that the databases can be progressively improved and expanded, consequently making the analysis more effective. Finally, it is essential to note that, in the case of Mykolaiv, IAPI was calculated only considering a standard pedestrian profile, first to evaluate the quality of walkability in the city and possibly carry out more in-depth analyses on the impaired mobility profile in the future.
IAPI as a
IAPI indicators adaptations for the application in Mykolaiv. Indicators in red were excluded, indicators in yellow are specifically developed for Mykolaiv
Social infrastructure mapping
The list of community facilities considered in the accessibility analysis follows that already tested in other cases of application of IAPI, adapted to the data available in the case of Mykolaiv. The list includes several categories of social infrastructure that can play an essential role in people's daily lives and that, as such, should be distributed equitably and easily accessible. In the Mykolaiv application, the community facilities were mapped using a combination of OSM data and data produced by the municipality.
Level of walkability along the network
The mapping of network indicators allows the assessment of the level of walkability along the network of Mykolaiv (Fig.4). The calculation is performed considering specific impedance factors associated with each network indicator. Impedance factors express to what degree the conditions described by the indicators insistent on each arc of the network have a low, medium, or high influence on walkability, both in positive and negative terms. For example, the presence of a wide sidewalk along the road will represent a positive factor, which barriers or impediments to pedestrians could counterbalance. In this experimentation, researchers established the impedance factors a priori based on a literature-based quantification. Still, it is possible to foresee a direct involvement of the local population in collecting their stated preferences and thus attribute greater weight to those indicators considered most relevant in influencing their active mobility choices.
As shown on the map, the city of Mykolaiv has a generally low level of walkability quality, mainly due to the existence of barriers (such as curbs at street corners), wide roads with difficult crossing and considerable interference with vehicular traffic, absence of sidewalks (especially in peripheral areas) and lack of traffic calming and pedestrianization solutions. The diagram to the right shows the distribution of segments by district, highlighting significant differences between the Tsentral'nyi and Zavods'ki neighborhoods, where the streets are relatively more welcoming and walkable, and particularly low performances in the Korabel'nyi neighborhood.
Similar results are also confirmed by the trends highlighted by the survey conducted among the citizens of Mykolaiv regarding the quality of the streets and sidewalks of the city and in the four districts. The comparison between the percentage of totally and mostly unsatisfied respondents and the amount of low and medium-low-quality streets measured with IAPI shows very similar trends indeed, especially at the city level and concerning the neighborhoods of Zavods'kyi and Inhulskyi. In the case of Tsentral'nyi, however, IAPI tends to slightly underestimate the quality of the routes compared to what is perceived, while the opposite happens in the case of Korabel'nyi. Even if the survey and walkability analysis results are not directly comparable, they are nevertheless consistent and show that the problem of the quality of walkability is not only perceived but also objectively measurable with different intensities between the city's neighborhoods.
Percentages for each street type Comparison
Enhancing Urban Planning in the city of Mykolaiv:
IAPI assessment – overall level of accessibility
The image to the right illustrates the result of the accessibility calculation performed through the IAPI methodology in Mykolaiv. All community facilities were considered in this process, giving each category the same weight. This approach can be integrated by assigning different weights to services based on residents' perceptions collected via survey. Questions about which services are most important to reach via active mobility would make it possible to define a relevance ranking and assign specific weights to each category. Consequently, the more relevant types would assume greater importance in the evaluation. At the same time, their absence would produce a worse result for all the hexagons of the grid from which they are not accessible.
The chart shows a very unequal level of pedestrian accessibility by proximity in the city's four districts. As for the calculation of the quality of walkability, in the final IAPI score, Zavods'kyi (except for the Varvarivka area and the settlements across the river) and Inhulskyi emerge as the most accessible areas of the city, thanks to satisfactory service provision and a relatively better quality of local streets. Worse performances are recorded by Tsentral'nyi, especially beyond the Inhul River (Solyani) and in the Korabel'nyi district, where the analysis shows the almost complete lack of a high level of accessibility to the composite set of social infrastructure included in the assessment.
IAPI assessment – level of accessibility per facility category
The IAPI assessment can also be broken down for the seven community facility categories considered in the Mykolaiv calculation. As can be seen from the maps, there is a relevant difference in the distribution of services within the city. While green areas (category 1) are generally widespread and accessible, commercial activities tend to be concentrated in the central areas of the city and individual districts. Also, commercial activities are generally not very accessible in most of the Korabel'nyi neighborhoods and the areas across the rivers. The level of accessibility to cultural spaces and sports facilities throughout the city is also low. Health facilities tend to be concentrated in central areas, leaving large areas of the Korabel'nyi area uncovered, while educational facilities show better accessibility. For all activities, especially those provided by the public sector, it will still be important to evaluate the level of post-conflict damage and demand, which could vary based on the effects of the demographic changes that the city is undergoing due to the conflict. Finally, the ordinary public transport system is capillary in the city center while, in the peripheral areas, it is generally limited to the main roads, providing a rather limited territory coverage. Even considering that this assessment does not consider the quality of the service (frequencies, quality of vehicles, and stops) but only the availability, it still highlights the low-density areas in which the service is not available. Such areas could be a promising ground to test innovative forms of last mile between public transport hubs and residential locations.
The differences in the availability of services are further highlighted in the chart to the right, where the average IAPI values per category are calculated in the four districts and at the city level. This analysis provides a more detailed look at the provision of community facilities and their accessibility at the urban and local scales. As expected, sports and cultural activities are notably lacking in the city, corresponding to the perceptions collected through the surveys mentioned earlier. Retail venues are generally the most accessible at an urban level and in central neighborhoods, followed by public transport stops, educational facilities, green areas, and healthcare facilities. Inhulsky and Zavodsk'kyi always perform better in terms of accessibility to any category. At the same time, Korabel'nyi shows, once again, notable limitations compared to the rest of the city.
Enhancing Urban Planning in the city
IAPI assessment Оцінка IAPI
One of the main objectives of the IAPI application in Mykolaiv is to facilitate its future development and transformation scenarios, through the mapping of analysis results as well as integration with other data (for example, sociodemographic data).
In a pre-conflict scenario, the city presented relevant imbalances between the central and peripheral areas regarding accessibility to services and the quality of streets and public spaces, namely the dimensions measured through the IAPI index. Consequently, the overlapping of IAPI results with population density data allows us to build an analytical framework capable of orienting specific policy measures based on four prevailing conditions:
• Areas with low population density and low IAPI score, where the availability of nearby service facilities may be lacking due to low and spatially dispersed demand;
• Areas with low population density and high IAPI score, where the provision of services may be sufficient or, potentially, exceed local demand;
• Areas with high population density and low IAPI score, where inhabitants may directly experience limited opportunities for accessing essential services and activities;
• Areas with high population density and high IAPI score, where accessibility by proximity may be already consolidated.
Each of these cases, and especially the first three, highlights specific problems that can affect local communities and guide possible evolutionary scenarios of the city whose feasibility will be verified in light of the changes induced by the conflict. It should be noted that the population density data used in this calculation are based on estimates rather than on an official census, which is not available in the case of Mykolaiv at a sufficiently disaggregated scale. Therefore, results may differ from pre-conflict conditions.
Upgrade functions: increase
The city of proximity/
Upgrade transport: improve active modes and intermodality/
Densifying: possible densification processes/ Ущільнення:
Increasing provision Надання
The first analysis concerns areas with high population density and low IAPI value. These are the most problematic areas under the accessibility by proximity perspective, due to poor access to facilities and the poor quality of streets affecting a relatively significant number of inhabitants. These conditions occur in various peripheral areas of the four districts characterized by a predominantly residential fabric with isolated houses on lots interspersed with tower or in-line building complexes. Considering that these areas have a population density higher than the city average, it is possible to envisage specific improvement actions to increase the provision of local facilities, while improving the road infrastructure for easy access. In these contexts it would be useful to directly involve the population in the assessment of facilities that are unavailable or lacking but considered essential, using effective and inclusive participation strategies.
Areas that would benefit from an increase in facility provision
Upgrade provision: increase facility supply/
Upgrade transport: improve active modes and intermodality/
Densifying: possible densification processes/
Enhancing
Improving active modes and intermodality
The second analysis concerns a prevalent condition in the city's peripheral areas, where both the IAPI index and the housing densities have lower levels than the city average. These areas have a limited provision of community facilities, due to low demand. They could therefore benefit from a widespread and efficient public transport network, which would improve connectivity to areas that offer more opportunities and facilities. This could be achieved by strengthening intermodality through the creation of interchange hubs in specific neighbourhood spots that are particularly accessible by public transport. These hubs could integrate different mobility options to cover the last mile to the residential location (e.g., bike sharing, car sharing, community taxi, Demand Responsive Transit). Similar mobility services can be more economically efficient in low-density areas compared to traditional public transport and could be offered within a MaaS environment (Mobility as a Service) that facilitates travel planning and payments. The same last-mile mobility services could be managed and co-produced directly by local communities according to the principle of MaaC (Mobility as a Community). On the other hand, the implementation of mobility hubs allows the creation of new urban polarities within the neighbourhoods, where new services and activities can develop, even within areas with low settlement density. For this reason, and to facilitate access to the hubs themselves, a second line of action should ensure that walking and cycle paths are enhanced to encourage a suitable and comfortable active mobility alternative to cover the last mile.
Areas
Upgrade
Densifying:
IAPI
Densifying: possible densification processes
The last analysis concerns areas with low population density and good accessibility measured with the IAPI index. These are peripheral areas generally located along the main road axes connecting Mykolaiv to the rest of the country. These routes, most often served by public transport, host commercial hubs (e.g., malls), service facilities, production areas, and a scattered low-density residential fabric. Generally, the provision of social infrastructure guarantees good levels of accessibility. At the same time, the somewhat disorderly development of the residential fabric offers significant opportunities for targeted densification of vacant or low-density lots closest to the services and stops of the transit system. In any case, the quality of pedestrian and cycle paths in these areas often remains unsatisfactory, and this requires that selective densification go hand in hand with improving the infrastructure for active mobility and strengthening transport systems along the axes connecting to the city center.
Areas
transport: improve active modes and intermodality/
The city of proximity/
xmin city/
Densifying: possible densification processes/
Enhancing Urban Planning in the city of Mykolaiv: Concept
Conclusions
The IAPI analysis in Mykolaiv provided a varied picture of the pre-conflict conditions and offered new ideas for exploring future scenarios toward a more accessible and sustainable city. However, it is essential to note that this methodology has two significant limitations.
The first concerns the limited availability of data, which, especially in the case of population density, can lead to results that are inconsistent with reality. This limit can be overcome by acquiring updated and complete information rather than estimates. It would be optimal to have these data in a post-conflict scenario to profoundly investigate the changes that occurred in the meantime, as these will necessarily modify the possible strategies of densification, improvement of services, and road infrastructure amelioration in light of the new population distribution within the city limits.
The second limitation concerns the selection and mapping of the indicators and community facilities considered. Although the IAPI methodology has been modified compared to previous applications to adapt it to the context of Mykolaiv, it is also true that the selected indicators may not be effective if applied to a city that is still largely affected by the Soviet legacy in the morphology of the built environments (e.g., an ample supply of public spaces with undersized equipment for conviviality; large width car-oriented road even in the central areas of the city). These considerations would require a more careful analysis of the context and its urban culture, including a process of involvement of the population to collect their preferences in terms of active mobility choices and conviviality as well as relevant community facilities. Indeed, all these aspects may vary considerably compared to other European and even Ukrainian cities.
Beyond these limitations, IAPI can contribute to orienting Mykolaiv policymakers' decisions, especially if usefully combined with other information, such as:
• The damage assessment of buildings and roads to identify which services are no longer available today and how the conflict has modified the shape and use of existing road infrastructures.
• Urban development plans to identify unsustainable forecasts in terms of accessibility by proximity and reorienting development choices based on the framework proposed in this chapter.
CHAPTER
Reconstruction Themes and Benchmarking
Основні напрями реконструкції
Mykolaiv Contextualisation and Reconstruction Themes
Контекстуалізація
реконструкції Миколаєва
Mykolaiv contextualization
Sectoral framework
Over the past decade, Mykolaiv has shown a distinct entrepreneurial approach to its economic development. The city’s industrial fabric and its identity have undergone a substantial change: moving away from its past as a shipbuilding hub of national importance, the city is now looking to becoming a potential new frontier within the energy sector.
This shift is mainly a result of local economic policy choices. After Ukraine gained independence in 1991, Mykolaiv's shipbuilding industry faced economic challenges and the need to adapt to new market conditions. Nonetheless, the city has continued to operate as a shipbuilding hub, making a significant effort towards modernisation and adaptation to global market needs. Looking at diversifying production, the industry focused on commercial ships, offshore vessels, and specialised vessels.
As the demand for more efficient and technologically advanced vessels increased, in recent years Mykolaiv has sought to remain competitive through the adoption of cutting-edge technologies and collaboration with international partners. This included investments dedicated to highly skilled workforce training as well as an infrastructure upgrade to meet the demands of modern production.Despite economic and political challenges, Mykolaiv's shipbuilding industry has remained an important driver of the region's economy for years. A series of collateral industries that gravitated around the naval sector - such as metallurgy –contributed to provide employment and value creation for Ukraine. This was subject to an abrupt halt starting from 2017, when the relocation of the city’s main metallurgical plant essentially reduced its contribution to zero in terms of turnover, employees, and related activities in the local economy’s total computation. This relocation caused significant fallout, leading to a structural shift for the entire region in recent years. At the same time, the engineering, repair and installation of machinery and equipment sector showed a net loss of 10% between 2010 and 2022, the latter year being the most recent reference point before the outbreak of the conflict with Russia. Mykolaiv has since expressed its intention to diversify its economy, reducing its dependence on the shipbuilding sector, while still aiming to produce medium-size tourist boats and provide maritime services related to boat berthing and maintenance. Meanwhile, the dynamics have changed, with the energy sector strongly emerging, more than doubling its share to reach almost half of the total (47%). The service sector has undergone a similar evolutionary dynamic, with an increase from 8% in 2010 to 15% in 2022. At this phase of post-conflict reconstruction planning, this may act as a critical success factor for the area's sustainable growth in the years to come.
Photo: Alexander Minyaylo
Further strengthening the service sector could lead to multiple positive spillovers.
Developing digital infrastructure would boost several economic activities, including various aspects of the energy sector such as design, planning, management, and security. Digital infrastructure would also play a fundamental role in facilitating the transition towards Smart City and Blue & Green Economy policies.
Tourism can play a major role in the city’s economic recovery. According to the well-known tourism-led growth hypothesis, tourism can indeed play a significant role in the development of countries affected by devastating events, as evidenced by several examples in tourism literature.
A study titled "The Tourism Led Growth Hypothesis: The Lebanese Case"1 investigated the relationship between tourism development and economic growth in Lebanon from 1995 to 2013, considering the impact of terrorist attacks. Despite the country's frequent exposure to incidents, the authors noted a positive, unidirectional causality from tourism development to economic growth in the short term, supporting the tourism-led growth hypothesis. This suggests that policies promoting tourism (e.g. tourism marketing, infrastructure development/rebuilding), can have positive effects on economic growth.
A similar example can be seen in Haiti2 : after a period marked by political instability and natural disasters, the country focused on re-establishing its tourism industry. This included developing international standard hotels and implementing master plans to promote the country as a quality destination. Despite the challenges faced, progress has been made in rebranding and rebuilding the tourism sector. This reflects the potential for tourism to contribute to economic recovery and growth in post-conflict and post-disaster situations. Both examples will be further analysed later on in this chapter.
Mykolaiv's division of Industry by sector
Producing food, beverages and tobacco products
Supply of electricity, gas, steam and air conditioning
Engineering, repair and installation of machinery and equipment
Metallurgy and manufacturing of fabricated metal products
Manufacturing of other non-metal products
Manufacturing of wood products, paper production and printing
Company size, employment and investment
The analysis of enterprises in Mykolaiv, with particular reference to their size and composition, provides interesting insights. Activities characterised by a micro dimension, typical of individual entrepreneurship, account for 80% of the total, a trend that crystallised in the observation years prior to the COVID-19 pandemic.
The remainder is composed of local units, which further exhibit a trend towards small businesses. Although micro enterprises constitute almost all of the legal entities in the area (over 95%), they produce only one-fifth of the total volume within the urban area. At the opposite end of the spectrum, medium and large enterprises in Mykolaiv account for a very limited number, yet each contributes to 40% of the total produced volume.
As a reference, the average values for the 27 member countries of the European Union in 20203 are as follows: large enterprises generate a turnover equal to just over half of the total (50%) with a small number of units (0.16% of the total). In contrast, small enterprises represent almost the entire market in terms of local units (99%), and account for less than one-third of the total turnover (32%).
Employment data in Mykolaiv show a constant decrease over the last decade, with an overall reduction of 13%. The workers’ gender split and the percentage of workers relative to the total population are illustrated in the chart on the previous page.
The working-age population (15 - 64 years old) has remained almost constant and is equally distributed between males and females. However, this may change considerably in the coming years as a direct result of the current conflict with Russia. The gap between male and female workers is likely to increase significantly, which may impact future reconstruction paths and the area's employment outlook, especially in the short-term. The focus will likely be on specific tertiary and capital-intensive development sectors. On the other hand, from this evolutionary perspective, the Mykolaiv area could experience a labour shortage related to the primary and secondary sectors.
Another significant piece of data is the overall percentage of workers, which in the 2019-2021 period stood at just over 20%.
This is a structurally low, especially when compared to potentially comparable economies such as Romania (26%), Georgia (28%,) or Bulgaria (33%)4 .
It’s interesting to note that, for about a decade before the conflict, the unemployment level in Ukraine maintained a slow but steady growth trend, reaching around 10%. This highlights an additional issue: there was already a lack of labour force and poor conditions for its optimal utilisation. In contrast, countries such as the Baltic states (Latvia, Lithuania, and Estonia) as well as Easter European countries that are part of the EU - and therefore further along in the process of alignment with European standards (such as Poland and Romania) - have steadily decreased their domestic unemployment levels, despite starting from much more challenging conditions than pre-conflict Ukraine. In this context, the three Baltic countries are emblematic: over the past decade, they have managed to halve their unemployment rate. While Poland has now embarked on an established virtuous path, since 2017 Romania had been closely following the Ukrainian evolutionary dynamics.
While this evidence shows ample room for improvement, it also highlights that Mykolaiv must confront an inherent weakness. This suggests, once again, a path for future reconstruction that relies heavily on the intensive use of technology and foreign capital.
Unfortunately, the latter is still influenced by practices established before Ukraine’s independence, particularly concerning transparency and corruption levels. Although there has been progress, it is also evident that the current level of investment, despite being earnest in its efforts, has yielded relatively modest results. This situation indicates an evolving landscape that still holds potential for significant improvement and development.
The average level of capital investment per capita recorded in Mykolaiv area for the 2019-2021 period is about $335 per year, with a steadily decreasing trend that represents an average loss of 30% per year. Considering the context Mykolaiv belongs to, this is not surprising. Overall, over the past 12 years, foreign investment levels in Ukraine have never exceeded 5% of GDP, registering zero both during the Covid-19 pandemic in 2020 and following the start of the conflict with Russia in 2022.
Comparable countries exhibit marked volatility and overall foreign investment levels comparable to those of Ukraine. Romania, in particular, shows a very similar trend (if we disregard the 2022 figure, which is heavily influenced by the conflict). These data suggest that, once the endemic critical issues are addressed and an appropriate incentive policy is implemented, Ukraine's positioning with respect to its direct competitors could improve with a rather quick time response.
The most critical issue requiring attention and efforts is the country’s level of corruption. In the absence of specific measurements for the region, a reliable indicator is the Corruption Perceptions Index calculated by Transparency International. This indicator, which originated in 1995 and quickly became the leading global indicator of public sector corruption, provides an annual snapshot of the relative degree of corruption by ranking countries and territories around the world. In 2023, Ukraine ranked 104th globally (with 180 countries considered out of a total of 193), as shown in the image below.
However, it is interesting to note how Ukraine is progressively improving its global ranking through a path of virtuous growth, which reflects awareness and the subsequent implementation of policies aimed at curbing this issue.
Ukraine should continue fight corruption as a key element of its agenda, aiming to improve its attractiveness for foreign investment and demonstrate its ongoing commitment to reaching the European Union's standards and expectations.
A possible scenario Можливий сценарій
In view of the aspects related to sectoral evolution, industrial composition, and level of foreign investment mentioned above, and in accordance with the globally accepted trend towards economic and environmental sustainability, Mykolaiv should naturally focus its attention on the energy sector.
In a context of exponential growth in energy needs on one hand, and decreasing waste production on the other*, the energy sector is increasingly considered in international agendas for planning future economic policies. Within a framework of general instability due to political tensions in various areas of the world, the simultaneous harmonisation of production and consumption needs points to this specific area of development as the key to Ukraine's rapid and homogeneous integration into the European development context.
It is no coincidence that on July 4, 2022, Ukraine presented a 10-year national plan at the Ukraine Recovery Conference held in Lugano, Switzerland. Although this is yet to evolve into a definitive roadmap for recovery actions, the plan established a gradual transition from nuclear energy to a mix of renewables such as wind, solar, and biomass, as a key element of the country development agenda. This diversification is certainly invasive yet necessary to emancipate Ukraine from its Soviet past, take a decisive step toward future sustainability, and minimise conflictrelated risks as witnessed in recent events. Even before the conflict, the Ukrainian government had already acted decisively in this regard, setting the goal of deriving 25% of its total energy mix from renewable sources by 2035. Ukraine’s demand is mainly met by domestic production, which amounts to 65% of total needs: mainly nuclear power (more than 55%), coal (23,7%), and renewable energy sources (currently only 7%).
The southern and eastern regions – including Odesa, Zaporizhzhia, Kherson, Dnipro, and Mykolaiv – will be crucial in terms of renewables. Here, the solar irradiation is highest for photovoltaic generation, and the terrain is the flattest for wind generation. Even before the outbreak of the conflict, these areas could boast about two-thirds of wind and solar power plants in operation. A crucial aspect for the development of energy conversion is its physical infrastructure, which must ensure a balanced delivery of energy accordance with electricity demand. This requirement, which must be met in real time, is complex to achieve and aims to protect networks from surpluses or shortages: the former
Benchmarks: Reconstruction Themes and Guidelines
Best practices of spatial reconstruction
The scenario outlined on the previous pages pivots on the existence of a physical as well as social infrastructure, both of which have been heavily affected by the conflict. Therefore, the reconstruction of Mykolaiv will have to go beyond a mere physical rebuilding, extending into the realm of enhancing the capabilities of its people, and offering an opportunity not only to rebuild but to also rethink and reshape its societal structures.
The task of rebuilding homes, schools, hospitals, and other infrastructure is undeniably critical. However, this physical reconstruction must be seen as a foundational step towards enhancing the broader capabilities of individuals. For instance, the rebuilding of educational institutions is not just about erecting buildings but rather about creating environments able to foster learning, critical thinking, and personal development. Similarly, the restoration of healthcare facilities is intrinsically linked to improving the health and well-being of the population, directly impacting their ability to lead fulfilling lives.
Therefore, the reconstruction process should encompass a holistic approach to restoring and improving the social, economic, and environmental fabric of Mykolaiv.
Several successful practices implemented after destructive events, whether these had a human or natural origin, can be considered as virtuous examples. The following case studies summarise the design and implementation phases of such initiatives, providing valuable precedents of how to face immanent disasters.
Photo: Sergey Ovcharyshyn
Best practices - Community Engagement
The success of rebuilding efforts greatly depends on how deeply and effectively the affected communities are involved in the process. Therefore, community involvement and stakeholder engagement are the starting point of any successful project of spatial reconstruction. This ensures that reconstruction strategies focus not only on physical rebuilding but also on restoring the social fabric while meeting the true needs of the local community.
For example, following a devastating earthquake in 2011, in Christchurch (New Zealand) the city council initiated an exemplary project called "Share an Idea". This initiative was a community engagement exercise that allowed residents to actively participate in the rebuilding process. Over 106,000 ideas were collected, ranging from the design of public spaces (“Green City”) to transportation (“Transport Choice”) and sustainability considerations (“Distinctive City”). This extensive input directly influenced the city’s recovery plan, leading to a rebuilding process more in line with the residents' aspirations and needs. This approach fostered a sense of ownership among the residents and ensured that the rebuilt city reflected the community's collective vision. The success of "Share an Idea" is highlighted in various works, being praised for its inclusivity and effectiveness in postdisaster recovery planning.
Onagawa, Japan - Post disaster community redevelopment
Another interesting approach is that of the aftermath of the 2011 tsunami in Japan. The town of Onagawa, which was severely affected, undertook a remarkable reconstruction effort, involving the local community with extensive consultation. Residents participated in planning workshops where they could express their concerns and preferences for the rebuilding of their town. The outcome was a reconstruction plan that focused on safety and disaster resilience while promoting an eco-friendly town, welcoming to children, elderly and disabled people, and offering increased food and water security. The rebuilt Onagawa features elevated land to protect against future tsunamis, and planning policies designed to foster a sense of community. The town's recovery has been documented as a case where community involvement played a critical role in shaping the reconstruction efforts, ensuring that the rebuilt environment catered to the needs and safety of the residents.
The importance of community involvement in post-disaster reconstruction cannot be overstated: an active engagement of population, planners and local authorities can maximise the probability of rebuilding lives and communities. This may, in turn, lead to more sustainable and resilient recovery outcomes, as rooted in the experiences, needs, and aspirations of the people most affected by disasters.
Source I
Sue, Y. (2017). COORDINATING POST-DISASTER COMMUNITY REDEVELOPMENT—GROUNDED IN THE EXPERIENCE COORDINATING ONAGAWA'S POST-DISASTER RECONSTRUCTION—. Journal of JSCE, 5(1),
Christchurch, New Zeland - "Share an Idea"
Best practices - Sustainability and Resilience
Catastrophic events undoubtably have negative consequences over local economic systems; however, once the dust is settled, they may offer the possibility of embracing sustainable and resilient principles. This approach represents a paradigm shift in disaster recovery: focusing on long-term sustainability and resilience rather than just immediate restoration, communities have the chance to reimagine how they can thrive and withstand future disasters.
Italy
A compelling example can be seen in the reconstruction of L’Aquila, Italy, after the devastating 2009 earthquake. The rebuilding efforts in L’Aquila were not limited to mere restoration of the damaged buildings, but they rather encompassed a comprehensive urban redevelopment plan. While the latter revolved around constructing earthquake-resistant buildings and infrastructure, it also focused on enhancing the quality of urban life. The introduction of green spaces, improvement of public transportation systems, and creation of pedestrian zones were all part of a broader vision to create a more liveable, sustainable, and resilient city. This reconstruction project demonstrates how post-disaster rebuilding can be an opportunity to improve upon the pre-existing urban environment, making it more adaptable to future challenges.
Another example is the rebuilding effort in Greensburg, Kansas, USA, following a tornado in 2007 that destroyed 95% of the community. Greensburg decided to take a groundbreaking approach to its reconstruction, by committing to sustainable development: all public buildings were rebuilt to meet the LEED Platinum environmental standard, making it one of the greenest towns in America. This included the construction of a highly energy-efficient school, a sustainable city hall, eco-friendly homes, better transportation infrastructure and green amenities. This case is a testament to how disaster recovery can serve as a catalyst for innovative and sustainable urban development, as the town recovered from the tornado while transforming itself into a model for environmentally sustainable living.
These two examples show that rebuilding after a disaster offers unique opportunities to improve upon the past, by focusing on sustainability and resilience. These communities have rebuilt their physical structures and enhanced their overall resilience to future disasters, setting a precedent for sustainable and resilient urban development. This approach underscores the importance of seeing reconstruction not just as a response to destruction but as an opportunity for an ameliorative transformation.
Best practices - Revitalisation through employment
In a reconstruction context, the principle of economic revitalisation through local employment is crucial: this approach emphasises the need to stimulate the local economy by prioritising the employment of local workers and businesses during (but not limited to) the reconstruction process. Not only does this strategy help in immediate rebuilding efforts, but it also plays a significant role in the long-term economic recovery and sustainability of the affected area.
A successful example of this practice can be seen in the aftermath of Hurricane Katrina in New Orleans, USA, which brought not only physical damage but also a significant economic downturn. In response, initiatives like the "New Orleans Works" program were launched. The program focused on creating workforce development strategies centred on employers' needs, providing opportunities for career progression to low-skilled adults, both newcomers and existing workers, and ensuring vital industry sectors could meet their staffing requirements, benefitting from the reconstruction of their city. This played a key role in New Orleans economic recovery, reducing unemployment and stimulating local economic activity as well as physical reconstruction.
Source I Джерело: https://www.gnof.org/24-graduate-from-new-orleansworks-medical-assistant-training-program/
Aceh, Indonesia
Another precedent is the reconstruction of Aceh, Indonesia, following the 2004 tsunami. While the massive rebuilding program initiated by the government and local NGOs prioritised the use of local labour and resources, these efforts were “multiplied” by the rich tradition of community-based associations and organisations, fostering a virtuous circle. This expedited the reconstruction and infused financial resources into the local economy, helping to alleviate the economic impact of the disaster on the community. By engaging local workers and businesses, the reconstruction efforts in Aceh were able to contribute to both the physical rebuilding of the region and the economic empowerment of its people.
These cases highlight the importance of integrating economic revitalisation strategies into the reconstruction process. Fostering local employment and businesses allows reconstruction efforts to rebuild structures as well as lives and communities. This, in turn, ensures that the benefits of reconstruction extend beyond the immediate rebuilding phase, bringing a more robust and sustainable economic recovery for the affected communities. This approach recognises the interdependence of physical reconstruction and economic revitalisation, reinforcing the idea that a truly successful rebuilding effort must address both the physical and economic needs of the community.
"New Orleans Works" logo
Source I
AFP, Getty Images, Joel Sagget
Best practices - Cultural heritage and identity
While the immediate focus is often on rebuilding homes, infrastructure, and essential services, in the aftermath of natural or man-made disasters equal attention must be given to restoring cultural landmarks, traditional architecture, and community spaces that hold significant cultural value. The importance of preserving cultural heritage and identity within a reconstruction process lies well beyond the restoration of physical elements, as it involves a deeper understanding and appreciation of the cultural, historical, and social significance of the affected spaces and communities. This ensures that the reconstruction not only restores the physical landscape but also maintains (and possibly enhance) the cultural identity and heritage that give a community its unique character
For instance, the 2001 earthquake in Bhuj, India, caused widespread destruction, affecting many historical buildings and cultural sites. The city made a conscious effort to restore these structures, promoting careful preservation of traditional architectural styles and techniques, and ensuring that the city's rich cultural heritage was not lost in the rebuilding process. This helped preserve the historical and cultural identity of Bhuj, played a role in boosting community morale and fostered a sense of continuity and connection to the past, while enhancing tourist attractiveness.
A similar emphasis on cultural preservation was put in the reconstruction of the ancient citadel of Bam, a UNESCO World Heritage Site in Iran, following a devastating earthquake in 2003. The reconstruction focused on the use of traditional materials and techniques, in consultation with local craftsmen and international experts. This careful and respectful approach to reconstruction helped in preserving a significant part of national cultural heritage, while also contributing to the revival of traditional crafts and skills.
These approaches highlight the importance of incorporating cultural sensitivity into reconstruction efforts, and offer local communities the chance to reclaim their cultural narratives and heritage, alongside their rebuilt physical spaces. Historical landmarks embody community's history, traditions, and shared memories: thus, their preservation during the reconstruction phase can help maintain the cultural identity of a community, contributing to its overall resilience and sustainability. Furthermore, the restoration of cultural heritage sites and the use of traditional architectural styles in reconstruction can also have broader benefits, including promoting tourism and economic development, further contributing to the long-term recovery of the affected areas.
Bhuj, India
Bam, Iran
Best practices - Innovative Urban Planning
The implementation of innovative urban planning and design in the reconstruction of cities after a conflict can be an important opportunity to reimagine and revitalise urban spaces. Therefore, going beyond the mere replication of what existed before, reconstruction offers a chance to incorporate modern urban design principles able to enhance livability, functionality, and aesthetic appeal of areas. Building back offers an opportunity to integrate new technologies, sustainable practices, and community-focused designs into the urban fabric.
Beirut, Lebanon
The reconstruction of Beirut, Lebanon, after the Lebanese civil war provides a notable example. After the ending of the conflict in 1990, the city – and its central district in particular - were left in ruins. The reconstruction of Beirut was undertaken by Solidere, a public-private real estate partnership, and involved an ambitious plan to rebuild the damaged structures while modernising the city. The plan included the creation of new public spaces, parks5 , the restoration of historic buildings, and the introduction of new infrastructure to support economic activities (such as an efficient public transportation system). However, as any initiative, some controversies spurred after the project’s implementation; criticisms arose regarding the erasure of some of the city’s traditional character and the displacement of local communities, very “strict” guidelines about buildings facades and, in general, the vast autonomy given to Solidere. Nevertheless, this reconstruction project showed how post-conflict urban redevelopment can be an opportunity to introduce modern urban design and infrastructure, balancing it with the preservation of historical identity and community needs.
Sarajevo, Bosnia and Herzegovina
A similar approach was applied to the cities that belonged to the former Socialist Federal Republic of Yugoslavia, after the end of the several civil wars spurred in the last decade of the 20th century. In particular, Sarajevo, the capital of Bosnia and Herzegovina, faced the challenge of reconstructing its war-torn urban landscape after a prolonged siege. Sarajevo’s efforts (both during and after the war) focused not just on repairing the physical damage but also on healing social divisions. The rebuilding of the city’s iconic multi-arched bridge, Stari Most, which had been destroyed during the war, paid tribute to both the city’s identity and its community cohesion. Additionally, new urban development in Sarajevo incorporated modern design elements and infrastructure improvements, contributing to the city's gradual transformation into a modern European capital.
Beirut and Sarajevo cases demonstrate the complexities but also the opportunities inherent in post-conflict urban reconstruction. In most cases, innovative urban planning and design strategies offer the opportunity to reimagine damaged cities to improve the quality of life for their residents. It is crucial, however, to balance modernisation and preservation efforts, paying attention to the local cultural identity and ensuring that redevelopment efforts are inclusive and sensitive to the needs of local communities. The reconstruction process, thus, is a delicate balancing act that requires careful consideration of various social, cultural, and economic factors.
Best practices - Disaster risk reduction
Natural disaster risk reduction strategies can be integrated into the spatial reconstruction process, ensuring long-term resilience and sustainability for local communities. The starting point is a comprehensive analysis of the vulnerabilities that can lead to relevant damage, in order to implement strategies to mitigate these risks: for example, it could include reinforcing buildings to withstand natural disasters, redesigning infrastructure to cope with extreme weather events, or relocating communities from high geographical risks areas. To sum up, the goal is to create spaces that are not just restored but are inherently safer and more resilient.
Philippines
A prominent example of this approach can be seen in the reconstruction efforts in the Philippines after Typhoon Haiyan in 2013. Recognising the high vulnerability of the region to typhoons and rising sea levels, the reconstruction plan included building homes and infrastructure more resilient to such events. This meant stronger materials, elevated structures (against flooding risks), improved drainage systems and restoration of natural barriers (such as mangroves forests). Moreover, a significant focus on community-based disaster risk management was encouraged, to ensure that local populations are better prepared and more resilient in the face of future similar events.
Queensland, Australia
Along the same line is the post-flood reconstruction in Queensland, Australia. After severe floods in 2010 and 2011, the state government implemented a range of measures to reduce future flood risks, from regulations to discourage new developments in flood-prone areas, to elevating existing homes, as well improving the flood resilience of critical infrastructure. These efforts have been joined by investments in better flood forecasting and warning systems, enhancing the community’s ability to prepare for and respond to future flooding events.
These instances underscore the importance of incorporating disaster risk reduction into the reconstruction process to prevent extreme natural events. By doing so, communities are not only rebuilt to their former state but are enhanced to withstand them. This is pivotal in reducing human and economic costs and is a crucial step towards building more resilient and sustainable communities. The integration of natural disaster risk reduction strategies requires a thorough understanding of local risks, active involvement of the community, and a commitment to long-term planning and investment. This approach acknowledges that the best way to recover from and prevent a disaster is to build back better, stronger, and smarter.
Best practices - Conclusions
Передові практики: Висновки
This non-exhaustive list of best practices all around the world demonstrate that a comprehensive approach to spatial reconstruction that values local input, sustainability, economic revitalisation, cultural preservation, innovative design, and future risk mitigation, is a winning formula: each example underscores the importance of a thoughtful and inclusive approach to rebuilding communities after a destructive event.
To sum up, the following table reports the main insights that can be drawn from the discussion above:
Actively involving local communities and stakeholders in the reconstruction process to ensure that
Building infrastructure that is sustainable and capable of withstanding future disasters, ensuring
Stimulating
Reconstruction Guidelines - Blue & Green Economy
The following pages focus on themes that are particularly relevant to the Mikolaiv's reconstruction process, both in terms of city-wide strategies and pilot projects priorities.
The Green Energy Economy
The Green Energy Economy is a scientific and policy approach that pursues the classic development goals of economic, environmental, social and security aspects, putting emphasises on the way these are achieved. The focus is on the expansion of energy technology systems and the development of markets and services that are efficient both in terms of resources and compliance with low-carbon constraints. A key focus of the Green Economy is on policies and strategies to facilitate the rapid transition to sustainable energy economy systems.
In particular, the Blue Economy, which is a recent branch of the Green one, focuses on the sustainable development of all productive, commercial and service activities that have a specific impact on the use of ocean, marine and coastal resources. It aims to operate according to a harmonisation logic through the implementation of multiple specific initiatives: from fishing activities to maritime transport, from ecotourism to waste management, via the conscious use of renewable energy to combat climate change. Both the Blue & Green Economy approaches are based on a vision of "improving welfare and social equity while significantly reducing environmental risks and ecological deficiencies" (UNEP 2013). The transition to a Blue & Green economy involves a range of changes in policies, business practices and individual behaviour: these may include government incentives to promote sustainable practices, investment in clean technologies and in research and development of innovative solutions, and public awareness and education about the importance of environmental conservation. Attracting capital for program development also plays a crucial role. Some exemplary cases of this environmentally sustainable approach are summarised below.
(Barents Sea Plan)
With the goal of producing an integrated management plan for Norway's marine areas, structural analysis work on the Barents Sea Plan began in 2002, involving numerous institutional stakeholders (Ministries of Environment, Foreign Affairs, Fisheries and Coastal Affairs, and Petroleum and Energy coordinated by specific governmental Institutes and Bodies) and private stakeholders. Ratified four years later by parliament and subsequently implemented starting from 2009, the plan has undergone numerous periodic updates in a natural process of fine-tuning, with further refinements predetermined in 2025 and 2030. The main actions taken were as follows:
• Identification of valuable and vulnerable areas where special caution is needed. Considerations apply to the evaluation of standards and restrictions on activities.
• Establishment of goals and targets (e.g., for hazardous substances, operational discharges, species management, conservation of marine habitat types, etc.).
• The plan is continuously updated in response to expanded and coordinated monitoring of the environment (e.g., fisheries, oil activities, shipping, new industries).
• Models and risk analysis are used as tools to estimate risk.
• Consideration of the importance of marine ecosystem services for (economic) value creation and for Norwegian society.
• Assessments of pressures and impacts on different ecosystem components and the ecosystem as a whole are conducted on a regular basis.
• Development of procedures for identifying knowledge gaps and how these should be included, prioritised, and filled.
The plan has had both positive economic and environmental spin-offs due to the involvement and coordination of operations by public institutions on the one hand and interaction with private stakeholders on the other, the latter being the real drivers of economic activity development in the area. Performance monitoring, constant review and dialogue among all stakeholders involved have been the critical success factors of the plan in the past and a guarantee for its future continuity. For a better understanding of the underlying dynamics, the diagram on the right summarises the used model. Norway
This ambitious program to protect the waters of the Mediterranean was initiated by France nearly 50 years ago and involves more than 20 countries bordering its waters from north to south. Over time, it has developed a systemic approach based on interdisciplinary studies that would promote awareness of the importance of marine conservation among the economic policy makers of member countries, as well as raising the awareness of all stakeholders who, in various capacities, contribute to the environmental development of the region. MED 2050 is developed with the intention of proposing a long-term vision of the area, interspersed with a period of monitoring results and reprogramming to 2030, through the convergence of the actions of the actors involved transcending the limits and interests of individual member countries. The project consists of 3 separate bodies that determine its development:
• the extended network
• the foresight group
• the scientific committee These entities are composed of thematic experts, decision makers at different scales, and members of civil society (associations, NGOs, companies...). The plan focused mainly on reducing socioeconomic inequalities (between and within countries) generated by high unemployment rates, especially among youth and women. The re-education to sustainable consumption and production patterns, in view of the high dependence on natural resources, was also a key point.
Bleu)
The Mediterranean Basin: main drivers of
The Mediterranean Sea (MED 2050: Plan Bleu)
Indonesia (ISOP: Indonesia’s Sustainable Oceans Program)
Indonesia is the nation that boasts the largest archipelago in the world and is therefore by definition a key example of transition to the Blue Economy. Seventy percent of the population lives near coastal areas and is directly dependent on the ocean for both income and food: in fact, the fishing sector employs 7M people and covers 50% of the population's daily diet. For this reason, one of the most carefully crafted aspects of the plan was the development of a reform on sustainable marine fisheries and coastal livelihoods.
In addition, programs aimed at the creation and conservation of marine and coastal ecosystems have been developed. Indonesia's ocean resources generate an annual turnover of more than $250 billion, or a quarter of the national total: this facilitated the creation of a blue economy demonstration zone in the Lombok and Anamabs islands and Tomini Bay.
The country made also extensive efforts to reduce plastic pollution, Indonesia being the world's second largest contributor in this regard. The tons of plastic waste produced each year risk jeopardizing the very resources Indonesia directly depends on for its economy and livelihood. The implementation of clean production systems was incentivised, and creative and innovative investments encouraged.
To sum up, widespread awareness of environmental issues has grown exponentially over time, reducing the systemic resistance inherent in epochal changes such as those required by the implementation of blue and green strategies. Depending on the territory and the context in which it develops, the transition to the Blue & Green Economy depends mainly on:
1) the presence of critical success factors (e.g. involvement of institutions and private stakeholders, clear activities planning, education);
2) continuous monitoring redefinition of the new objectives based on the results obtained in previous stages; and
3) availability of incentives to enhance R&D activities, able to foster Blue & Green innovations.
Reconstruction Guidelines - Industrial Park
An industrial park is "a tract of land developed and subdivided into plots according to a comprehensive plan with the provision of roads, transportation, and public utilities, sometimes also with common facilities for use by a group of manufacturers" (UNIDO).
Industrial parks are created to promote economic development, streamline the process of setting up new businesses, and manage environmental concerns by consolidating industrial operations within a specific area. They can offer benefits such as tax incentives, improved infrastructure, and regulatory advantages to attract and support businesses, fostering job creation and economic growth within a region.
Different types of industrial parks, each with unique characteristics and objectives, are usually identified and classified accordingly:
• Eco-Industrial Parks (EIPs): These are designed to enhance the social, economic, and environmental performance of resident firms through industrial symbiosis and green technologies, promoting climate-resilient industries, green value chains, and socially responsible relations with surrounding communities.
• Special Economic Zones (SEZs): Areas within a country subject to unique economic regulations that differ from other areas, often providing for extra-territorial treatment regarding customs tariffs.
• Border Economic Zones: Located along international borders to facilitate cross-border trade and investment.
• Export Processing Zones (EPZs): Duty-free zones focused on manufacturing for export, often providing tax holidays and minimal export quotas.
• Free Trade Zones (FTZs) / Free Zones (FZs): Areas with suspended import taxes and reduced regulatory compliance obligations to attract new businesses and foreign investments.
• Bonded Areas / Bonded Zones: Where dutiable goods may be stored, manipulated, or undergo light processing without payment of duty, subject to customs bonds.
• High-Tech Parks (HTPs): Designated areas to facilitate and promote the creation and growth of innovation-based companies through incubation and policy interventions.
• Agro-Industrial Parks (AIPs): Areas designed to attract and promote industries in downstream agricultural processing. This diversity of terms reflects differences in objectives, functions, and forms of these parks.
The best practices commonly identified for creating an industrial
park include:
1. Developing a sound business case that justifies the need and benefits of the industrial park.
2. Conducting comprehensive pre-feasibility and feasibility studies to assess technical, financial, economic, social, and environmental viability.
3. Master planning that incorporates sustainable development principles, targeted industry needs, and integrated environmental management.
4. Ensuring the park's design and operations are guided by sustainability strategies, including energy efficiency, renewable energy use, and waste management.
5. Establishing a Pricing Strategy which should reflect local market rates, allow for developer/operator cost recovery plus margin, and encourage future investments in the park's expansion or upgrade.
Investment incentives are critical for the birth and growth of industrial parks and can be typically classified into three categories:
• Financial Incentives: direct subsidies, grants, and loans provided to businesses within the industrial parks to support their establishment and growth.
• Fiscal Incentives: reduced tax rates aimed at reducing the fiscal burden on businesses operating within the parks.
• Other Incentives: subsidized land, infrastructure, and services, as well as various regulatory concessions. These incentives aim to lower operational costs and encourage businesses to set up or expand their operations within the industrial parks.
In the case of Mykolaiv, therefore, the first key elements on which the city administration should focus on are:
1) selecting the type of industrial park that should be developed, in line with the city's overall economic policy strategy;
2) setting up a legislative and fiscal framework, to be placed within the scope of administrative capacity and local legislative and fiscal autonomy, and with close coordination with the central government.
In terms of economic incentives, reduced corporate income tax rates and supportive regulations could represent target points to attract international investors’ interest. Mykolaiv could also focus on guaranteeing other incentives (such as production costs, i.e. energy and labour cost) which can guarantee economic advantages.
The blue-and-green economy transition should be planned
accordingly with this legislative framework, to maximise its funding potential. Extending the assessment, the advantages of the simultaneous and coordinated use of these two solutions lie in the optimal preparation of the infrastructure, the search and selection of the most suitable actors for the population of the industrial park, and last but not least, the possibility of implementing a system of continuous monitoring of the results obtained, so as to recalibrate future short, medium and long-term goals. This solution could bring undoubted economic benefits at the level of economies of scale, significantly increasing the chances of success of both objectives.
Photo: Dmytro Udovytskyi
Reconstruction Guidelines - Smart City Transition
A smart city is defined as a “well-defined geographical area, in which high technologies such as ICT, logistic, energy production, and so on, cooperate to create benefits for citizens in terms of well-being, inclusion and participation, environmental quality, intelligent development; it is governed by a well-defined pool of subjects, able to state the rules and policy for the city government and development” (Dameri, 2013).
Recent academic research (Lu et al., 2018) has shown that Smart City development, from the local government’s perspective, include three main topics: city policy, management and technology. While technology per se is crucial, in order to be able to generate real change, innovation must also apply to both management and policy.
In this regard, strong political support and will are fundamental; at the same time, further inputs are required to allow that a smart city transition follows a smooth process.
A recent document drafted by the European Parliament (“Social approach to the transition to smart cities, 2023”) highlights the six policy options for supporting a more inclusive smart city transition, summarised in the table on the right.
Further recent research (Lee et al., 2022) emphasises the role of integrated knowledge platforms as tools that facilitate open and multi-directional ainformation flow in a transparent manner. Using a multiple case studies approach, the authors investigated four cities (Amsterdam in the Netherlands, Seoul in Korea, Portland in the U.S. and Ho Chi Minh City in Vietnam), concluding that building an integrated platform is a critical prerequisite for the process of sustainable transformation to truly achieve smart cities. Platforms serve as a multifaceted avenue not only for the dissemination of information but also as a vital tool for fostering interaction and dialogue with citizens. Engaging with the local community to address concerns and gather feedback is key to ensuring support for the smart city transition. Indeed, citizens’ participation is another element that must be considered. As Przeybilovicz et al. (2020) illustrate, there are three typical patterns of specific citizen interaction: contestation, acceptance, and collaboration, which shape outcomes and patterns of the smart city transition.
Setting up a supervisory body for certification and quality assurance of digital infrastructure in cities.
1 2 3 4 5 6
Reinforcing capacity building of public administrations to strengthen digital skills and promote capitalisation through peer-to-peer learning.
Strengthening the role of national contact points to better link central and local realities, supporting capitalisation and upscaling.
Establishing helpdesks to provide technical support.
Researching and providing further evidence on the benefits and costs associated with remote working and service provision in cities.
Creating
Reconstruction Guidelines - Tourism
After a devastating event such as a war, the revitalisation of the economy must go through the recovery of the service industry: with regard to this aspect, tourism can play a pivotal role in supporting the overall return to economic growth.
The reasons for this are multifaceted: firstly, tourism generates significant revenue, able to bestow positive effects on suffering national accounts. Attracting more visitors leads to higher foreign exchange earnings, which can then be reinvested in rebuilding efforts. Additionally, tourism creates a wide array of job opportunities, from direct employment in hotels, restaurants, and tour operations to indirect roles in supporting industries like food production and crafts. It is important to remember that the vast majority of countries benefit from tourism, as it has been proved in more than one occasion that tourism sustain economic growth (as per the so-called tourism led growth hypothesis mentioned in previous chapters).
Tourism promotion can be used to improve a country's international image. It is common, for post-conflict countries, to struggle with negative perceptions; tourism can offer a platform to showcase their cultural richness, historical significance, and natural beauty, rebranding and reintroducing themselves on the global stage. This can also have an additional positive exposure not only toward tourists but also toward international investors and businesses, further bolstering economic growth.
The key to leveraging tourism for economic revitalisation lies in sustainable and inclusive planning: tourism infrastructure and services should be environmentally sustainable and culturally sensitive, ensuring that tourism development benefits local communities, preserves the country’s cultural and natural heritage, while avoiding negative spillovers such as overtourism, tourism degradation and irresponsible tourists. On this specific issue, niche tourism sectors (e.g. cultural, historical, or eco-tourism) can also attract diverse tourist demographics.
The next paragraphs illustrate how some countries affected by devastating events, such as wars, decided to reinforce the tourism sector to strengthen their overall recovery.
After their devastating civil war ended in 1994, Rwanda strategically positioned itself as a luxury tourism destination, focusing on its unique natural attractions, like the mountain gorilla trekking in the Volcanoes National Park. The efforts of the government to preserve its natural resources and promote eco-tourism have not only attracted a high level of international tourists but also established Rwanda as a model for conservation and sustainable tourism. An important recognition of these effort is the presence of the Nkotsi village in the UN Tourism “Best Tourism Villages” list, an international effort to showcase villages where tourism helps maintain cultural and traditional values, embraces diversity, offers opportunities, and protects biodiversity. The success of Rwanda's tourism strategy (one of the country's leading foreign exchange earners) led to significant economic growth, making it one of the fastest-growing economies in Africa.
After decades of civil conflict, Colombia, is increasingly becoming a popular tourist destination. Both the government and the private sector worked to rebrand the country’s image, focusing on its diverse cultural and natural offerings (e.g. the historic city of Cartagena, the coffee-growing region of Paisa, the Amazon rainforest). The promotion of cultural festivals, music, and cuisine played a crucial role in attracting tourists, fostering an improved international image as well as a significant boost to its economy, creating jobs, and economic development in war-torn regions. Colombia is also investing in the development of so-called techtourism abilities, which limit the negative phenomena linked to a booming tourism sector through the use of technologies that address negative external factors (e.g., utilising data analysis, platforms that are both technologically advanced and socially responsible).
Croatia's post-war recovery and integration into the European Union have been accompanied by a booming tourism sector. Thanks to the renowned beauty of its Adriatic coast, historic cities (like Dubrovnik and Split), and events like the filming of Game of Thrones series, Croatia repositioned itself as a key Mediterranean tourist destination, becoming the 9th country in the world for arrivals in 2019. This growth in tourism played and still plays a crucial role in the nation’s economic development, contributing significantly to its GDP and employment.
To conclude, tourism can indeed be a powerful tool for economic revitalisation in post-conflict countries, proven that it is well thought and:
1) environmentally and socially sustainable;
2) able to generate new job opportunities for local communities; and
3) up to the task of supporting the rebranding of the nation and attracting further international investment and cooperation.
Cartagena
Notes & Bibliography
NOTES I
1 Bassil, C., Hamadeh, M., & Samara, N. (2015). The tourism led growth hypothesis: the Lebanese case. Tourism Review, 70(1), 43-55. [1] Bassil, C., Hamadeh, M., & Samara, N. (2015). Гіпотеза економічного зростання, зумовлена туризмом: приклад Лівану. Tourism Review, 70(1), 43-55.
2 Seraphin, H. (2018). The past, present and future of Haiti as a post-colonial, post-conflict and post-disaster destination. Journal of Tourism Futures, 4(3), 249-264. / [2] Seraphin, H. (2018). Минуле, сьогодення та майбутнє Гаїті як постколоніального, постконфліктного та посткатастрофічного
Journal of Tourism Futures, 4(3), 249-264.
3 Due to a different classification, the economic sectors taken into account may not be precisely identical, but our preliminary control operations have tried to narrow down these discrepancies as much as possible. [3] Через
REFERENCES I
Alcalá-Ordóñez, A., Brida, J. G., & Cárdenas-García, P. J. (2023). Has the tourism-led growth hypothesis been confirmed? Evidence from an updated literature review. Current Issues in Tourism, 1-37.
Bakema, M. M., Parra, C., McCann, P., Dalziel, P., & Saunders, C. (2017). Governance in Shaky Societies: Experiences and lessons from Christchurch after the earthquakes. Environmental Policy and Governance, 27(4), 365-377.
Bassil, C., Hamadeh, M., & Samara, N. (2015). The tourism led growth hypothesis: the Lebanese case. Tourism Review, 70(1), 43–55. doi:10.1108/tr-05-2014-0022.
Transition towards Smart City: The Case of Tallinn. Sustainability 2021, 13, 4143. https://doi.org/10.3390/su13084143.
WEBSITE CITATIONS I
5
4 In this analysis the use of Mykolaiv-level data is somewhat contrasting against country-level data; such choice has been made due to the unavailability of comparability pre/post-conflict within urban contexts. However, this approach assumes that overall trends can provide reasonably relevant implications, even acknowledging all the inherent caveats. It's important to note that this comparison might not fully capture the unique post-conflict dynamics at the city level, and the findings should be interpreted with caution, considering the broader context and potential disparities between national and local developments.
Buzar Stefan (2008) Energy, environment and international financial institutions: the ebrd's activities in the western balkans, Geografiska Annaler: Series B, Human Geography, 90:4, 409-431, DOI: 10.1111/j.1468-0467.2008.00301.x
Cloke, P., & Dickinson, S. (2019). Transitional ethics and aesthetics: Reimagining the postdisaster city in Christchurch, New Zealand. Annals of the American Association of Geographers, 109(6), 19221940.
Dameri, R.P. Searching for smart city definition: A comprehensive proposal. Int. J. Comput. Technol. 2013, 11, 2544–2551.
Juhyun Lee, Julia Babcock, Thai Son Pham, Thu Hien Bui & Myounggu Kang (2023) Smart city as a social transition towards inclusive development through technology: a tale of four smart cities, International Journal of Urban Sciences, 27:sup1, 75-100, DOI: 10.1080/12265934.2022.2074076.
Lević, B., Đukanović, L., Radivojević, A. et al. Potentials for a complex and integrated refurbishment of post-war housing stock of Serbia. Energy Efficiency 16, 93 (2023). https://doi.org/10.1007/ s12053-023-10171-z.
Lu, H.; de Jong, M.; Heuvelhof, E.T. Explaining the variety in smart eco city development in China-What policy network theory can teach us about overcoming barriers in implementation? J. Clean. Prod. 2018, 196, 135–149.
Erico Przeybilovicz, Maria Alexandra Cunha, Stan Geertman, Charles Leleux, Ank Michels, Zsuzsanna Tomor, C. William R. Webster & Albert Meijer (2020): Citizen participation in the smart city: findings from an international comparative study, Local Government
Cities around the world generally grow over the long term as their populations increase and economies become more complex. In contrast to this prevailing trend, there are notable examples of cities which have reduced in size – or disappeared altogetherdue to a range of hardships including war, famine, natural disaster, sociocultural conflict or economic decline.
Managing a city in the aftermath of hardship is often difficultparticularly when resources are scarce and pressure, both political and sociocultural, is high. Many post-hardship cities which experienced a loss of building stock understandably seek to rebuild quickly, with emphasis on providing accommodation for displaced households. Through this process, restoring the former glory of the city is not always possible, which transforms the posthardship city into a lesser form of itself. Examples are plentiful, particularly in post-war cities throughout Northern and Eastern Europe, where reconstructed cities lack their pre-war richness and character. The resulting poor urban quality, often accompanied by a lack of social infrastructure or industry, can dampen the outlook of the local population and its prospects for long-term success.
Fortunately, there are encouraging examples of cities which have taken a different approach to managing their post-hardship journey. These cities have acknowledged the changes to the drivers that once fuelled their growth to recognise that a return to their former scale and significance is not possible or necessary. Rather than seeking continued growth as most cities do, these shrinking cities accept a reduction in size and complexity – managing decline to unlock new possibilities for a small but highly resilient population.
The immediate aim of the shrinking city is often to curtail further population decline, retaining those who remain and empowering them with the tools to realise new opportunities that may have not been previously possible. Often driven by hope and loyalty towards their city, the remaining citizens are brought together with a new sense of purpose and community. Reconstruction of their city is strategic, aiming to make better use of land, improve mobility and environmental harmony, and reinvent key industries to enable long-term resilience, even if at a slower rate of growth. In this way, the shrinking city can become a success story, transforming depleted places into inspiring communities.
In the following pages, we present two exemplary shrinking cities which offer ideas for how Mykolaiv can approach its post-conflict reconstruction, should it have to face a shrinking scenario.
Shrinking cities:
Shrinking Cities| Detroit
Detroit has long been associated with the golden era of automobile production in the United States. Dubbed the ‘Motor City’, Detroit is home to America’s ‘Big Three’ automobile manufacturers –Ford, General Motors and Chrysler - which grew during the midtwentieth century to become an economic powerhouse and drove the city’s growth. At its peak in 1950, Detroit was home to over 1.8 million people, making it the fourth most populated city in the United States at the time. Detroit’s socioeconomic standing also gave rise to Motown music and the city has been considered a major contributor to arts and design culture, being named a "City of Design" by UNESCO in 2015.
Detroit’s golden era started to decline with the decentralisation of the automobile industry, which resulted in a population exodus from the city centre. As automobile factories began being built further away from Detroit, middle-class populations and the business that supported them started leaving central Detroit for the suburbs and outlying cities. By 2012, Detroit had 40 square miles of vacant land, nearly a third of its total 139 square miles, with 1-in-3 Detroit properties foreclosed in the period between 2005 and 2015. As a result, Detroit’s tax base was depleted, making the city unable to raise enough revenue to support its infrastructure or remaining population of mostly underprivileged minorities.
Recognising that vacant properties sitting in decay only encourages further blight and illegal activity, in 2014 the city decided to start demolishing derelict buildings in its core and repurposing vacant lands into green space, farmland and other more productive uses. City planners also set up several initiatives to tackle land use issues, including the Greenways Coalition, which looked to improve the safety and mobility of commuters in Detroit by connecting different neighbourhoods via bike lanes and running trails.
SHRINKING
• Detroit experienced rapid decline in population and economic output after automotive decentralisation
• 61.4% decrease in population from 1950 to 2010 (from 4th most populous city in the US to 27th)
• City demolished 250,000+ homes in the core (10x the number of homes destroyed during bombing of Dresden in WWII)
• By 2012, Detroit had 40 square miles of vacant land out of a total of 139 square miles. (1/3 vacant land)
REINVENTING
• Initiatives to tackle land use issues:
• Greenways Coalition:
• improving safety and mobility of commuters in Detroit
• connecting different neighbourhoods via bike lanes and running trails.
• Ford and Google:
• collaborating to develop the Innovation District in Michigan Central
• developing new mobility technologies and creating new workforce development opportunities through technical certifications
• Live6 Alliance:
• small business coalition revitalising economic growth in depilated commercial corridors with place-based urban planning
QUICK FACTS
In parallel with altering the physical landscape of the city, city planners have also partnered with large businesses to attract inward investment in the city. In partnership with Ford and Google, the city has placed a major effort on repurposing Detroit’s former railway station into the Innovation District - a new mixed-use business district aimed at designing the future of U.S. mobility. The Innovation District is also focused on creating new workforce development opportunities through technical certifications, addressing the need to improve socioeconomic prospects for the city’s largely unskilled population.
City planners in Detroit also understood that achieving widespreading economic uplift to the city requires working with not only large businesses/investors, but also with small investors and members of the local community. For example, to address growth of small business in Detroit, non-profit organisations such as Live6 Alliance are providing networking opportunities, knowledge sharing and implementation support to encourage small business to return to depleted commercial corridors.
By working with both large and small businesses, Detroit is now able to bring economic uplift to a wider range of users and revive the city at different levels simultaneously, spreading economic resources more equitably.
Detroit’s journey as a shrinking city is only beginning but is already showing promising signs of positive transformation. Among other indicators, Detroit’s unemployment rate recently fell below 7% for the first time since 2000, suggesting that the city is once more attracting new jobs and training its people for tomorrow’s enterprises.
Shrinking Cities | Dresden
Referred to as the ‘German Florence on the Elbe’, Dresden flourished over a long history as the capital and royal residence for the Electors and Kings of Saxony, becoming a hub of magnificent architecture, arts and culture. After the city was largely destroyed during World War II, German authorities prioritised the reconstruction of its historic centre in the early 1990s, rebuilding the most acclaimed buildings and public spaces to revive the rebirth of the city.
Though the city was reborn culturally, it remained structurally weak as a city built on its old industrial heritage. As part of the economic and social reforms of Germany in the 1990s, the government started to move away from a state-directed economy, leading to rapid decline of a number of key industries in the Dresden area. These changes triggered high unemployment rates and high outward migration from Dresden. When also combined with decreasing birth rates, the city lost 60,000 of its 500,000 residents within the decade from 1989-1999.
Though it was evident in the 1990s that the city should form a new trajectory around its declining population, shrinkage was political taboo at the time. Policy makers and experts in the administration continued to project growth and population increase despite strong population losses, which delayed appropriate corrective action.
Finally, by 2001, the strategic plan for Dresden was revised to focus on a model of the ‘compact European city’.
Instead of targeting growth and outward expansion, priorities were placed on creating an attractive urban centre, reducing land consumption and establishing a stable population. Federal states established an urban restructuring policy, with deconstruction and conversion of housing areas and emphasis on the revitalisation of the city centre. Nearly 6,000 blighted housing units were taken down and converted into green spaces, and state incentives were put in place to jumpstart redevelopment.
REBUILDING
• Once known as the ‘German Florence’ on the Elbe, Dresden largely rebuilt after extensive WWII destruction.
• Culturally reborn, but structurally weak as an old industrialised city.
DECLINING
• After 1990, breakdown of the state-directed economy caused economic decline, industrial regression, and high unemployment rates.
• Due to out-migration and decreasing birth rates, the city lost 60,000 of its 500,000 residents within one decade (19891999).
• Through the 1990s, shrinkage was political taboo. Policy makers and experts in the administration were unable to cope with the issue in a constructive way.
SHRINKING
• 2001 strategic plan for Dresden focuses on a model of the compact ‘European city’ instead of growth. (attractive urban centre, reduced land consumption, stable population)
• Federal states established an urban restructuring policy with deconstruction and conversion in housing areas and emphasis on the revitalization the city centre.
• Growth has been highly cyclical due to misalignments between targets and reality.
• Today in Dresden, areas of shrinkage and decline are in close proximity to prospering and wealthy communities (urban patchwork)
QUICK FACTS
This new model produced a rapid rise in investment and development, disproportionally higher than actual demand, fueling a cycle of investment boom and bust. More recently, Dresden has gone through further cycles of renewal and investor interest, working to minimise overoptimism and sustain a stable – and now growing - population. The city is also striving to support the region’s recent rise of high-tech industry and rebuild its tourism sector to sustain economic growth. Nevertheless, in Dresden today, areas of shrinkage and decline sit in close proximity to prospering and wealthy communities, resulting in an urban patchwork and an acknowledgement that the future is still unpredictable.
Growth in Dresden has been erratic due to misalignments between targets and reality. During times of population loss, the city optimistically projected the population to increase. As the population later stabilised, governing bodies and planners projected continuous shrinkage. And as growth began, forecasts were based on a stable population development. The discrepancy highlights the need to account for a time lag in making projections, enacting policies and realising results.
Key takeaways for Mykolaiv
KEY TAKEAWAYS FROM DETROIT
Detroit’s story offers several key considerations for Mykolaiv after the conflict recedes locally. At the urbanistic level, it could be beneficial to avoid creating long-term urban decay by promptly demolishing buildings which are damaged beyond the point of restoration. Vacant land in Mykolaiv offers an opportunity to reevaluate land uses, looking at the wider structure of the city to reconnect different zones and improve mobility and strengthen ecological/recreational corridors.
Economically, Mykolaiv should look to stimulate growth by providing incentives to encourage both large and small businesses – spreading benefits more equally across the population. In attracting investment from large international companies, the needs of the local population must also be accommodated. New jobs and training opportunities are essential, but should happen in parallel with rebuilding the city’s social infrastructure and sense of community at all socioeconomic levels.
Mykolaiv can also learn from Detroit to see that its own shipbuilding legacy, much like Detroit’s automotive legacy, can become a base upon which to attract investment in new and related industries to help Mykolaiv remain globally competitive.
KEY TAKEAWAYS FROM DRESDEN
Dresden shows us that Mykolaiv will need to first need to align its urban strategy with the reality of demographics post-conflict. Chasing growth for political or economic gain – though attractive – must be consistent with the rate of improvement in industry and the general trends of population change, considering the demographics of the existing population and the prospect of attracting new people/returnees to Mykolaiv.
Assumptions and forecasts about demographics will need to be revisited regularly to confirm that economic policies and incentives are aligned and proportional to actual needs and market capacity. These targets will need to be clearly articulated to potential investors, with progress monitored regularly to avoid overstimulating the market and creating unwanted cycles of booms and busts. Strategic flexibility in planning and forecasting will be needed in Mykolaiv, just as is needed in Dresden, to address variability and sustain positive progress.
Furthermore, whilst reconstructing important landmarks and historic buildings in Mykolaiv should help to restore confidence that the city is healing and moving forward, this effort must happen in parallel with creating the right eco-system of economic growth, social services and urban renewal. A balanced and comprehensive rebirth strategy will help to retain a stable population, a first step towards possible expansion of the population in the future.
Conclusions
Learning from Detroit and Dresden, among other examples of shrinking cities, we can understand that managing the postconflict city requires an approach that is multi-faceted and peoplecentred.
The strategies used to manage the trajectory of the shrinking city must balance economic incentives and investment opportunities with the needs of the local citizens. Participation and engagement of the local population is critical to success – as it must always be remembered that the shrinking city must first serve those who have live through its evolution.
On this page, we summarise nine strategies to managing the shrinking city which Mykolaiv should consider using in its own reconstruction effort. The focus of the strategies is predominately socioeconomic, as a strong community and resilient local economy are key to enabling and sustaining the shrinking city. A stable and economically-empowered population can then focus on the reconstruction of a new spatial masterplan, complete with both the core needs and desired amenities, that will come to define the identity of the new city.
Ultimately, Mykolaiv will need to tailor its own palette of strategies that suit its particular circumstances and outlook for the future. But the key message is that Mykolaiv’s reconstruction does not have to adopt a ‘bigger is better’ or ‘more is better’ mentality –especially if such growth targets would fuel over optimism and economic instability over the long run. Smaller may be better if properly crafted to support long-term improvement of the cityincluding its environmental, social and cultural infrastructure.
Regardless of scale or degree of ambition, Mykolaiv’s reconstruction strategies should be grounded in local needs, engaging for local citizens and clearly articulated to external stakeholders to guide the city towards a bright and resilient future.
Engage local communities
Use an inclusive participatory approach to involve all citizens in the planning process.
Build in flexibility
Accept that achieving objectives will not be linear. Strategic flexibility is more important than the strategy itself.
Build partnerships
Align local government, banks, corporations, special interest groups and local communities around common goals.
Diversify investment
Scale to the tax base
Define the size of the shrinking city in proportion to its tax base and plan for incremental growth.
Moderate targets
Provide reinvesment opportunities for both large multinationals and small/ medium local businesses. Revitalise industry Upgrade industrial positioning in line with evolving trends to maintain global competitiveness.
Recognise that an overlyaggressive growth oriented strategy can intensify negative effects of shrinkage. Be optimistic, but also realistic.
Leave no one behind
Create equal opportunities for all, especially the poorest. Enable the next generations.
Align market expectations
Understand and communicate real changes in demand for residential, office, and commercial space to make manage investor ‘mania’ productively.
Benchmarks: Port Cities
Port Cities: Introduction
Port cities have always proven to be able to prepare and respond to significant threats. Over time, they have been capable to react and regenerate themselves after natural and man-made disasters, or political and economic transformations.
By definition, port cities are a particular and unique urban type. Firstly, they are tied to a specific location as the meeting point between water and land. Their infrastructure such as docks, wharfs cranes and warehouses, and thus the investments connected to those, require long-term planning. Further, the erections of such important structures ask for a long process of adaptation by the population, which might as well be defined as resilience of the port city population.
Concerning the commercial activities coming from the port itself, one has not to forget how crucial they are for the economy of the region and their nation. These activities require collaboration among multiple partners and stakeholders.
Thanks to all this, port cities are a culmination point of innovation, exchange of ideas and intertwining of different cultures and societies.
In the upcoming pages, five case studies will show how port cities around the world have coped with different challenges, and how port infrastructures have proven to be highly adaptable and responsive.
Photo: Dmytro Udovytskyi
Port cities | Rotterdam, Netherlands
The map shows how the Port of Rotterdam has grown from 1800 (marked in orange on the right) to 2008 (marked in yellow on the left). The reason of this development is linked to the changes of standards and size of commercial activities in the port.
The historical images show the changes in the city of Rotterdam after the bombing of War World II and how it looks today. The city gradually evolved and the port expanded accordingly.
Throughout the years, segments of the port have been dismissed, or the intensity of their growth slowed down. Given the current need of building 1 million new homes in Netherlands by 2050, the municipality of Rotterdam started to replan the future M4H district. It will be redeveloped as a productive, residential and educational hub hosting by 2035 up to 50,000 new homes.
M4H project shows how port areas hold a truly high value for future city developments. Especially when in proximity with the city centre as in this case, the project offers the opportunity to change completely its function, always maintaining its strong character as a true landmark in the urban fabric.
+ Port Redevelopment
+ Reuse of the Old Harbour /
+ Citizen Engagement /
+ Integration Port-City/
Port cities | Hamburg, Germany
Hamburg has undergone several redevelopments of its port areas. The first of them was carried out in the 1980s when part of the port spaces became underused and new container terminals had to be built closer to the sea. The largest transformation is nevertheless the Hafencity masterplan. The area is strategic and connects the city with the Elbe river. Since there was no space for new container terminals, the city decided to explore the possibility to completely reverse the use of the port area, bringing new housing, offices and commercial activities along the river.
Given its extension, Hafencity was divided in multiple sub-areas to be developed. The transformation of 150 hectares into 10 distinct quarters include new functional mix and several flooding strategies, such as several access points to buildings at different levels or the flexible design of public spaces to be flooded at certain points of the year. A series of landmark projects as well has attracted visitors and the international attention on the whole redevelopment.
Flooding
Functional Mix/
Public Spaces/
+ Transformation Strategies/
Port cities | Baltimore, US
The Inner Port of Baltimore represents a historical seaport, tourist centre and a landmark for the city.
The Inner Port can be described as a model for post-industrial waterfront redevelopment. The riverfront hosts several activities such as bars, restaurants, aquarium, museum, and offices.
The project includes several major components: state-of-theart commercial and office structures along the waterfront, new multifamily residences and commercial uses at the street level
A low compulsory build-to cornice line for buildings along the waterfront and height limits ensure consistency in the street scape, Moreover, the waterfront features parks, public areas and a wide promenade.
The aim was to improve the pedestrian paths, green spaces, soft mobility and accessibility to the inhabitants.
The redevelopment of the Inner Port from a decaying city of the 1950’s to a sustainable and flourishing commercial, recreational and tourist destination can be credited to advanced services, usage of modern technologies, promotion of tourism, leisure and shopping activities. These factors resulted in an enormous economic recovery and improved the urban environment.
+ Integration Port-City/
+ Overlaps of Urban Layers/
+ Pedestrian and Green Strategies/
+ Functional Mix/
Port cities | Le Havre, France
Port areas, even after having been dismissed, have a really high potential if revitalised through new constructions and injection of new functions. The Maritime Cultural and Educational Centre in Le Havre had an extremely positive impact on the area of the commercial seaport.
The Havre Port Centre is a place of education, interpretation and meetings allowing to discover the industrial-port environment in all its diversity.
The Centre is a centre of knowledge where different activities and professions are taught. Indeed, the National Maritime School also trains young professionals in seaport activities in order to gain future technical figures in the maritime sector. Hence, it has become a great place of exchange which gave new life to the entire area while also transmitting the city's specific expertise to future generations.
The centre currently hosts citizens, school and tourists, offering learning paths to discover the harbour. Formats adapt to the different visitors. Thus, making the Le Havre Port Centre a hub of education, interpretation and collaborations.
+ Educational Centre /
National Maritime School
+ Commercial Seaport /
+ Professional Figures
Le Havre Old
Port cities | Downtown Boston waterfront, US
Port cities demonstrate a great deal of resilience and ability to adapt to different scenarios. In a time when climate change represents a threat for all cities on the planet, port cities find themselves in a more vulnerable position.
The city of Boston has undergone a series of analyses in order to forecast and prepare to every possible scenario occurring in the next fifty years.
Predictions and visualizations show how the rise of the sea level and the rise of more violent climatic events could severely hit the city.
The waterfront thus became also a way to protect the city from climate change through their redevelopment.
Buildings at risk of being flooded will be raised and adapted. In the meantime, protective parks and pathways and elevated landscapes will provide further protection to the inner city.
The aim is indeed to improve low mobility paths, green spaces and climate change resilience strategies. The new network of green areas and connections will also stitch together existing neighbourhoods, bringing new services and life quality to the residents.
+ Waterfront Connectivity/
+ Activation Programs/
+ Climate Change Resilience/
+ Slow Mobility and Public Spaces/
Port cities | Key takeaways
Rotterdam, Netherlands
Port cities can take advantage of dismissed areas of the port and replan their functions. In the case of Rotterdam, the municipality planned to completely redevelop one large segment of the port, which will host up to 50,000 inhabitants.
Hamburg, Germany
Hamburg has undergone several redevelopments of its port areas. The largest transformation is the Hafencity masterplan which accounts to 150 hectares, divided into 10 different districts.
Baltimore, US
The Inner Port of Baltimore can be described as a model for post-industrial waterfront redevelopment. A series of well-thought and strict regulations allowed the port to become a new vibrant neighbourhood.
Le Havre, France
Dismissed port areas have a high potential if revitalised through new constructions and functions. Indeed, The Maritime Cultural and Educational Centre in Le Havre had an extremely positive impact on the area of the seaport.
Downtown Boston Waterfront, US
In a time when climate change represents a real threat, port cities will face new challenges. Boston will use its waterfront to prepare to all possible climatic events and improve the mobility and green network of the city.
• Integration Port-City/
• Overlaps of Urban Layers/
• Pedestrian and Green
• Educational Centre
• National Maritime School
• Functional
•
• Commercial Seaport
• Waterfront Connectivity/
• Activation Programs/
• Slow Mobility and Public
• Climate Change Resilience/
Benchmarks: Landscape Strategies
Landscape and Open space strategies | Introduction
Over the last century, several cities have undertaken virtuous sustainable initiatives to rebuild post-conflict or post-crisis, implementing a green regeneration approach in the urban environment.
This chapter focuses on cities or neighborhoods that have the main objective of recovering the relationship between water and city, with the aim of highlighting examples that may be useful for Mykolaiv and its relationship with the river.
The selected urban regeneration cases base their action on the protection and enhancement of the landscape and public space as values from which to activate urban regeneration practices.
The cases mainly concern two categories of cities: cities that have implemented virtuous processes of regeneration of riverbanks and river areas and cities that have implemented regeneration processes of port or industrial areas located along the waterfront with the aim of recovering the relationship between city and water.
The selected case studies present strategies at different scales, from the urban scale to the neighbourhood scale.
This research aims to share best practices from ambitious transformation processes at all scales to define development challenges for the Mykolaiv of tomorrow.
Green cities | Tallinn, Estonia
With a population of 393,222 inhabitants, Tallinn is the largest city in Estonia, located on the coast of the Gulf of Finland in the Baltic Sea. The country, reborn after the decline of the Soviet Union— no longer constrained by the previously restrictive regime—has undergone many reforms in recent decades, including efforts to achieve sustainable development. As one of the best-preserved medieval cities in Europe and a UNESCO World Heritage Site, Tallinn is characterized by a diverse and mosaic nature of its landscapes and communities, which also serve as habitats for rare species. In 2021 the city won the Green Capital Award for 2023 because of its systemic approach to green governance and interlinked strategic goals reflecting the ambitions of the European Green Deal. Tallinn is following the development strategy “Tallinn 2035” which addresses carbon neutrality, climate adaptation, innovation, health, mobility (supported by a free public transport system), biodiversity, circular economy, sustainable energy, and food production.
The vision of Tallinn is implemented through many strategic goals, which will be achieved through the cooperation of the entire city organisation and the citizens, communities, entrepreneurs, local authorities in the urban region and state and international partners. As a European Green Capital, one of Tallinn’s main objectives is to develop its green network and interconnect green areas. A strategy to support the city’s biodiversity was the creation of a “Pollinator Highway” along a former railway embankment and a high-voltage power line corridor. The 13 km long meadow-like natural environment rich in species acts as a green corridor for biodiversity, green mobility, and public space passing through and connecting different urban and natural environments. Another strategy undertaken by the municipality to improve the green network was to preserve and make the Pääsküla bog (a natural swamp area) accessible, connecting the surrounding nature to the city.
Being an important part of the green mobility network included in the Tallinn 2035 development strategy, Klindi Park will be transformed into a coherent and integrated recreational area for all, defined by biodiversity and nature-oriented solutions. Numerous relevant measures, such as stormwater management systems and remodelling of streets are in place and new actions are planned as for example the Green Twins project. This technology driven strategy connects the built environment, the vegetation, and people by using urban digital twins, bringing forward the importance of urban vegetation for the well-being of citizens, to forecast and visualize the temporal and seasonal changes in urban vegetation, as well as to involve citizens into designing urban green areas.
Post industrial cities | Nantes, France
Since its inception in 2000, the Nantes Island Urban Regeneration Project has been guided by major policy objectives: to build a metropolitan centrality, to reconnect the city's relationship with the Loire, and to make the city accessible for all. Propitious to the development of artisanal and then industrial activities, the Loire became, at the end of the 20th century, one of the structural elements of an urban project destined to reinvent the island's destiny to adapt to new economic and social challenges.
Starting in the 17th century, the island of Nantes became an enclave of industrial activities and especially naval shipyards; starting in 1960, a process of urbanization, mostly residential, began in the areas that remained uncultivated on the island. In the 1980s, the industries were progressively decommissioned, and during the 1990s, the team led by the new Mayor of Nantes the 10-year study phase leads to a desire to reconsider the island as a whole and to define an urban renewal project.
In the early 1990s, the first transformations materialized with the redevelopment and re-functionalization of the Etats Station and the Nantes Ateliers building, and in the 2000s the Plan for the Island was ready to be implemented. The founding principle of the plan is "une ville durable," or that of a city that can adapt to future changes and challenges facing the 21st century.
A plan that relies first and foremost on the redefinition of public space as the plot that shapes the environment and on which the neighborhoods of the future will be built. The regeneration of the landscape and public space and the reconstruction of the relationship with the river will form the framework in which the new functions will fit, so in the different sectors of the island new buildings for commerce, activities, services, and teaching begin to be inserted to serve the mainly residential function of the east of the island. The landscape texture provides a glue and at the same time an ordering fabric, which succeeds in connecting the different neighborhoods of the island and at the same time giving them a different and singular identity.
Nantes
Post industrial cities | Bilbao, Spain
With the reform of the General Town Plan in 1982, the municipality of Bilbao undertook a vast operation to rehabilitate the urban periphery. The largest and most important realisation concerns the 'Abandoibarra' area, that saw the transformation of Bilbao’s former industrial centre in an international cultural district and tourist destination. Two-thirds of the 30-hectare site is dedicated to parks and open spaces, creating a public oasis and grounds for a suite of buildings. The overall design weaves new development into the historic old city with particular emphasis on expanding the amount of textured green space and incorporating sustainable design practices.
The recent redevelopment of brownfield sites and the redevelopment of areas along Bilbao's Nervion River are part of the city's urban planning framework. Bilbao is not only represented by the Guggenheim Museum, but it is a city undergoing economic revitalisation, which is transforming itself from a crisis of industrial activities into a city of the service sector and culture. The river waterfront is the most significant image of this transformation.
A new light rail runs along the water’s edge on a width of green lawn to slow down traffic and to give continuity to the green space. Three varied urban landscape interventions define the broader whole, including the Campa de los Ingleses Park, Plaza Euskadi and The Garden That Climbs The Stairs.
Campa de los Ingleses Park defining lines mark undulating paths that create topographic waves that mediate a 10m elevation difference across the park and create a series of curving terraces. The park is a sculpted, seamless urban experience that unifies Abandoibarra and the Nervión River. Plaza Euskadi is conceived as a place of passage with a direct central path that simultaneously sews the built environment together and creates a place for rest and recreation. Three public “pockets” hook onto the central path, offering a distinctive character of seating, planting, and activity. The Garden That Climbs The Stairs creates a dynamic urban space unlike any other in the world. It is a garden of contrasts: the contrast between native and exotic plants, between the red flowers and the green grass, between the green grass and the grey paving.
Post industrial cities | Trieste, Italy
Formerly Known as “Porto Vecchio”, the old port of Trieste now comes back to life and becomes “Porto Vivo”. The aim of the regeneration project is to give back to the city a disused port area and restore its connection to the surrounding urban fabric.
In the planning for the regeneration of the area, the establishment of activities related to the sphere of cultural and creative industries in support of the tourism sector and the museum system has been proposed, areas for outdoor sports and entertainment were foreseen and the possibility of allowing the eligibility of the residential function was also considered; all within the framework of a mobility system based on sustainability, that discourages the use of private cars.
The interventions foresee the progressive transformation of the spaces through their valorization, the realization of the infrastructural nets, the enhancement of the transport and the connections inside of the area and to the city.
The Linear Urban Park acts as a trait d'union that seamlessly connects the Old Port to the city, the sea and the Carso.
The landscape project is based on the strategic principles for designing a new part of the city such as continuity with the flows and spatial characteristics of the consolidated city and urban waterfront, and at the same time as an extension of the natural space of the Carso and the waterfront. In this way the city enters the Port, and the Port enters the city, without boundaries, reactivating the spaces that has remained inactive for a long time.
The general approach to landscape design aims to strengthen and develop the quality and quantity of usable open spaces, to constitute an urban ecosystem that enhances the area ecologically and socially. The open space constitutes the essential element to build the overall vision and new identity of the Port. The softscape becomes a widespread and diffuse character, from the Nature axis to the green cuts, to the piers, to the roofs, to the waterfront towards the Barcola embankment.
Capillarity of public spaces
Porto Vivo , an urban forest between the Karst and the city |
Post industrial cities | Aalborg, Denmark
Постіндустріальні
Aalborg, that was once the country’s second-biggest industrial town and now the fourth-largest city in Denmark, has evolved into a research and knowledge centre.
Its cultural activities have moved into the former factory buildings along the fjord, where the decommissioning of the industrial activities created the potential for an alternative use of the harbour. The first phase of the Masterplan links the city’s medieval centre with the adjacent fjord by creating new openings in the urban fabric and a new Waterfront promenade. A new relationship between city and fjord is created, and what was formerly a backside is turned into a new, highly attractive front. The overall ambition of the transformation has been to give the use of the port back to the city, and to link the central urban districts to the fjord. On a social level, the entire design is primarily focused upon creating meeting spaces for people and providing an important upgrade of the local living quality.
In the second phase of the project, following the first Masterplan, the central idea is the continuation of the waterfront promenade as a “marsh” in combination with a plinth upon which the buildings are located. The plinth forms a raised base which unifies the area’s distinctive, freestanding buildings including university buildings, student housing and the concert hall. The urban plinth provides flood protection, and the incisions carved into it create a series of spaces with varied functions – protected from the wind by the plinth’s sides, which are designed as seating steps.
Public plazas are integrated into the promenade sequence, creating lush green spaces with dense groves of trees. The planting consists of trees, shrubs and grasses that are native to North Jutland fjord landscape.
On a social level, the entire design is primarily focused upon creating meeting spaces for people of all kinds. This includes the wide array of immediate neighbours surrounding the waterfront. Especially the historic urbanity suffered a lack of green amenity space, and as such the new waterfront provides an important upgrade of the local living quality.
Nantes Island regeneration project started in 2000 with the aim to reconnect the city's relationship with the Loire, and to make the river more accessible for all. The regeneration of the landscape and public space and the reconstruction of the relationship with the river form the framework in which the new functions fit, so in the different sectors of the island new buildings for commerce, activities, services, and teaching begin to be inserted to serve the mainly residential function of the east of the island. Some buildings of the island’s industrial past have been preserved and they have been given new life as attractions for the island.
Abandoibarra area went from a former industrial center in an international cultural district and tourist destination. Two-thirds of the 30-hectare site is dedicated to parks and open spaces, creating a public oasis and grounds for a suite of buildings. The overall design weaves new development into the historic old city with particular emphasis on expanding the amount of textured green space and incorporating sustainable design practices. The river waterfront is the most significant image of this transformation. 3
Old Harbour, Trieste, Italy /
For the regeneration of the old port of Trieste the following actions have been planned: the establishment of activities related to the sphere of cultural and creative industries in support of the tourism sector and the museum system; the provision of areas for outdoor sports and entertainment; the integration of a mobility system based on sustainability and the enhancement of the transport and the connections inside of the area and to the city; the provision of a Linear Urban Park as a trait d'union that connects the regenerated site to the city, the sea and the Carso.
Aalborg Waterfront, Aalborg, Denmark /
Aalborg’s harbour front has undergone comprehensive renovation in recent years. The former bustling industrial area is now home to cultural activities in new architectures, stunning gastronomy and big city life all the way down to the water. The overall ambition of the transformation has been to give the use of the port back to the city, and to link the central urban districts to the fjord. On a social level, the entire design is primarily focused upon creating meeting spaces for people and providing an important upgrade of the local living quality.
Green cities | Vienna, Austria
The city of Vienna has always been very linked to its river, the Danube, since ancient times for the transport of people and goods, today, the artificial Danube Island and the New Danube are crucial elements in Vienna’s green and blue network as well as recreational and social point of reference for the city. The centrality of the river for this city has been reached through regeneration processes that find the main cause and starting point in solving the problem of flooding. Danube Island and its riverfronts are the result of a planning process that spanned twenty years, the basis was laid with the first flood-protection project in the 1870s, when the branching Danube was straightened into one main riverbed with a large parallel 450 metre wide inundation area. The inundation area on the left bank developed into an informal recreation area, users were attracted by the fact that it offered multiple recreational uses and a more natural and uncontaminated environment.
A second flood in 1954 made flood protection an imperative once again and led to the construction of a straight flood-relief channel and an island, and the goal of the municipality since the beginning was to make this island a part of the city, with recreational spaces for sociality. In order to address political and technical solutions for the future of this area an interactive planning process, the “Vienna Model”, was developed. This model brought together different actors and decision-makers in planning, urban, and landscape design as well as in water engineering. In the end, the different planning approaches gradually merged into one project, which stressed the infrastructural, ecological, and societal functions of the river within the urban network. The final landscape design acknowledges the site’s potential for recreational activities and upgrades the landscape qualities of the former inundation area by shaping the island’s topography and bank line and offering access to the New Danube as a place to swim.
The design categorizes the island into three sections of diversified character and potential. The middle section of the island, which is close to residential neighbourhoods on both sides of the Danube and connected to public transport, is designed like an urban park; in contrast, the northern and southern sections of the island are designed to support processes of natural succession. However, people are invited to use these areas that offer contrasting experiences of active recreation – such as running, walking, cycling, swimming, and boating – and wildlife observation. Over the last decades, Danube Island has turned into a riverscape of major recreational and ecological importance for the city. Today, three underground lines link the island and the New Danube with the city centre and zones of new urban densification on both sides of the river.
Danube Park and Danube Island development in Wien |
+
+ Multidisciplinary approach
River cities | Munich, Germany
For Munich residents, the unpredictable Isar was for a long time one thing above all else: a threat. As a result, from the eighteenth to the twentieth centuries, the river was “tamed” by means of canals, weirs, and embankments. The Isar was still a typical wild alpine river in the early nineteenth century, with vast gravel islands and sandbanks and a continually changing riverbed. After frequent flooding in the mid-nineteenth century, the riverbed was canalized. The Isar Plan's main goals were to increase flood control, biodiversity, and recreational quality. The formerly fixed, canal-like riverbed has been transformed to a riverbed of varying width with gravel banks and gravel stone islands which develop dynamically in a system of coming and going. Through the widening of the main channel, incorporating the forehands along the river and the floodplains, average discharge and flood runoff has been improved and has given more space to the river. These measures not only restore a near-natural appearance of the Isar river, but also improve the living conditions and types of habitats for flora and fauna characteristic of the Isar. Primary goals of the Isar-Plan are:
• Flood control in Munich is improved by enhancing the river stretches water retention capacity;
• Improvement of wild species habitats, considering concerns such as: ecological upgrading of the Isar River, morphological processes, longitudinal and lateral continuity, natural behaviours of animals and plants, biodiversity conservation, and water quality;
• Improvements in recreational quality because of the increased demand for recreational space within a crowded metropolitan region, such as access to water, appealing terrain, and views. The Isar River restoration project in Munich achieved the first German award for river development in 2007. The most evident benefits of the Isar River restoration are relate to:
• Increase communities’ sense of ownership and social interaction
• Improve water quality.
• Increase well-being.
• Provision of health benefits.
• Changing image of the urban environment.
• Social inclusion.
• Increase social interaction.
• Increase stakeholder awareness & knowledge about NBS.
• Increase willingness to invest in NBS.
• Reduce load to sewer system.
• Increasing infiltration.
• Reduce run-off.
• Flood peak reduction.
• Reduce drought risk.
• Reduce flood risk.
River cities | Vancouver, Canada
The City of Vancouver is embraced by water and has always been a coastal community, defined by its proximity to the ocean and the river. Vancouver Waterfront during the 20th century has been the subject of various regeneration projects related to the recovery of dismissed port areas or industrial areas. Today Vancouver is facing major challenges related to sea-level rise particularly in some areas of the waterfront, such as the area currently known as False Creek. Starting from this situation the city of Vancouver has started a process of involvement of a multi-disciplinary team, from 2020 to 2022, for the realization of a collaborative strategy that can make the city's waterfront adaptable and more resilient to current and future coastal flooding: the strategy shows how the False Creek shoreline can adapt to rising sea levels while accommodating urban development and fostering ecological revitalization. The Sea2City Design Challenge has tasked the design teams to consider the impacts of 1 meter of sea level rise by the year 2100 and an additional 1 meter of sea level rise by 2200.
The area of False Creek has been divided into pilot sites, situated in the north and south sides of the creek. The pilot sites has been chosen according to the different land use typologies that can be found along the shoreline. The vision for the North Shore sites envisioned the gradual transformation of the sites to a ‘rewilded’ urban waterfront that will help redefine Vancouver’s relationship with water and become a zone of cultural adaptation in the city that enables the evolution of an inclusive society. This approach helps restore the natural shoreline to buffer new development while helping improve False Creek water quality and rainwater management. The team imagines a shoreline that creates room to safely host more common coastal flood events in the future and expand public access to the shoreline. The vision for the South Shore envisions an incremental development where existing buildings are gradually shifted south beyond a blue-green corridor that would provide improved flood protection for areas behind it. This green and blue recreational corridor provides pedestrian and cyclist connections between the two sites along a restored shoreline featuring salt marshes, forested berms, and intertidal habitat areas. The whole strategy proposes also opportunities to transform how rainwater is managed at the level of the city and of the shoreline, to improve water quality, resilience, and livability through creating healthy urban ecosystems. Moreover, every strategy has been divided into adaptation pathways that sets a series of adaptation actions along a timeline that integrates planning, engagement, collaboration, pilot projects, and construction and deconstruction projects.
Coopers’ Park, North Shoreline of False Creek
Stamps Landsing development scenario, South Shoreline of False Creek
River cities | Lyon, France
The redevelopment of squares and streets is a major part of the urban policy of Greater Lyon, but the innovative element is the vision of urban redevelopment based on public space as a continuous and complex system. In 1989, the government of Greater Lyon outlined a real political strategy for urban spaces with the principle of social equity as its backdrop: to act by "transforming the centre into a neighbourhood to be lived in and the suburbs into residential neighbourhoods" and thus reserving the same quality of intervention in the center and in the suburbs "to make the city beautiful, supportive and pleasant to live in”.
The political will of the plan was to give a strong signal in the direction of social equity, which is why it was intended to guarantee the same quality of space for the inhabitants of the city center and the city's suburbs. To achieve this result, there was a comprehensive work on the characteristics of the new spaces. Surface public transport is conceived as an element of the redevelopment of the spaces. Especially in the suburbs, the major axes connecting neighborhoods are reorganized with routes for bicycles, rollers, and pedestrians, giving back to these means a part of the space occupied by vehicles.
The "Trame Verte et Bleu", strategic vision and plan for the development of the green and blue corridors of Lyon, (green and blue network) has sparked the development of new leisure activities such as sports, walking, farming, and gardening, and exploring nature. Important initiatives have been carried out and are still being carried out, such as the redevelopment of the Rhône banks: five kilometers of green bike and pedestrian path connecting two enormous parks and descending varied landscapes from the most natural to the most artificial. The strategy is to repair what already exists. The Saône project, which is presently underway, the project for the Confluence of the two rivers, which is almost complete, and finally the ambitious Blue Ring project, a big natural ring - blue and green - equipped with cycle and pedestrian routes connecting peripheral areas such as Décines with the urban center, as well as recreational and service activities, are all over 50 kilometers long.
The Lyon Confluence is a noteworthy project of urban regeneration located on the confluence of the two rivers. The project is remarkable because of the process of stakeholders and population engagement that has been activated. Its design preserves the industrial identity by enhancing the landscape and public space network, the return to nature, the social mixité accompanied by the construction of social residences.
+
+ Sustainable transport network /
Saone and Rhone river banks today |
River cities | Bordeaux, France
The right bank of the Garonne River was long occupied by factories that are gradually changing and moving away.
The project has managed to deploy an entire repertoire of simple, abstract landscaping components that have developed a respectful dialogue with the area's pre-existing features, bringing them into relationship with the river. Bordeaux's port activities have been relocated, and the riverfront on the left bank has been transformed into promenades jardinées. Plantations are replacing construction and industrial activities, and ambitious efforts to reclaim its banks for citizens are being implemented. The changes are accompanied by a sort of intermediate nature that progressively bestows quality on the places, so that they will be able to accommodate the new districts.
The docks have been reorganized based on a diverse succession of moderate areas such as esplanades, fields, and gardens that provide a dynamic setting for a variety of activities. Divided into equally shared and functioning routes that provide various modes of transportation for pedestrians, bikers, private automobiles, public transportation, and merchandise deliveries. Green strips enter the space from the Saint Michel Park on the southern side of the Port de la Lune and spread down the left bank with varying degrees of intensity depending on the character of the locations they cross.
Once the land of wine, then a military and industrial zone (the Halle aux Farines in 1852, the Niel barracks since 1876 and the Grands Moulins since 1921), today it is a vast 3.5 km green and public path from where one can admire the clear stone facades of the left bank. The strategic principle at the urban scale that led to the creation of the park is to reconnect the centre of Bordeaux by means of a new landmark for movement and a new way of experiencing the city.
In the park, a series of bosquets defines open spaces that will be turned into public places. The rows of trees, planted in alignments perpendicular to the bank, function as the wings of a scenery: they stand out along the promenades parallel to the river like wooded profiles of varying density, transparency, and porosity. These backdrops orient views and organise movements towards the river, prefiguring the geographical anchorage, towards the river, of the future Bastide district, currently under development.
River cities | Key takeaways
Isar riverfront, Munich, Germany /
The city of Vienna is today one of the main examples of cities that live in symbiosis with its river. This reality is the result of long processes of transformation of the city that have involved multidisciplinary teams and initiated projects based on the relationship between river and city, with the aim of giving more and more space to the river and to nature along its banks. These transformations have contributed not only to safeguard the city from flood risk but also to generate an attractive place that offers new spaces for activities and for the community.
For Munich, the Isar was above all else a threat. As a result the river was “tamed” by means of canals, weirs, and embankments: the 2000‒2011 Isar Plan made extensive efforts to renaturalize parts of the river within the city limits. The goals were to improve flood management, create a nearnatural river landscape, and to increase the quality of leisure and recreation. Today, the newly created river landscape provides benefits to many: both humans and animals are attracted to the natural beauty of the riverscape.
Today Vancouver is facing major challenges related to sea-level rise, particularly in some areas of the waterfront. Starting from this Situation the city of Vancouver promoted the implementation of a strategy, Sea2city, to make the waterfront adaptive to rising water levels up to 2200. This strategy foresees the naturalization of the banks and transformation of some portions of the city overlooking the river that aim to withdraw the city. The new naturalized banks offer recreational opportunities as well as new functions that adapt to the progressive rise of water.
Greater Lyon and Lyon Confluence, France
(Le Confluence),
The regeneration strategy of the Greater Lyon has given great space to the redevelopment of the open spaces and of the green-blue network of the city. This strategy has foreseen the creation of new cycle-pedestrian paths connecting the river, the existing parks along the banks, the city centre and the suburbs; it also provided the creation of new natural and artificial public spaces along the river and the identification of large areas of urban regeneration, such as the Confluence, an urban project that develops from the network of public spaces and natural spaces.
The strategic principle of the project for the right bank redevelopment of Garonne river is to reconnect the centre of Bordeaux by means of a new riverfront park. This park, which reconnects the city to the river, establishes through the forms of the landscape, an urban rule for the morphological definition of the future district Bastide, under development. The identification of a series of avenues oriented perpendicularly to the river enhanced by rows of trees and the alternation of wooded green areas and lawn identify the new public spaces or lots for the new buildings.
Multifunctionality:
Garonne Rive Droite, Bordeaux, France /
Danube riverfront, Wien, Austria /
Benchmarks: Sustainable Mobility
The following chapter outlines mobility and transport benchmarks. Although these do not refer specifically to reconstruction plans, they offer valuable insights that can be applied to the future phases of the Mykolaiv concept masterplan, with the purpose of pursuing a "building back better" approach.
In this analysis, six port cities were carefully selected as case studies. The chosen port cities share certain similarities with Mykolaiv, including comparable population sizes and common challenges such as managing heavy vehicle traffic due to the presence of ports and the need for industrial zone regeneration. These cities have invested in optimising public transport, expanding their pedestrian and cycling networks, enhancing road safety measures, utilizing water transport as an asset for residents and tourists, and implementing extensive urban regeneration programs. These initiatives aim to transform industrial areas into mixeduse urban spaces seamlessly integrated with the rest of the city, serving both residents and tourists. Cultural programs and events have also attracted tourists and stimulated economic growth.
The qualitative analysis delves into the challenges identified for Mykolaiv and explores the solutions and strategies implemented by these benchmarked cities. It aims to compile a list of key takeaways and lessons learned that can inform the future phases of the Mykolaiv Master Plan project. The qualitative analysis is divided into strategies for road networks, public transport and walkability, cycling, and public realm strategies.
For road networks, the investigated strategies encompass port accessibility, road redesign to accommodate dedicated public transit lanes, walking and cycling infrastructure improvements, boulevard redesign with large green medians, road safety measures, the implementation of 20 and 30 km/h speed limit zones, and traffic regulations such as congestion charges in city centers, primarily aimed at managing heavy vehicle traffic for port activities.
Strategies examined for public transport include transit corridors, major and minor mobility hubs, park-and-ride and bike-and-ride systems, water transport for passengers and tourism, on-demand solutions for low-demand areas, and integrated ticketing options.
The qualitative analysis related to walkability, cycling, and public realm strategies encompasses riverfront and industrial zone regeneration plans, enhancements to walkability and cycling along riverfront areas and ports, tourism infrastructure and public realm initiatives, and strategies to ensure that events are accessible to visitors without disrupting daily city mobility and transportation. Sustainable strategies and policies implemented over the years are also discussed.
The goal is to comprehensively understand the benchmarked cities' mobility and transport infrastructure density and characteristics compared to Mykolaiv.
Port accessibility | Bilbao, Spain
A direct road access ensures an efficient movement of the goods in transit. Imports and exports enter and leave the Port through the A-8 motorway, which connects to the national road and motorway network of Spain, France, and Portugal, bypassing any urban center minimizing heavy traffic.
Port-rail traffic is experiencing significant growth with an increasing number of trains entering and leaving the port of Bilbao each year. Notable advancements in rail-port traffic management have been achieved ir order to provide a universal, neutral, and competitive 24/7 service. To accommodate longer trains, the construction of a new 750-meter-long siding at Orduña station started aiming to enhance the efficiency and speed of freight trains between the port of Bilbao and the Meseta, while also benefiting passenger trains.
The "IBUK - Intermodal Corridor" Action was a part of the strategy to improve freight flows between the Iberian Peninsula and the United Kingdom by eliminating bottlenecks in the existing road freight route and improving rail and sea transportation in order to increase efficiency and promote sustainability. The project integrated three core developments: (1) rail connection infrastructure in El Prado, Spain, (2) infrastructure at the Port of Tilbury, and (3) Intermodal corridor Community System.
Innovation and research centre which serves as a hub for identifying the needs of the port in order to provide innovative ideas and solutions to become a 4.0 port. It acts as a platform for entrepreneurs, start-ups, doctoral students, and researchers. The focus areas are 4: (1) logistic efficiency in infrastructure, operations, and service delivery, (2) process digitalisation and smart platforms, (3) environmental and energy sustainability, and (4) security and protection.
Port accessibility | Bordeaux, France
The Atlantic Port of Bordeaux is France’s 7th largest seaport. It is composed of seven specialized terminals (Le Verdon, Pauillac, Blaye, Ambès, Grattequina, Bassens and Bordeaux - Port de la Lune), set along Europe’s largest estuary, on the Gironde river. The port develops over more than 100 km between Bordeaux city center and le Verdon, with roughly 1100 ships docking each at the seven terminals. The Port of Bordeaux handles a wide variety of cargo flows: bulk cargo, containers, energy bulk, agri-food bulk, and passengers, especially cruise passengers.
Atlantic Port of Bordeaux is positioned at the heart of a dense and diversified network of multimodal transportation options by land and sea.
As a hub of the European transport network, Atlantic Port of Bordeaux boasts is connected through the road system (with 5 major motorways A89, A62, A63, A65, A10), rail system (the high-speed rail line connects Paris to Bordeaux in 2 hrs 4 min) air transport, (Bordeaux Merignac is France’s largest regional airport) and maritime transport.
The PÉÉPOS project (Positive Energy and Economy Port) aims to support the energy transition in the industrial-port area. Among the initiatives in the port of Bordeaux:
- multi-modality (modal transfer, in particular, rail transport at the new TCSO terminal - South-West Container Terminal).
The H2Bordeaux project is has the goal to decarbonize industry and mobility. Among the activities promoted:
- conversion the Bordeaux Metropolis river shuttles from diesel to hydrogen
- the design of hydrogen refill stations for the port, in the Bordeaux urban area, on the European network.
Bordeaux Metropole is currently developing a regulatory framework for limiting traffic in the urban region. The Low Emission Zone limiting criteria are still under consultation. Two measures will be experimented in 2023 to regulate heavy goods vehicle traffic on Bordeaux Ring Road: - the ban on overtaking for heavy goods vehicles on the entire ring road with a phased implementation to improve the fluidity of light vehicles while preserving road safety.
- modulation of the amount of tolls for heavy goods vehicles on the A63 motorway approaching the ring road, to encourage them to drive outside peak hours and thus help to reduce congestion on the ring road.
Bordeaux Metropole
(A89, A62, A63, A65, A10),
Port accessibility | Copenaghen, Denmark
Copenhagen Malmö Port (CMP) is one of Scandinavia’s largest port operators. The port is a join-venture between Denmark and Sweden. The port act as transport hubs in the Oresund region, including freight flows into the Baltic Sea and cruise operations in Copenhagen, Malmö and Visby.
Copenhagen port has terminals located in Københavns, Nordhavn and Prøvestenen. Operations include roll-on/roll-off –and container traffic, cruises, combi-traffic via rail, and oil and dry bulk terminals.
The port of Copenhagen is in the proximity of the city, with some of the industrial areas being reconverted to connected neighborhoods.
BY&HAVN is a company set up to ensure the development of the city and the port, 95% owned by the municipality and 5% by the Danish state.
Aiding the transformation of the old port area of Nordhavn into an integrated area, the Cityringen, a ring-shaped metro line was built, connecting it to the rest of the city by train.
Planned connections include the Nordhavn tunnel, that will lead traffic under Svanemølle Bay.
In Copenhagen's harbor you can swim, sail in kayaks and rowing boats, fish, sail in sailboats and motorboats or stand-up paddle and enjoy the recreational areas along the canals. Activities in the port are regulated by the Port Regulations. In addition, the rules for sailing in the Port of Copenhagen apply as stated in the Ministry of Transport's Standard Regulations for maintaining order in Danish commercial ports. The harbor regulations are BY&HAVN 's tool for regulating traffic and creating opportunities for activities in the harbour.
Low Emission Zones are being implemented in most Danish cities. For heavy vehicles, regulations include:
- heavy vehicles that comply with at least Euro VI standards are allowed in the LEZ
- older diesel-powered vehicles weighing over 3,5 kgs must be fitted with a particulate filter to be used legally in the LZE In Copenhagen one transit route is implemented in the LZE for vehicles that do not meet the requirements. The route goes to and from Nordhavnen, the harbor area at the coast of the Øresund.
«Prøvestenen»,
Port accessibility | Hamburg, Germany
Hamburg port needed to deepen the fairway along the river Elbe to accommodate larger container vessels and strengthen its global trade position. Utilizing a fleet of trailing suction hopper dredgers, backhoe dredgers, barges and big size spreader pontoons, they deepened a length of 116 km of the river by 1.0 meter, from its mouth at the sea to the entrance of the Hamburg harbor.
To improve the road traffic and minimize the congestion on the main port's roads, an innovative traffic management system called "Port Road Management" has been implemented. This system optimizes the use of existing transport infrastructure, identifies potential incidents, and generates automated messages to inform users through LED panels, enabling them to avoid congestion and ensure smoother traffic flow.
The port of Hamburg extends along the Elbe River, encompassing river channels and islands. To ensure connectivity between the islands the port provides a total of 133 bridges which link the territory.
In order to improve air quality, reduce emissions and promote sustainable mobility, the city of Hamburg have implemented two Diesel Euro 6 low emission zones on two specific streets, allowing only diesel vehicles meeting the Euro 6 standard to circulate. The zones are the following:
Between Julius-Leber-Straße and Holstenstraße on Max-BrauerAllee.
Between Neuem Pferdemarkt and Kaltenkircher Platz on Stresemannstrasse.
Port accessibility | Rotterdam, Netherlands
PortShuttle
PortShuttle Rotterdam is the rail system within the port of Rotterdam. By utilizing the existing rail network in Rotterdam, the service effectively interconnects the container terminals located on the Maasvlakte, optimizing the port's logistics operations.
PortShuttle Rotterdam
The Blankenburg Connection is a new 4km-long A24 motorway being built to connect the A15 and A20 motorways to the west of Rotterdam. Its main aim is to improve accessibility to the Rotterdam ports and the region, aligning with the 2009 Masterplan Rotterdam Vooruit for regional development from 2020 to 2040.
Rotterdam has implemented some LEZs in order to reduce traffic.
(1) Rotterdam dock – AR/LEZ Low Emission Zone: The minimum standard that lorries have to meet is diesel Euro 6.
(2) Low Emission Zone: This low emission zone affects diesel lorries.
(3) Zero Emission Zone Logistics: A zero-emission zone for delivery and servicing will be in place from 2025 onwards.
(4) Rotterdam s-Gravendijkwal - lorry ZEZ: This street is closed to freight traffic, with the exception of 100% electric lorries and vans.
Port accessibility | Tallinn, Estonia
Port of Tallinn operates as an intermodal hub, handling passengers as well as various cargo daily. It owns two passenger harbors (Old City Harbor, Saaremaa Harbor) and two cargo harbors (Muuga Harbor and Paldiski South Harbor).
Smart Port traffic management system (automated vehicle checkin and direction to the waiting area and boarding) in Old City Harbor simplifies and speeds up the check-in of passengers with vehicles and their movement in the harbour area. In 2021, Smart Port system implementation also started at Muuga Harbour and Paldiski South Harbour.
A north-south freight corridor will be developed with Rail Baltica, for ro-ro and container lines. In 2025, the Rail Baltica freight station will be completed in Muuga Harbour, which will create loading opportunities for sea, road and rail transport. Rail Baltica is estimated to create additional capacity for the transport of 4-5 million tons of cargo annually.
To reduce traffic load on the premises of Old City Harbour and to lower the noise level and improve the air quality in the area, more and more heavy-duty and other vehicles are being diverted from Old City Harbour to Muuga Harbour and Paldiski South Harbour. In Tallinn, movement of heavy vehicles (7t and 15t) is prohibited in the Kalamaja and City Centre districts.
On both the Paldiski–Kapellskär and the Muuga–Vuosaari route, vehicles are served by two ro-pax vessels. The ro-ro traffic of Paldiski South and Muuga harbours accounted for 30% (2021: 34%) of the total number of the ro-ro units handled by Tallinna Sadam in 2022.
Port accessibility
Bilbao
Bordeaux
Rotterdam
Tallinn
Road Network | Hamburg
Gänsemarkt, Hamburg
Gänsemarkt has been redesigned to incorporate a dedicated public transport lane and enhance pedestrian accessibility and safety. The modifications include changing a vehicular lane to a dedicated bus lane and expansion of sidewalk to prioritise pedestrians and increase safety and comfort.
Gänsemarkt
Altonaer Poststraße has undergone a transformation into a shared street. The key changes include the removal of on-street parking, the reduction of vehicle traffic, the implementation of new pavement and providing bike parking to ensure safety and comfort of cyclists and pedestrians.
The main interventions at Château d'Eau consist of creating a public plaza with greenery by reducing the dimensions of the intersection, implementing new pavement to slow down traffic, modifying curb extensions to improve the quality of public space and enhance safety and comfort.
Primary/
Secondary/
Château d'Eau, Bordeaux Château d'Eau, Бордо
Château d'Eau
Place du Maucaillou, Bordeaux
Place du Maucaillou has undergone a transformation from an informal parking area into a lively plaza. Key interventions include eliminating the parking spaces to create a public plaza with greenery, urban furniture and bike parking. Street pavements are changed to lower vehicular speed and increase pedestrian safety.
Place du Maucaillou, Бордо
Place du Maucaillou
Road Network | Copenaghen
Sønder Boulevard, Copenhagen Sønder Boulevard,
Sønder Boulevard is a boulevard in the Vesterbro district whose wide central median has been transformed into a linear park with various facilities for sports and leisure activities. It runs from Halmtorvet next to Copenhagen Central Station in the north east to the Carlsberg district in the southwest.
Tertiary/
Sønder Boulevard
•
•
Road Network | Lessons learned
Port accessibility
• Heavy vehicle traffic is deviated from city center by implementing road bypass
• Limited Traffic Zones in City Center
• Increasing pay-toll for trucks
• Investment in increasing freight railway network capacity
• Roll-on Roll-off solutions for moving freight in port
• Decrease vehicle traffic lanes and remove on-street parking to provide space for public transport, pedestrians, and cyclists and improve the quality of the public realm
• Optimizing intersection design ensures safety for all users, especially pedestrians and cyclists
• Low-traffic, narrow city center streets, and residential area streets have the potential to be redesigned and enhanced as shared streets to prioritise pedestrians and cyclists and improve the quality of urban spaces
• Changing road pavement to textured pavements reinforces the pedestrian-priority nature and increases safety, especially in residential neighborhoods and low-traffic areas
• Informal at-grade parking spaces in the city center and residential areas have the potential to become public urban spaces for recreation, socializing, and leisure
• Providing bike parking facilities encourages the use of bicycles
• Wide central medians have the potential to become highquality urban spaces
• They can be turned into linear parks with spaces for recreational activities
• The central medians can be used
space for pedestrians and cyclists
and
Road safety measures
• Refine accident data
• Implement speed limits prioritizing walking and cycling
• Ensure visibility for all road users through proper lighting and signage
• Improve safety at intersections with a history of accidents
• Assess routes that experience frequent accidents and implement necessary improvements
• Address common accident scenarios through targeted interventions
• Regularly evaluate intersections for potential safety improvements
• Develop plans and educational programs to improve the competence of road users in following safety guidelines
20 and 30 km/h speed limits zones
• 20 and 30 km/h speed limits roads ensure higher safety, fewer serious accidents, and less noise and pollution
• Set speed limits of 30 km/h or lower in areas where people walk, bike, live, and play
• Implement policy or law to make 30 km/h the default speed limit on streets in residential, public transport, commercial, health, educational, religious, and recreational areas
• Install 30 km/h speed limit signs with traffic calming measures and pedestrian facilities
•
• Regulate vehicle deliveries within specific hours
• Enforce emission standards for vehicles
• Establish Low Emission Zones (LEZs) and Zero EmissionZones (ZEZ) to ensure CO2 emission mitigation and reduce traffic congestion
Public transport strategies | Transit corridors
Coolsingel, Rotterdam
Coolsingel is one of the most important streets of Rotterdam, as it crosses the city center from north to south. The street has been transformed into a
while incorporating expanded areas for pedestrians and cyclists to ensure multi-modality and reliable public transport service.
Coolsingel
Coolsingel
Abandoibarra Etorbidea is a green boulevard and a primary public transportation corridor connecting the northern edge of Bilbao’s city center. The street includes a central tram and a carriageway on both sides to accommodate vehicular traffic. The design integrates active frontage, seating, and bike parking that help to make it a lively boulevard that helps to bind Bilbao’s city center with the adjacent river and critical areas such as the Guggenheim Museum.
Abandoibarra Etorbidea
Abandoibarra Etorbidea, Bilbao
Abandoibarra Etorbidea,
Abandoibarra Etorb.
Public transport strategies | Mobility hubs
Landungsbrücken, Hamburg
Landungsbrücken, Гамбург
This station along the harbor serves as a hub for ferries, buses, light rail (S-Bahn), and U-Bahn services. It's a key multi-modal transit hub for public transit connections and offers scenic views of the Elbe River. The floating dock is 700 meters long. Harbor tours and the HADAG steamers to Finkenwerder, Oevelgönne, and Blankenese leave this water terminal.
Finkenwerder, Oevelgönne
Blankenese.
Landungsbrücken
The cruise terminal on Tallinn's North-West Seawall Old City Harbour is a multifunctional urban space, creating an 850 m seaside park that links the port directly to the city and nearby tourist attractions. A ferry station is foreseen to allow quick connections from the port to the northern district of Kadriorg. The new terminal has space for 2,000 people, and the waiting area can handle over 10 million annual passengers.
Tallinn Cruise Terminal
Public transport strategies | Water transport
Watertaxi, Rotterdam
Watertaxi,
The WaterTaxi Rotterdam takes passengers within the Harbor area at about 50 kilometers per hour (faster than by road). It transports 700,000 passengers annually to more than 50 berths in the city and its ports. The stops are mainly located close to city tourist attractions. On the fast boats, a maximum of twelve passengers can be transported, and on the other taxis, a maximum of eight. With an on-demand service, WaterTaxis efficiently ferry passengers across water routes of the city. They are already electric ships in service.
Batcub is the water bus service of the Transports Bordeaux Métropole (same system that runs buses, bikes, and trams) along the Garonne River. It serves five intermodal terminals departing from Stalingrad and ending at Lormont Bas. The boats, which can carry up to 65 passengers and six bicycles, shuttle between stops on both sides of the Garonneevery fifteen minutes during weekday rush-hour periods.
At other times and over the weekend, they connect only three stops.
The water buses provide a public transportation option along the Copenhagen harbor, offering an alternative mode of travel between different neighborhoods at the exact cost of a regular bus ticket. They can carry up to 80 people, including eight bikes and four strollers or wheelchairs, outside rush hours. The route has nine stops at many tourist destinations on both sides of the water. The harbor buses are both NOx- and particle-neutral. 600,000 passengers use the public harbor ferries each year.
The HADAG ferries are part of the Hamburger Verkehrsverbund (HVV) public transport network connects the city's maritime sides along the Elbe River. The system comprises eight lines with 20 jetties along the river, including stops at the Landungsbrücken and Fischmarkt, essential tourist places of the city. The ferries can be used with the same HVV ticket of the underground/ suburban railway or bus. They are already implementing dieselelectric technologies. They are used by approximately nine million passengers each year.
Nørreport station is an urban plaza, S-train, metro, and mainline railway station in Copenhagen. It is the busiest train station in Denmark, with more than 250,000 people passing through it daily. Since the 1960s, the station has become a chaotic intersection in the middle of the city. The new station comprises rounded, floating roofs mounted on glass pavilions. The design was based on a study of pedestrians' preferred routes, providing an open and welcoming public space with particular consideration for cyclists and pedestrians. The hub is about 10,500 sqm with 2,500 parking lots for bicycles.
Major mobility hubs
Rotterdam Centraal Station is one of the most important transport hubs in The Netherlands, with 110,000 passengers per day, which is connected to the train, tram, and metro. In addition to the European network of the High Speed Train, Rotterdam Centraal is also connected to the light rail system, RandstadRail. The number of daily travelers is expected to increase to approximately 323,000 by 2025. The terminal has an area of about 46000 m² with parking for cars and bicycles, commercial spaces, a lounge, restaurants, and offices.
Centraal Station, Rotterdam
Source I Джерело https://en.rotterdam.info/locations/centraal-station-rotterdam-en/ https://mvsa-architects.com/en/projects/rotterdam-central-station/ https://www.archdaily.com/588218/rotterdam-central-station-benthem-crouwel-architects-mvsa-meyer-en-van-schooten-architecten-and-west-8
There are several bike+ride stations around the city which combine public transport with bike parking. The B+R includes free parking facilities, covered storage space, secured rental spaces in bicycle boxes or collective locking systems and lockers, and charging facilities for pedelecs and e-bikes.
Switch
Berliner
This mobility hub ensures efficient connectivity by providing 4 metro lines and 5 S-bahn lines, 13 bus lines, and a taxi stand with 5 spaces. It also offers eco-friendly options as 20 bike-sharing spots with bike racks and covered parking, and car options as car-sharing with 8 reserved spots and car rental with 5 dedicated spaces.
Switchh station Altona, Hamburg
Switchh station Altona, Гамбург
This mobility hub provides a comprehensive range of transport options, including 16 city bike-sharing spots, ample bike parking with both covered and secured spaces, 5 available taxis, 20 drop-off spaces, designated parking for car-sharing and car rental (7 and 5 spots respectively), and optimal connections to bus, U-Bahn, and S-Bahn.
Public transport strategies | Lessons learned
• Identify major boulevards and roads of the city connecting main points of interest that can be transformed into multi-modal transit corridors to reduce congestion and create lively urban spaces
• Provide dedicated lanes for public transport to increase the efficiency and reliability of the service and encourage the modal shift towards more use of public transport
• Provide dedicated bike lanes, bike parking and ample sidewalks along the transit corridors to encourage multi-modality
• Identify main transport nodes in the city where several modes cross to be transformed into major mobility hubs, including train stations, harbor, and similar
• Prioritise pedestrian and cyclist accessibility
• Provide bike-sharing and bike parking at the mobility hub to encourage sustainable mobility for last-mile connections
• Offer car-sharing and car-rental services at the mobility hub
• Provide parking close to major mobility hubs to encourage the modal shift from private cars to public transport
• Consider locating the hubs at the waterfront to integrate water transport with other modes
• Develop efficient water transport for quick travel
• Establish integrated water buses and ferries for city-wide connectivity
• Integrate the water transport system with the existing public transport networks
• Include stops at tourist destinations
• Provide frequent service schedules
• Ensure accessibility for reduced mobility passengers
• Provide access for bicycles •
Integrated ticketing options
• Develop a unified payment system covering various transport modes (trains, trams, buses, water transport, and shared mobility)
• Integrate different transport operators in a unified system
• Utilise innovative and user-friendly technology such as smart cards and mobile apps
• Promote public transport usage by simplifying payment across modes
• Consider providing discounted fares for students, older adults, and off-peak hours
• Offer daily, weekly, monthly, and annual options to encourage the shift from private car to public transport
Cycling and public realm | Riverfront & industrial zones
HafenCity is a prominent urban development project in Hamburg and one of Europe's largest and most ambitious urban revitalisation projects to redevelop the formerly industrial and harbour areas. HafenCity is well-connected to the rest of Hamburg by public transportation, including buses, trams, and the U-Bahn (subway). It also has pedestrian-friendly streets and cycling paths to promote alternative transportation methods. The 2.5 million sqm mix-used urban district will accommodate 15,000 residents, create 45,000 job opportunities, and 80,000 visitors daily.
Cycling and public realm | Riverfront & industrial zones
Nordhavn, Copenhagen
Nordhavn, Копенгаген
City district located in the former industrial harbour area which includes public spaces, promenades, landscapes, bicycle infrastructure and metro stations with a ‘5-minute city’ approach. Nordhavn is conceived as an urban archipelago or a series of dense neighborhoods on the water. There is a corridor for bikes connected to the public transportation loop, which connects Nordhavn to the larger biking network of the city.
Nordhavn
Cycling and public realm | Riverfront
Niederhafen River Promenade, Hamburg
The Niederhafen River Promenade is a waterfront walkway along the Elbe River on top of the flood protection barrier that protects the city from winter storm surges and high tides. It is a major tourist attraction and one of Hamburg's most important public spaces. It is well integrated with the UBahn train network, dedicated cycling lanes at street level, water transport, and parking spaces. The project ensures easy access for people with reduced mobility.
Niederhafen
Havneringen, Copenhagen
Havneringen, Копенгаген
Havneringen is a 13 kilometre ring pathway along the harbourside for walking and cycling. It connects many neighbourhoods of the city, from iconic sights at Nyhavn to the Christianshavn and Sydhavn.
Christianshavn Sydhavn.
Havneringen
Cycling and public realm | Riverfront Велосипедний
Promenade Kirchenpauerkai, Hamburg
Promenade Kirchenpauerkai,
The Kirchenpauerkai stands as HafenCity's most extensive and greenest promenade. The initial segment of around 560 meters, has recently reached its completion and the project aims to reach a path of about 1 kilometer of extension with a width of about 30 meters. Entrances and separate routes for pedestrians and cyclists were planned.
Kirchenpauerkai
Promenade Kirchenpauerkai
The port cycle event route (Hafenerlebnisroute) is a cycle tour of 45 km around the port of Hamburg. This tour allows to watch the loading and unloading of containers, cross bridges or see many other viewpoints. The route is connected directly to the S-Bahn stations as well to the Finkenwerder ferry jetty.
(Hafenerlebnisroute)
Finkenwerder.
Photo: Gregor Schläger
Copenhagen Creating sustainable community/10 steps program
1) Convert streets into pedestrian thoroughfares
The city turned its traditional main street, Stroget, into a pedestrian thoroughfare in 1962. In succeeding decades they gradually added more pedestrian-only streets, linking them to pedestrianpriority streets, where walkers and cyclists have right-of-way but cars are allowed at low speeds.
1)
2) Reduce traffic and parking gradually
To keep traffic volume stable, the city reduced the number of cars in the city center by eliminating parking spaces at a rate of 2-3 percent per year. Between 1986 and 1996 the city eliminated about 600 spaces.
3) Turn parking lots into public squares
The act of creating pedestrian streets freed up parking lots, enabling the city to transform them into public squares. 3)
4) Keep scale dense and low
Low-rise, densely spaced buildings allow breezes to pass over them, making the city center milder and less windy than the rest of Copenhagen.
5) Honor the human scale
The city’s modest scale and street grid make walking a pleasant experience; its historic buildings, with their stoops, awnings, and doorways, provide people with impromptu places to stand and sit.
5)
6) Populate the core
More than 6,800 residents now live in the city center. They’ve eliminated their dependence on cars, and at night their lighted windows give visiting pedestrians a feeling of safety.
6)
7) Encourage student living
Students who commute to school on bicycles don’t add to traffic congestion; on the contrary, their active presence, day and night, animates the city.
7)
8) Adapt the cityscape to changing seasons
Outdoor cafes, public squares, and street performers attract thousands in the summer; skating rinks, heated benches, and
9) Promote cycling as a major mode of transportation
The city established new bike lanes and extended existing ones. They placed bike crossings – using space freed up by the elimination of parking – near intersections. Currently 34 percent of Copenhageners who work in the city bicycle to their jobs.
The city introduced the City Bike system in 1995, which allows anyone to borrow a bike from stands around the city for a small coin deposit. When finished, they simply leave them at any one of the 110 bike stands located around the city center and their money is refunded.
Cycling and public realm | Lessons learned
• Identify former industrial areas and port warehouse areas preferably close to the city center that can be suitable for regeneration projects
• Ensure mixed-use function and tourist attraction points
• Enhance urban accessibility by establishing efficient transportation connections between the revitalized neighborhoods and the city
• Develop an integrated transport network connecting public transport, cycling lanes, and pedestrian pathways for efficient mobility
• Provide dedicated cycling lanes, bike parking and bike-sharing services to encourage cycling
• Design streets and public spaces for pedestrians with wide sidewalks, pedestrian zones, and safe crossings to promote walkability
• Develop pedestrian and cycling pathways along the waterfront for both residents and visitors
• Implement dedicated cycling lanes and routes for pedestrians ensuring safety
• Provide multiple access points, entrances, and bike parking facilities to improve visitors experience
• Develop dedicated cycling routes that connect to transport hubs and offer safe and scenic pathways
• Create specialised event routes that allow cyclists to experience port activities
• Install informative signage and ensure
•
•
Sustainable strategies and policies over the years
• Transform streets into pedestrian zones and prioritize cycling lanes while maintaining low-speed vehicle access
• Enhance public transport and integrate it with pedestrian areas
• Gradually eliminate parking spots in order to reduce traffic
• Repurpose parking lots into lively public spaces
• Develop an extensive cycling network, integrate bike crossings, and promote cycling as a primary mode of transport
• Implement bike-sharing services for easy access to bicycles
• Promote mixed-use developments and student accommodations to reduce commuting, enhance walkability, and encourage active mobility
•
CHAPTER 6 |
Pilot Projects: Innovation District Site
Selection
Pilot projects: Five Benchmark Developments
Пілотні проєкти: П'ять еталонних розробок
Pilot Projects: Introduction
In order to initiate the successful implementation of the Mykolaiv Concept Masterplan, six key principles / design pillars have been identified as drivers for the overarching plan.
The urban-wide strategies will be tested through five Pilot Projects, which will act as testing grounds for the six pillars as well as triggers for further transformation.
Selected through a participatory process, the pilot projects will focus on sectors and uses that have been identified as key to the regeneration of Mykolaiv. The pilot projects aim to propose tangible solutions whereby architects, engineers, developers and investors will be able to focus on specific sites and targets, promoting exchange between local and international professionals and informing local policies, while fostering long-term resiliency in Mykolaiv.
A key brief for each pilot project has been established, as summarised in the following pages.
The potential sites for each of them have been identified thanks to the input of local stakeholders, through an online engagement platform.
KEY PRINCIPLES
INDUSTRY + INNOVATION
• Review latest economic situation and consider the introduction of new industries.
• Sustainably integrate business park networks to boost local economy.
• Create incentives to attract new businesses.
• Guarantee economic balance by attracting new MLE businesses.
Affordable Housing
• Promote safe and affordable housing as a pillar for sustainable development.
• Establish networks of new and existing neighbourhoods.
• Undertake a reform of regulations.
• Balance offer and demand.
• Use the latest in innovative materials for refurbishing existing buildings.
PILOT PROJECTS
Sustainable mobility
• Increase accessibility to the city.
• Reduce dependency on private transport in favour of sustainable choices.
• Upgrade road networks in favour of soft mobility and public transport.
• Utilise transport systems to promote sustainable development.
• Reduce carbon emissions and greenhouse gases.
Governance
• Build capacity through public and private stakeholder collaboration.
• Create a sustainable, long-term vision shared by all government agencies.
• Strengthen cooperation between city departments.
• Develop greater insights through investment in data.
• Introduce policies to promote innovation and community interaction.
Green networks
• Preserve the existing natural ecosystem.
• Promote landscape as green infrastructure through soft modes of transport
• Encourage harmonious urban landscape with new green belts and corridors.
• Create network connecting landscapes and water.
• Design green spaces for both recreation and production.
Community engagement
• Support the city’s strategic goals through community engagement
• Mainstream community engagement practices in planning framework.
• Guide communities and stakeholders in an incremental participatory process, from consultation to empowerment.
• Champion sustainable design solutions.
Culture and Heritage Pilot Project: potential sites
Focused on the reconstruction of Mykolaiv’s city center, this Pilot Project aims to return to the city an area, or a building, that is particularly significant from a historical and cultural point of view, and that can become a symbol of hope and rebirth for the city.
As a project of cultural significance to the people of Ukraine, it will be the community to decide whether this project will be an iconic Ukrainian building, a piece of public art work or the regeneration of a public square.
Located in a strategic area halfway between the cities of Chersonesus and Odesa, Mykolaiv is a central hub for national and international industry and trade.
To strengthen this position and support economic recovery and medium-long term growth policies, this Pilot Project will explore the regeneration of two industrial sites in the waterfront area. The selected sites will host several functions and uses, as well as host new public spaces, amenities, parks or other mixed uses.
Industries and the Waterfront Pilot Project: potential sites
As the reconstruction of Mykolaiv begins, one of the most critical long-standing obstacles to overcome will be to provide affordable and permanent housing for both the existing population and generations to come.
This Pilot Project will explore the redevelopment of a residential site within the city boundary. The project will include the refurbishment and retrofitting of existing residential building, as well as the introduction of new housing elements to the scheme.
Housing Micro-District Pilot Project: potential sites
Celebrating and enhancing the highquality public spaces across the city, this Pilot Project will explore the redevelopment of four riverside locations.
Each selected site will be redesigned with the introduction of new public parks to help support a network of green spaces on both sides of the Bug, providing local residents and visitors with increased accessibility to the Ingul River and a range of new public areas. These green public spaces will offer a variety of health benefits, both physical and mental, and will encourage people to be more active.
Green & Public Spaces Pilot Project: potential sites
Innovation District Pilot Project: potential sites
This Pilot Project will explore the creation of a new mixed-use neighbourhood focused around science and innovationThe Mykolaiv Innovation District.
The new urban district will host a range of offices, research centers and light industries, as well as a new science park designed to foster international cooperation and partnerships by hosting new companies looking to settle in Mykolaiv. The strategic location of the site will guarantee sustainable accessibility to a large number of workers and residents along with new public spaces.
Innovation District: Benchmarking and lessons learnt
Інноваційний район: Порівняльний аналіз
What is an innovation district?
An innovation district is a geographic area where leading-edge anchor institutions and companies cluster and connect with startups, business incubators and accelerators, to develop integrated strategies and solutions for a thriving innovative ecosystems.
They typically feature transit-accessible, technically-wired, mixeduse spaces where people can live, work, and play. Often using repurposed land or structures, they are committed to sustainability, and to establish a favourable relationship with nature.
Innovation districts are a way to revitalise urban areas and attract new businesses and talent, valuing the well-being of each person, and the care and dynamism of the community.
Innovation districts are designed to promote collaboration, networking, economic and individual growth.
Methodology Методологія
In the pages that follow, we look at a series of successful innovation districts around the world – predominately in Europe – which can serve as an inspiration for the Mykolaiv Innovation District. Each example offers lessons for Mykolaiv in terms of its strengths and weaknesses, which are useful to understand as we form a brief for the future masterplan.
For each case study, we assess the project’s relationship with the city, its massing and land use mix, as well as key statistics of the project. We will summarise by comparing evaluations and metrics for the various case studies, extracting a set of recommendations for Mykolaiv’s Innovation District.
It is important to note that each case study has its unique story of why it is relevant to its city. Innovation districts are not a ‘one size fits all’ model of development – each must respond to a particular set of drivers at the local, regional and national scale. In the same vein, Mykolaiv will need to define its drivers and priorities to be relevant to the wider growth of Mykolaiv, and more broadly Ukraine.
Site Size
Centrality of Location
Connectivity (Public Transport)
Connectivity (Private Transport)
Timeline of construction
MASSING AND LAND USE MIX
Different land use typologies existing within the site
KEY STATISTICS OF THE PROJECT
Number of businesses/ companies
Number of jobs generated
Amount of investment
Split of GFA among different land use typologies
Benchmark evaluation and takeaways
The following eight points summarise some of the most important lessons learned from the case studies that should be taken into consideration when designing the Mykolaiv Innovation District. The key messages on this page respond to the themes of integration and readiness – that is, relating to existing and future aspects of the site and enabling positive change in the wider city of Mykolaiv. These points, among others, should be further expanded in the next stages of design.
CENTRALITY OF LOCATION TO HARNESS SURROUNDING RESOURCES/
PHASING OF THE PROJECT TO ENSURE FEASIBILITY, FLEXIBILITY AND ECONOMIC VIABILITY
ENSURING A STRONG LAND USE MIX TO GENERATE FLOWS OF DIVERSE USER GROUPS/
ANCHORING THE SITE TO PREMIER UNIVERSITIES/INSTITUTIONS IN THE AREA/
MAKING USE OF RENEWABLE RESOURCES TO FOSTER A SUSTAINABLE NEIGHBOURHOOD/
REGENERATING NEIGHBOURHOODS
THAT ARE DISUSED TO REUSE EXISTING FACILITIES + GIVE A NEW IDENTITY/
LINKING DIFFERENT COMPETITIVE SITES TO FORM “INNOVATION CORRIDORS”/ INNOVATION ECOSYSTEMS/
ESTABLISHING DEDICATED PUBLIC TRANSPORT STOPS/ HUBS FOR THE INNOVATION DISTRICT/
The evaluation on this page summarises the degree to which the case studies respond to a series of objective parameters. The parameters are deemed ‘objective’ as they can be readily understood/compared across all sites. Comparison is made by high-level qualitative assessment, with green signifying strong/ generally positive, yellow as neutral and red as negative.
These parameters are later used to evaluate possible sites within Mykolaiv for the innovation district, helping to assess how well the various site options, as seen later in this report.
High Tech Campus, Netherlands
OBJECTIVE PARAMETERS
CENTRALITY OF LOCATION
CONNECTIVITY (PUBLIC TRANSPORT)
CONNECTIVITY (PRIVATE TRANSPORT)
LAND USE MIX
PROXIMITY TO GREEN AREAS
ACCESS TO WATER
PROXIMITY TO EXISTING SERVICES
PROXIMITY TO EXISTING INFRASTRUCTURE
HERITAGE VALUE/ IDENTITY
UNIVERSITIES AFFILIATION
Glasgow City Innovation District, Scotland
Milan Innovation District, Italy
Amsterdam Science Park, Netherlands
Rotterdam Makers District, Rotterdam
Kendall Square, Cambridge, MA, USA
Copenhagen Science Park, Denmark
Benchmark evaluation and takeaways
The average distance from the innovation district to the city centre is 3.65 km (this factor may vary depending on the size of the city)
The average years taken/estimated for the completion is 21 years
3. Distance to city centre
5. Number of jobs generated
7. Area provided for Innovation/ Office/ R&D (productive) space
6. Number of modes of public transport within 500 m of the innovation district
Benchmark evaluation and takeaways
The metrics below summarise the average taken from all case studies presented in this report. These averages serve as a reasonable starting point for planning Mykolaiv’s Innovation District, prior to undertaking formal market research and other deeper commercial/urban analyses.
As the masterplan moves forward in future stages, these metrics will be further refined to sharpen the Innovation District's design brief.
SIZE OF THE DISTRICT:
YEARS TAKEN/ESTIMATED FOR COMPLETION:
Innovation district design components
Masterplanning the innovation district will require a holistic vision of how to integrate land uses in ways that create a highquality living and working environment. We have identified design components that address how land uses are organised (‘clustering’), how places are created (‘placemaking’), how green spaces are incorporated (‘environment’) and how accessibility and mobility are strengthened (‘connectivity’).
On the pages that follow, we take a deeper look at each of the components summarised on this page.
e.g: Theatre, Exhibition, Museum, Conference Centre, ...
e.g: Sport centers, health facilities, nursery, food court, art center, shopping, nightlife,
A
THE PLAZA (RYNOK) -
Public space district's hearth
(РИНОК):
The ideal centre and new city-wide meeting place, open and flexible to adapt to different events
IDENTITY BUILDING
-
Image conveyor for common sense of belongings
SECONDARY PLAZA -
Public spaces for a liveable place
TYPOLOGICAL YARDS -
Specific public space
A symbol of the district. It could be an attractive building, a monument or a symbolic typology/function.
Transitional, contemplative, active,.... It can be related to any secondary function or service.
Supports open space associated with any settler building. May be restricted or semi-private.
Innovation district design components
THE COMMON -
Main public park with open fields
THE PRECINCT -
A whole public-pedestrian space
NATURAL CORRIDORS
-
The green & blue infrastructure
THE CONTEXT
Permeable
For natural human well-being. Simply for leisure, or enriched by temporary events.
Define a safe, accessible, inclusive, user-friendly space.
Creation or enhancement of natural areas that increase
and
They can be adapted to the different characteristics of the site context, e.g. park and pedestrian routes, sports and meeting areas, water and natural features, residential or productive areas.
MAIN AXIS -
Major directory of the district
SUPPORTING ROAD -
Reducing private car land uses
CENTRALIZED UTILITIES
Import/export. Waste, water, and energy management.
MOBILITY HUB -
Accessibility and people density generator
A generator of the overall geometric distribution pattern, a conveyor of mixed-use functions for public life.
Roads are limited, leading to centralised car parks (underground or multi-storey, connected to a transport hub).
Trucks and material suppliers, operations and maintenance, technical facilities are centrally organised and managed.
Public transport station, internal mobility taxi, e-bikes and escooters, underground car park, bicycle storage.
Innovation District: site evaluation
Sites overview - location and sizing
On this page, we have located the top eleven sites identified in previous stakeholder engagement as the most interesting for the location of the innovation district. Each is overlaid upon a representative 1 km2 area to help assess the site’s scale relative to an optimum size for the innovation district, as understood from the case study analysis.
Scale studies Дослідження
In the overlays below, innovation districts from amongst the case studies have been paired with similarly-scaled sites in Mykolaiv to help illustrate the development potential in the various locations throughout Mykolaiv.
Enhancing
Scale studies Дослідження масштабу
In the pages that follow, an area of 1 square kilometer – roughly the recommended size of the innovation district – has been overlaid over various world-leading cities. The aim is to illustrate how much urban development (including not only buildings, but squares, parks, etc.) can fit within 1 square kilometer and how an area of such size can relate to its immediate surroundings.
Cities selected include large European and North American cities, as well as cities roughly the same size as Mykolaiv. Also included are several European cities that have been reconstructed post World War II, showcasing the potential to rebuild better.
Mykolaiv/
Rotterdam/ Роттердам
Poznan/
New York/
Tallinn/ Таллінн
Scale studies Дослідження масштабу
Bilbao/
Bordeaux /
Sites overview - scoring summary
As seen below, we summarise the scoring of each identified site, using the previously identified qualitative scale (green-yellow-red). The assessment reveals that sites closer to Mykolaiv’s centre, or approximately 1 km2 score best, whereas smaller sites or more distant sites tend to score less favourably as the suggested location of the innovation district.
Sites overview - qualitative assessment
In the table below, a qualitative assessment is presented for each parameter. The assessment includes ‘objective parameters’, as presented in the case studies, as well as ‘relative parameters’ –criteria relevant to picking the right site upon which to base this pre-concept study. The relative parameters evaluate how suitable the site is for the pre-concept and how transferable the design study can be to another site, should an alternative preferred site be identified for developing the innovation district.
OBJECTIVE PARAMETERS
CENTRALITY OF LOCATION
CONNECTIVITY (PUBLIC TRANSPORT)
CONNECTIVITY (PRIVATE TRANSPORT)
SITE EXISTING FEATURES
PROXIMITY TO GREEN AREAS ACCESS TO WATER
PROXIMITY TO EXISTING SERVICES
PROXIMITY TO EXISTING INFRASTRUCTURE HERITAGE VALUE / IDENTITY
UNIVERSITIES AFFILIATION
RELATIVE PARAMETERS
/ REPLICABILITY
Presenting the data from the previous page in histogram format more easily reveals the assessment of preferred sites for locating Mykolaiv’s innovation district. The assessment shows that MKR. Solyani Territory scores highest given its positive response to nearly all parameters, both objective and relative. Mykolaiv Shipyard Territory and Sunny Micro District also score well, though the design team noted that these sites may be more suitable for a cultural or entertainment/retail destination, given their prime riverfront location closer proximity to the city center.
Sites evaluation
Conveniently located on the main road to Kiev
Very close and well connected to the city centre (within 2km radius)
Services already present in the area
Heritage value - a shipbuilding area is located here, now damaged
Close to existing green areas, parks (Peremohy Park) and leisure facilities
Direct access to water (far from existing buildings, we have the flexibility to show it or not)
The existing buildings, the size and the shape of the site seem to be relevant for a good mix of new building types and renovation of old buildings, while maintaining a certain typological aspect of the project.
Located right in the city centre. This is the most central and iconic location.
Services are already present in the vicinity of the area.
Heritage - There are remnants of industrial shipbuilding architecture here. These could be redeveloped to create a very cool and iconic innovation district.
Proximity to existing green spaces and parks
Direct access to water
The shape of the site and the existing industrial structures don't leave much room for a generic typological strategy for the project. It would require a very bespoke approach
No services in the area (just outside)
Central location, well connected to the city centre and close to services
Some services already available within the site
Good mix of existing building typologies (historic housing, private housing, social housing)
Located along the health corridor, very close to green spaces and parks
Direct access to water
The size and shape of the site is relevant to create a typological part of the innovation district.
Less valuable heritage identity
Most of the site is covered by existing buildings, so the design of the project would be very specific.
Conveniently located on the main road to Kiev
Well connected to the city centre
Some services already exist in the vicinity of the site
Heritage value - the area has military buildings which could be refurbished
The regularity of the scheme could help the project to be less area specific and more typological
Not very central
Not many services already in the area
Not very close to existing green public spaces, more like wild landscaped areas
Connection to the waterfront blocked by private properties
Central location, conveniently situated on one of the main axes of the city
Well connected to the city centre
The site is embedded in the urban fabric and therefore close to all types of services.
Heritage value: former production area, now privately owned
The site is very small
Not very close to existing parks and green networks
No access to water
Direct access to water
Site could be good for creating an innovation district away from the city
Site is very large and empty
Far from the city centre
Not really well connected to the city centre (also visually from the main road)
The site doesn't offer any special existing features, except the connection to the water
Not very close to existing green public spaces, more like wild landscaped areas
Conveniently located on the main road to Kiev
Well connected to the city centre (easily accessible by public transport)
Some services are already in the vicinity of the site
Good size
The site doesn't offer any special existing features
Not very close to existing green public spaces and networks, more wild landscaped areas
No direct access to water
No particular heritage value
Good size
Well connected to the city by public transport, although a little far from the centre
Close to a wide range of services
Close to green areas and parks, as well as public beaches
Direct access to water and remarkable location
Existing residential buildings are very specific and don't seem suitable for renovation and transformation into an innovation district
Far from the city centre
Sites evaluation Оцінка
Semi-central location
Well connected to the city centre
Adjacent to city park and Mykolaiv Zoo
Good size
Located in a very low density residential part of the city
The site itself doesn't offer many interesting features
Not many services around the site
Not very high heritage value (only small family houses)
Semi-central location
Well connected to the city centre
Close to a wide range of services
Heritage value (Town Hall)
The site is very small
The site is not close to existing green networks or public green spaces
Semi-central location
Well connected to the city centre
Existing plans for future (high rise)
Some services available in the area
Site is quite small
Not very central
The site doesn't have any special existing features
Not very close to existing parks and green spaces
Not very high heritage value
Preferred site
After a meticulous assessment and selection process, the One Works technical team has pinpointed a focal area exhibiting optimal characteristics for the integration of an Innovation District.
Acknowledging the critical role of a robust analysis in shaping the Innovation District Masterplan, it becomes imperative to explore the countless variables, impacts, outcomes, and influences that the intervention could have on the existing landscape. Researching and analyzing potential external factors, both direct and indirect, is crucial. Equally essential is the identification of stakeholders who may wield influence over the project's development.
In the following pages, the existing site is analysed in terms of natural features, accessibility and connectivity, socioeconomic aspects and educational and service facilities. This aims to enhance comprehension by simplifying the understanding of external factors that may shape the project's outcome.
In fostering collaborative efforts among diverse partners within the technical team, the site analysis results are summarised in a SWOT analysis, presented in detail in the subsequent section. The strengths, weaknesses, opportunities, and threats have been organized into thematic areas. This delineation serves as a guide for a nuanced exploration of the factors influencing the proposed Innovation District, facilitating a holistic and informed decisionmaking process.
Preferred site - context
Masterplan Mykolaiv | Innovation District | General layout
Based on the site evaluation, the MKR. Solyani Territory scored highest given its positive response to nearly all parameters, both objective and relative. On this basis, we would recommend the MKR. Solyani Territory for the development of the Innovation District, as shown on this page.
The decision to proceed with the study of this specific site has also been approved by the Mykolaiv Municipality, which had been included in the entire analyses and decision-making process.
The exact site boundaries of the Innovation District will have to be agreed with the Municipality, before proceeding with the design stage.
The innovationdistrictis north part of has beenselected variablesandconditionsexplainedin previous chapters variablesled leadintervention, influence future
Photo: Andrey Dronov
Site overview Огляд локації
The area faces the Inhul river, a notable element in the landscape. The project area, strategically positioned along the riverbanks, currently holds the potential to become a central water transport hub, enriching the city's connectivity. The existing public park and surrounding green spaces are recognized for their size and provide valuable urban oases. These areas, equipped with urban furniture and amenities, contribute to the current natural charm of the intervention zone.
Constructed features in the area include operational educational facilities and commercial complexes. While these structures are part of the current urban fabric, the slightly oversized proportions of some commercial complexes may present spatial challenges in the present context. Complementary sports facilities in the vicinity actively contribute to the community's well-being, offering current recreational opportunities. Furthermore, the presence of an electrical substation currently acts as an urban barrier. Exploring ways to repurpose and integrate this utility area into the current urban landscape presents an opportunity for immediate improvements and benefits to the city.
Morphology - residential high density
As mentioned in previous chapters, prototypical multi-storey residential blocks are one of the most common typologies in Mykolaiv. Their architectural pattern is unmistakable, featuring elongated buildings with a strong Soviet heritage. The footprint of these structures often includes expansive open spaces within, which, regrettably, serve little purpose in enhancing the public realm.
This typology is pervasive throughout the city and closely aligns with the architectural context of the project area. It becomes crucial to comprehend the potential impact of this morphology on the internal aspects of the project. Evaluating how the existing architectural style responds both visually and functionally to the project area is of paramount importance for effective urban planning and design.
Surrounding land use:
Morphology - residential low density Морфологія: Житло
The prevailing low-density morphology in Mykolaiv is characterized by individual housing units with 1 or 2 floors, typically forming dispersed settlements on the city's outskirts.
This low-density typology often results in the development of suburbs that face challenges in terms of connectivity to the city, hindering access to essential mobility and public services crucial for a high quality of life. While these low-density settlements are in proximity to the project area, they are not in direct contact. However, there is an opportunity for the project area to fill a vital role by providing necessary services that may be lacking in the local population's current residential areas. By acting as an attractor and urban link, the project area has the potential to significantly enhance the overall well-being of the community.
Morphology - industrial and commercial Морфологія: Промислові
The industrial landscape in the vicinity shares common characteristics with industrial layouts, featuring expansive complexes of buildings surrounded by significant open spaces. In Mykolaiv, industries are strategically positioned near waterfronts, facilitating the transportation of goods and equipment. However, this arrangement unintentionally isolates the local population from the waterfront areas.
It is crucial to engage with this industrial morphology to establish a harmonious coexistence between the proposed development and the existing industrial setup. Leveraging the open spaces can contribute to a seamless transition between the envisioned project and the current state of affairs, fostering a gradual and harmonious integration.
Within the project area itself, there is a notable presence of substantial commercial complexes. As mentioned earlier, these structures exhibit oversized proportions relative to the spatial requirements of the area. Addressing the scale of these commercial spaces is essential to ensure a balanced and cohesive urban development that respects the local context and enhances the overall urban fabric.
Surrounding land use: Industrial and commercial
Morphology - parking and deposits
Given the project area's location on the outskirts of the city, it's common for these spaces to utilize the available area more informally compared to the city center. The city center, due to evident reasons, places significant demands on available space in contrast to the suburban areas.
In the intervention area and its surroundings, there's a prevalent presence of parking lots and storage warehouses, posing challenges to both construction and urban quality. These elements act as barriers between the inner project area and the waterfront, fostering isolation and hindering the community or the city from connecting to the river. It's imperative to regulate and strategically relocate such activities, ensuring their placement aligns with the broader needs of the community rather than serving only private interests.
Connectivity Транспортне сполучення
The intervention area holds a strategic advantage, being situated along one of the primary roads that connect the area to the city and the local airport. Additionally, the transport network provides good coverage, ensuring overall accessibility. However, the current roads lack designated space for alternative or more sustainable modes of mobility.
Despite these advantages, the interior of the area currently lacks an appropriate and functional mobility grid. The existing roads only briefly penetrate the area and lack continuity within it. The presence of informal activities such as parking and private deposit warehouses has resulted in local unpaved roads, negatively impacting the urban quality of sustainable mobility. Furthermore, despite the proximity of the river, there is currently no utilization of its potential for waterway connections.
SWOT analysis SWOT-аналіз
STRENGTHS WEAKNESSES
1. Natural Features: The intervention area is uniquely positioned with rivers on both sides, providing scenic views and the potential for waterfront development. It is also in close proximity to green areas, wetlands, and a public park, enhancing the current natural environment.
2. Accessibility and Connectivity: Proximity to the airport arrivals, a good connection with the city center, and navigable waterways contribute to excellent current connectivity. The present transport network and stations offer comprehensive coverage, promoting accessibility for current residents and businesses.
3. Socioeconomic Aspects: Historically, the area exhibited a positive population growth trend before the war, suggesting the potential for increased economic activity. Currently, local experts endorse the project's feasibility, aligning with community needs. The current official approval from authorities underscores compliance and support.
4. Educational and Service Facilities: Educational facilities are currently present in the area, supporting a holistic community infrastructure. Additionally, the presence of natural reserves, blue corridors, and sports facilities currently adds to the overall quality of life
1. Natural Features: Lack of connectivity with existing natural features due to a gap between urbanized areas and the river, leading to neglect of this valuable resource.
2. Accessibility and Connectivity: Proximity to the airport and city center is a strength, but the area lacks alternative mobility connections. Insufficient sidewalks, poor road conditions, and a lack of inclusiveness for biking or walking exacerbate the issue.
3. Socioeconomic Aspects: Historical growth did not improve urban surroundings; instead, it led to neglect and isolation. Property ownership issues pose a significant barrier to project initiation, requiring resolution as a primary objective.
4. Educational and Service Facilities: While there is a presence of some service variety in the area, the overall service offering remains limited. The concentration of most services in the city center creates accessibility challenges for residents, making it difficult to efficiently access essential services within a reasonable timeframe.
OPPORTUNITIES THREATS
1. Natural Features: Seize the opportunity to establish a genuine connection with the waterfront and existing parks in the area. The intervention area offers a unique chance to strategically plan and utilize open green spaces, ensuring their preservation and fostering a symbiotic relationship between urban development and the natural environment.
2. Accessibility and Connectivity: Explore the possibility of creating a water public transport hub or station within the innovation district, aiming to enhance the entire river network in the city. Embrace the opportunity to champion sustainable mobility by developing dedicated biking and pedestrian paths, promoting eco-friendly transportation options and enhancing overall connectivity. Opportunity for new reforms and urban policies.
3. Socioeconomic Aspects: Leverage the potential to establish an innovation district that acts as a catalyst for creativity and urban regeneration. Integration with the broader context can be achieved by promoting green mobility, creating meaningful green spaces, and facilitating social interactions. These initiatives are poised to significantly contribute to the social and economic development of the population, fostering a dynamic and thriving community.
4. Educational and Service Facilities: Seize the opportunity to implement new and complementary services alongside the existing ones. This strategic move is instrumental in ensuring the efficient delivery of services, meeting the needs of the current and future population in a timely and effective manner. The diversification and enhancement of services contribute to the overall development and well-being of the community.
1. Natural Features: The existence of isolated green open spaces poses a threat, potentially leading to neglected areas within the city. Improper management of the gap between the river level and urbanized areas may result in floods, deteriorating water quality, and negatively impacting the ecosystem in the area.
2. Accessibility and Connectivity: The failure to implement upgrades to the current transport network grid poses a threat to accessibility and mobility. Over-reliance on a singular transportation system may neglect sustainable alternatives, limiting the opportunity for residents to adopt more eco-friendly modes of transportation within the area and in connection with the city and airport.
3. Socioeconomic Aspects: Failure to resolve property ownership issues presents a significant threat, rendering the implementation of the plan impossible. This limitation hampers both the economic and social growth potential for the entire city and sector, posing a considerable obstacle to overall development.
4. Educational and Service Facilities: The absence of future services in the project area poses a threat, compelling residents to seek solutions, alternatives, and services outside the area. This not only forces individuals to spend extra time seeking necessities but also disrupts optimal timeframes for a high-quality urban life. The lack of local services can potentially hinder the overall well-being and satisfaction of the community
SWOT analysis
1.
Community Engagement
List of meetings with local stakeholders
In order to ensure public engagement and collect valuable information, since August 2022 the Oneworks Team has been involved in several meetings with different stakeholders and partners, both local and international. the table to the right reports a complete list of the meetings and workshops. Thanks to the help of the Municipality, the selection of invited attendees always aimed at guaranteeing an adequate representation of different genders and community groups. Among the various meetings and workshops held since the inception of of the project, three workshops in particular allowed to gather crucial information. These are summarised in the following pages.
During the initial phase of the assessment, the team faced a formidable challenge in capturing a comprehensive snapshot of the city with its needs and aspirations. This task was particularly demanding as it required delving into the essence of the city's character before the onset of the conflict, all while being hindered by the inability to conduct on-site visits. Beyond relying solely on maps and data, gaining an intimate understanding of the city necessitated tapping into the perspectives of diverse stakeholders. In launching the UN4Mykolaiv project, the Oneworks team strategically fostered an ongoing and robust correspondence with the Municipality of Mykolaiv. This proactive engagement facilitated the distribution of questionnaires to the entire population and the implementation of meetings involving various stakeholders. These efforts were instrumental in overcoming the limitations of physical presence and ensuring a holistic grasp of the city's dynamics. This chapter summarises the outcomes of the most pivotal workshops that unfolded during this first phase of assessment. The inaugural session served as a public forum, unveiling the project to the community and eliciting general comments. Subsequently, a second gathering focused on interfacing with architects and local experts in Mykolaiv. This occasion provided a platform to glean more specialized insights into the city's needs, particularly from the perspectives of urban planning and architecture.
The third workshop was dedicated to exploring the critical theme of the riverfront and shipbuilding—a topic of paramount importance due to Mykolaiv's geographical position along a substantial river and its historical ties to shipbuilding and port logistics. Engaging various stakeholders active in this domain was indispensable in comprehending the nuances of this facet. The outcome of these workshops was the meticulous documentation of objectives and needs articulated by stakeholders from the public, private, and third sectors alike.
01. Public Hearing on UN4Mykolaiv project
Oneworks attended the meeting and introduced itself to the citizens. It then collected written and oral comments from the meeting to integrate them into the analyses
Description of the meeting
The meeting took place online on the 10th November 2022, with the participation of citizens and members of the City Council. Presenting the UN4Mykolaiv project was Yevhen Poliakov, Deputy Director of the Department of Architecture and Urban Planning of Mykolaiv City Council.
The UN4Mykolaiv project as well as UNECE and Oneworks were introduced, explaining how the latter contribute to the project. The vision and principles on which the development of the masterplan will be based were presented. A debate was held to allow each participant to express his or her impressions, ask questions and leave written comments.
Objectives
• Inform the citizens of Mykolaiv about the project
• Gain feedback from the public regarding their main concerns and needs
• Answer to the questions about the projects
Outcomes
PEDESTRIAN ORIENTED CITY
• Create spaces made for people and soft and green mobility
• Public transport
• Public spaces and sidewalks
• Renovation of parks with new amenities
RIVERFRONT VALORISATION
BOMB SHELTERING
• Transform the riverside into the heart of the public city
• Green and public spaces
• Attractive and touristic places
• Integration with the urban environment
• Safe and multifunctional spaces underground
• Underground bomb shelters accessible for everyone
• In peacetime, they can become places for storing personal belongings, parking bicycles and cars.
•
Workshop with Local Architects
Description of the meeting
The meeting was attended by members of the Oneworks team, UNECE project coordinators, representatives of the Mykolaiv municipality, and several local architects from both the public and private sectors from the city of Mykolaiv. In addition, members of the Strategic Urban Planning Department of the City of Tallinn participated. The Oneworks team introduced themselves to the local experts, presenting the work that UN4Mykolaiv project was going to develop. The local experts introduced themselves and then extensively described to the Oneworks team the most critical issues for the city, the priority needs for interventions, and the methods and approaches they would apply. As the Oneworks team was not yet able to conduct site visits due to the ongoing conflict, they had the opportunity to get a more detailed picture of the city through this meeting. The head of Urban Planning Department for the city of Tallinn presented the case study of Tallinn's waterfront regeneration, to offer inspiration on possible development and regeneration strategies for the city.
In the final part of the workshop, the activity 'Mykolaiv in a minute' was proposed, in which the local experts (both architects and members of the municipality) were asked to describe in less than a minute how they envisioned the development of Mykolaiv once the conflict was over. This simple exercise was helpful in capturing the desires and ambitions of the local population.
Objectives
• Meet and
• Have a preliminary discussion about the vision for the urban Development of Mykolaiv
• Take up international good
"A city in which children can grow, study and work. A city in which you can rest during the weekend, with easy access to surrounding nature."
"Not only a port hub, but also a cultural hub."
"The port must develop in order to assist and rather than imparining the citizens’ life."
"Place-making
"Development of underground, bridges, connected industry, pedestrian and bicycle bridges, cable car bridges, infrastructures to connect every district
"A human-centered city: services, comfort, good air and multi-functional development (education, port and agriculture)"
"A comfortable city, in which everyone can find their place and an opportunity to apply their talent.
A green city, through the transformation of destroyed buildings into green public spaces.
A young city, to study and to find job opportunities.
A safe city, creating shelters from nuclear station."
MYKOLAIV IN A MINUTE
"The masterplan must facilitate long-term and international development.
"Military areas must be removed or moved outside the city borders."
"The future will embrace the development of tourism, industry, culture, university and international relations."
"A city capable to welcome the return of displaced people and new arrivals."
"Residential buildings and social infrastructures;
Local Workshop on Shipbuilding and Waterfront
Council for the Implementation
• Representatives of Estonian Government
• Head of regional Platform for Reforms
• Representatives of NGO "Yact Club Strelka"
• Representatives of the Water Industry
• Oneworks representatives I
Objectives
Oneworks
• Understand what the current issues and priorities are, from the perspective of different stakeholders.
• To come up with a set of strategic objectives for the future development of the
and shipbuilding industry.
Description of the meeting
On 12 January 2023, the Mykolaiv Municipality organised a zoom online meeting with representatives of the Public Council of Experts of the Mykolaiv Municipality Executive Committee, the Public Council for Tourism Development at the Mykolaiv Municipality Economic Development Department, and the Coordination Council for the implementation of the concept of river development and small-scale navigation in the city of Mykolaiv. The head of the Regional Platform for Reforms, a representative of the Estonian government, representatives of the 'Water Industry' and UNECE representatives, and members of the Oneworks team also attended.
During the meeting, numerous topics related to the development of the waterfront, the river and shipyard economy and, more generally, the river as an important resource for the economic and social development of the city of Mykolaiv were discussed.
The city aims to leverage its historical advantages for small shipping and yacht tourism businesses, with a focus on creating a modern infrastructure for navigation and enhancing water-related recreational opportunities. The integration of the Concept for the Development of Rivers and Small Navigation is a central aspect of the city's strategic planning.
Modernise shipping infrastructure
In order to make the port comfortable and thus attractive to boat owners, it is necessary to innovate the various facilities and services related to the production, repair, parking and manufacture of nautical objects.
Develop water enterteinment & amenities
Creating quality, accessible and multi-functional public spaces. Make the water-front an attractive space capable of hosting sports, leisure and cultural events for different population groups.
Set up water evacuation system
Due to the threat of war and the possible risk of bombardment of bridges over the river, an effective evacuation system must be established via water transports from one side of the river to the other
Installation of innovative sewage treatment system
Analyses of the ecosystem near the river area show that several areas on the city do not reach sanitary standards. It is therefore necessary to install or renovate sewage treatment systems to prevent pollution of the river and the surrounding ecosystem.
Develop Public Water Transport
For a city with two riverbanks, a well-functioning, waterborne public transport system is essential to ensure accessibility, and to develop the interaction and attraction of all neighbourhoods and their riverfronts.
Regulation of water industry
Ensure transparency and acocuntability with respect to the use of riverbanks for industrial purposes. Adapt urban policy to new national regulations on land use and ownership of industry and riverfront.
04.Cultural Heritage
Objectives
The workshop sought to discuss cultural heritage preservation principles, explore opportunities for including new building types in the conservation list, prioritize restoration projects in Mykolaiv, and identify a suitable location for the a pilot heritage project.
Description of the workshop and main outcomes
At the crossroads of urban development and policy formulation, the Politecnico Urban Policies experts explored potential issues and opportunities in establishing new urban policiy practices for Mykolaiv.
The experts enquired the feasibility of adopting a broader perspective, broadening the approach to include metropolitan and national perspectives. The local experts responded in the affirmative, welcoming future specific capacity building workshops to discuss these topics in detail. In light of the complex legal landscape, it was suggested that local architects, planning and law experts, citizens, students, and academics alike should be involved, to ensure comprehensive dialogue and exchange.
The discussion then focused on the recent reforms to the national planning system. The Mykolaiv representatives explained their reluctance to endorse draft law no. 5655, citing concerns about its impact on local government powers. Instead, they expressed interest in collaboratively developing a new urban development code.
Recognising the importance of public participation, the team discussed the possibility of further engagement. Both parties agreed on the need for continued consultation, emphasising the importance of avoiding redundancy in questioning participants.
Lastly, the legal status of properties owned by Russian entities was discussed, because of its impact on future urban planning strategies. The team sought clarity on the existence of a land ownership registry mapping such properties and their future disposition. Mykolaiv representatives explained that the status of Russian-owned properties remains unclear at national level. In addition, due to the ongoing conflict, the register is not currently available. However, their offered their support in compiling as many information as possible.
In conclusion, the collaborative efforts of the Politecnico team and the Mykolaiv authorities laid the groundwork for informed decisionmaking and inclusive urban policy formulation in Mykolaiv.
05.Urban Policies
Objectives
To assess the feasibility of adopting broader perspectives, reforming the national planning system, enhancing public participation, and addressing legal complexities surrounding property ownership.I
Description of the workshop and main outcomes
At the crossroads of urban development and policy formulation, the Politecnico Urban Policies experts explored potential issues and opportunities in establishing new urban policiy practices for Mykolaiv.
The experts enquired the feasibility of adopting a broader perspective, broadening the approach to include metropolitan and national perspectives. The local experts responded in the affirmative, welcoming future specific capacity building workshops to discuss these topics in detail. In light of the complex legal landscape, it was suggested that local architects, planning and law experts, citizens, students, and academics alike should be involved, to ensure comprehensive dialogue and exchange.
The discussion then focused on the recent reforms to the national planning system. The Mykolaiv representatives explained their reluctance to endorse draft law no. 5655, citing concerns about its impact on local government powers. Instead, they expressed interest in collaboratively developing a new urban development code.
Recognising the importance of public participation, the team discussed the possibility of further engagement. Both parties agreed on the need for continued consultation, emphasising the importance of avoiding redundancy in questioning participants.
Lastly, the legal status of properties owned by Russian entities was discussed, because of its impact on future urban planning strategies. The team sought clarity on the existence of a land ownership registry mapping such properties and their future disposition. Mykolaiv representatives explained that the status of Russian-owned properties remains unclear at national level. In addition, due to the ongoing conflict, the register is not currently available. However, their offered their support in compiling as many information as possible.
In conclusion, the collaborative efforts of the Politecnico team and the Mykolaiv authorities laid the groundwork for informed decisionmaking and inclusive urban policy formulation in Mykolaiv.