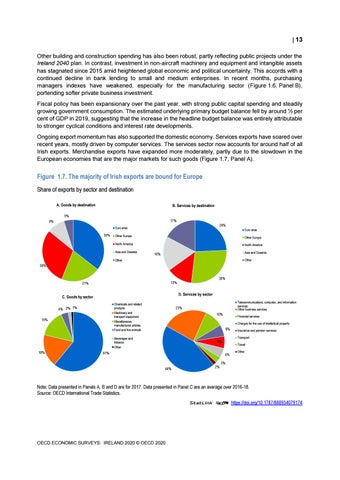
13 Other building and construction spending has also been robust, partly reflecting public projects under the Ireland 2040 plan. In contrast, investment in non-aircraft machinery and equipment and intangible assets has stagnated since 2015 amid heightened global economic and political uncertainty. This accords with a continued decline in bank lending to small and medium enterprises. In recent months, purchasing managers indexes have weakened, especially for the manufacturing sector (Figure 1.6, Panel B), portending softer private business investment. Fiscal policy has been expansionary over the past year, with strong public capital spending and steadily growing government consumption. The estimated underlying primary budget balance fell by around ½ per cent of GDP in 2019, suggesting that the increase in the headline budget balance was entirely attributable to stronger cyclical conditions and interest rate developments. Ongoing export momentum has also supported the domestic economy. Services exports have soared over recent years, mostly driven by computer services. The services sector now accounts for around half of all Irish exports. Merchandise exports have expanded more moderately, partly due to the slowdown in the European economies that are the major markets for such goods (Figure 1.7, Panel A).
Figure 1.7. The majority of Irish exports are bound for Europe Share of exports by sector and destination A. Goods by destination
B. Services by destination
5% 17%
9%
24%
Euro area
35%
Euro area
Other Europe
Other Europe
North America
North America
Asia and Oceania
Asia and Oceania
18%
Other
Other
30% 28% 13%
21%
D. Services by sector
C. Goods by sector Chemicals and related products Machinery and transport equipment Miscellaneous manufactured articles Food and live animals
4% 2% 1% 15%
10%
Financial services Charges for the use of intellectual property
6%
Beverages and tobacco Other
18%
Telecommunications, computer, and information services Other business services
23%
Transport
6%
61%
Travel
5%
44%
2%
Insurance and pension services
Other
3%
Note: Data presented in Panels A, B and D are for 2017. Data presented in Panel C are an average over 2016-18. Source: OECD International Trade Statistics. StatLink 2 https://doi.org/10.1787/888934079174
OECD ECONOMIC SURVEYS: IRELAND 2020 © OECD 2020