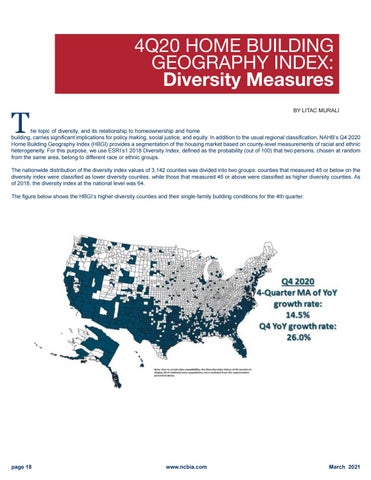
4Q20 HOME BUILDING GEOGRAPHY INDEX: Diversity Measures
T
BY LITAC MURALI
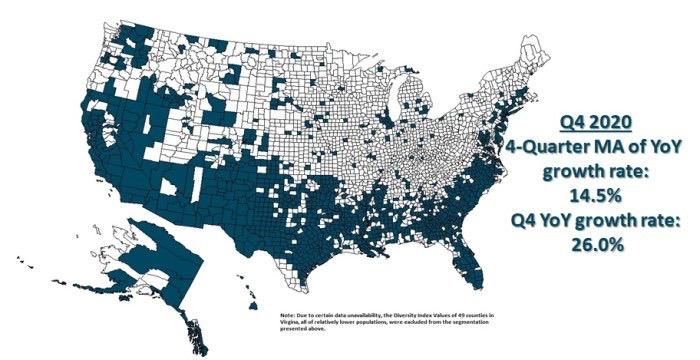
he topic of diversity, and its relationship to homeownership and home building, carries significant implications for policy making, social justice, and equity. In addition to the usual regional classification, NAHB’s Q4 2020 Home Building Geography Index (HBGI) provides a segmentation of the housing market based on county-level measurements of racial and ethnic heterogeneity. For this purpose, we use ESRI’s1 2018 Diversity Index, defined as the probability (out of 100) that two persons, chosen at random from the same area, belong to different race or ethnic groups. The nationwide distribution of the diversity index values of 3,142 counties was divided into two groups: counties that measured 45 or below on the diversity index were classified as lower diversity counties, while those that measured 46 or above were classified as higher diversity counties. As of 2018, the diversity index at the national level was 64. The figure below shows the HBGI’s higher-diversity counties and their single-family building conditions for the 4th quarter.
page 18
www.ncbia.com
March 2021