MANAGEMENT REPORT AND CONSOLIDATED FINANCIAL STATEMENTS
01. IDENTITY AND ORGANISATION A NARRATIVE DRIVEN BY PEOPLE Brand, identity and culture 13 Business areas 21 Big numbers 31 Governance model 35 New organisational structure 39 1.1. 1.2. 1.3. 1.4. 1.5. 03. PEOPLE FLUENT IN DRIVING TALENT Our people 82 People management - Governance model 84 Recruitment and selection 86 Training and development 88 Compensation and benefits 90 Covid-19 92 Communication 95 3.1. 3.2. 3.3. 3.4. 3.5. 3.6. 3.7. 02. STRATEGY BUILDING OUR FUTURE Focus: strategy 2021-25 49 Corporate projects 53 Sustainable Motions: Nors ESG strategy 67 2.1. 2.2. 2.3.
índice 04. PERFORMANCE AN OVERCOMING STORY Main macroeconomic indicators 101 Economic performance 129 Risks and uncertainties 169 2022 in perspective 175 4.1. 4.2. 4.3. 4.4. 05. FINANCIAL INFORMATION A JOURNEY OF PERFORMANCE Financial statements 183 Annex to the financial statements 191 5.1. 5.2.

PAGE 4
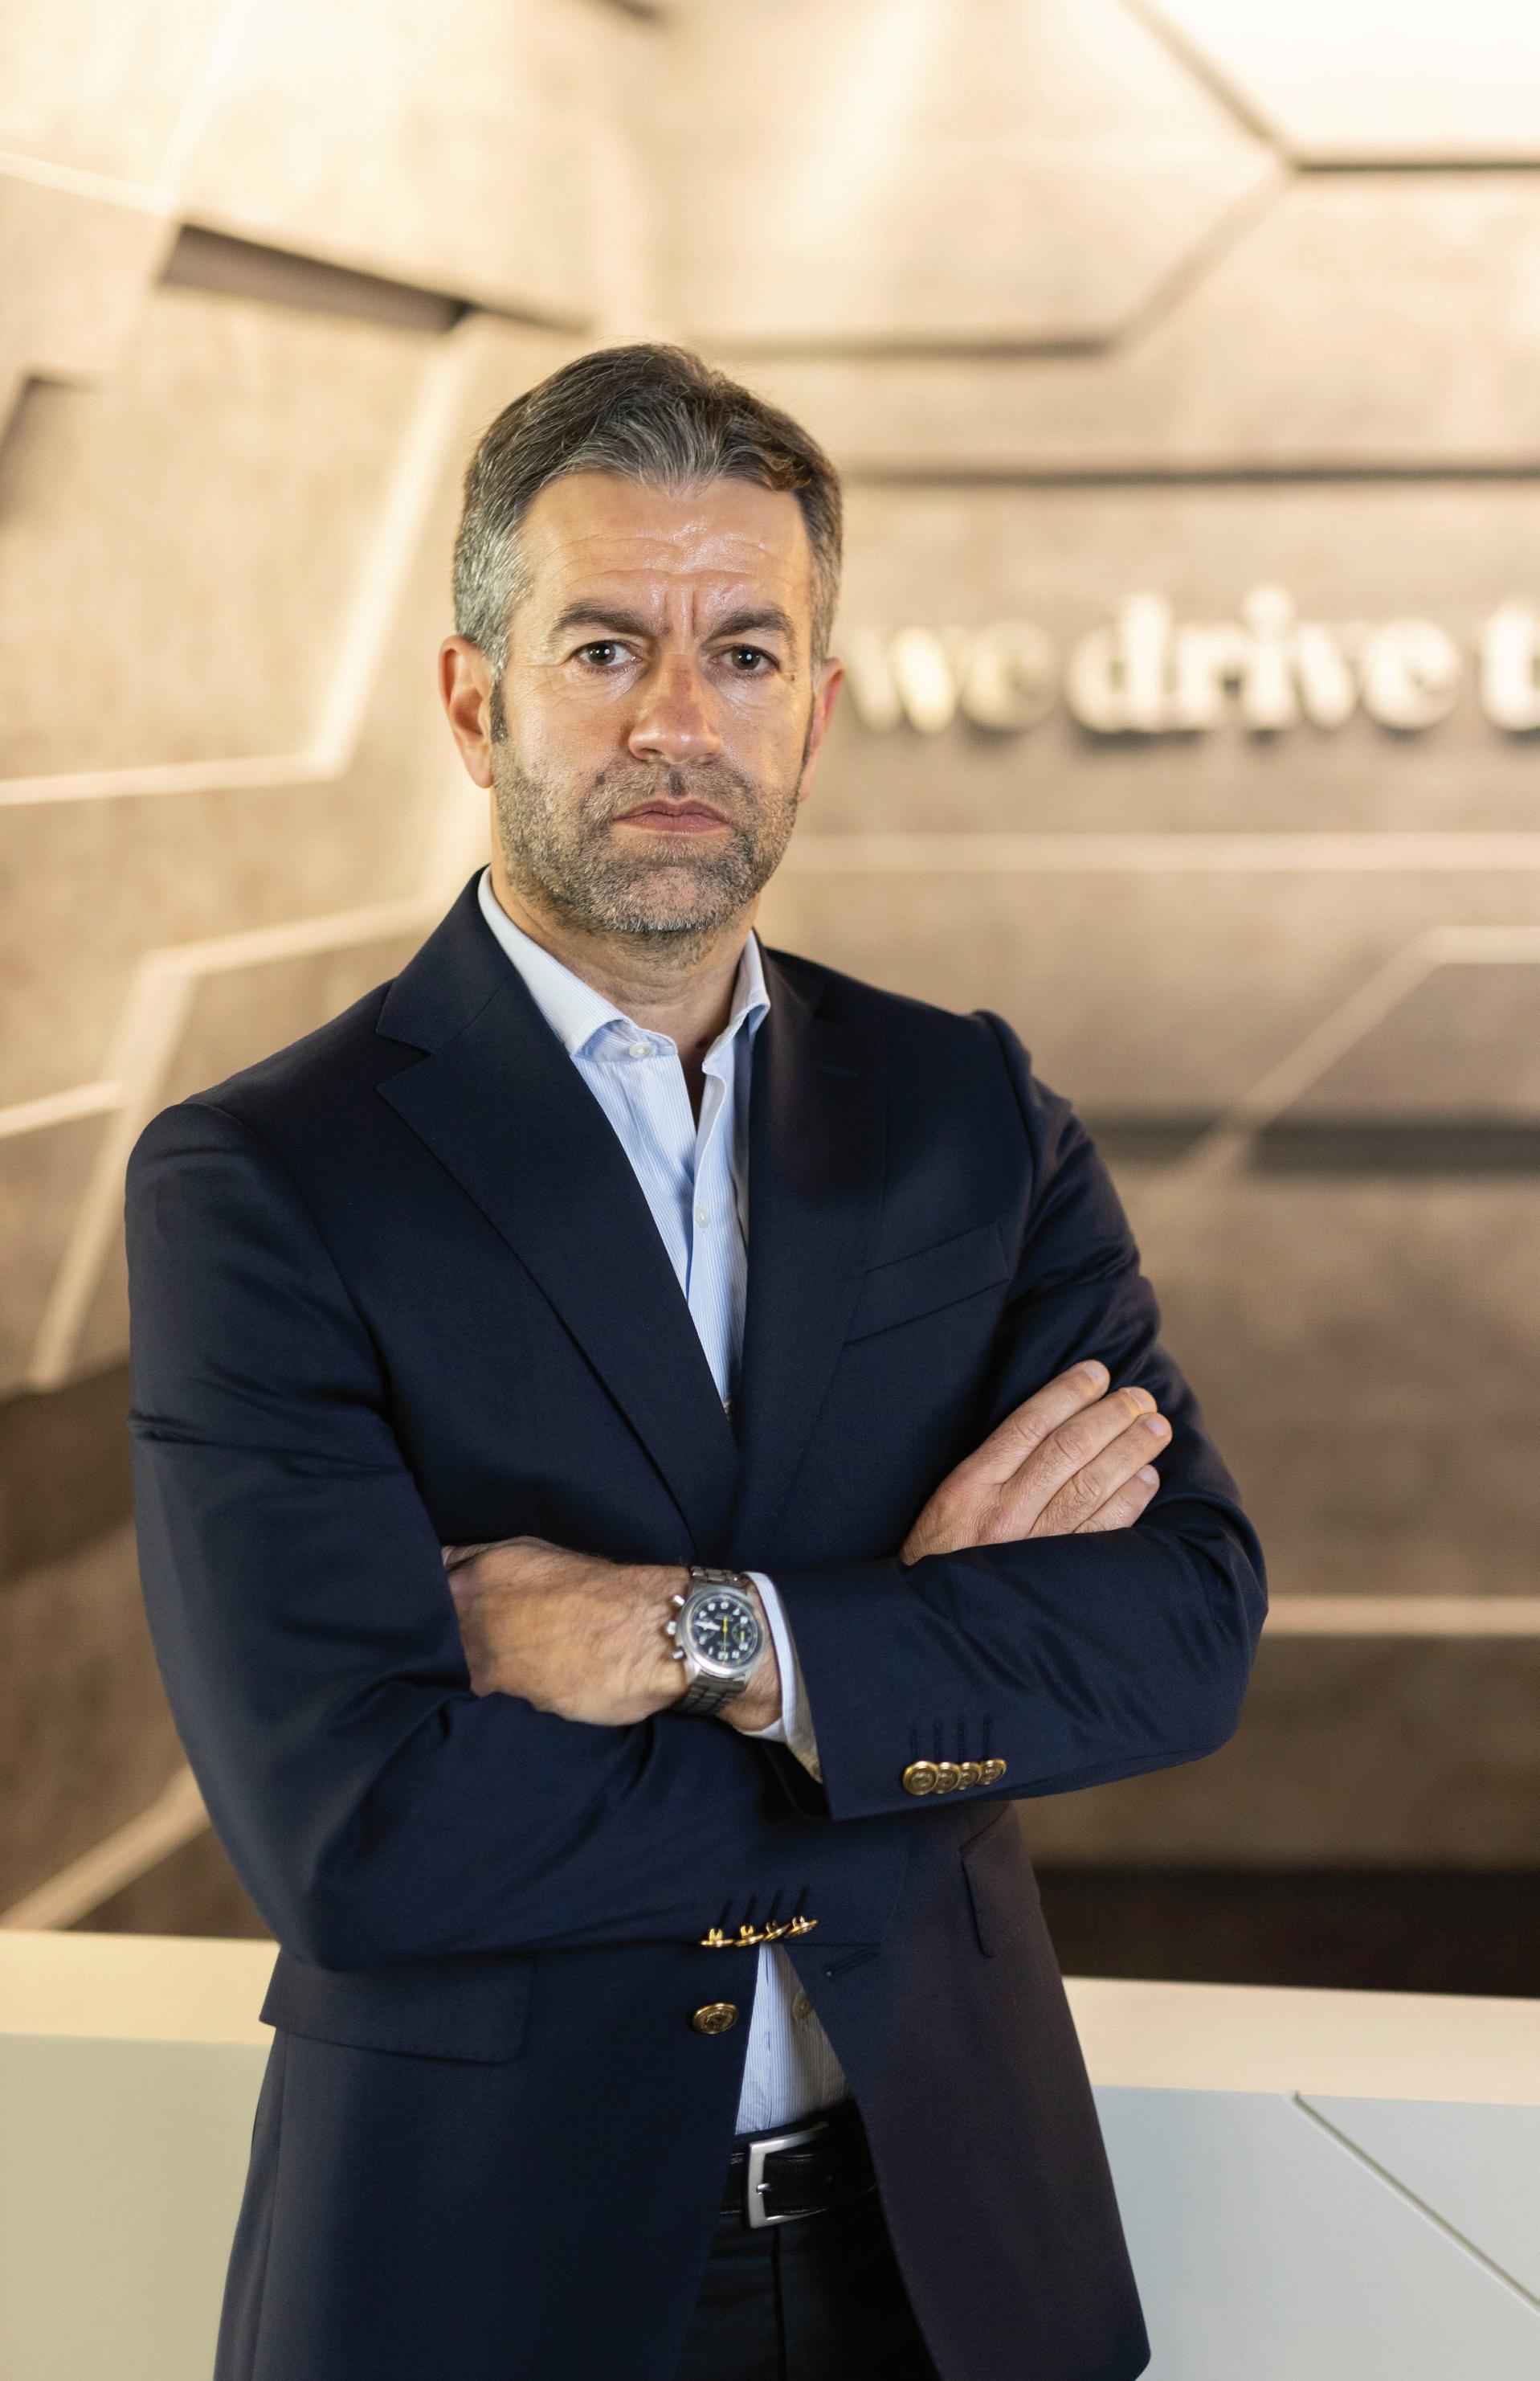
Group CEO
A message from
building a vision of future
If 2020 was considered, in History, as an exceptional year, we look to 2021 with one word in mind: overcoming.
It was with the adversity of times as background, particularly at an early stage of the year, that our teams faced every challenge, overcoming the uncertainties and endorsing an undeniable capacity to build a firm and consolidated vision of where we want to be and of what truly drives us.
2021 was also a year of major changes for the Group: we began a reorganisation process, inherent to the creation of new areas and to the systematisation of processes, which allowed us to embody important projects that will sustain our strategy. Over the next few years, Nors will focus on transforming both the customer and employee experiences, never forgetting our genesis and the ambition to continue to grow sustainably.
It is also with a global performance that clearly surpasses the goals initially defined, and which has allowed the Nors Group to achieve historic results, that we close the year. This path can only be translated as a reason to be proud of the commitment and involvement of our people, anywhere in the world.
Building and assuming Nors ' vision for the future means rooting clear goals, living one step ahead of our ambition and leading tomorrow: side by side with resilience, with a sense of commitment and with the focus we have always had.
PAGE 5
identity and organisation

narrative driven by people
01. 1.1. brand, identity and culture 11 1.2. business areas 29 1.3. big numbers 39 1.3.1. Sales by country 40 1.3.2. Sales by business area 40 1.3.3. Sales evolution 40 1.3.4. Main indicators 40 1.4. governance model 43 1.4.1. Governance model 44 1.4.2. Organisational structures 49 1.4.3. Ownership structure 50 1.5. new organisational structure 53
a
1.1. brand, identity and culture
converging through a plural accent
a path born of constant sharing
The 2021’s pace set the tone for the constant imminence of looking at Nors brand’s footprint: thinking it through, reflecting it and converging the narrative that has been shaping the Group's voice throughout recent years.
In 2020, with a wide universe of new communication channels consolidating their presence on organisation's daily life, Nors identity’s path has been defined by two key concepts: evangelisation and dissemination. New languages and formats took a clear place within the message communicated by the Group, which absorbed every element and idea of a renewed brand, challenging the status quo
In turn, 2021 brought an emphasis marked by the concepts of convergence, conciliation and connection, hand in hand with the purpose of ensuring that the foundations of an identity as ambitious as insightful are absorbed and perpetuated by every geography, structure and person who integrates Nors universe as a corporate brand.
Thinking of all those who truly feel and live the Nors identity, the year has been one of involvement, sharing and collaboration. Listening to reflect and involving in order to generate trust: these are the premises that mirror a Group culture built around a legacy that is focused on nurturing relationships - for long and consistent years.
PAGE 10 CHAPTER 01.

PAGE 11 CHAPTER 01.
the purpose that drives us
a path built on trust

Faced with a narrative cast in a human and personal focus, we believe that the statement that communicates the reason of our existence - the "why" behind what we do every day - could not neglect two key concepts: trust and long-lasting relationships
Our purpose resonates across our whole operation - whatever the business area or organisational group - and in all those who endorse the mission of building strong and solid relationships with all our stakeholders. With people in the centre of our culture strategy, it is from the inside out that we embrace a movement of trust, humanisation, and based on enhancing the ties that brought us to 2021 with more grit than ever.
PAGE 12 CHAPTER 01.
Driving trust through long-lasting relationships

PAGE 13 CHAPTER 01.
attributes that define our brand
ambition and resilience


We nurture an ambition that moves mountains. We are daily inspired by a path of courage and discovery, looking forward to the next big step.
transparency and integrity
Integrity runs in our DNA: we embrace a strong sense of commitment and fairness in all the relationships that mark the journey of our operation.
ambitious transparent CHAPTER 01. PAGE 14
Such a sturdy and ambitious personality, as the one Nors advocates, is built within a legacy of years of History. We wear each of the attributes that make up our identity, acting under its core - every day and everywhere in the world where the Nors culture breathes.
trustworthy relationships
Our family heritage makes it even more crystal clear how important it is to cement relationships of trust with all those who cross our path.

charisma and attitude
The diplomacy and sobriety that defines us mirror the story we write every day: what we live, what we share and the new routes we want to take.

personal charming
CHAPTER 01. PAGE 15
one motto in unison: we drive trust

CHAPTER 01. PAGE 16
The tagline "we drive trust" sets the tone for the Nors brand's narrative of trust. In three simple terms, the motto we seek to embrace daily mirrors each element of our personality: the plurality of the "we", which cements the fact that we approach any challenge with a sense of unity and teamwork; the connection to our core and to leading a path of consistency and robustness in the sectors in which we operate; and trust, an element continuously present in the storyline that establishes our performance.

PAGE 17 CHAPTER 01.
the aggregating attitude of being Nors

PAGE 18 CHAPTER 01.
The undeniable contribution of our people to the 88-year path we have been building is fundamental. From leadership layers to the roles that face the operation's front line, it is in people, their talent and commitment that the culture that emerges from the Group's foundations lives and perpetuates.
From Portugal, where the purpose of being Nors was born, to Angola, the first international market to which the Group headed, going through each of the countries in which we operate today, we are a Group made up of business areas, cultures and generations as different as they are complementary. Uniting the experience and legacy of some with the thirst for the future of others, it is in a persistently human, personal and collaborative attitude that we lay the foundations of being Nors .
PAGE 19 CHAPTER 01.
our narrative’s personification
We believe that a truly remarkable attitude is made of years of experiences, challenges and stories to tell. An organisational culture, when endorsed by all those who have a word of motivation and leadership within their teams, makes us believe that any obstacle falls short of our courage to face new journeys and horizons.
Our people's diversity is also mirrored in our leadership's morphology: from the Corporate Head Offices to the different companies that our business portfolio comprises, the leaders that coordinate and guide Nors structures have a clear vision of the Group's culture and personality and of its relevance, materialising each premise of this approach in their day-to-day operations. It is in this vision of involvement and motivation that our voice relies - the voice that makes us Nors .
PAGE 20 CHAPTER 01.
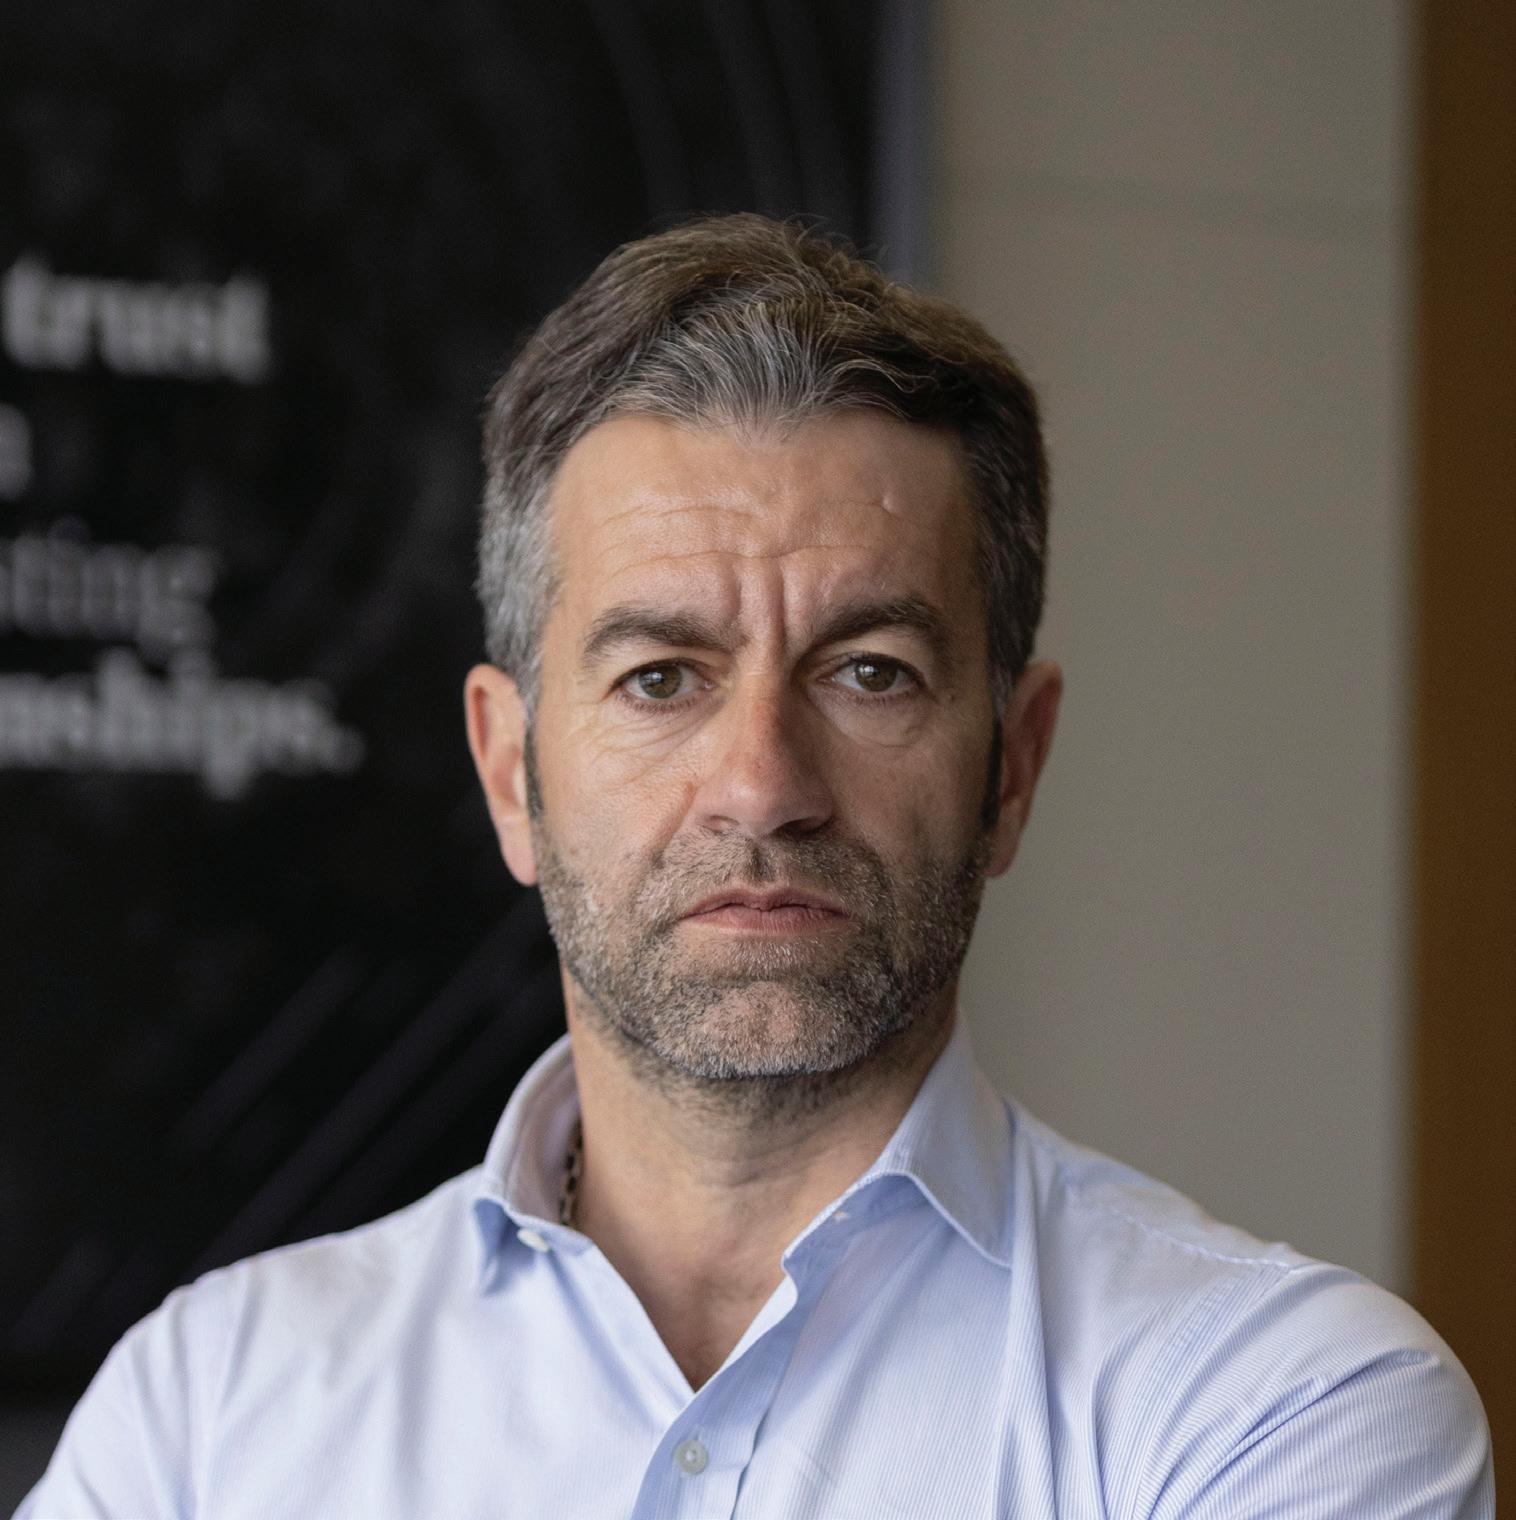
Luísa Neto Group Legal Director Holding Corporate Centre Portugal
In an increasingly global, fast-paced and competitive world, Nors , with more than 80 years of history, has always been able to react and adapt to the changes happening in the world.
Today, more than ever, we feel the ambition to impact positively all those who interact with us, one way or another. We live in an entrepreneurial atmosphere, rich in opportunities: with a global presence, the interaction between different cultures makes us grow every day as individuals.
Above all, I truly value the future-oriented approach, without losing sight of the trust and transparency that have always guided the Group's activity.
PAGE 21 CHAPTER 01.
Afonso Martins Galius CEO Portugal
Speaking about Nors identity carries a great responsibility for the Group's long and rich history which, in my case, with a path of 18 years, positively resembles a lifetime. Beyond the inarguable pride, working at Nors involves a clear understanding of our shareholders and the Executive Board's mission regarding the intrinsic values of the organisation, of which I would highlight transparency. This value is, for me, clear and essential every day, both in the relationship with stakeholders (customers, suppliers and others) but, above all, internally. Transparency guarantees involvement, ensuring team strength for all challenges, especially the most challenging ones.
In these 18 years, I have had the privilege and the opportunity to work with different geographies and business areas, dealing with a great diversity of cultures and people, from Brazil to Africa and Portugal. Whether in aftermarket, trucks, construction equipment or, recently, in Galius (Renault Trucks), I am sure that what is unchanging are the values and the obligation to uphold them in the different realities.

PAGE 22 CHAPTER 01.
João Vaz
Auto Sueco Angola CEO Angola
Throughout more than 80 years of history, I believe that people have been the fundamental pillar of our success in the different countries in where we are present.
Daily, we challenge our people to leverage their personal and professional growth, providing autonomy, initiative spirit and promoting transparency by sharing ideas and helping each other. With this close and trusting approach, we build solid relationships, letting the ambition and passion of our professionals in what they do every day raise us to a higher level of quality and reliability, making us reach further.
I believe that this is the formula that has contributed to the level of trust that distinguishes us today. With our eyes on the future and practising these values, we will transform our capacity to do more and better, contributing to the growth and success of our clients' activity, whom, today, know they can count on us, wherever we are.
PAGE 23 CHAPTER 01.
Isabel Santos Brazil Shared Services Director (Norshare) Brazil

The Nors Group is following a path of cumulative achievements, a result of its capacity to reinvent itself, facing the imposed challenges, especially on the segment in which we operate. These same challenges, combined with years of experience, have contributed to significant progression, year after year.
The Group's capacity to operate in different markets is remarkable: expanding its presence and disseminating its mission, values and ambition to employees, who are proud to be part of a successful story, with welldeserved respect.
Faced with the atypical situations suffered in recent years, people's involvement has, once again, proved our employee's resilience and strength in achieving the Group's goals, going beyond their limits, and resulting in their professional and personal development.
PAGE 24 CHAPTER 01.
Oliver Nachevski Strongco CEO Canada
Since the Nors acquisition and the launch of the Strongco new brand guidelines, our team has been undergoing a period of change and adaptation. It has been, and continues to be, a positive journey of transformation that gives Strongco the ability to build and convey a consistent message which integrates both the strength of the Nors brand and the positive culture of support and collaboration within our organization. The values of transparency, ambition, trust and relationships are embraced and accepted as part of our daily lives at Strongco.
True to their words, the Nors initiative to purchase Strongco two years ago has allowed us to unlock the potential for growth, competitiveness, and the ability to become a market leader by removing the obstacles that the organization faced previously.
The support provided by Nors teams positively illustrates their level of commitment to the success of our business. It is with great enthusiasm that we integrate, as a family member, the Nors Group.
PAGE 25 CHAPTER 01.
1.2. business areas
a journey of permanent ambition
a universe of ambition
PÁGINA 28 CHAPTER 01.
We have been driving the strength and reliability of each of our businesses for 88 years - from Europe to Africa and from North to South America. With a diverse business portfolio, we guarantee a cross-sector approach through transport and mobility solutions, construction and agricultural equipment, and after-sales services - always open to any opportunities tomorrow may bring. Building relationships based on trust, knowledge and experience is our motto: we take the we drive trust with us always, wherever the future takes us.

PAGE 29 CHAPTER 01.
Nors mobility
The Nors Mobility segment brings together a set of solutions capable to respond to our customers' mobility and transportation needs. From heavy vehicles, such as trucks and buses, to cars, generators and marine and industrial engines, we guarantee a dedicated offer with a global scope.
In this business area, we integrate the Auto Sueco, Auto Sueco Automóveis, Galius and KinLai brands.
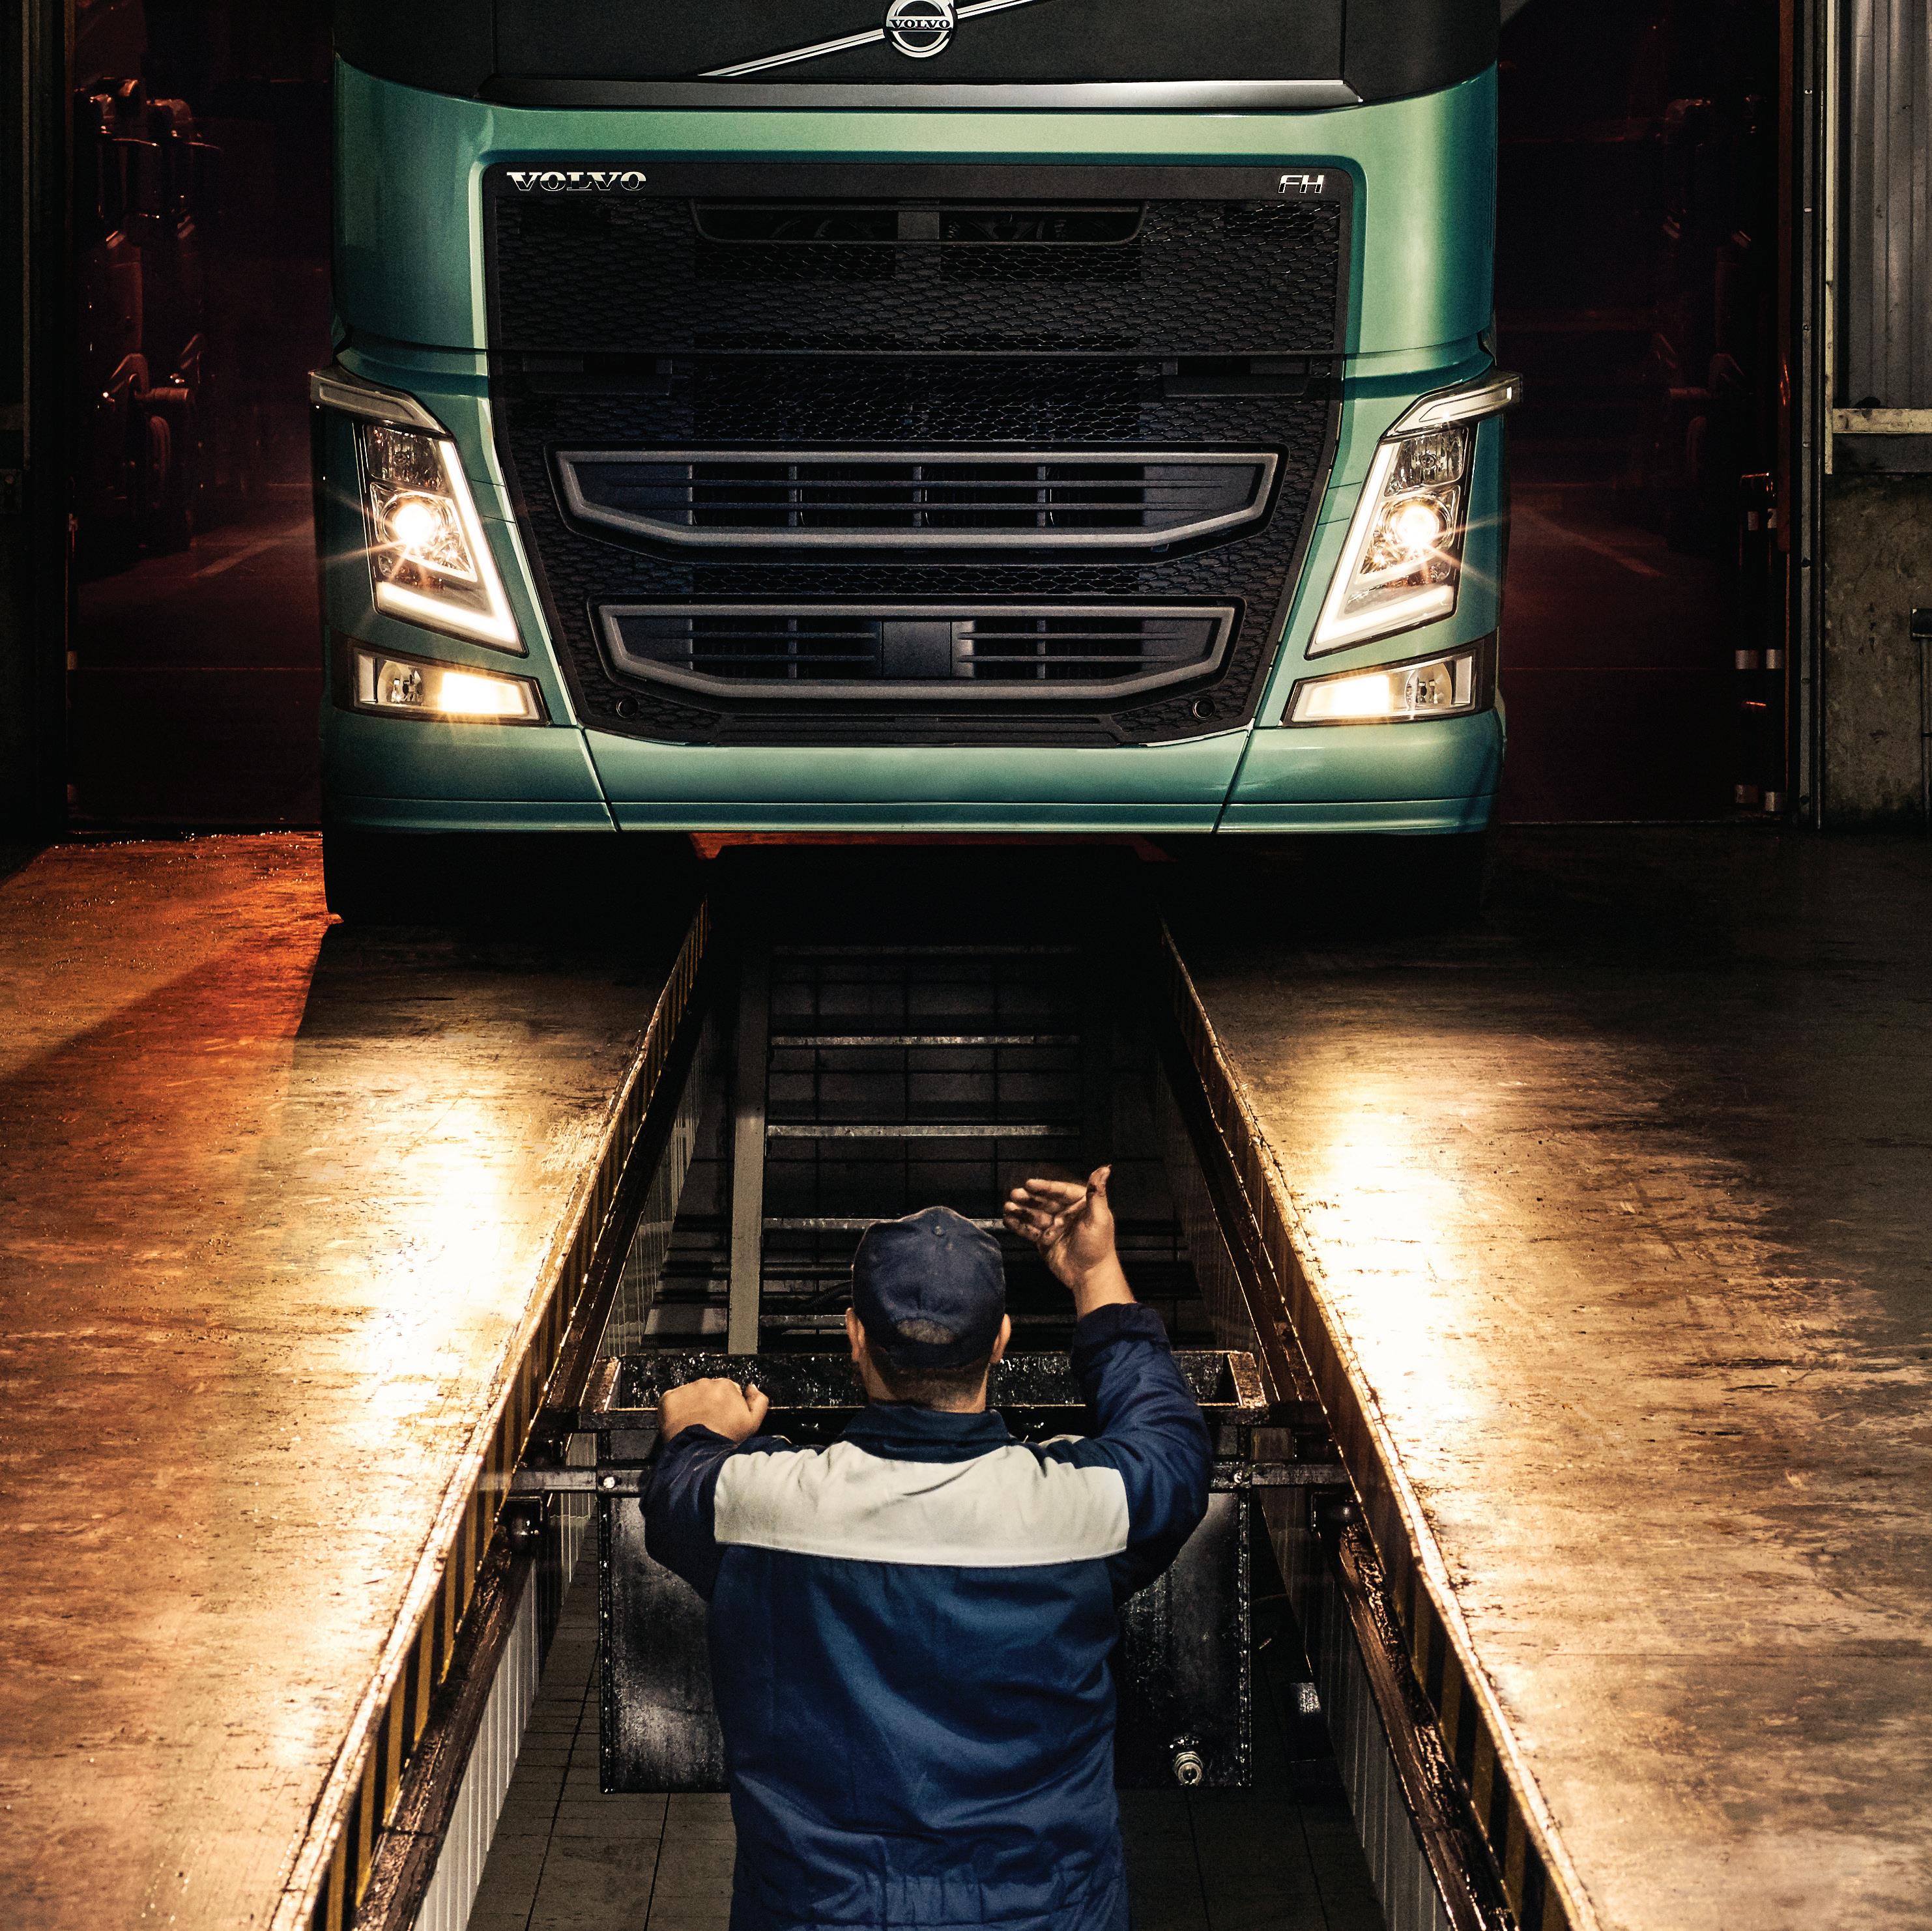
Auto Sueco started its activity in Portugal with the distribution of Volvo brand products. Today, with decades of history, besides Portugal, it is present in 5 markets - Angola, Brazil, Botswana, Mozambique and Namibia - with a portfolio of products and services adapted to each geography. Taking a transversal approach, it distributes a diversified range of products, with a focus on Volvo trucks. The offer also encompasses Volvo buses, Volvo Penta marine and industrial engines, KohlerSDMO generators and Isuzu buses, among others.
Auto Sueco Automóveis is the Nors Group brand operating in the retail car market in Portugal. With six dealerships from north to south of the country, it represents a comprehensive portfolio of brands in the light vehicle segment - Volvo, Mazda, Land Rover, Jaguar and Honda. It ensures a cross-sectional response to market needs, combining commercial solutions with the guarantee of a 360º service in the after-sales area.
PAGE 30 CHAPTER 01.
Galius began its operation in 2015, with the exclusive representation of Renault Trucks in the Portuguese market. Specialised in the commercialisation of new and used trucks, it provides a transversal offer to the different transport sectors: distribution, construction, long distance, among others. It also guarantees an agile, integrated and efficient after-sales service, with a distribution and assistance network that includes nine locations throughout the country.
KinLai, founded in 2020, is the official distributor of Dongfeng Trucks in Angola. With a diversified portfolio of trucks, aimed at the medium and high ranges, it also operates in the medium duty segment, as well as in the pick-up and SUV segments. It also bets on offering special solutions, responding to the Angolan market's most particular needs.
NORS MOBILITY
PAGE 31 CHAPTER 01.
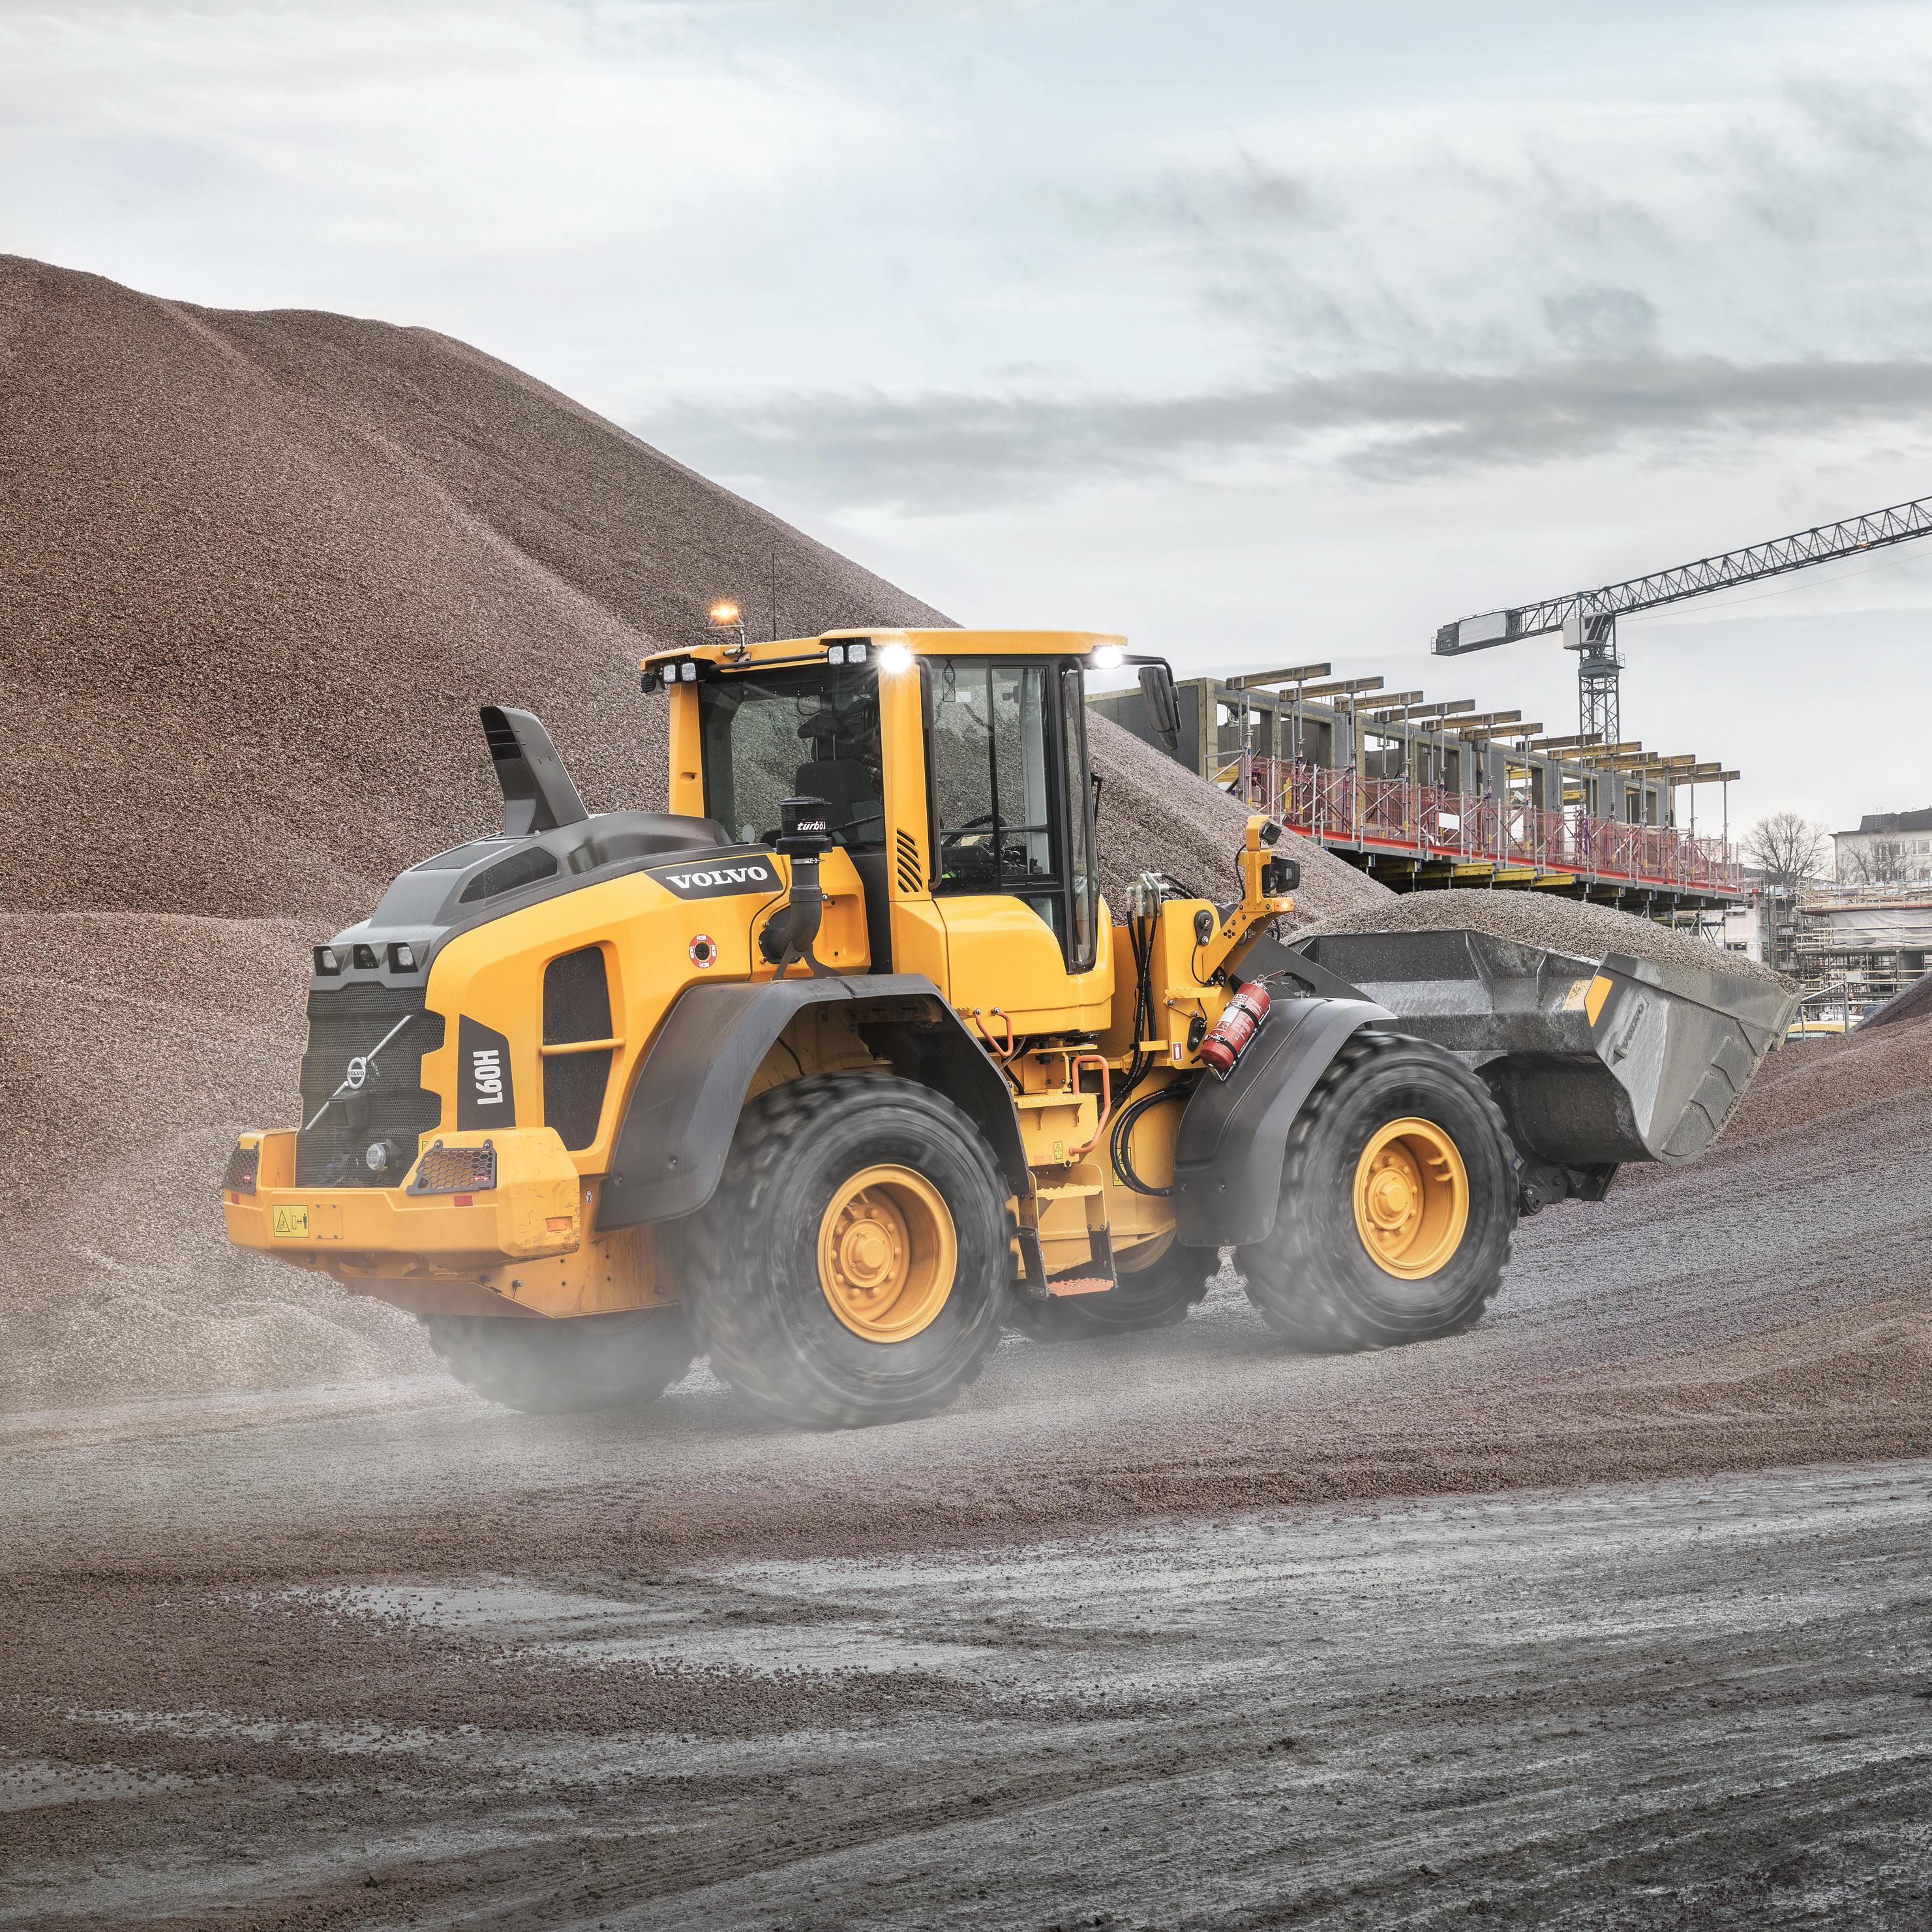
Nors off-road
The Nors Off-road segment includes the Nors Group's construction, industrial and agricultural equipment distribution business.
This business area includes the Ascendum, Auto Maquinaria, Strongco and AgroNew brands.
AgroNew is the official distributor of Case IH Agriculture, the Case New Holland brand for agricultural equipment, in the state of São Paulo. Starting its operation in 2002, AgroNew ensures the supply of the municipalities of Catanduva and Votupuranga and encompasses the distribution of three main products: agricultural tractors, grain harvesters and sugar cane harvesters, the main product sold in this area of operation.
Focused on the premises of quality, safety and performance, Auto Maquinaria started its operation in 2005 with the goal of providing a wide range of construction equipment in the Angolan territory. Providing integrated sales and after sales solutions, Auto Maquinaria is the official distributor for Volvo Construction Equipment in Angola, also representing Groove, Hyster, Epiroc and SDLG products in this market.
PAGE 32 CHAPTER 01.
Strongco is the largest dealer of Volvo Construction Equipment construction and infrastructure equipment in Canada. With operations in 26 branches spread across the provinces of Alberta, Ontario, Quebec, Nova Scotia, New Brunswick, Newfoundland and Labrador and Prince Edward Island. Strongco was acquired by Nors in March 2020.
Ascendum, present in 14 countries, is one of the largest global distributors of Volvo Construction Equipment. Founded in 1959, it sells industrial and construction equipment, providing the respective technical assistance, equipment rental and logistics operations. With a transversal offer, it operates in sectors as diverse as construction and public works, extraction and transformation, handling and logistics, agriculture, energy, among others.
NORS OFF-ROAD
PAGE 33 CHAPTER 01.
Nors aftermarket
Nors Aftermarket is the Group's business segment that encompasses the distribution and retail of multi-brand parts for cars, trucks and buses. This business area includes the brands Civiparts, in the heavy vehicle segment, and AS Parts and OneDrive, in the light vehicle segment.
Founded in 1982, Civiparts joined the Nors Group in 2003. Currently present in the Portuguese and Angolan markets, Civiparts specializes in the distribution of multi-brand workshop parts and equipment for the heavy vehicle segment (trucks and buses).
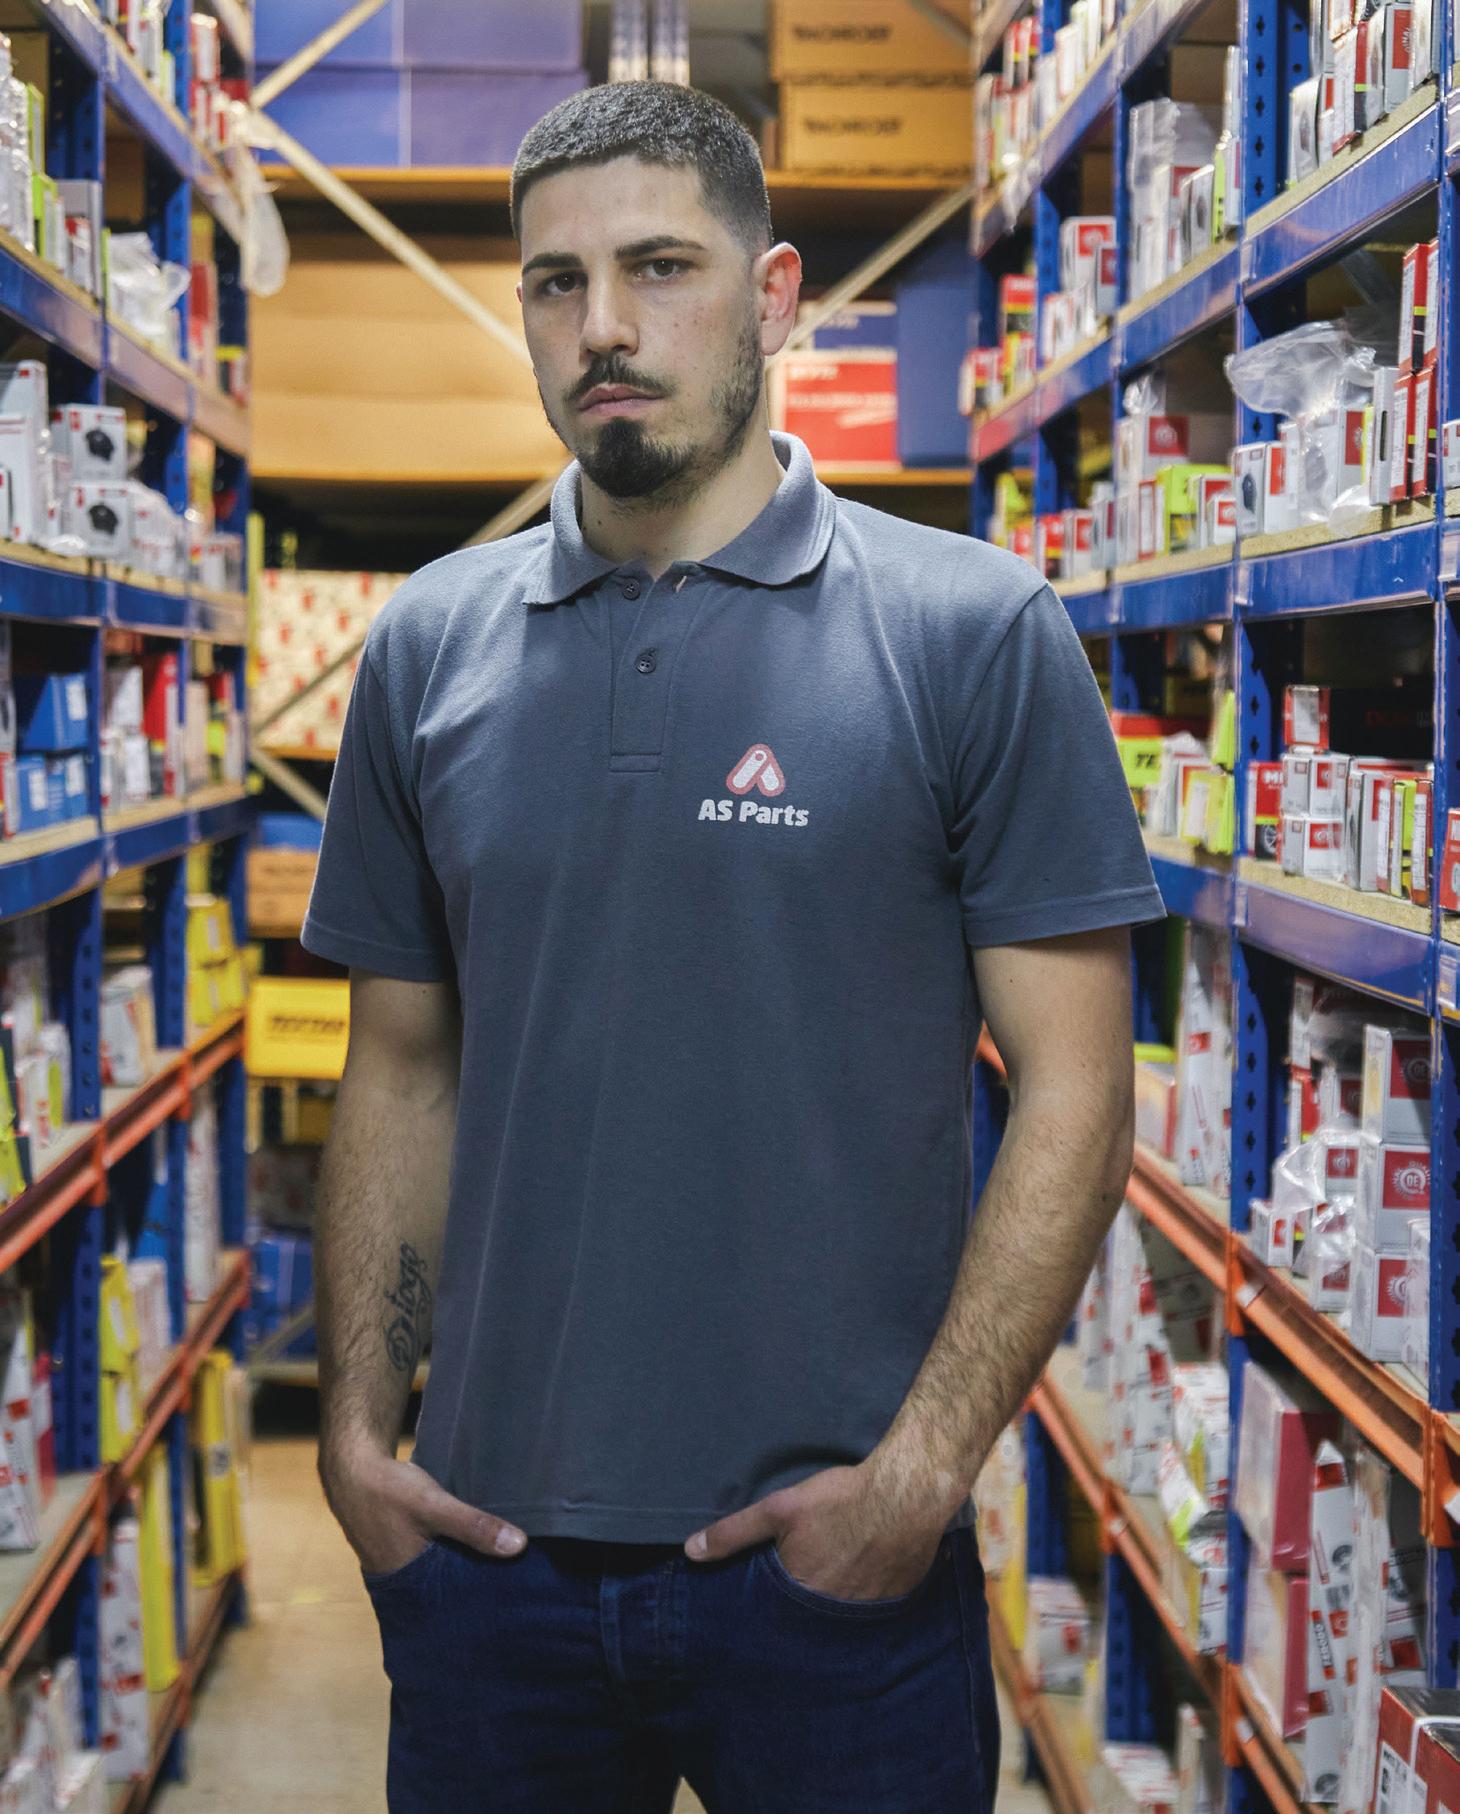
AS Parts starts its operation as a wholesaler in 2006, specializing in the independent distribution of parts, components and bodywork for the light vehicle segment, in Portugal. With a wide multi-brand offer and having logistics efficiency and agility as its main competitive factors, AS Parts guarantees delivery coverage throughout the national territory, supplying numerous workshops and shops all over the country.
PAGE 34 CHAPTER 01.
Under the OneDrive brand, the Group operates in the retail market of parts and accessories for light vehicles. With distribution points in Portugal and Angola, OneDrive provides integrated services for parts identification, quotation, ordering and invoicing, ensuring a fast shipping and delivery service and specialised technical support.
NORS AFTERMARKET
PAGE 35 CHAPTER 01.
Nors ventures
Nors Ventures is the Group's business segment that encompasses complementary businesses and solutions. From insurance mediation to environmental solutions, through the commercialization of construction glass, this business axis has as its main goal to add value to the operation in a transversal logic. Here, we find the brands Sotkon, Amplitude Seguros and Vitrum.

Present in Portugal, Spain, France, Angola and Turkey, Sotkon joined the Nors Group in 2008. Specialized in the development, marketing and distribution of modular systems for recycling and collection of urban waste through underground containers, it has more than 30,000 units installed worldwide.
Amplitude is an insurance and risk management consultancy, operating in different sectors of the economy and directing its offer to the Private and Business segments. Based in Portugal, Amplitude affirms a global presence through partnership agreements with different brokers, guaranteeing quality service to clients operating internationally, in any geography.
PAGE 36 CHAPTER 01.
Vitrum started its operation in 2010 as an importer and distributor specializing in building glass, films and decorative vinyl in Angola. Positioning itself in the Angolan market as the first company specialized in building and decoration glass, Vitrum ensures quality customer service through two points of sale strategically located in Luanda.

NORS VENTURES
PAGE 37 CHAPTER 01.
big numbers, bigger results
1.3 big nu mbers
1.3.1. sales by countr y
1.3.2. sales by business area
66,9%
29,7%
2,7% Nors Ventures


0,7%
4,9%
In the USA, Turkey, Central Europe, Mexico, Spain, and Portugal, the contribution of Ascendum Group is considered at 100%, although this joint venture is accounted for by the equity method.
1,5%
big n u m bers, big g er r esults Portugal
USA
Brazil
Canada
Central Europe
Turkey
Spain
24,4%
17,0%
16,0%
14,3%
9,2%
7,3%
Angola
Mexico
3,1%
e Namibia
2,3% Botswana, Mozambique
Nors Off-Road
Nors Mobility
Nors Aftermarket
¹ Sales + provision of services + own work capitalised, aggregating 100% of joint ventures.
² No. of employees, aggregating 100% of joint ventures.
³ Sales + services rendered + own work capitalised.
⁴ The group's consolidated EBITDA, which allocates the net income from joint ventures according to the share of capital held.
8,9% 24,9%
9,5%
⁵
obtained - cash and bank deposits - available for sale investments.
⁶ Financing obtained + operating lease liabilities - cash and bank deposits - available-for-sale investments
⁷ Equity with non-controlling interests / Net assets.
⁸ Net Debt (net debt + operating lease liabilities - available for sale investments) / Equity with non-controlling interests.
⁹ (customers, inventories, other accounts receivable, state, shareholders, suppliers and other accounts payable) / Turnover x 365 days.
¹⁰ Ebit / Invested Capital [Total Equity + obtained funds + lease liabilities - cash and cash equivalents - available-for-sale investments].
¹¹ Net income from continued operations of the parent company / Equity without net income for the year and without non-controlling interests.
(thousands of Euros) consolidated values 1 016 021 2021 2020 Turnover3 781 305 106 109 2021 2020 10,4% Turnover % -39 060 Depreciations and Amortizations -575 Impairment of depreciable/amortizable investments (losses/reversals) 8,8% Turnover % -31 269 Depreciations and Amortizations EBITDA4 68 615 66 475 2021 2020 6,5% Turnover % 3 436 Net exchange differences -12 128 Income from financial activity 4,8% Turnover % -504 Net exchange differences -13 751 Income from financial activity EBIT 37 347 57 782 2021 2020 5,7% Turnover % 3,0% Turnover % EBT 23 092 45 550 2021 2020 4,5% Turnover % 1,9% Turnover % Net Income 14 885 785 363 2021 2020 Total assets 732 748 240 126 2021 2020 Equity, with non-controlling interests 184 594 80 451 2021 2020 Net Debt (excluding leases)⁵ 148 059 167 247 2021 2020 Net Debt (including leases) ⁶ 234 609 30,6% 2021 2020 Financial Autonomy⁷ 25,2% 0,70 2021 2020 Net Debt (including leases) / Equity⁸ 1,27 1,58 2021 2020 Net Debt (including leases)
EBITDA 3,42 10,4% 2021 2020 EBITDA Margin 8,8% 16 2021 2020 WCN in sales days⁹
2021 2020 ROI¹⁰
2021 2020 ROE¹¹
/
42 16,3%
Financing
CHAPTER 01.
1.3.3. evolution of sales


Portugal and Spain 2021 2019 2020 661 599 537 Brazil 2021 2019 2020 328 USA 2019 2020 281 255 Mexico 2021 2019 2020 21 47 19 Canada 2021 0 2019 2020 291 180
(millions of Euros) Portugal and Spain 2021 2019 2020 661 599 537 Brazil 2021 2019 2020 344 328 231 USA 2021 2019 2020 281 347 255 Mexico 2021 2019 2020 21 47 19 Canada 2021 0 2019 2020 291 180
1.3.4. main indicators
In the USA, Turkey, Central Europe, Mexico, Spain, and Portugal, the contribution of Ascendum Group is considered at 100%, although this joint venture is accounted for by the equity method.


aggregated values (thousands of Euros) 2 041 437 2021 2020 Turnover1 1 561 720 4 044 2021 2020 Number of employees2 4 010 Angola 2021 2019 2020 63 63 64 Botswana, Mozambique and Namibia 2021 2020 30 21 Central Europe 2021 188 187 162 Turkey 2021 2020 150 92 aggregated values (thousands of Euros) 2 041 437 2021 2020 Turnover1 1 561 720 4 044 2021 2020 Number of employees2 4 010 Angola 2021 2019 2020 63 63 64 Botswana, Mozambique and Namibia 2021 2019 2020 27 30 21 Central Europe 2021 2019 2020 188 187 162 Turkey 2021 2019 2020 76 150 92
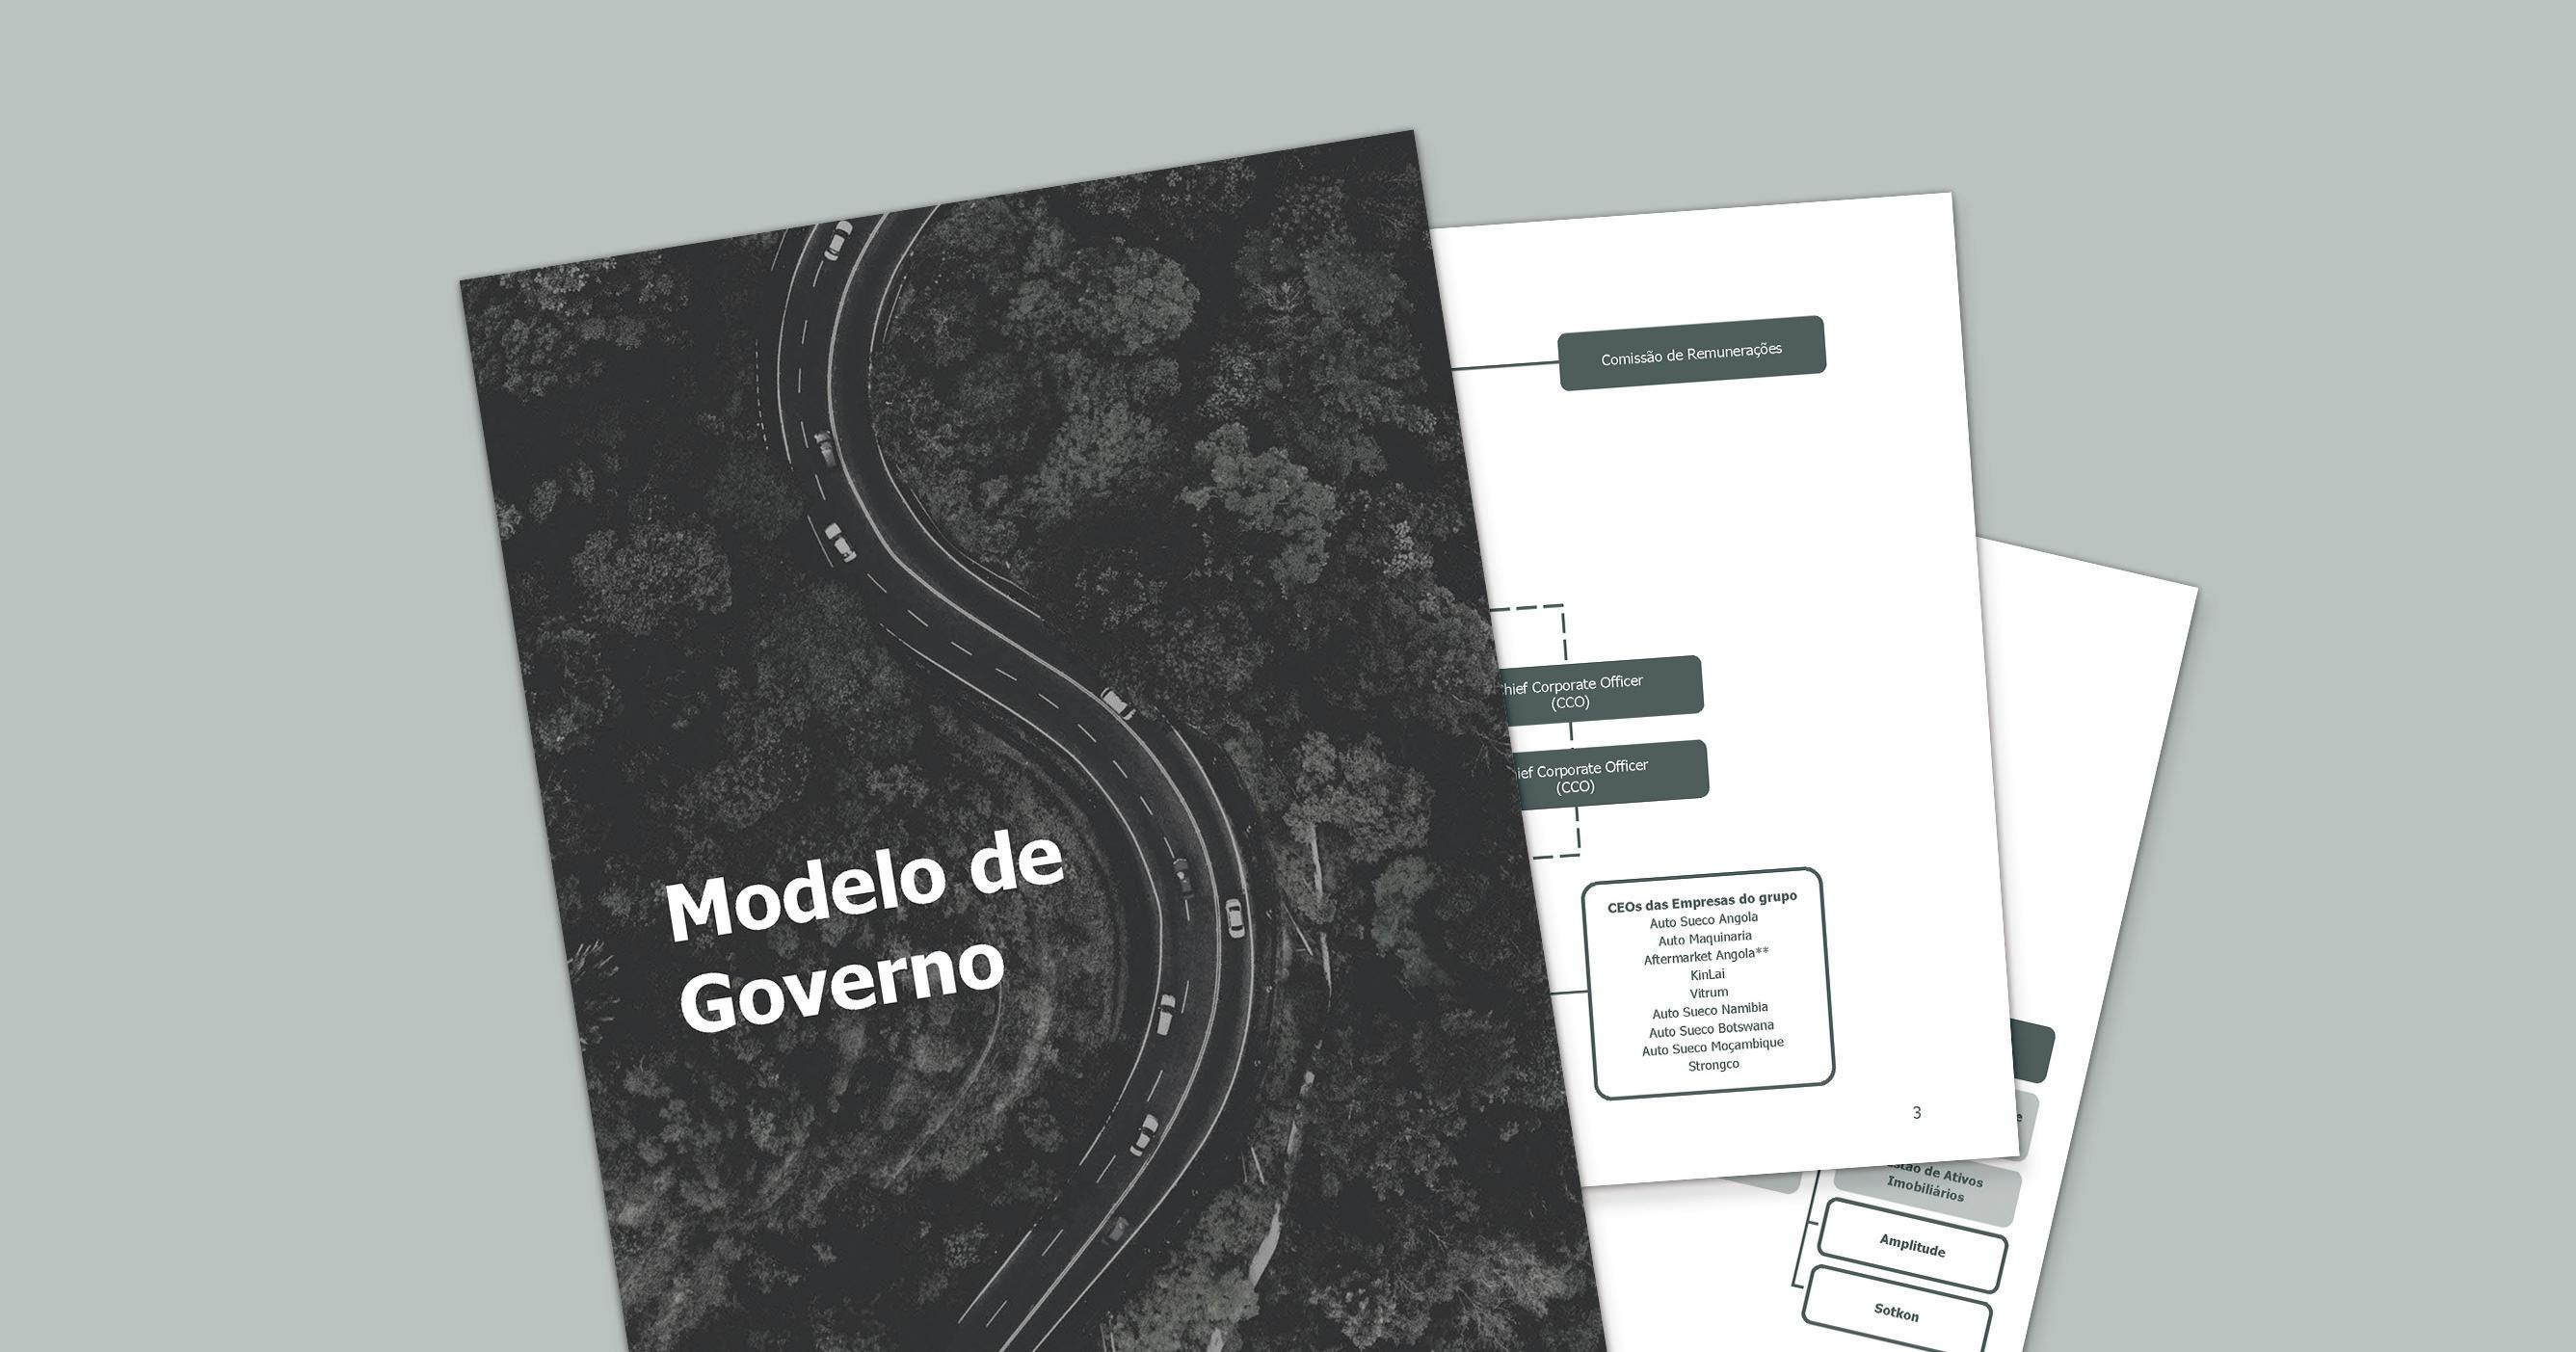
1.4. governance model
our morphology
1.4.1. governance model
The Governance Model identifies the Group's top management bodies and how they relate to each other. At Nors , the key governance bodies of the corporate model are the Board of Directors and the Executive Board, which has delegated powers for the day-to-day management of the Group. Other corporate governance bodies include the Statutory Auditor, the Remuneration Committee and the Company Secretary.
Nors ' Governance Model reflects the Group's purpose and value proposal, as well as a set of other governance principles that guide the organisation's morphology and its actions with its key stakeholders, of which we highlight:
ethics and conduct
Nors employees must guide their conduct by principles of honesty, integrity and absolute respect for Human Rights.
legal and regulatory compliance
All Group employees must, within the scope of their functions, comply with the law and internal regulatory documentation.
knowledge sharing and collaboration
The Group fosters an open, collaborative environment that promotes the sharing of organisational knowledge.
innovation andcreativity
Nors promotes and values an environment of constant innovation and creativity, allowing the organisation to evolve and follow the latest market trends in its different areas of activity.
PAGE 42 CHAPTER 01.
general meeting
The General Meeting is made up of all the shareholders with voting rights in the Group's parent company, Nors , S.A..
remuneration committee
The Remuneration Committee is elected at a General Meeting. Is responsible to define the remuneration of the company’s governing bodies.
statutory auditor
By law, supervision of the company is led by a Statutory Auditor, who will be a chartered accountant or a firm of chartered accountants. The Statutory Auditor has the powers that the law attributes to the Audit Committee.
board of directors
The Group is managed by a Board of Directors elected at a General Meeting. The Board of Directors has the overall power to lead and manage the Group within the scope of the corporate purpose and the powers attributed to it by the Nors , S.A. articles of association.
executive board
The Executive Board is responsible for defining and implementing the transversal policies which materialise the strategy approved by the Board of Directors. It is also responsible for the day-to-day management of the Group's portfolio, monitoring the performance of its business areas and operations.
Composition, operation and responsibilities
PAGE 43 CHAPTER 01.
by body


remuneration committee statutory auditor board of directors general meeting Álvaro Nascimento Non Executive Director Year of Admission 2018 José Jensen Leite de Faria Member of Nors Executive Board Chief Corporate Officer Year of Admission 1998 José Manuel Bessa Leite de Faria Non Executive Director Year of Admission 1970 Álvaro Neto Non Executive Director Year of Admission 2018 Tomás Jervell Chairman and Group CEO Year of Admission 2000 CHAPTER 01. PAGE 44


Artur Santos Silva Non Executive Director Year of Admission 2018 Francisco Jervell Non Executive Director in representation of Vellar II, S.A. Year of Admission 2020 Francisco Ramos Member of Nors Executive Board Chief Operating Officer Year of Admission 1996 Júlio Rodrigues Member of Nors Executive Board Chief Corporate Officer Year of Admission 2001 Paulo Jervell Non Executive Director Year of Admission 1972 Luís Jervell Non Executive Director Year of Admission 2018 Jorge Guimarães Member of Nors Executive Board Chief Operating Officer Year of Admission 1978 Rui Miranda Member of Nors Executive Board Chief Financial Officer Year of Admission 1999 CHAPTER 01. PAGE 45
 executive board
board of directors
José Jensen Leite de Faria Chief Corporate Officer
Tomás Jervell Group CEO
Francisco Ramos Chief Operating Officer
Júlio Rodrigues Chief Corporate Officer
Jorge Guimarães Chief Operating Officer
executive board
board of directors
José Jensen Leite de Faria Chief Corporate Officer
Tomás Jervell Group CEO
Francisco Ramos Chief Operating Officer
Júlio Rodrigues Chief Corporate Officer
Jorge Guimarães Chief Operating Officer
CHAPTER 01. PAGE 46
Rui Miranda Chief Financial Officer
1.4.2. organisational structure
portug a l Nors MOBILITY
brazil Nors MOBILITY
Nors OFF-ROAD canada
Nors AFTERMARKET Nors VENTURES
Nors OFF-ROAD ang o la Nors MOBILITY
botswana Nors MOBILITY
Nors OFF-ROAD
namibia Nors MOBILITY
mozambique Nors MOBILITY ascendum
Portugal , USA , Mexico , Turkey ,

Nors AFTERMARKET
SpainandCentralEurope
CHAPTER 01. PAGE 47
1.4.3. ownership structure
ownership structure
The share capital of Nors , S.A, which is fully subscribed and paid up, is 30 million Euros (30,000,000 shares with a nominal value of 1 (one) Euro).

Nors ’ capital is still held by the two founding families: the Jervell Family and the Jensen Family. On 31 December 2021, the breakdown of the company’s share capital was as follows:
others
8% cadena
29%
prime jervell holding
63%
PAGE 48 CHAPTER 01.
49 PAGE CHAPTER 01.
1.5. new organisational structure
an organisation without borders
a change that speaks for agility
In a moment when the concept of change is inevitably ingrained in organisations, setting the agenda globally and transversally, July 2021 set the official start of a significant change in Nors ' organisational structure.
A renewed vision for the future and a more agile top management model were the starting points for designing a new organisational model, impacting all the Group's structures in the different countries where Nors operates. With the strong involvement of Nors ' leadership, the restructuring behind this new vision brought the Group the energy needed to rethink its horizons, strategic lines and challenges for the future.

CHAPTER 01. PAGE 52

CHAPTER 01. PAGE 53
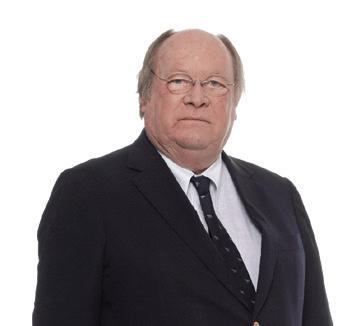
Tomás Jervell Group CEO
I felt that the Group needed a new organisation and a new governance model that would underpin our growth strategy. It was becoming clear that our growth would have to take place on a more solid foundation, coupled with greater empowerment of the leaders of each of the companies and the release of the Executive Board for development functions.
CHAPTER 01. PAGE 54
reorganising for agility
Throughout a participative and interventive leadership approach, the main goals that led to this reorganisation are clear, and incorporate the Group's long-term strategic vision:
To strengthen the autonomy, responsability and accountability of the Group Companies' CEOs, opening up new opportunities for their growth.
Discharge Executive Directors for more strategic areas, linked to corporate development.
To create structured control mechanisms, focused on operational development, allowing the evolution process of competencies of the Executive Management to be accompanied by adequate monitoring of operational and process risks.
PAGE 55 CHAPTER 01.
a new model, a new organisation
Nors ' Organisational Model is defined considering the Group's strategic goals, global management needs and the legal and fiscal requirements inherent to the geographical dispersion of the organisation's operations.
The changes initiated on the Group's functional structure in 2021 implied both the reallocation of areas of responsibility and the creation of new areas of activity under the remit of the members of the Executive Board. Within this context, the Group's Management Model has been reorganised and now responds to the ambition of leadership focused on agility and performance.

CHAPTER 01. PAGE 56
Head Office of People and Communication
Head Office of Shared Services -Norshare
Group Companies’ CEOs
Auto Sueco Angola
Auto Maquinaria
Aftermarket Angola
Group Companies’ CEOs
Auto Sueco Portugal Galius
Aftermarket Portugal
Head Office of Business Intelligence & Best Practices
Head Office of Risk and Compliance
Head Office of Strategic Planning
Head Office of Legal
Head Office of Finance
Head Office of Management Controlling
KinLai
Vitrum

Auto Sueco Namibia
Auto Sueco Botswana
Auto Sueco Moçambique Strongco
Auto Sueco
Automóveis
Auto Sueco São Paulo
Auto Sueco Centro Oeste AgroNew
Head Office of IT
Head Office of Facility Management Amplitude Sotkon
José Leite Faria CCO
Francisco Ramos COO
Júlio Rodrigues CCO
Rui Miranda CFO
Jorge Guimarães COO
CHAPTER 01. PAGE 57
Tomás Jervell Group CEO
The reinforcement of the Corporate Centre concept aims to move towards an organisation with an increasingly strategic and bolder stamp. The main goal of this structure is to support the Executive Board in defining the Group's main guidelines in the respective areas of influence.
Rui Miranda CFO
The Corporate Centre plays a leading role in this organisation, both as a catalyst for knowledge and a support for the Group's development.
Consisting of different Head Offices, it incorporates two fronts - the Holding Corporate Centre and the Local Corporate Centre. This latter structure operates locally in the different countries where Nors is present, and its mission is to support the different companies of the Group in the different aspects of management, with the necessary adaptations to the local realities and context. They are also true local ambassadors of the Nors Group culture and purpose.
CHAPTER 01. PAGE 58
developing the areas of tomorrow
This new structure embodies four Head Offices within the Corporate Centre, which acts as strategic links for Nors regarding market demands, the organisation's future ambitions and the operation's global positioning. These Head Offices - Strategic Planning, People and Communication, Business Intelligence & Best Practices and Risk and Compliance - act as a central element of the entire restructuring process, promoting and leveraging the business strategy's development. These areas take on a clear role in strengthening the vision and sustained growth of Nors , ambitiously looking to the organisation's future itself.
In addition to the existing areas within the organisation - People and Communication and Strategic Planning - Nors ' ambitions have required a strong focus on the topics of risk, efficiency and quality of information. This approach has justified the creation of new Head Offices, which incorporate critical areas such as Business Intelligence & Best Practices and Risk Management and Compliance.

PAGE 59 CHAPTER 01.
The Business Intelligence & Best Practices area will become indispensable to the strategic development of the Group and its companies. By mastering the market knowledge management, sectors and data generation, as the ability to create, develop and implement a dynamic business model that provides a clear future competitive advantage, this will be a crucial corporate area. It is necessary to create a mechanism to identify, collect, control and manage all Nors ' relevant knowledge and data by defining and implementing a proprietary business model.
PAGE 60 CHAPTER 01.
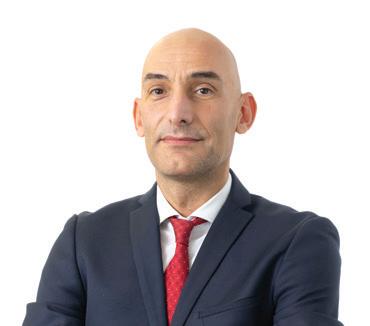
Júlio Rodrigues CCO
business intelligence & best practices
strategic goals and processes
Impact Area Mission Process
- Market potential analysis
Market Intelligence
Understanding the market(s) with deep knowledge of customers, competitors and main trends
- Competitors positioning
- Nors product portfolio analysis and development
- Industry trends: trucks, buses, construction equipment, agricultural equipment, and service/parts
Data Analytics
Set up of proper mechanisms to collect data and turn it into critical information for the decision making
Customer Experience Define a proprietary way of interacting and manage our customers
Operational Efficiency
Define most accurate operational efficiency models considering businesses and geographies' particularities
- Data collection, organization, cleaning and storage from corporate and company levels
- Patterns and trends interpretation and disclosure, through appropriate techniques and methodologies

- Design and maintenance of databases and dasbhoards (corporate and company levels
- Telematics – deploy a global Uptime approach supported in predictive analysis
Data types could be from: market, customer, stocks, telematics, business performance, logistics.
- Map and assess customer journeys
- Develop customer relations model – Group and Companies
- CRM Implementation, management and supervision (C4C)
- Customer satisfaction monitoring
- Deploy Flow project as the basis of operational efficiency for After Sales activities
- Operational Efficiency Tools & Systems selection, implementation and management
- Assess OE development opportunities at corporate and non-business level (e.g.: non business procurement, commercial processes, corporate activities)
PAGE 61 CHAPTER 01.
risk and compliance

The Risk and Compliance area is another protagonist of this new model. Developing and actively managing an integrated risk management model within the Group, this area's mission is to guarantee an approach adapted to the nature and morphology of its businesses, to the geographic areas in which it operates and to the set of strategic goals that guide the operation.
The Board of Directors particularly sees the Compliance area as a true necessity, considering the Group's size and its geographical dispersal, as well as the constant evolution of the companies' obligations.
Centralising this responsibility, we can guarantee coherent and effective processes with the necessary priority alignment to meet market requirements
PAGE 62 CHAPTER 01.
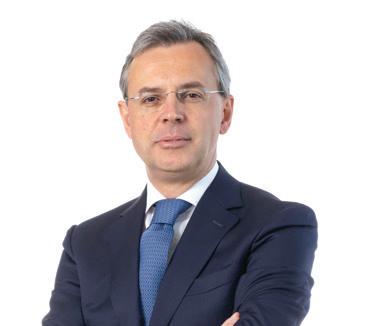
José Leite Faria CCO
The mission of this new area is to create a process that allows the Group and its companies to identify and understand the risks to which they are subject. In this way, we can identify, monitor, manage and, if necessary, mitigate them. It is a management tool that allows the Group to have a global vision of risks and a local vision, at a company level, ensuring the existence of relevant and useful information to support management.
PAGE 63 CHAPTER 01.
the Nors universe: the sum of all parts
One of the most significant changes in the new Organisational Model reflects one of the three main goals of the restructuring programme - strengthening the autonomy and responsibility of the CEOs of the different companies that make up Nors worldwide. Always encouraging a Group culture - in which Nors identity speaks to all employees - we can't disregard the particularities inherent to the companies operation: whether they relate to the business area, the geography they integrate, or the microculture that each structure conveys.

CHAPTER 01. PAGE 64
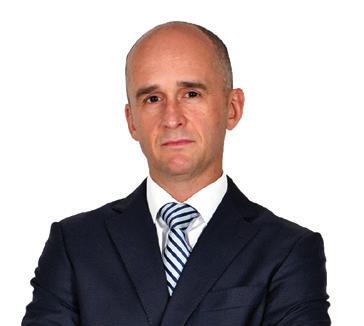
Francisco Ramos COO
We will look at more efficient companies, founded on more knowledge and less risk, empowering a Group of leaders of excellence, capable of contributing to the best development of the different companies and the Group itself. Ensuring that the greater autonomy and accountability of the Companies' CEOs follow a more demanding evaluation of their performance is key.
CHAPTER 01. PAGE 65
Change made at the level of Companies' Executive Management will certainly have a large and positive impact on the other organisational Groups, creating a top-down dynamic of greater autonomy, demand, accountability and improved performance.
CHAPTER 01. PAGE 66
Jorge Guimarães COO
experience at the centre
The customer and employee experience could not be more central to this model - it is in a differentiating experience and in increasing the level of satisfaction of Nors ' targets that one of the main advantages of the outlined strategy lies. This new organisational model gives the Group the capacity to raise the level of demand concerning customer experience, materialising this in quantitative results and, simultaneously, ensuring an indelible experience and strong identification with the Nors brand - both for customers and the employees themselves.

CHAPTER 01. PAGE 67
future is the only limit
The backdrop to any organisational transformation is an enormous ambition for prosperity and success in the future. Agility is the word of choice of all Nors ' Executive Board elements, in an exercise to foresee Nors ' horizon. It is unanimous that this new model will open doors to a more creative, more dynamic and more agile organisation. In the People sphere, it will allow the development of increasingly global professionals, with an engaging sense of purpose, and simultaneously turning decision-makers into more autonomous leaders, as the organisation goes more agile and effective.

PAGE 68 CHAPTER 01.

PAGE 69 CHAPTER 01.

02. 2.1. focus: strategy 2021-25 75 2.2. corporate projects 85 2.3. sustainable motions: Nors ESG strategy 97
building our future strategy
strategy 2021-25
2.1. focus
our strategy for the 2021-25 cycle

The ability to incorporate a firm and consolidated vision of where we want to be and how we want to present ourselves to the world as an organisation is key, today. The year of 2021 marks the beginning of Nors ' journey through a 4-year strategic cycle - our wanted position - which we have named "Focus", affirming a determined and focused positioning to achieve flights as ambitious as they are solid.
For the Group, 2025 brings with it a determined response about who we are: we are People, with the ability to leverage talent and create a unique experience for our employees; we are Transformation, with the pressing desire to act as catalysts of a paradigm of change and innovation; and we are Sustainability, with a transversal vision about our role in the community, in businesses, in the world.
Presented at the 2021 Annual Meeting in April, Nors ' vision for the 2021-2025 strategic cycle seeks to cement within the Group's different operations and structures the three key pillars that dictate Nors ' priority action lines for the coming years: Transformation, Sustainability and People.
CHAPTER 02. PAGE 74
new frontiers
Increase our global presence in a sustainable way

high-performing organisation
customer experience
Promote a high-performance organisation

employee experience
To guarantee a unique employee experience
To be an agent of transformation in customer experience
reinforce our sustainable development
To reinforce our role in the transport, construction, and agricultural equipment sectors
CHAPTER 02. PAGE 75
strategic pillars: who we are and where we want to be

PAGE 76 CHAPTER 02.
Explore growth opportunities in the core business
Ensure adequate profitability in all operations
Global and individual development of the Group’s executive management team
Implement Nors Corporate Responsibility Strategy

Leverage Nors brand awareness
Reinforce the Group’s risk control mechanisms
sustainability
PAGE 77 CHAPTER 02.
Drive a culture of innovation to leverage Nors ’ future success
transformation
Develop a proprietary customer experience
Develop new operational efficiency paradigms
Digital transformation

CHAPTER 02. PAGE 78
Address the challenges of new generations
People
Ensure a modern and attractive compensation and benefits policy
Ensure continuous competence development
Develop employer branding
Build a differentiating employee journey
Create an ecosystem of talent management

CHAPTER 02. PAGE 79
our focus is the future
The organisational restructuring led by the Group in 2021 advocated new flights considering the relevance of designing a global strategy, cemented in all our operations and development areas. Aligned with this approach, the creation of the Head Office of Strategic Planning emerges to affirm a transversal, proprietary and agile approach, leveraging the Group's strategic positioning.

The main goal of this new head office is to advise the Group on the organisation and businesses' strengthening and development within the medium and long term, ensuring the management of Nors ' medium-term Strategic Planning process, the identification and evaluation of operations to strengthen the Group's business portfolio, and specialised assistance in specific operations, as indicated by the Group CEO.
Starting in the first quarter of 2022, and with an expressive involvement from the entire Corporate Centre, we believe that this new approach will bring us the capacity to reflect and consolidate an iterative and consistent perspective, building a Nors able to respond to all the changes inherent to the exponential evolution that the sector, and the world, will bring us in the coming years.
CHAPTER 02. PAGE 80

CHAPTER 02. PAGE 81
2.2. corporate projects
a journey of constant ambition
tomorrow is now
More than ever, 2021 showed us an expressive scenario regarding the acceleration and prioritisation of areas such as digitalisation and digital transition. With transformation assuming the "weight" of being one of the Group's strategic pillars, it becomes absolutely critical to look at these concepts as the true foundations of the qualitative leap that Nors points to as a horizon - the more our culture of transformation, the more prosperous our future will be.
Launched in 2017, Core is the Group's digital and technological evolution program: the project's main goal is to achieve greater efficiency in work processes, enabling the organisation to better integrate and interact with the different stakeholders - both internal and external - always with the support of integrated and agile processes and technology.

Involving all functional areas of Nors , covering a period divided into 4 waves of implementation, the purpose is to unlock the growth and profitability of each of the Nors ' companies. This approach is based on building strong and robust business models, capable to answer to any challenge and future opportunity.

core CHAPTER 02. PAGE 84
Technology and digitalisation are, today, the basis to develop the businesses we manage and the products and services we sell.


The ability to adapt our organisation, through its means and resources, in order to draw maximum efficiency and performance from this new reality, will depend on our focus on the process of technological investment and digital transformation. The Core Project allows us to develop, in a structured way, this technological and digital layer, which will act as the pillar to ensure the foundations for success and leadership, in the sectors where we operate.
Júlio Rodrigues
CHAPTER 02. PAGE 85
the big picture: where we started from and where we want to be
Wave 1

Implementation F&A and Aftermarket Portugal
Wave 2
Implementation Originals Portugal
CHAPTER 02. PAGE 86
a wave of transformation never comes alone September 2021 marks the kick-off of the project's second wave, called "Originals". This stage brings with it the challenge of transforming the Group's mobility businesses: here, the companies Auto Sueco Portugal, Galius and Auto Sueco Automóveis are preparing to welcome a more efficient, more productive, and more modern tomorrow. Covering the whole year of 2022, this journey will have as its main goal the implementation of rapid development tools and methodologies, allowing greater agility when delivering new skills and services to the different stakeholders of Nors (customers, suppliers, partners, and employees).
Wave 3


Roll-out Originals
Canada, Angola and Southern Africa
Wave 4
Roll-out Originals
Brazil
CHAPTER 02. PAGE 87
goals: what bring us to Core
Standardising processes integrated and transversal ERP template, promoting an out-of-the-box approach.

Developing an integrated DMS solution that promotes a consistent and efficient experience (digital and self-service by design) for OEMs (Original Equipment Manufacturers), distributors, retailers and customers. Create a unique 360º Nors customers, ensuring a consistent experience across all touchpoints.

CHAPTER 02. PAGE 88
originals: an intense journey of transformation

The project methodology is composed by 7 main phases that make up the digital transformation journey associated to the Originals wave. In addition to these, there are 2 crucial stages, cross-sectional to the entire design and implementation stage: Project Management & Quality Assurance, ensuring that the different stakeholders involved - from the project managers and business leads to the employees themselves - are impacted by the context of change that will arise from the project; and Change Management, which promotes a pipeline of training, communication, and engagement

2 Explore Design 3 Realize (Build) 4 Realize (Test) 5 Deploy Training 6 Deploy Cutover 1 Prepare 7 Run 8 Project Management & Quality Assurance 9 Change Management CHAPTER 02. PAGE 89
transformation is born within us
Reinforcing the Group's significant commitment to People and Talent management, 2021 was also time to develop the different employee journeys regarding the


CHAPTER 02. PAGE 90

CHAPTER 02. PAGE 91
after sales optimization has a name

Flow, more than an Operational Efficiency project, is the beginning of a cultural transformation which aims to improve the performance of workshop operations in a sustained approach, aligned with the strategic goals of the organisation and supported by performance indicators. This will be the path of continuous improvement towards excellence in our After Sales operations.
2021 was the year to establish the foundations and Kaizen methodologies in the Auto Sueco Portugal After Sales Units. Tools such as the logistics train implementation, the restructuring of workshop areas, team meetings, visual management tools such as the dashboard
of the vehicles' status (airport view) and the technicians' workshop load allowed a better and more agile management of the workshop's daily routine.
A new stage of Flow, the technological layer, was also initiated in the 2nd wave of the Core Project, a process which will allow access, in real time, to performance indicators regarding our operations, as well as continuously identifying our points/areas for improvement, evolving towards the effective digital transformation of the business. This same phase will also include the implementation of the Flow programme in the companies Galius and Auto Sueco Automóveis.
This path of consolidation of internal knowhow and different teams' involvement allows us to be prepared, today, to start the Flow extension in the other geographies of the Group, both in the Mobility area and in the Off-road segment.
Flow will also evolve in terms of image and communication, in order to reinforce its role as a reference in the Operational Efficiency of the group's After Sales activities and to contribute to the increase of employer branding awareness, namely with regard to technical and operational areas.
flow
CHAPTER 02. PAGE 92
CHAPTER 02. PAGE 93
2.3. Nors ESG strategy
sustainable motions
sustainable motions: a vision of integrity

Today, the assumption of a truly universal positioning depends on organisations' understanding of all the global challenges that lie ahead, and also their ability to systemically identify the opportunities and risks within their areas of operation. Whether in relation to sustainable development or to the success and commercial performance of operations,
the future of global entities is closely linked to an attentive and conscious perspective.
Nors ' proposal within its ESG (Environmental, Social and Governance) strategy reflects a clear intention to play a relevant, integral, and transparent role in all the relationships we foster as an organisation: with employees,
clients, partners, decision-makers, and transformation agents that surround us. Always with the human dimension at the centre of each action plan, the strategy called "Sustainable Motions", brings us a dynamic and transversal vision throughout commitment, in order to generate value and transmit confidence to the communities impacted by Nors .
CHAPTER 02. PAGE 96
the kick-off of a truly strategic vision

The Sustainable Motions programme was firstly shared with the entire Group at the 2021 Annual Meeting: the main goal was to present to the different top management teams the major guidelines of what is an effective and continuous Nors Corporate Responsibility Strategy, in order to define and build, on this baseline, collaborative initiatives within all operations.
Within this forum, the concept of sustainability was clearly correlated with a policy centreed on people and cultural transformation: areas in which the Group is investing effectively. As Nors is a company that operates globally, it must seek to lead and follow the major trends that are arising within the ESG premises - it is time to act and to look towards a truly sustainable, consistent and global future, being part of the solution. Thus, it was clear that the agenda comprises a long way to go and many functional areas to be involved, in order to set this (ambitious) agenda in motion.
CHAPTER 02. PAGE 97
a purpose of global trust
Our core identity as an organisation already reflects the relevance with which we seek our purpose, our 'why': our corporate responsibility strategy can be no exception. Linked to the purpose, is our 'how' - how this strategy will perpetuate our mission - our approach; and finally, our 'what' - what concrete actions we envisage implementing within our operations and how we segment them into different strategic pillars.

CHAPTER 02. PAGE 98
the purpose
To drive a trust-based sustainability agenda that engages the Nors community around the world. the scope

The Sustainable Motions programme shapes its intervention around 5 axis, bringing a transversal perspective to the action plans defined within the ESG framework.
why how what
the approach
Our strategy is built under the United Nations Sustainable Development Goals, adopted by all member states in 2015: a global intervention towards a sustainable future path.
CHAPTER 02. PAGE 99
an approach of empathy, plurality, and identity
It is unavoidable to witness a paradigm shift within our communities, through an approcah increasingly extended to a global spectrum: the exceptional and volatile times we live in are the living proof of this process. The intense pace of transformation and the demands that different layers of society impose on organisations, regarding corporate responsibility issues, make it imperative that we act as entities that are aware and prepared to be part of the change. Nors ' approach is based on a vision that aggregates 4 outlines:

CHAPTER 02. PAGE 100
transversality and plurality
Our approach is based on an integrated vision, addressing and balancing an environmental, ethical, social and economic sustainable perspective, connecting all these spheres in a consistent and harmonised vision.
integrity and ethics
Nors ' vision is closely linked to an ethical, transparent and global approach to the Group's positioning and to the value proposition that we endorse and deliver to society.
humanisation and empathy
It is clear, for Nors , that we cannot talk about sustainability and development without enhancing the human perspective. People are at the top of our priorities, being one of the three strategic pillars that the Group defined in its wanted position 2025.
clarity and comprehensibility
The guidelines of our ESG strategy are intended to be inclusive, understandable and adjustable to the diversity of our organisation, seeking to clearly communicate the goals and expectations that emanate from this programme.

#ambitious #transparent #personal #charming CHAPTER 02. PAGE 101
guided by a global vision

The set of universal values that comprise the United Nations Sustainable Development Goals aim to respond to the urgent environmental, political and economic challenges that the world's facing. Launched in 2015, this ambitious 15-year journey aims to ensure that the basic needs of individuals and societies, in different spheres of action, are addressed and met in a collaborative and cross-cutting manner.
Nors ' sustainability agenda is aligned with these globally recognised guidelines, with the aim of proposing concrete actions - carried out continuously and congruently - to reinforce these priorities.
CHAPTER 02. PAGE 102

CHAPTER 02. PAGE 103
5 strategic pillars, 5 areas that reinforce our vision

CHAPTER 02. PAGE 104

#ambitious #personal #transparent #ambitious #charming services people integrity suppy chain community CHAPTER 02. PAGE 105
services
Universal issues such as climate change, air pollution and lack of resources are some of the global challenges that Nors ' companies are on a mission to mitigate. Integrated stateof-the-art technologies, optimised and green management systems and processes should help our organisation in reducing the negative impact that its services and logistics operations infer.
our pipeline in 2021: activities and initiatives

Development of awareness actions
TOPCAR and TOP TRUCK sustainable christmas hampers
In December 2021, the TOPCAR and Carwin (light vehicles) and TOP TRUCK (heavy vehicles) workshop networks, which are part of the Aftermarket Portugal business area and which have more than 125 workshops throughout Portugal, delivered more than a hundred sustainable Christmas hampers to their partners with the aim of promoting waste reduction and a more sustainable approach at Christmas time.
In addition to the organic origin of all food items included in the hampers, all gifts included a planting certificate, in partnership with the Plant a Tree Association. This action resulted in the planting of more than 150 trees, an initiative that counted on the support of this structure employees and that took place in January 2022.
CHAPTER 02. PAGE 106
Auto Sueco Portugal: TTZE event "together towards zero emissions"

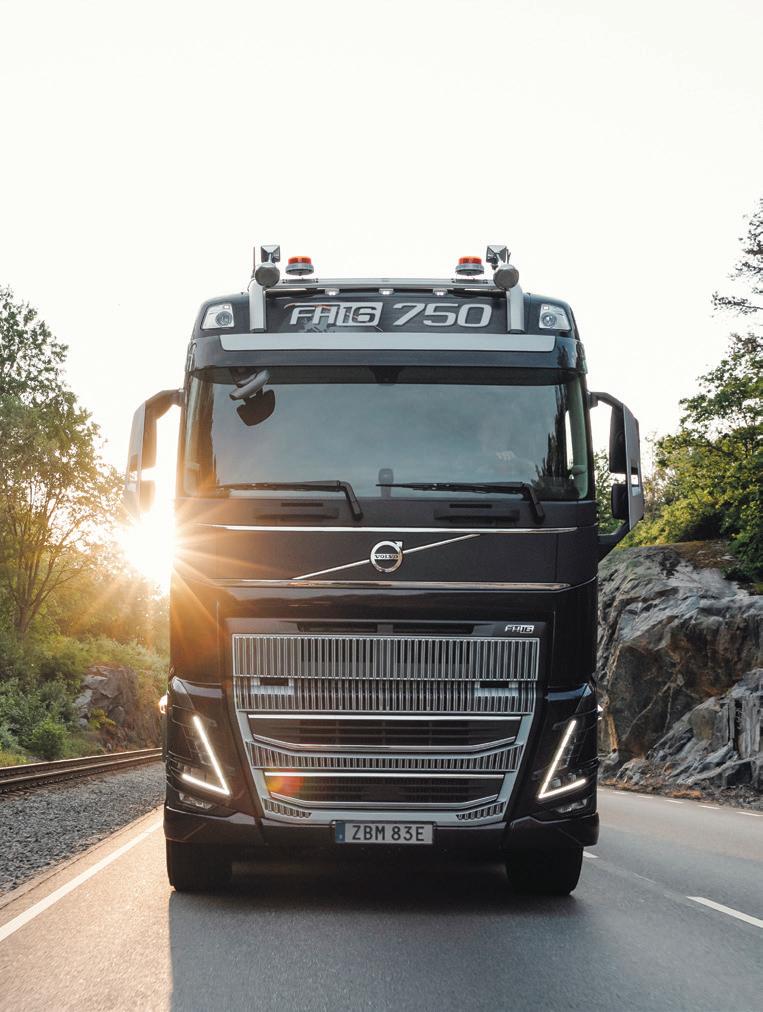
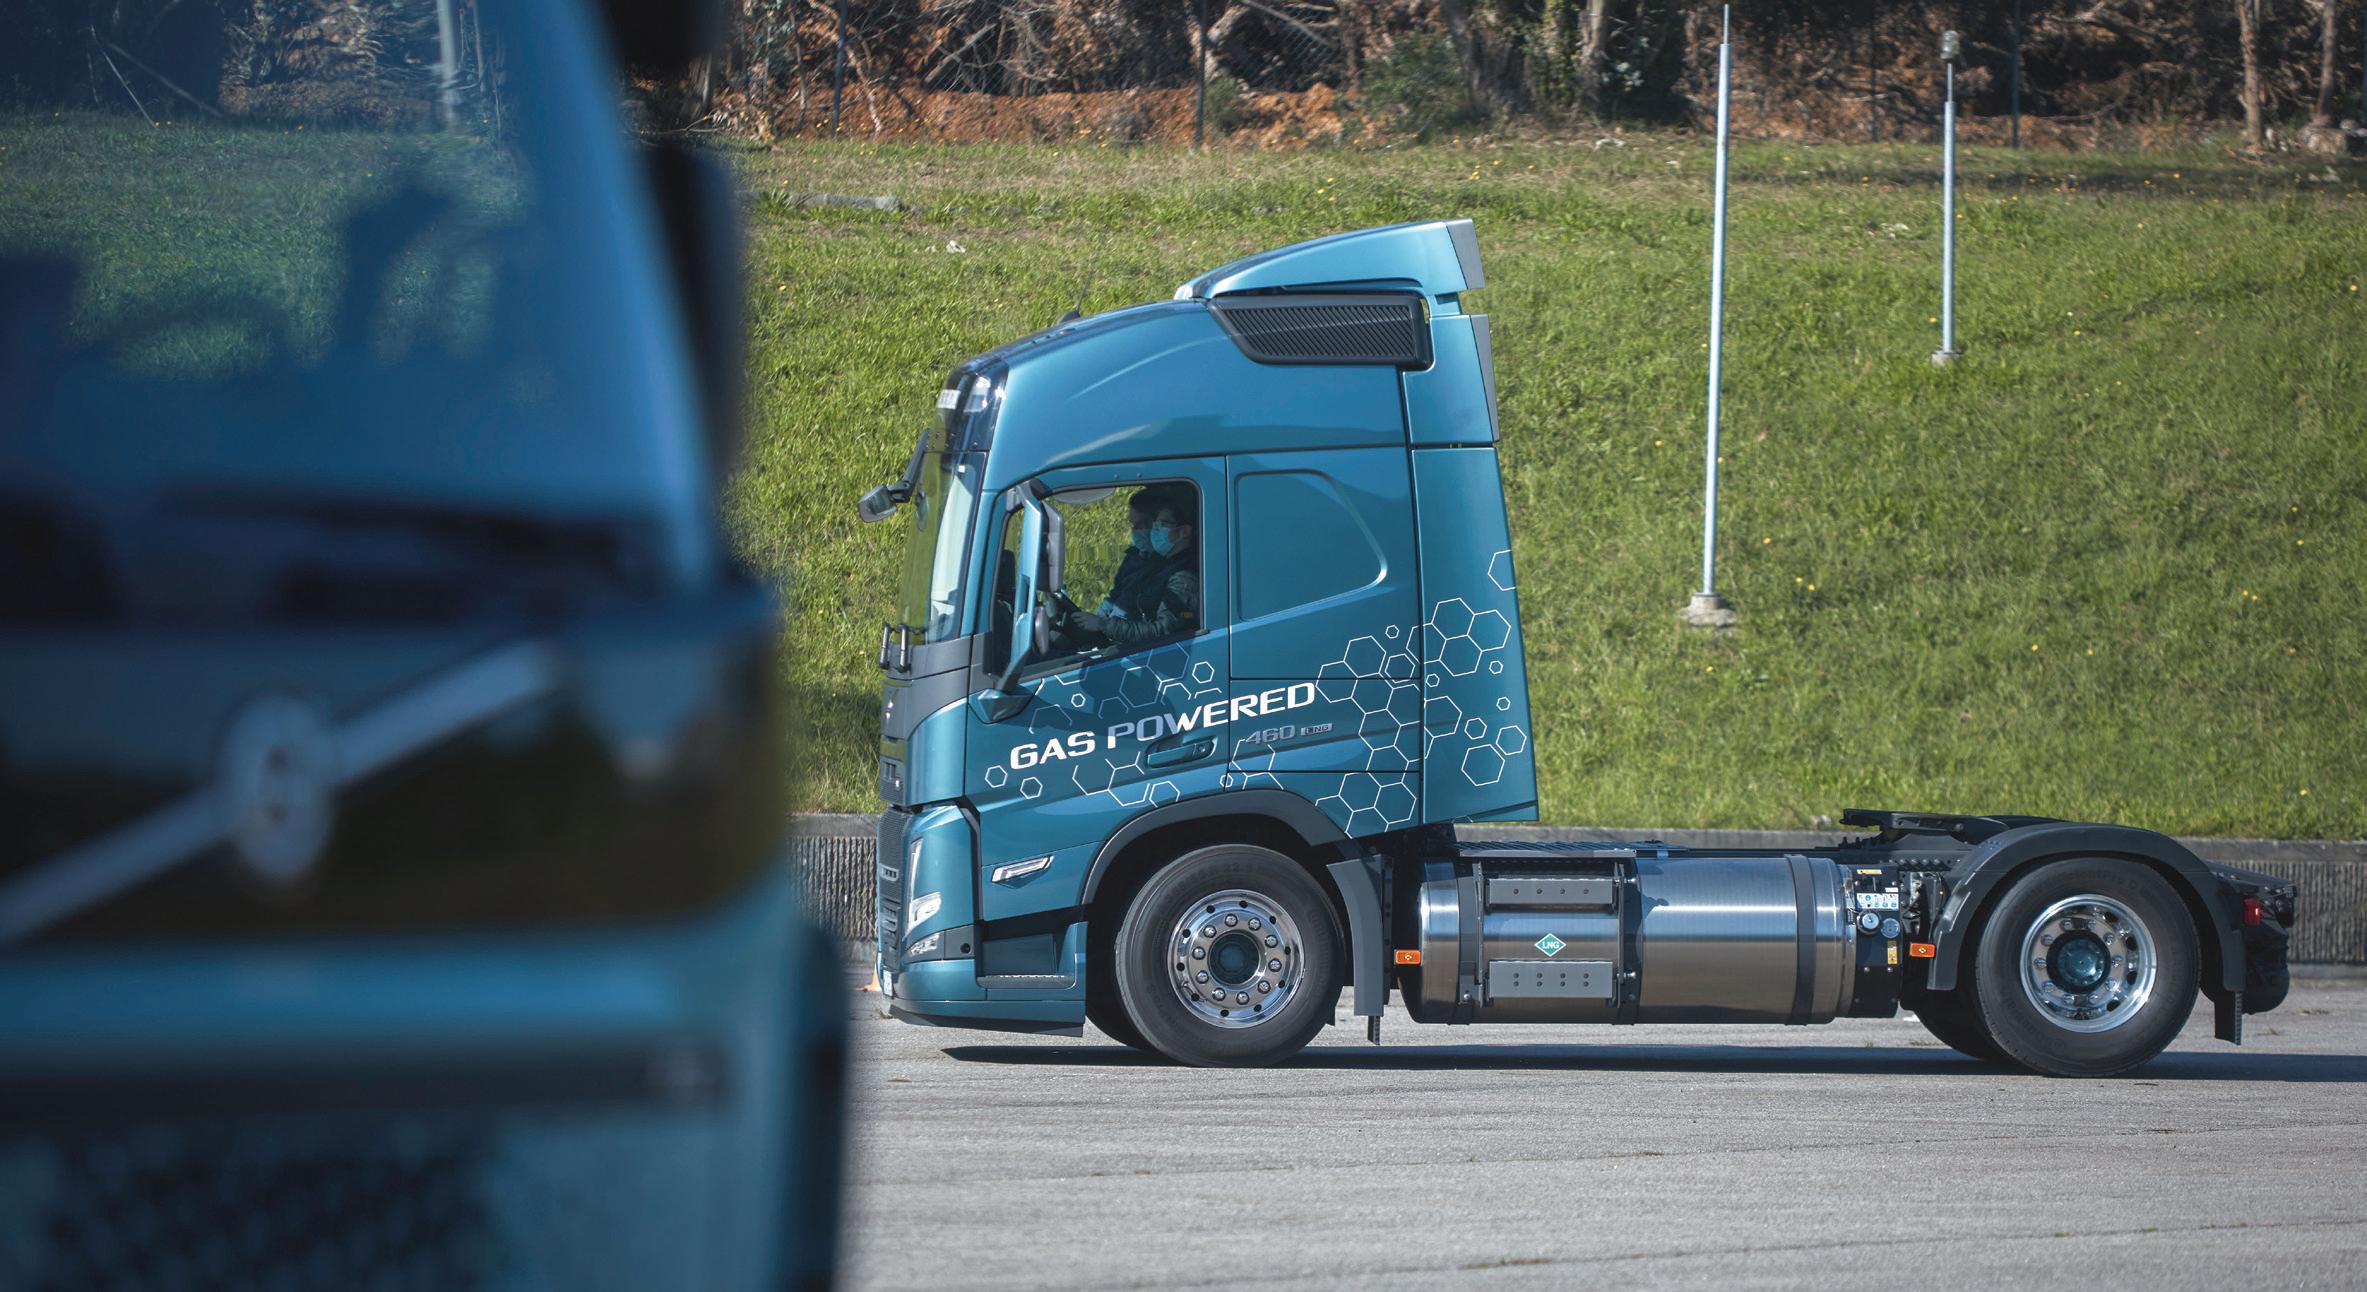
In November 2021, under the motto "together towards zero emissions", Auto Sueco Portugal hosted an event to present the strategy of Volvo Trucks for the next decade, with the major goal of answering to the mobility challenges in the future, within the different segments of road transport. With an exhibition of the brand's different models, numerous alternatives were presented to make us think about a tomorrow with increasingly less emissions. From the Volvo FH with I-Save, which can reduce fuel costs and environmental impact by up to 10%, through
the Volvo FH GNL and Volvo FM GN models, gas-powered trucks that reduce CO2 emissions by between 20 and 100%, to the new 100% electric models, the event, aimed at customers, partners and journalists, gave voice to the urgency that the mobility sector has in starting its journey into electrification - both with the environment in mind and for competitive reasons, seeking to meet customer requirements when it comes to sustainable transport alternatives.
Emissions and Pollution: initiatives and awareness actions
CHAPTER 02. PAGE 107
Management of energy consumption: renewable and clean energies contracting of 100% renewable energy in Portugal
With the clear goal of looking towards the future and contributing to a green, sustainable and conscious economy, Nors has contracted, in the last year, the supply of 100% renewable electricity for all the Group's facilities in Portugal. With this decision, Nors prevents the emission of 1 638 tons of CO2 into the atmosphere, the equivalent of 630 vehicles taken off the road and 2 887 trees planted.

This agreement confirms the Group's commitment to areas such as climate change and to the implementation of a green strategy, key issues for the development and performance of the organisation, not only in Portugal, but globally.
"Considering our size, at Nors , we are aware of the need to reduce our ecological footprint by investing in clean energies, to the detriment of fossil fuels. The big global players in the mobility sector are moving towards electrifying the drive units of their vehicles, so it makes perfect sense for us to adopt similar measures in all our infrastructures. What's more, it is fundamental that this energy be 100% renewable, with all the impact that this will bring to the positioning of the business", says the Group CEO, Tomás Jervell.
CHAPTER 02. PAGE 108
Development of awareness actions
"plant a tree" campaign

Eco-mobility: internal fleet optimisation
optimisation of the service fleet (plug-in vehicles)
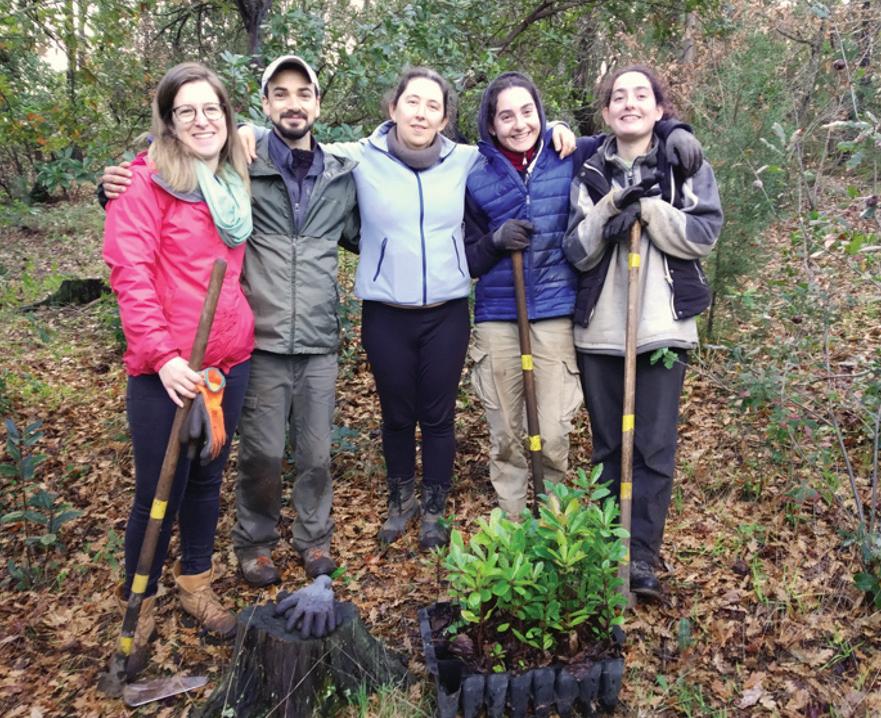
The expression "reap what you sow" has never made more sense - on World Environment Day, Nors carried out a communication and awareness initiative in all the countries in which it operates, with the distribution of "seed-pencils" (a pencil which, when planted in the soil, gives rise to a plant) to all employees. The goal was to endorse the United Nations motto for this day, centred on the premises of "reinvent, recreate and restore", giving new life to an item that is so present in our daily lives. As a result of this same action, with the contribution of employees involved with the community and who passed on the initiative in their own circles, Nors contacted a school in Bragança, in the interior of Portugal, and offered 500 personalised pencils to 1st to 12th grade students. The action made it possible to coordinate an impactful and different activity at the beginning of the school year, raising the awareness of the younger generations to value the issues of preservation and sustainability from an early age.
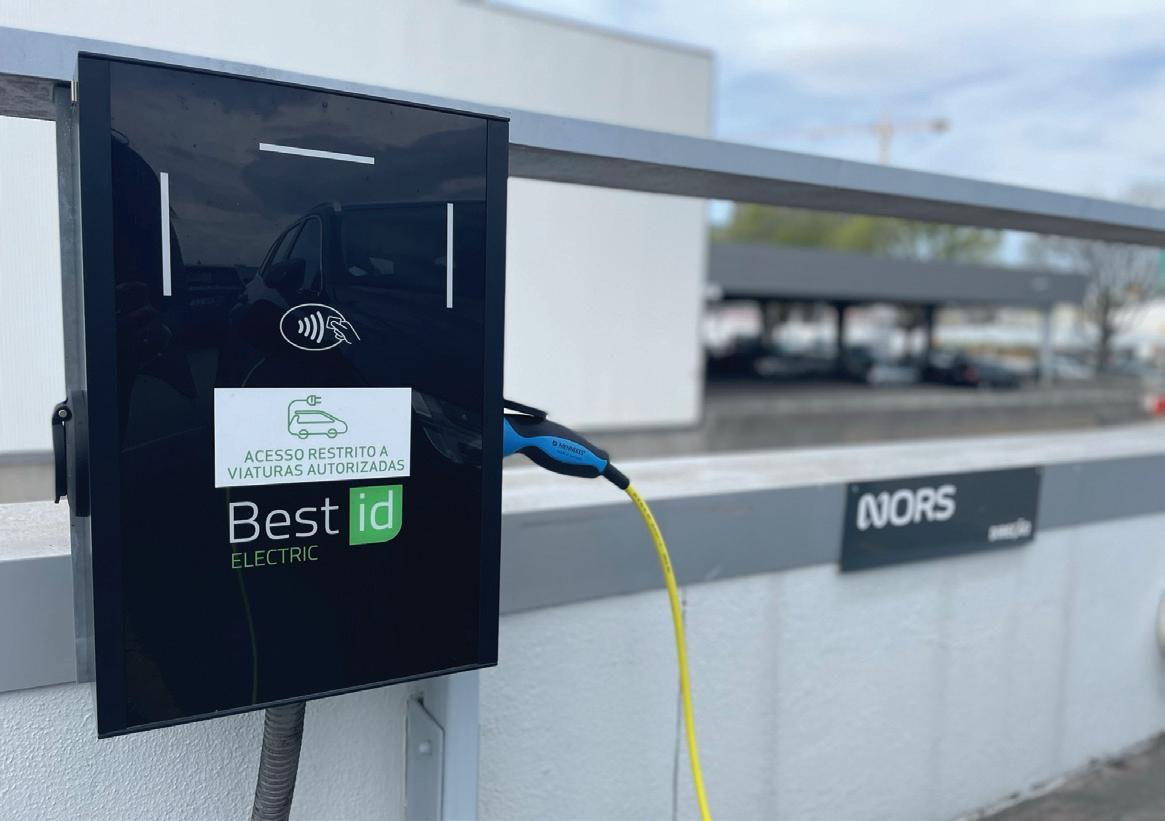
Real change starts from within: it is leveraged on this endogenous perspective that the Group has been defining its approach to the management of its service fleet. In Portugal, since June 2020, combustion vehicles are being replaced by hybrid vehicles (plug-in), which represents a reduction of CO2 emissions of up to 15%. At the end of 2021, 15% of the service vehicles of Nors companies in Portugal were plug-in hybrids, which represents a clear investment in the future transport models and in the optimisation of the mobility policies practiced internally. In recent years, with the pandemic context still in the background, other initiatives such as car sharing or car pooling are no longer a safe possibility, so the goal is to study the implementation of this kind of initiatives, as the restrictive measures in the country are less severe.
CHAPTER 02. PAGE 109
supply chain
The Group's purchasing policy is based on optimising the cost of materials, guaranteeing security of supply and reducing environmental and social risks in its relations with its suppliers. In addition to maximising the cost-benefit ratio and efficiency, it is equally committed to improving aspects of sustainability, seeking to overcome material waste, safe and high-quality supply, environmentally correct practices, and the protection of biodiversity.
Responsible procurement: process regulations new non-business procurement regulations
Issued in July 2021, as a result of the organisational restructuring that the Group undertook, the new Non-Business Procurement Regulation emerges with the main goal of optimising the management of procurement processes in all products that fall within the non-business scope (Fleet Management, Information Systems, Marketing and Communication, Events, among others). This new approach advocates a greater degree of specialisation, greater negotiating power and, above all, greater transparency in the management of all the inherent processes - without ever neglecting the local reality and the particular needs of the different companies that the Group comprises. In this way, the negotiation process with suppliers within Nors ' companies is guided by the criteria of integrity, security, transparency of processes and compliance.
our pipeline in 2021: activities and initiatives
CHAPTER 02. PAGE 110
Raw
materials, waste and recycling: waste mitigation programmes
REUSE project: packages recycling
The REUSE project was created with the goal of enabling the reduction of waste and promoting a more sustainable behaviour, motivated by the high consumption of resources in the packaging used for shipping parts, in the aftermarket sector. Thus, in 2021, the project's starting point was the reuse of boxes used in the packaging of orders from customers of AS Parts and OneDrive brands. The next step aims at reducing plastic in warehouses, using paper filling produced with cardboard scraps, originating from the boxes that are not in a condition to be reused in orders preparing.
By developing this initiative, the aftermarket companies are also contributing to the planting of trees, an initiative achieved with the savings arising from resources reduction in the dispatch of orders. With this project, under continuous development, the Group hopes to reduce the environmental impact associated with these brands' activities, assuming a more sustainable role in the aftermarket scope.
CHAPTER 02. PAGE 111
Raw materials, waste and recycling: waste mitigation programmes
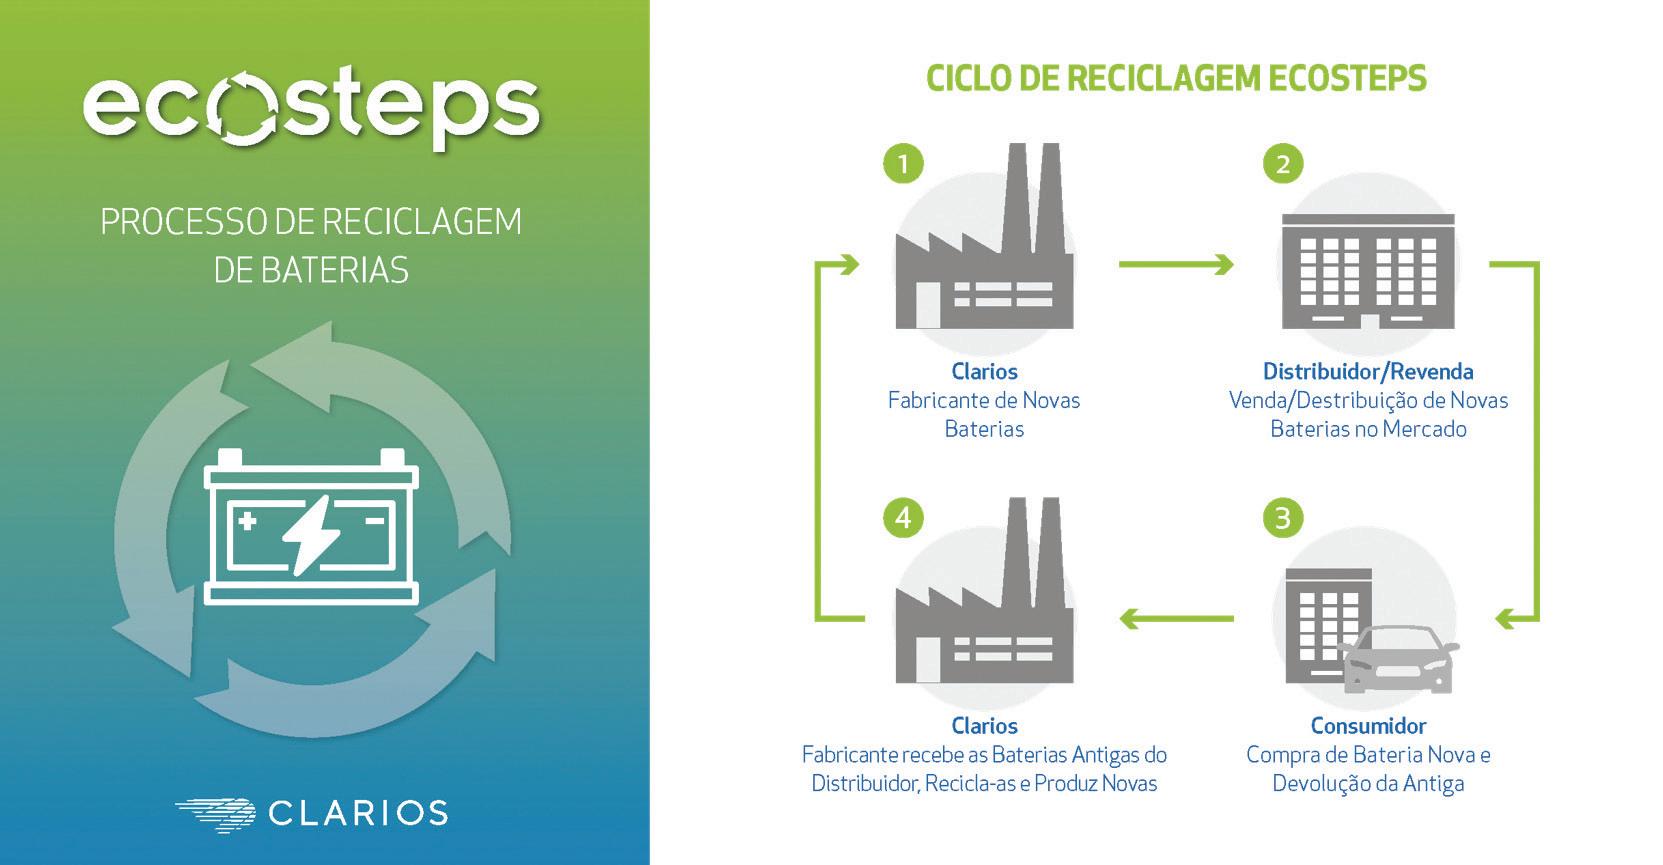
Ecosteps project: reuse of used batteries
Aware of their environmental commitment, the Aftermarket Portugal companies (Civiparts, AS Parts and OneDrive), assume their responsibility as importers of parts and accessories for vehicles, being consequently responsible for the introduction of waste and packaging of the products they sell on the national market.
Thus, with the goal of preserving natural resources and protecting the environment, the Ecosteps project was developed to raise awareness among customers, employees and partners of the companies within this business segment for the correct recycling of used batteries, since all the lead removed from the batteries can be reused, in compliance with all legal provisions. This action also allows the recovery of used batteries, collected monthly from all partners who wish to join the initiative.
CHAPTER 02. PAGE 112
CHAPTER 02. PAGE 113
integrity
As a major economic player, Nors has operations around the world, interacting with numerous economic partners and different audiences. As a stakeholder, it must consistently apply the highest ethical standards in its operations, seeking to affect this same responsibility on a daily basis. As trust is one of the central pillars of Nors ' DNA, issues such as security and data protection, privacy and governance are addressed on this pillar.
our pipeline in 2021: activities and initiatives
Risk & Compliance: risk mitigation models and processes

creation of the anti-fraud committee (Brazil)
In Brazil, the year 2021 held creation of the Anti-fraud Committee: formed by the CEOs of the companies in this geography (Auto Sueco São Paulo, Auto Sueco Centro Oeste and AgroNew), the Human Resources and the Legal teams in the country, this monitoring body was created with the purpose of analysing all the fraud processes that may arise within the business relationships, focusing on the different areas of activity of these operations and designing prevention and mitigation actions accordingly.
The purpose of this Committee is also to provide training and clarification sessions to all employees who exercise management functions in the Group (from the Commercial area to the After-sales sector, including the Financial and People Management areas, among others) based on the know-how and information acquired by the members of the Committee itself, ensuring transversal and shared knowledge among all the structures.

CHAPTER 02. PAGE 114
Organisation and Governance
new Group governance model (regulations)
With the goal of transmitting, in a clear and systematised way, the decisions issued and approved by the management bodies of Nors and/or other functional structures, in July 2021 Nors began to formalise this same information through new communication instruments, which constitute the new structure of normative and informative documents adopted by the Group.
This new model now includes instruments such as Codes or Policies, with the purpose of establishing rules or guidelines assumed by the Group in a long-term vision, promoting
ethical and deontological guidelines that contribute to a transversal culture; Regulations, which aim to list rules, models or methodologies of mandatory application that regulate matters of Group or company management, considered critical to its internal control; and functional instructions, for example, whose purpose is to define rules of a technical and/or operational nature that transmit to the teams and employees the tasks inherent to their functions.

CHAPTER 02. PAGE 115
Risk & Compliance: risk mitigation models and processes
risk and compliance: new risk management model

The Risk and Compliance area is one of the main agents of Nors new Organisational Model: with the purpose of developing and actively managing an integrated risk management model within the Group, the mission of this new area is to ensure an approach adapted to the nature and morphology of its businesses, the geographies in which it operates and the set of strategic goals that guide the operation.
A key piece of the new Risk Management model implemented in 2021 are the so-called "Risk Owners".
The Risk Owners are employees who act as the organisation's first line of defence, that is, who ensure a quick and prompt response to the different types of risks to which the company is exposed on a daily basis. This model allows Nors to structure and systematise solid and concrete knowledge, in order to support the organisation in taking more informed and faster decisions, consequently creating more value. Aware that this is an evolutionary and learning process, in 2021, 76 employees were designated as Risk Owners, and from 2022 onwards, their performance will be crucial to the success of this new model.
CHAPTER 02. PAGE 116
new data protection policies (GDPR/GDPL)
In the current context of globalisation and rapid technological evolution, personal data is increasingly exposed. Within this context, the General Data Protection Regulation (GDPR) and the General Law of Data Protection (GDPL) are two of the legislations that came to regulate the protection of personal data in the EU and Brazil, and seek, among other purposes, to ensure the privacy of data subjects.
In order to ensure that Nors employees are aware of these laws, as well as have access to vital and relevant information on the subject of Personal Data Protection, 2021 was a crucial

year for updating and disseminating relevant documentation, anchors in the understanding and clarification of issues related to this topic.
In order to ensure compliance with the data protection laws in the referred geographies, namely regarding the processing of employees' and customers' personal data, as well as to ensure that all employees can be informed about legislation, standards and policies related to this subject, it was created, on the Group's Intranet ,an area dedicated to promote this content, which contributes to the continuous awareness of our people.
GDPR and Data Protection
CHAPTER 02. PAGE 117
GDPR training

Nors Business Academy
Considering the urgency of this subject and the constant updating of the legislation in force when it comes to Data Protection, in 2021, we've ministred the course "Regulamento Geral de Proteção de Dados - RGPD" (General Data Protection Regulation - GDPR), with the the purpose of raising the awareness of all the employees within the Group's Portuguese companies to the issues of privacy, information security and data protection.
This course was held online through the Group's corporate training platform, the Nors Business Academy, and counted on numerous speakers, who supported the employees in consolidating relevant knowledge on the subject. From the Risk and Compliance area to the Head Office of Legal, the Human Resources and the Talent Management, Training and Development area, the multidisciplinary nature of the stakeholders who endorsed the contents contributed to a global and consistent vision of these themes, in a collaborative, dynamic and interactive way.
GDPR and Data Protection
CHAPTER 02. PAGE 118
CHAPTER 02. PAGE 119
people
As an international player in the distribution of mobility solutions, Nors needs highly qualified and motivated people in its teams. Therefore, we aim to offer our employees a safe, attractive and appropriate working environment that meets their expectations and requirements, allowing them to develop their full potential. We believe that it is through the development of a culture based on values of diversity, openness and transparency that we guarantee people who are involved and committed to the organization and to society.

our pipeline in 2021: activities and initiatives
Wellness and Safety: Workplace Safety Policies
digitalisation of the PPE management process

In order to ensure maximum safety and protection for all employees, the Group companies in Brazil led a process of digitalisation and optimisation of the Personal Protective Equipment (PPE) management, with the mission of monitoring and tracking the main needs of employees within this scope. In the country, there are more than 6 300 deaths that occur due to accidents at work, and many of these accidents could be avoided if the basic rules of protection are followed, and the safety equipment is used correctly.
Thus, in addition to the need for constant monitoring and communication on the subject, preventing and mitigating risks, in an operation in which Nors has over six hundred employees, the digitalisation of the processes of assigning, updating and replacing this equipment is a crucial step to ensure the safety of all employees.
CHAPTER 02. PAGE 120
Development and training: implementation of new models and programmes

development and training: operational trainee programmes
At Nors , we carry out different development and training initiatives in order to ensure that our future is focused on talent enrichment. Thus, our key premise is to train young people at the start of their career, ensuring that we provide them with the best professional opportunities, particularly in the operational areas that make up our operation.
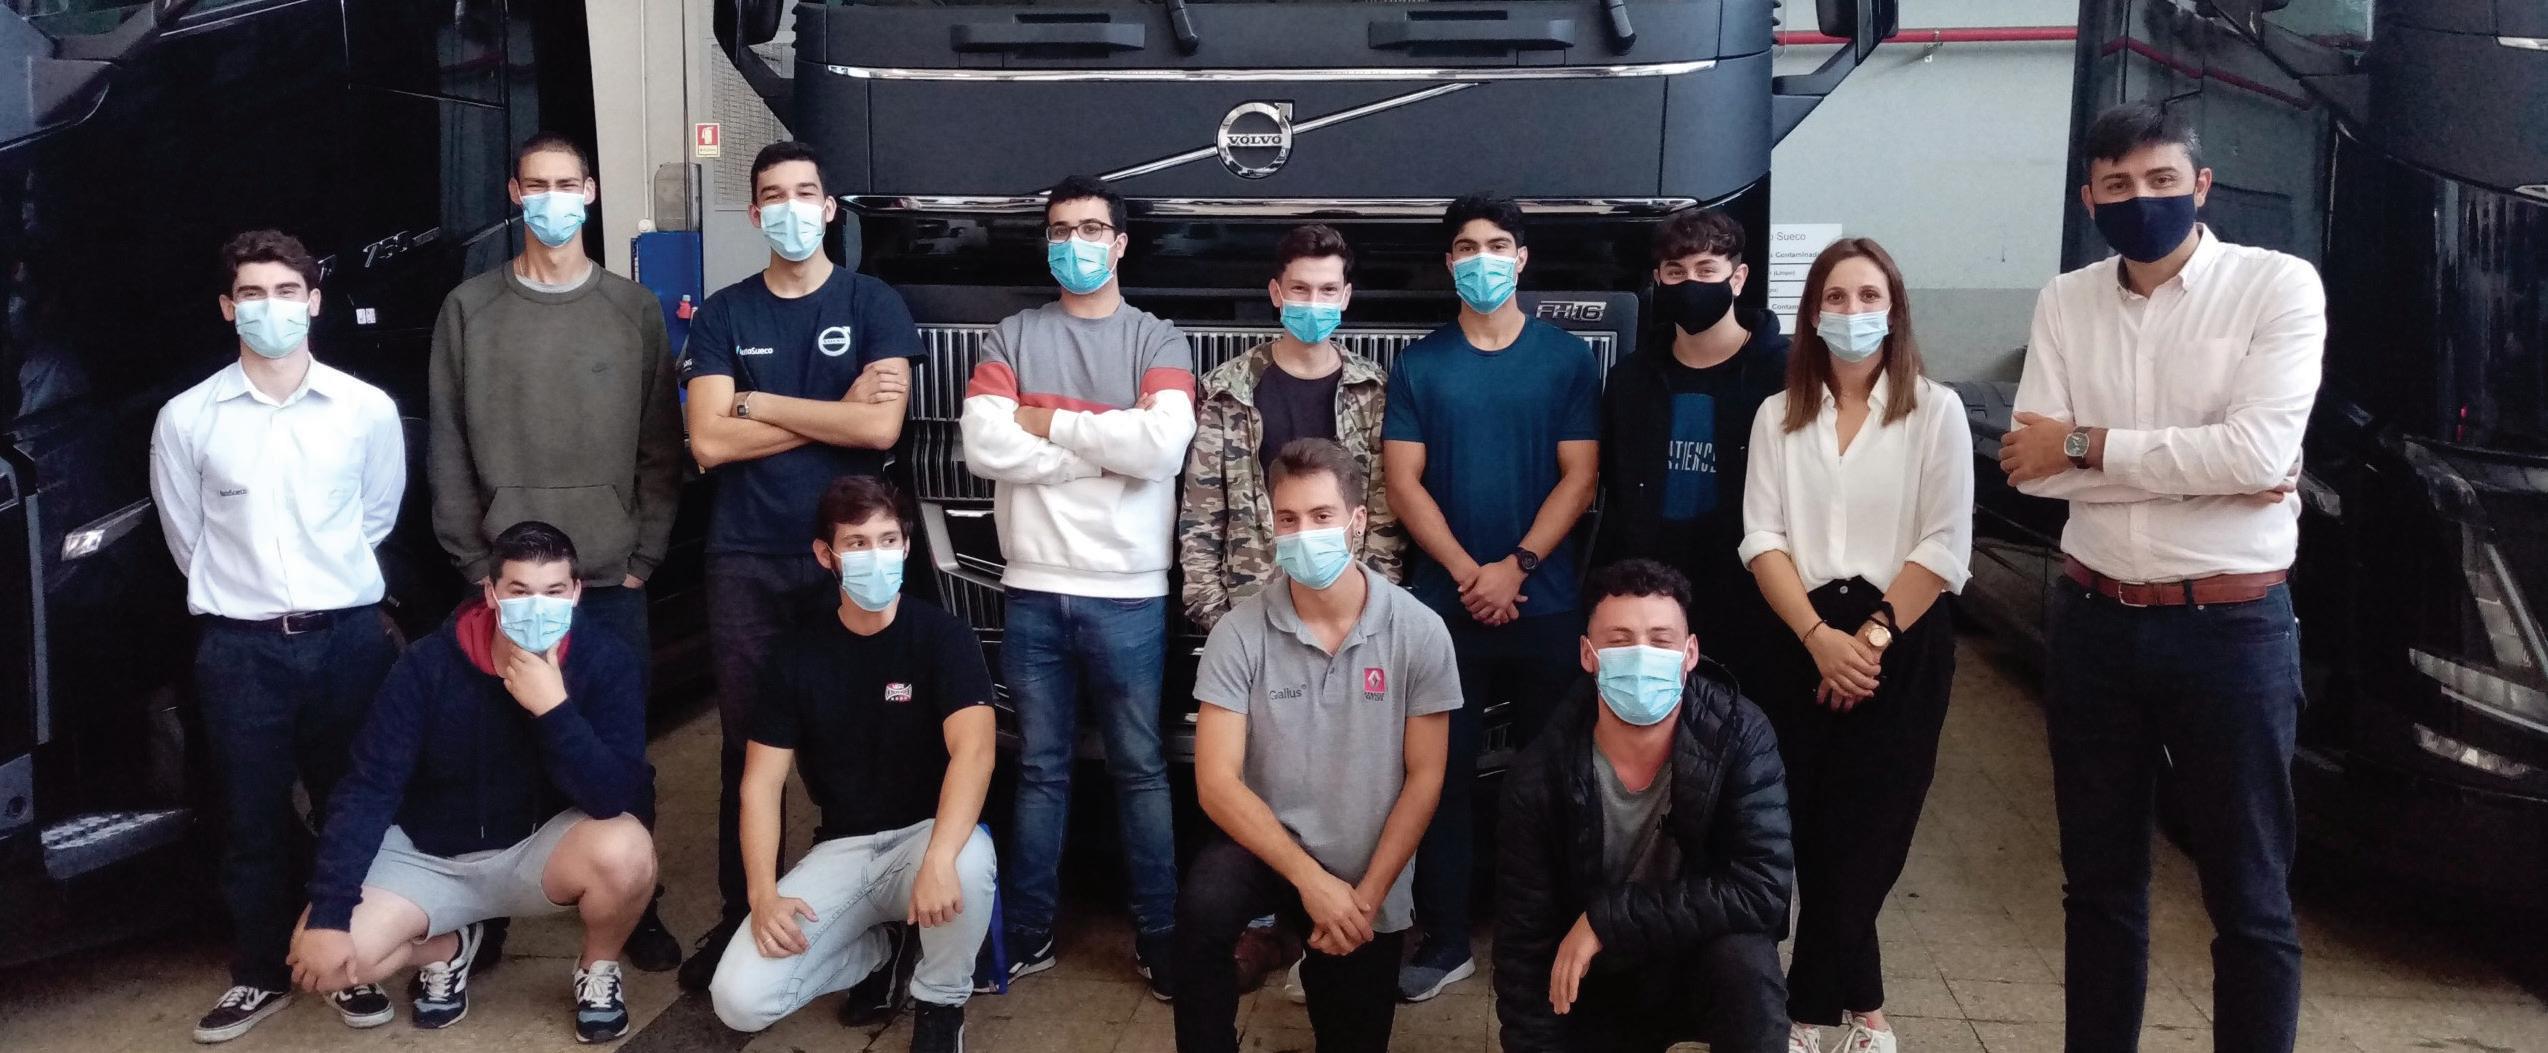
Opening doors to the integration of young people in the labour market and guaranteeing their access to tailor-made, paid training that allows them to reinforce their skills and integrate the Group as qualified professionals, we offer the Growing programme: a 9-month paid internship programme that covers areas such as Mechanics, Mechatronics,
Industrial Maintenance, Metalwork, among others, and which aims to be the kick-off for the integration of young trainees in the Nors ' business context.
In addition to Growing, as a development programme, we promote numerous separate initiatives to integrate young talent, such as, in 2021, the programme "1 day in Workshop Management". This project resides in a partnership between the Group companies in Portugal and Colégio dos Cedros, an educational institution in the city of Porto, whose goal is to provide knowledge about the context of workshop management, comprising the different activities of team coordination, technical work and customer support.
CHAPTER 02. PAGE 121
redefinition of recruiting & onboarding processes
With the mission of attracting the best professionals, ensuring dignified and evolving working conditions, the Recruitment and Selection area went, in 2021, on a path of digitalisation and modernisation of processes to ensuring a candidate experience that is as integrated and holistic as possible. Still with the pandemic context as a backdrop - considering all the social paradigms and the associated context - Nors identified talent attraction as one of the most priority themes within People Management. With the remote model prevailing for a significant part of the year, the numerous stages inherent to this sphere - from the identification of talent to the onboarding process - were equipped with the growing digitalisation of processes within our different operations.
Thus, 2021 was the time to start implementing the SAP - Success Factors "Recruiting & Onboarding" module, at a global level, whose purpose is to enhance a candidate experience that is as lean, personalised and close as possible, optimising and converging the processes that occur transversally witin the Group. This step defines the pluralistic approach that Nors seeks to implement in its Human Resources actions, optimising its approach to potential talent.
People Management: employee experience and journey
CHAPTER 02. PAGE 122
Wellbeing, health and safety: awareness raising actions health awareness campaigns (Brazil)
Well-being and Safety: Workplace Safety Policies
follow-up to positive cases Covid-19
In the Brazil Corporate Centre, numerous awarenessraising actions were developed around Health-related topics. In September 2021, the Human Resources team in this country communicated the "Yellow September" campaign, with the goal of raising awareness about mental health issues and suicide prevention, listing the main risk factors and preventive measures in a country where more than 13 000 suicides are recorded annually, 98% of which are related to mental disorders.
In turn, October and November gave stage to the scourge of cancer, with the awareness of the campaigns "Pink October", with the aim of alerting to breast cancer, and "Blue November", related to prostate cancer. In this scope, besides raising awareness about the prevention and early diagnosis of these diseases, increasing the chances of cure and reducing the mortality rate, the Group companies in São Paulo negotiated with the health protocols in force, that the exams and medical consultations were 100% free for all employees during the period in which the campaigns were in force.
In 2020, Brazil saw an exponential increase in the number of identified cases and victims of Covid-19. Aware of the potential impact on the population's health, the local Covid Committee, a team organised with the goal of monitoring the evolution of the pandemic in Group companies in Brazil, decided to implement a model for tracking and following up all cases. This working model is carried out by a coordinator of occupational medicine and a psychologist, who talk to each infected employee and try to understand how they contracted the disease, identifying possible contacts inside and outside the company and creating conditions so that additional preventive measures can be taken.
With this daily follow-up it was possible to provide greater emotional stability and to identify possible cases in which employees need closer attention, guiding and supporting them in this sense. Proximity, diligence and dedication were keywords embraced daily by this team that, with the spirit of mission that characterises Nors , sought to overcome the challenges with which the current context confronted us.
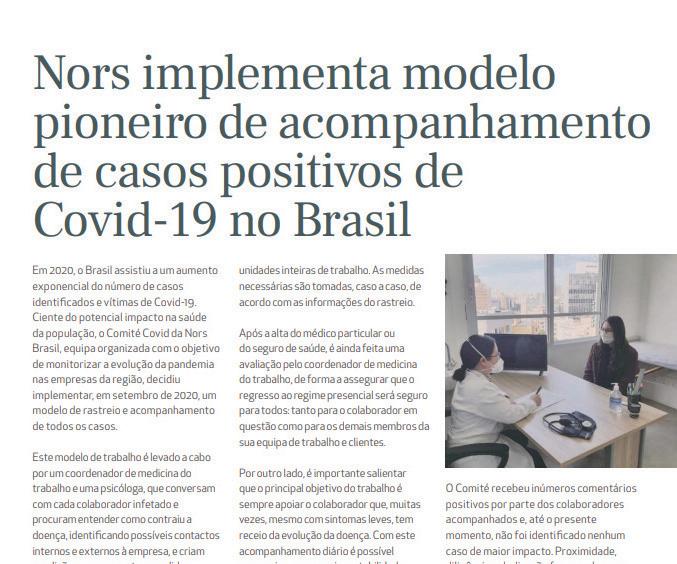
CHAPTER 02. PAGE 123
community
The Group seeks to integrate itself fully and deeply in all the geographical areas in which it operates, involving and engaging with local communities and recognising the strategic value of this local integration. Thus, our mission is to protect and involve the protection of cultural heritage in the corporate culture, also fighting exclusion and inequality, promoting a feeling of solidarity and support in all actions carried out locally.
our pipeline in 2021: activities and initiatives

Stakeholders dialogue: active contribution with local organisations
support in the construction of a school: comunidade nossa terra
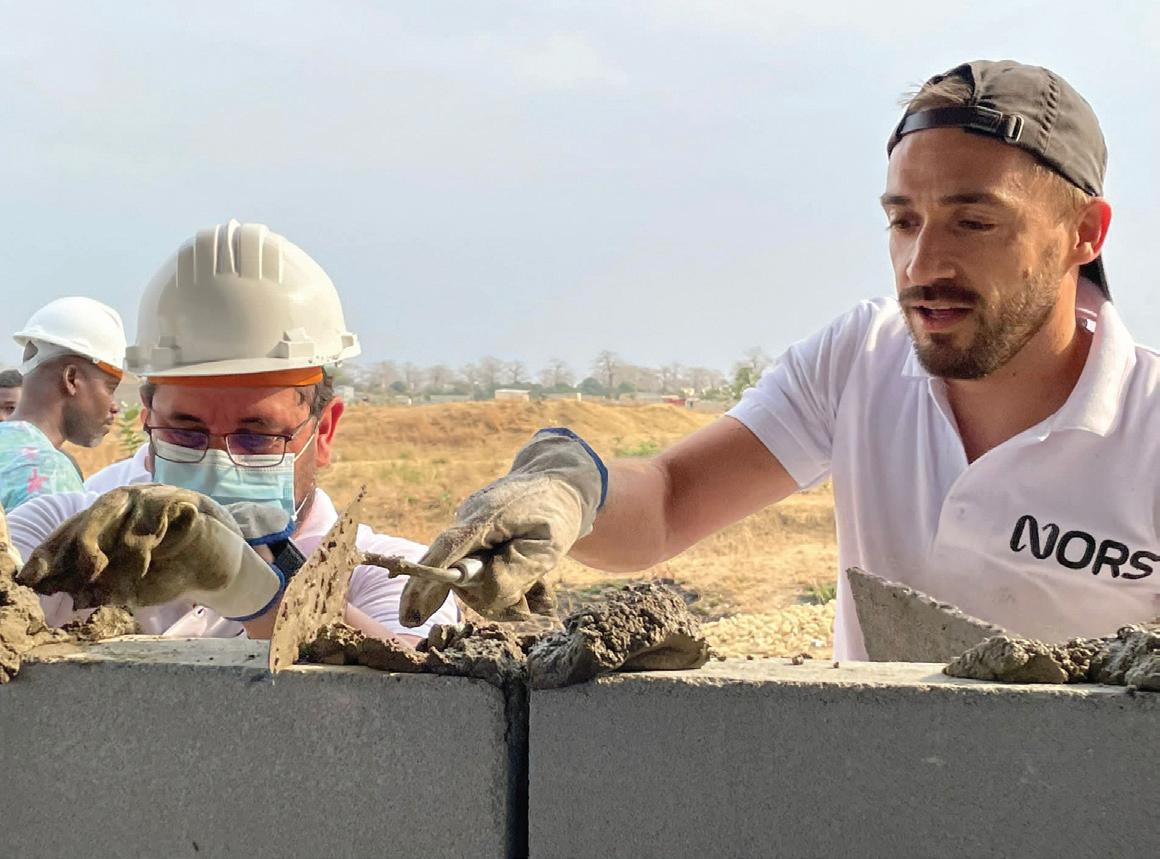
In Angola, 2021 was the stage of numerous initiatives to actively support the community, with the involvement of all employees, from the most diverse functional groups. Thus, the CEOs of the country's companies and the employees of the Angola & Southern Africa Corporate Centre - namely the Human Resources and the Facility Management areas - carried out a social intervention action, contributing to the construction of three walls of an unfinished building within a school unit of 'Comunidade Nossa Terra', a local association.
The goal, besides encouraging the direct involvement of Nors ' leaders with the local community, was to help improve the conditions of the children and young people of this association, leaving a positive impact within the Angolan community and, in particular, these children.
CHAPTER 02. PAGE 124
Stakeholders dialogue: active contribution with local organisations
children's day: support to local associations

Contributing actively towards the needs of the local community, the companies of the Nors in São Paulo held an action of social intervention on Children's Day, which is celebrated in Brazil on 12 October. The institution chosen was PAC - Projeto Amigo das Crianças ('Project Kids Friend') which, through its five shelters, assists 30 children, 200 adolescents and up to 1 000 families. Some of these children are in "High Complexity Special Protection", a situation of high fragility, for which the support from external entities is essential. The scope
of this non-profit social action extends to the regions of Pirituba, São Domingos and Jaraguá. So, in order to support these children, the companies collected and donated 575 items, including food, hygiene and cleaning products: approximately half of these goods were donated by our employees, the other half being complemented by the corporate and business structures. Also to mark this date, at AgroNew, employees were invited to donate toys, destined for two local associations: Irmã Amélia and Associação Mariano.
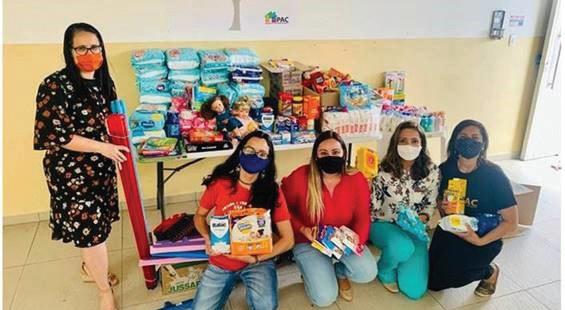
CHAPTER 02. PAGE 125
Stakeholders dialogue: active contribution with local organisations
donation of 150 baskets: Lar da Mamãe Clory
The end of December 2021 set the tone for another social intervention action carried out by the Group. This was the result of an initiative promoted within the scope of "Mark the Day" - a project that aims to mark, in a transversal approach, relevant dates worldwide. Thus, in Brazil, Nors supported the association 'Lar da Mamãe Clory': a project located in the municipality of São Bernardo do Campo that supports vulnerable children, adolescents, families and the elderly.
Founded by Clory Fagundes in 1969, the association supports over 150 children today, focusing on their development, training, health and well-being.
Nors donated 150 baskets of basic goods for all the children supported by the institution. In a context marked by Covid-19, the institution's coordination highlighted that "they haven't seen an act of solidarity of this dimension for many years", exalting the tremendous impact that this support had on all those who integrate the association.
CHAPTER 02. PAGE 126
Business Roundtable Portugal Association
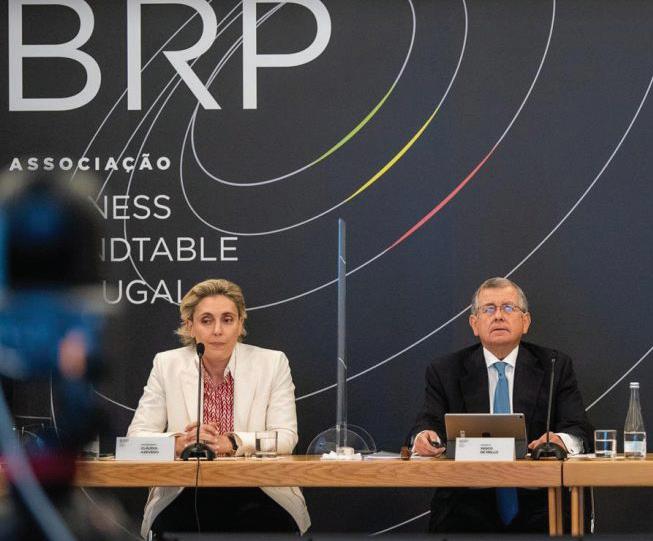
The year 2021 was also marked by the debut of the Business Roundtable Portugal Association, of which Nors is a member: the purpose of this association, comprising companies and business groups with relevant economic activity in Portugal, is to contribute to reflection on policies to encourage economic growth and contribute with measures and solutions that promote business development, without forgetting social concerns. Together, the members of the BRP Association employ over 380 thousand people, of which over 200 thousand in Portugal, generate revenues of 82 billion Euros, and invest over 6.8 billion Euros annually. This set of economic groups has a common ambition: contributing to the development of a more prosperous and fairer country.
Stakeholders dialogue: active contribution with local organisations sponsorship and partnership programmes
Regarding to the patronage and partnership programmes continuously supported by Nors , in 2021, we sought to be even closer to the associations and institutions that are already part of Nors ' local intervention. One of the entities that is part of Nors ' DNA is the Serralves Foundation: with a partnership that has lasted for years, we have closely supported national culture through the sponsorship of the "Jazz no Parque" initiative, which had its 30th edition in 2021, and different contemporary projects, such as the Gonçalo Pena exhibition, "Barber Shop", which took place between 2 June and 10 October.
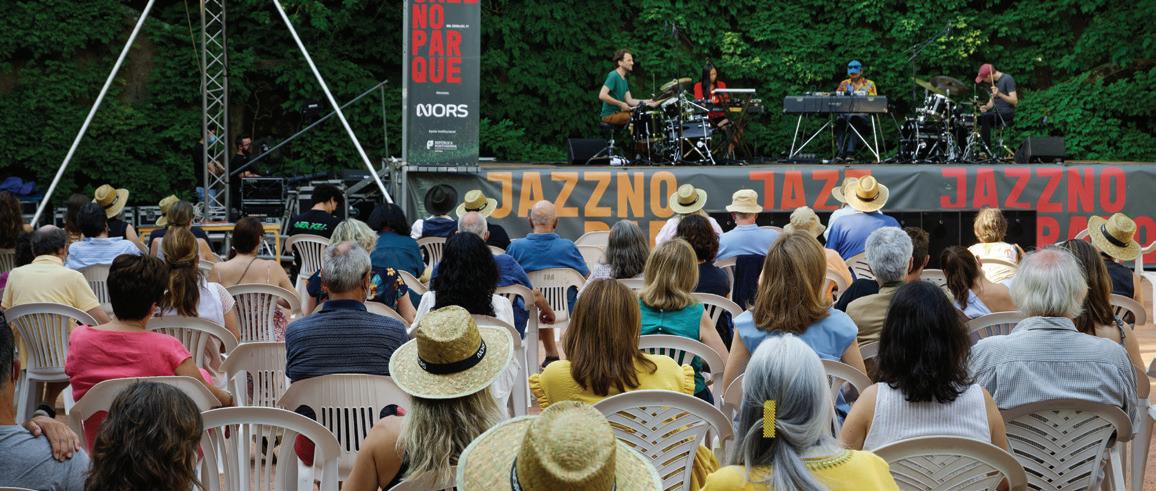
In this sense, we affirmed the continuity of our support to different entities, with differentiated areas of intervention, seeking to increasingly diversify our intervention in the community: from the Cupertino de Miranda Foundation to the Terra dos Sonhos Association, the Novo Futuro Association, the Stand4Good project and the Porto Solidário initiative, in Portugal, we have materialised our will to help in a transversal manner to the different needs that our community brings up.
Stakeholders dialogue: active contribution with local organisations
CHAPTER 02. PAGE 127
Stakeholders dialogue: active contribution with local organisations
Stakeholders dialogue: active contribution with local organisations
gifts
to hospitalised children: Cascais Hospital
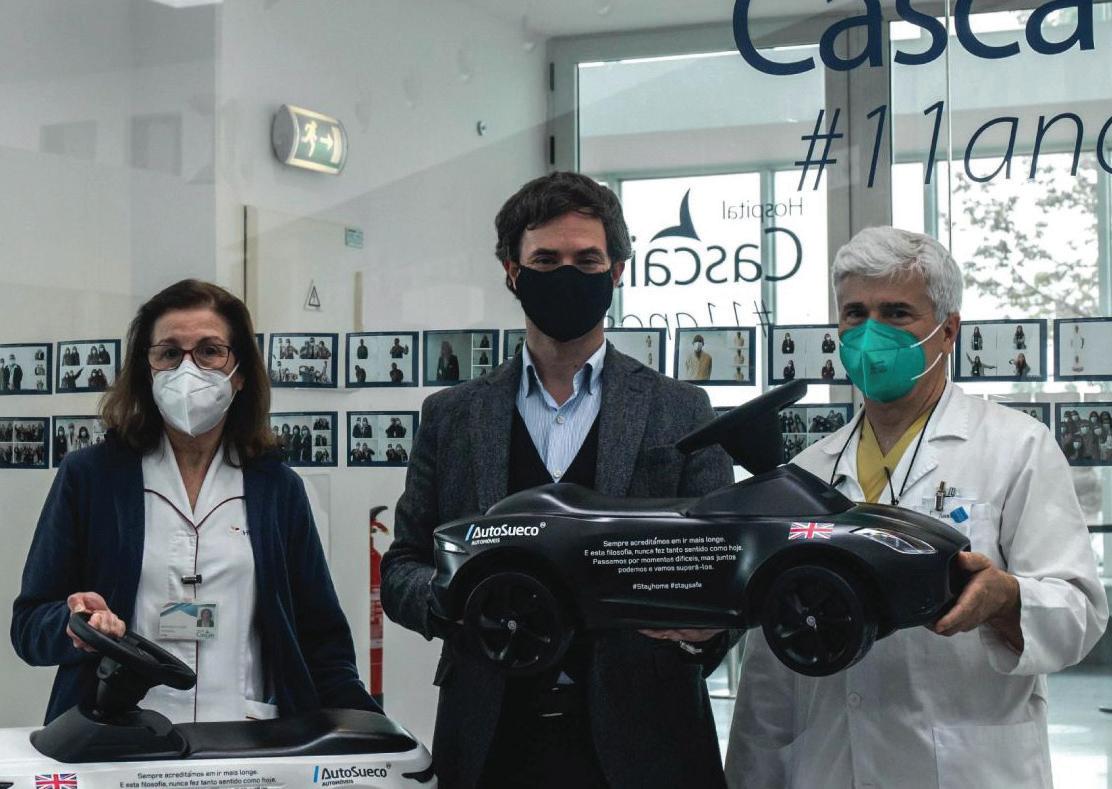
scholarship programme in Angola
As a way of recognising and counterbalancing the context of great social and emotional fragility that we we've experienced, in April 2021, Auto Sueco Automóveis offered two Jaguar and Land Rover miniatures to Cascais Hospital, for children up to 3 years old. This action, promoted to convey a message of encouragement and hope, was present in the words of Jaguar Land Rover itself, a brand represented by Auto Sueco Automóveis: "We've always believed in going further - and this philosophy has never made more sense than today. We've been through some tough times, but together we can and will overcome them." With these carts offer, decorated with a message from the brand, it was possible to take to the paediatric ward of Cascais Hospital a word of hope towards the future, materialising the desire we all have for new journeys, full of emotion and great opportunities.
As part of the social action plan developed by the Angola & Southern Africa Local Corporate Centre, in 2021, 4 young people from needy families, aged between 17 and 21, were awarded scholarships. These young people, who belong to the Comunidade Nossa Terra association and the Dom Bosco Shelter Centre, in Luanda, with the support of the Nors teams in Angola, had the opportunity to develop Secondary Technical Courses in the training areas of Mechanics and Mechatronics.
For these four young people, this programme represented a unique opportunity to go back to school and to dream of a better future - and, who knows, perhaps take up professional challenges in Nors companies in Angola.
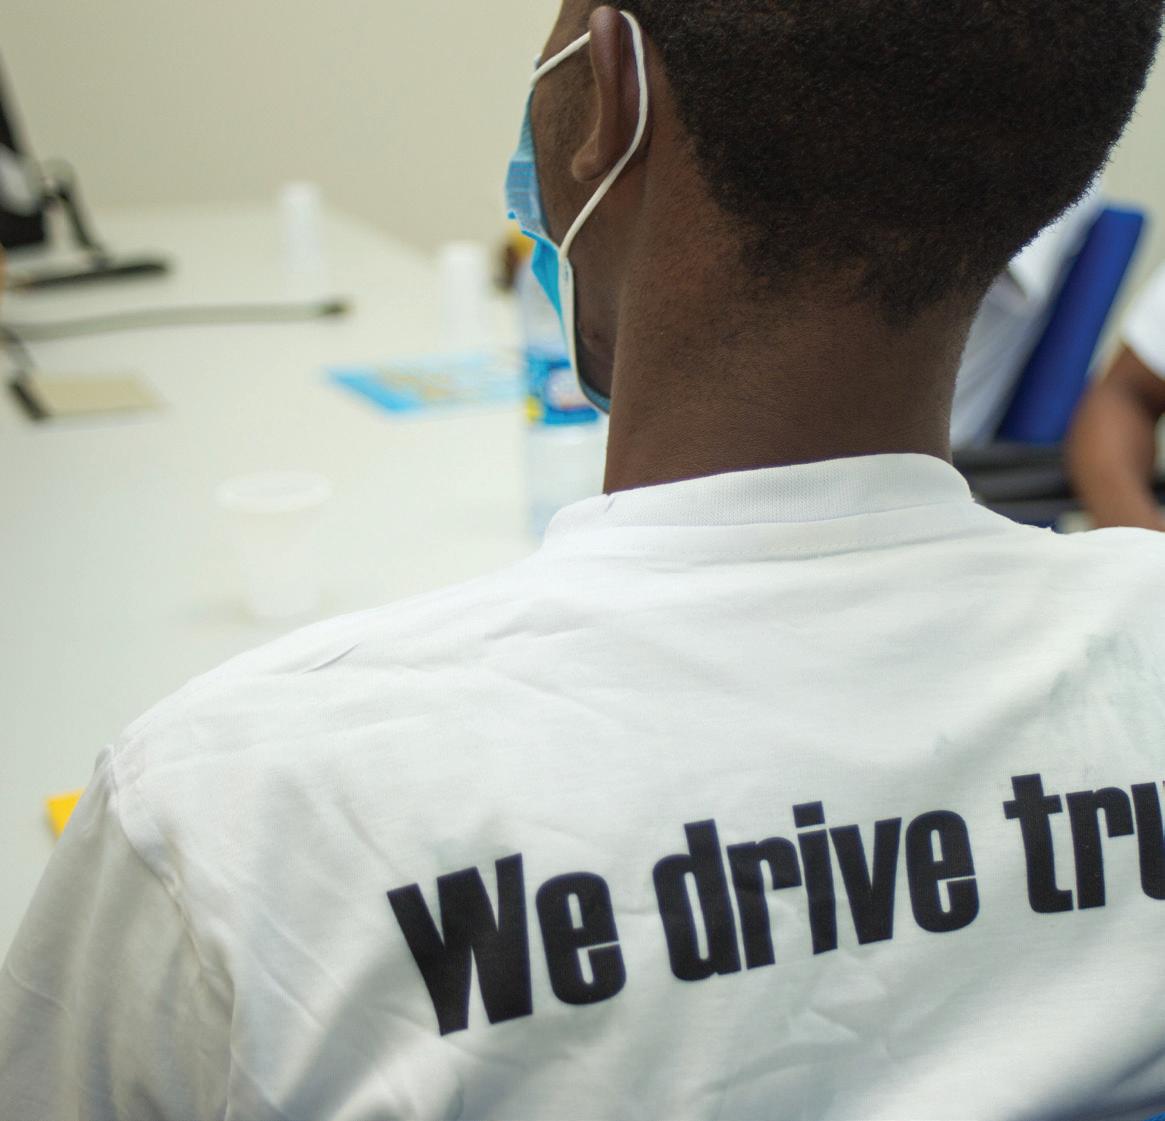
CHAPTER 02. PAGE 128
Stakeholders dialogue: donations and contributions
"Todos Juntos" (All Together) campaign
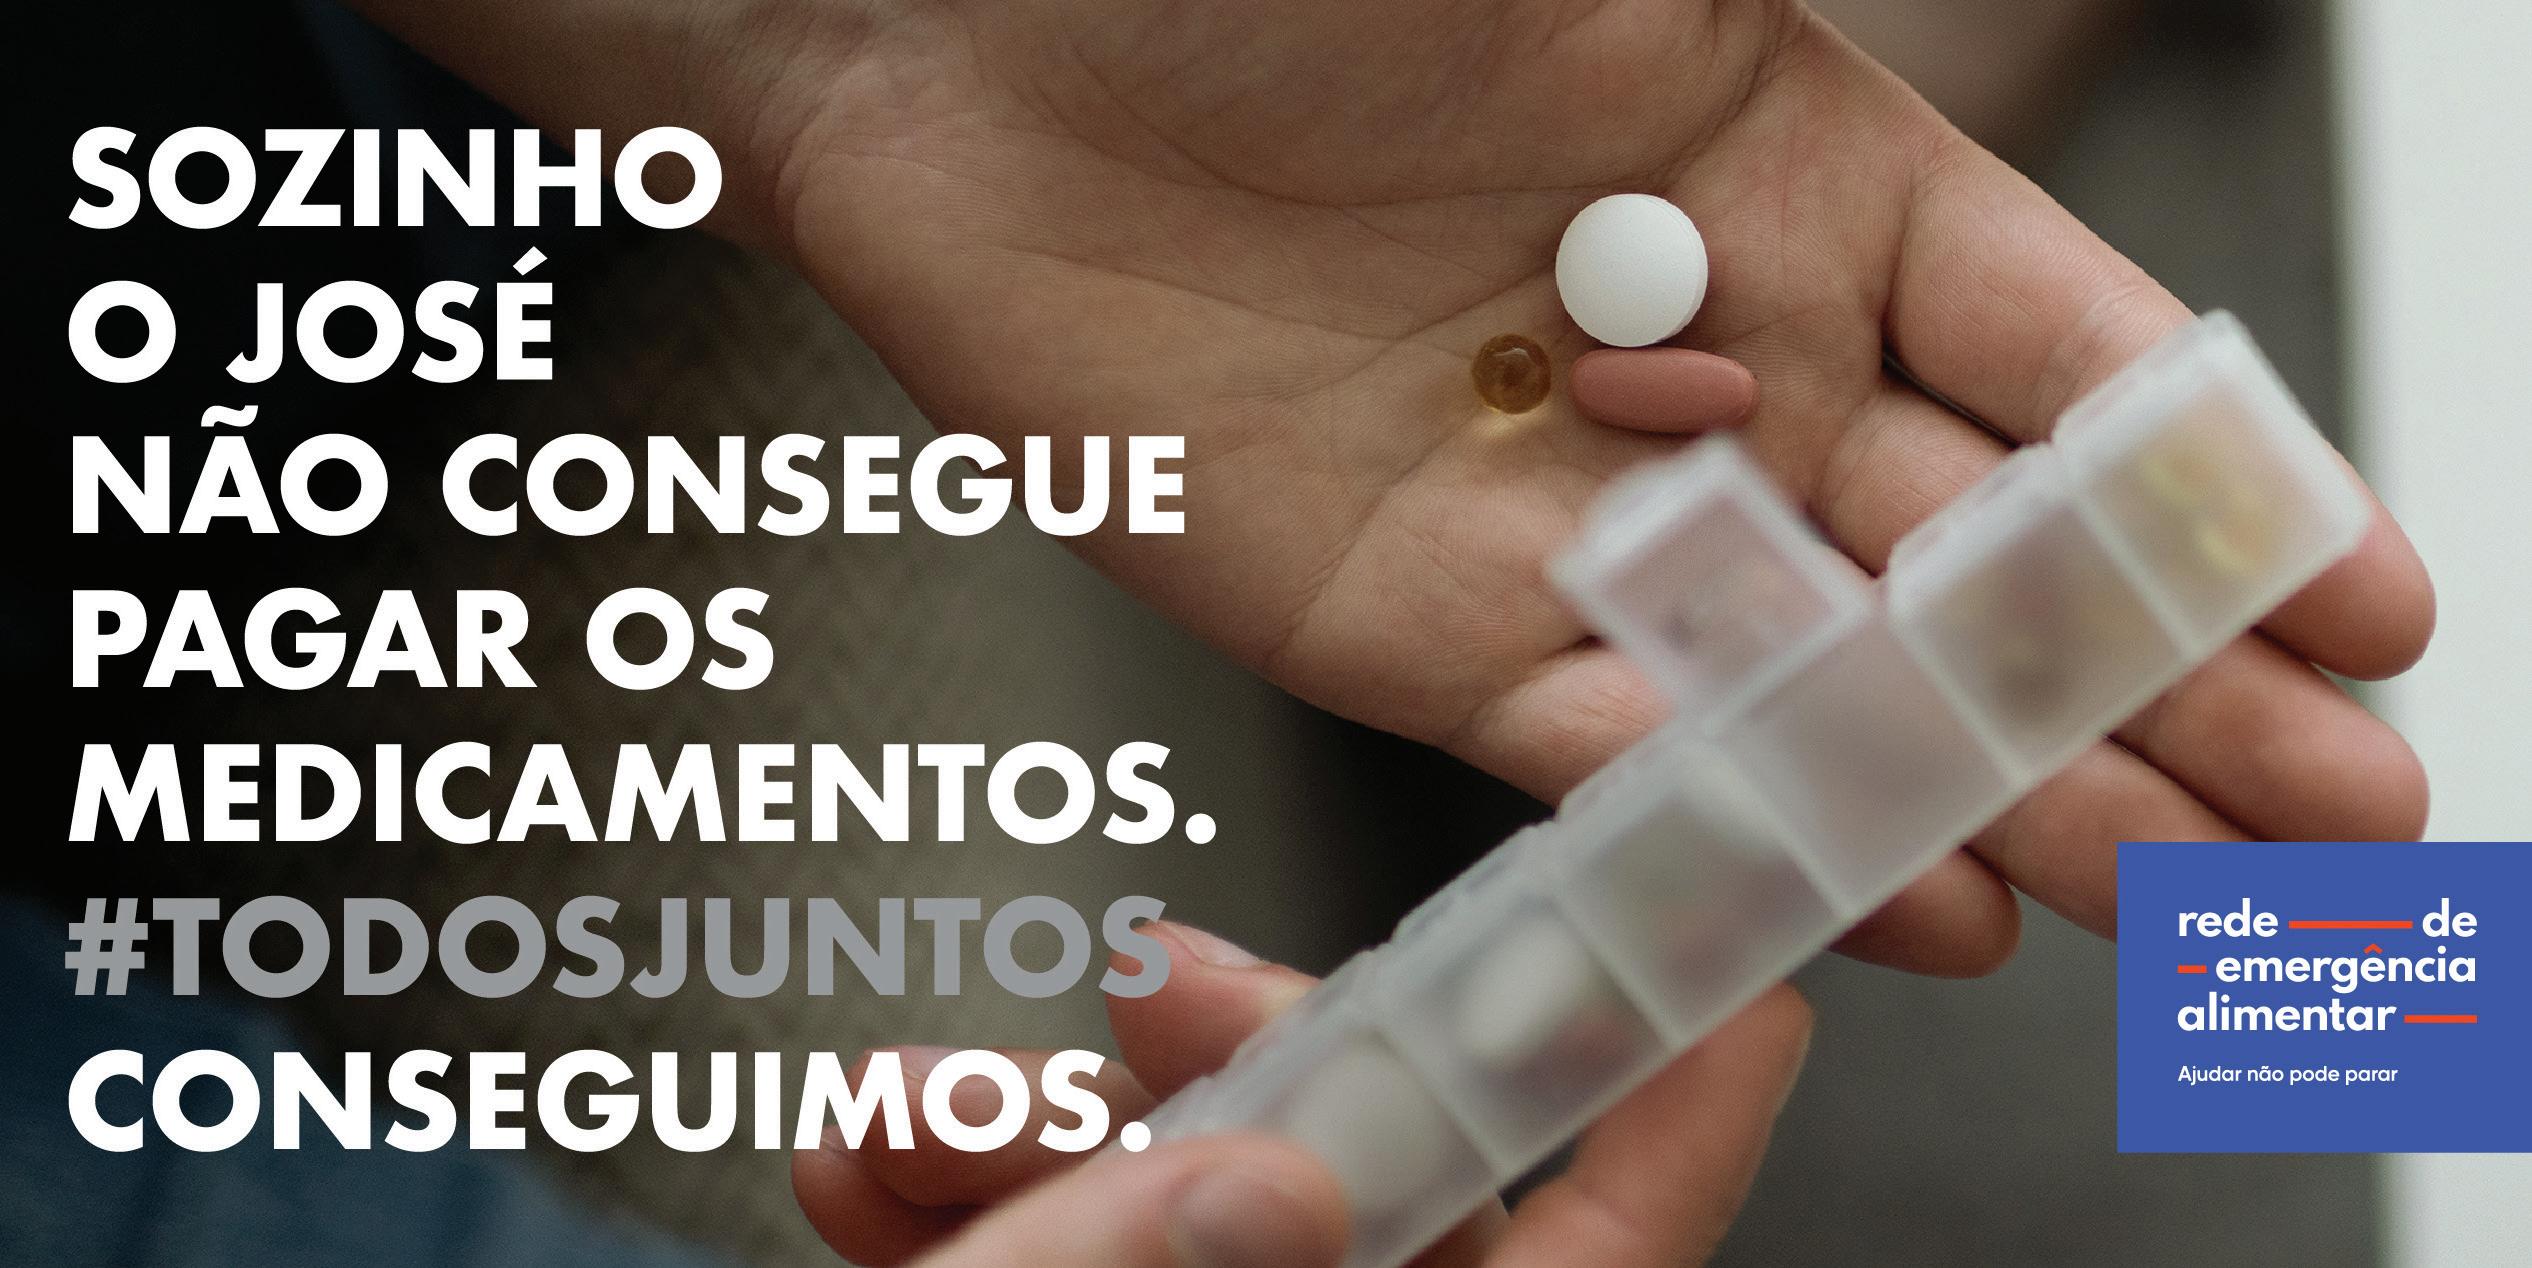
#Alltogether we made a difference. In May 2021, 10 banks of the Portuguese financial system and more than 30 companies joined together in a solidarity action to guarantee food support to the most unprotected families in the context of the pandemic crisis: Nors was one of them.
The initiative counted on the monetary contribution of banks - including Banco BPI/Fundação "la Caixa", Banco Montepio, Banco Santander, Crédito Agrícola, Bankinter and BBVA, among others - as well as financial donations and foodstuffs provided by the different companies that joined this cause.
The Emergency Food Network was selected as the distribution platform, an initiative launched by ENTRAJUDA to respond to situations of need, arising from the impact of the pandemic. Articulated with the Food Banks, this network includes around 2 700 institutions and entities throughout the country, ensuring diversity of beneficiaries and a comprehensive and diligent national distribution (mainland and autonomous regions). The campaign raised a total of 2.5 million Euros for food support to families, enabling the purchase of basic foodstuffs, of which 20% went towards the purchase of medicines.
CHAPTER 02. PAGE 129
people

fluent in driving talent
3.1. our people 134 3.2. people management - governance model 138 3.3. recruitment and selection 140 3.4. training and development 142 3.5. compensation and benefits 144 3.6. Covid-19 146 3.7. communication 148
our people
The contribution of our people to the long-decade-long path we have been building is fundamental. We truly believe that is in people and their talent that lies the true determination to shape even greater horizons.
In 2021, this emphasis was more strongly affirmed considering the vision for the People and Communication area. With a new strategy, led by a new leadership and based on the organisation's new governance model, the mission of contributing to a more cohesive and convergent area, under a narrative of consistency and action, was the motto to begin a new cycle.
Ana Peneda Group People and Communication Director
I believe that people are the key to the success of an organisation: it is people who make companies and who contribute to their great achievements. If I had a "mantra", it would probably be this: to take care of and well manage this element of success, in a relationship of balance, mutual respect and of giving and receiving.
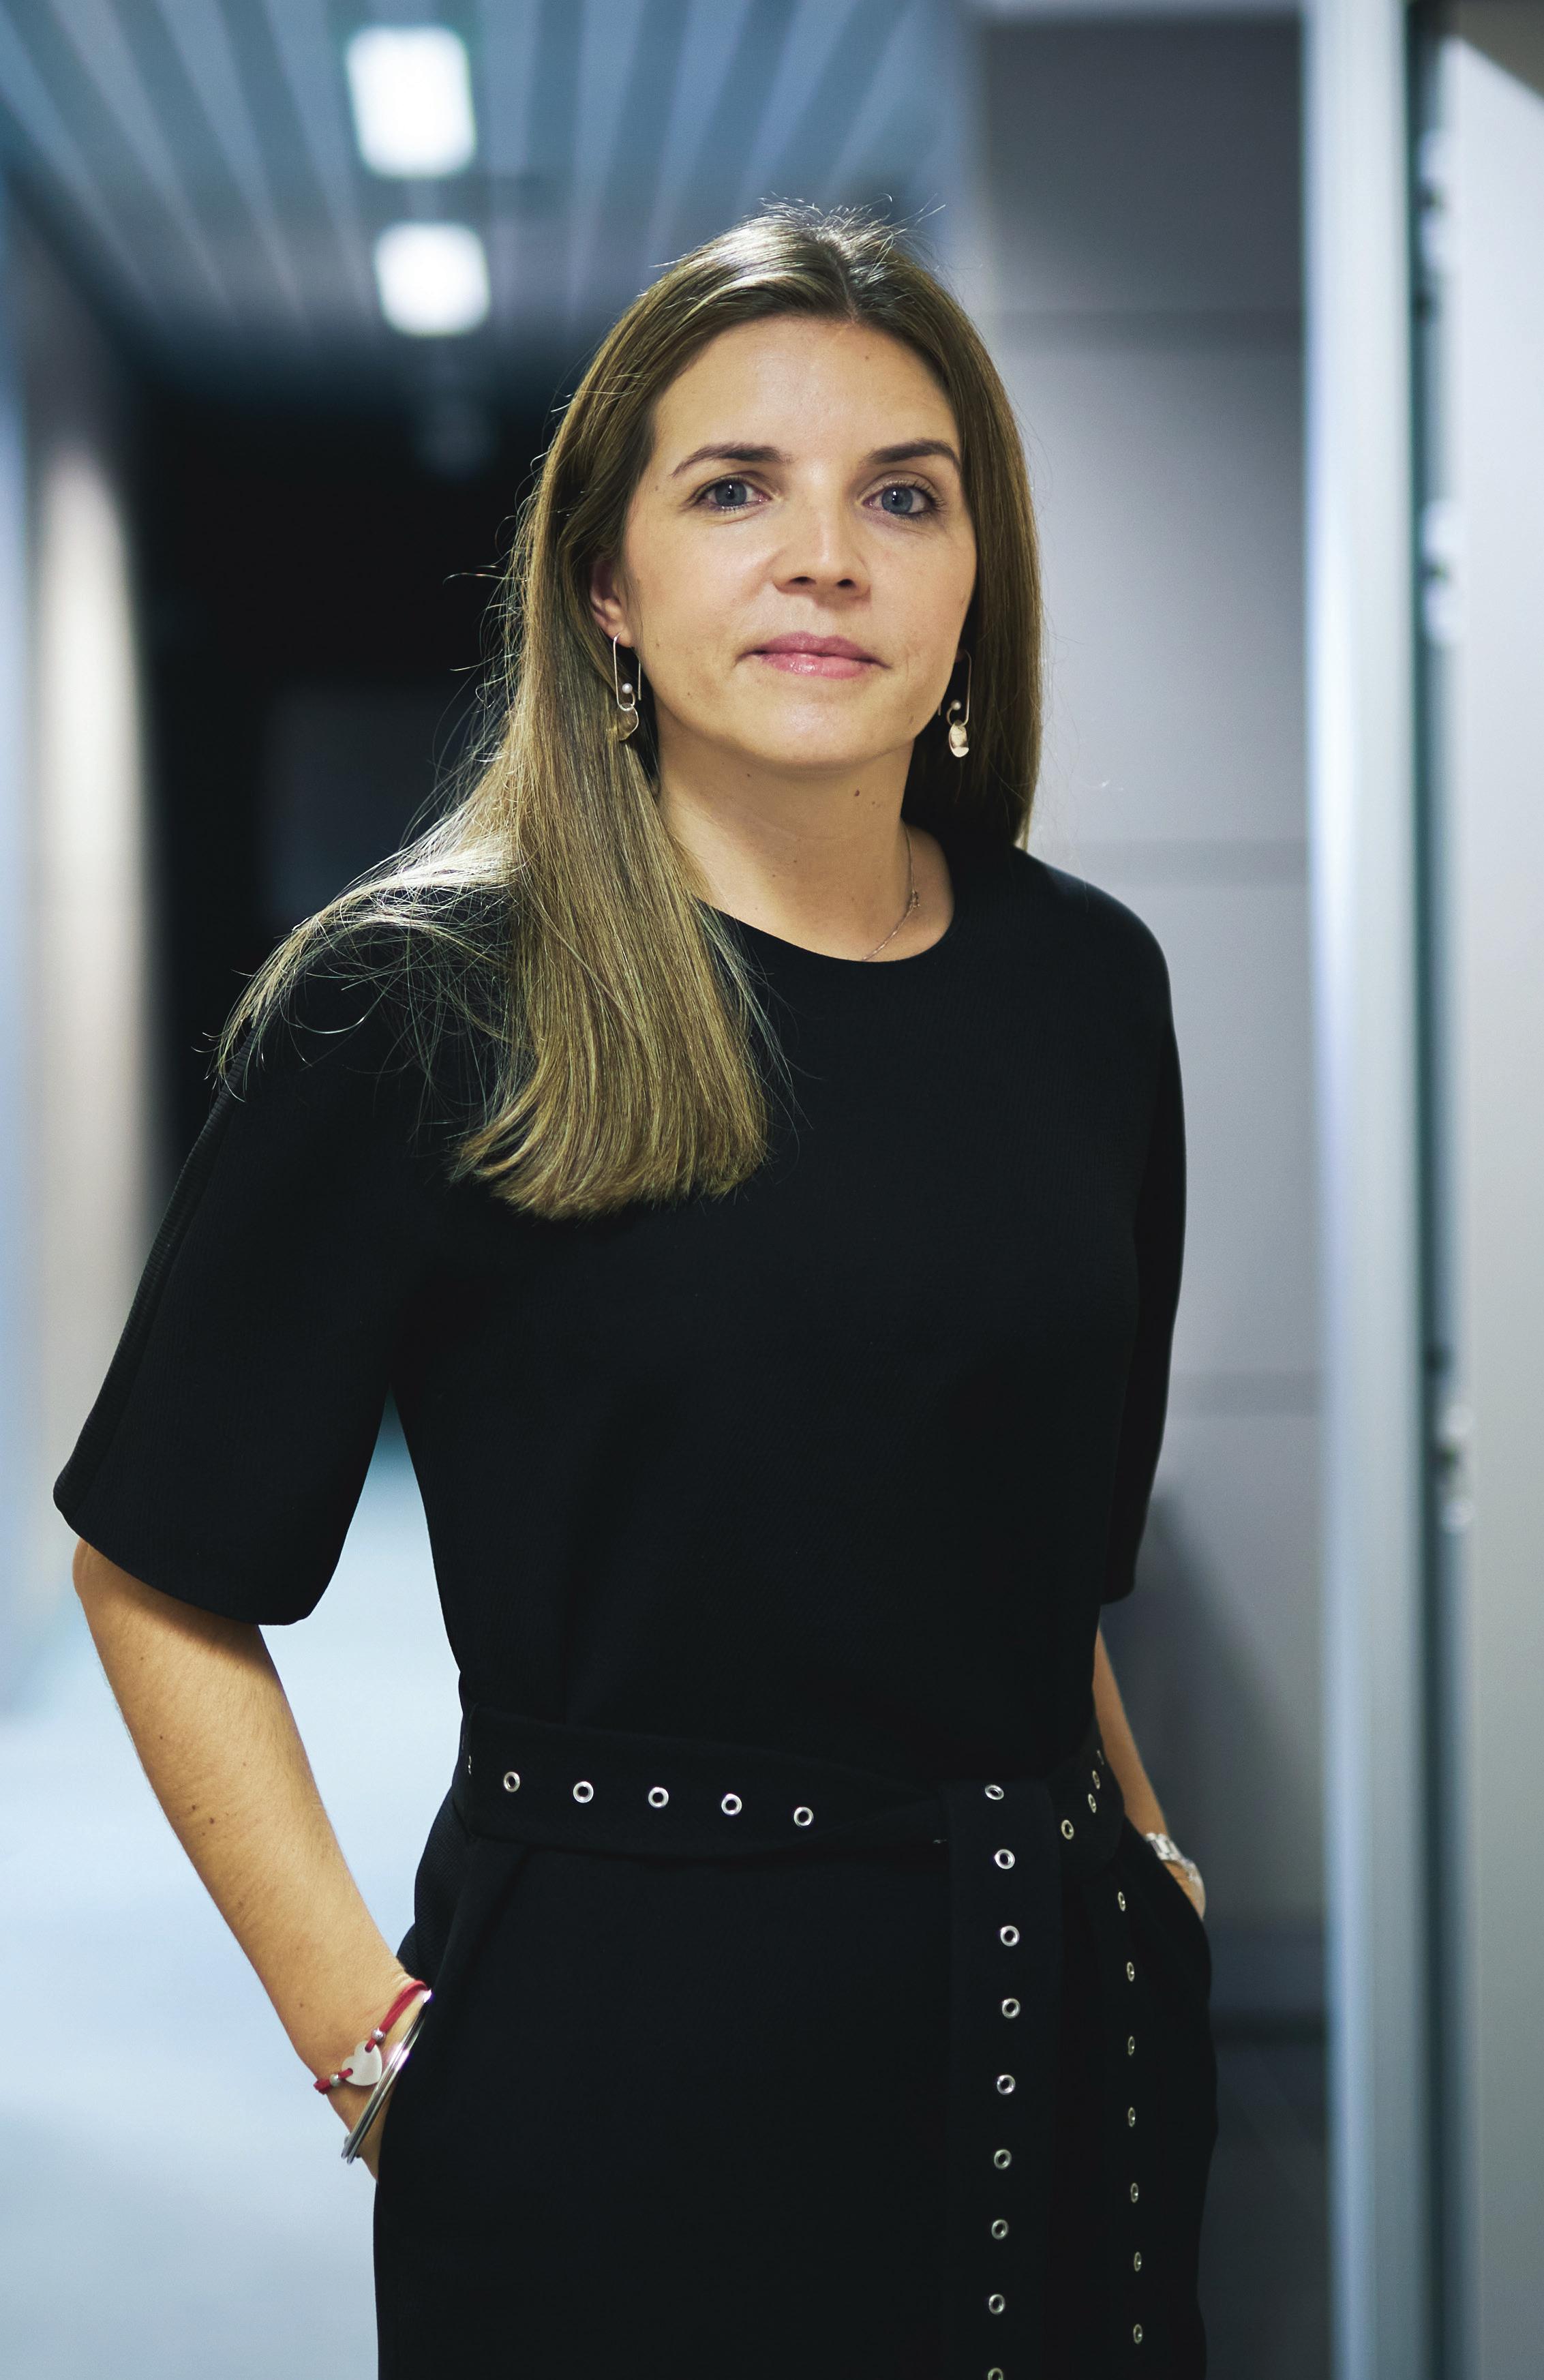
PAGE 132 CHAPTER 03.
3.1.
a narrative that speaks for action
a journey from the inside out
The key areas that make up the People and Communication strategy are built on a logic that begins with attraction - the path of "bringing" talent in - and it steadily and consistently leads to the Nors purpose amplification within the community - the exogenous path of communicating our essence to the world.


talent attraction & onboarding HR processes and organisational structures compensation and benefits talent, training and development Nors culture and employee experience internal communication brand and awareness corporate social responsibility ATTRACT DEVELOP INVOLVE AMPLIFY
PAGE 133 CHAPTER 03.
numbers that speak for us
women 743
men 3 300 others 1

4 044 Employees
PAGE 134 CHAPTER 03.
443 Management roles

87
Training hours
employees under
41 Average age of employees
employees aged between 35 and 50 generation
employees over 50 years old
men 370 women 73
826
30 Nationalities
1 290 959
1 795
35 years old generation Z and X
baby boomers
X and Y
CHAPTER 03. PAGE 135
a new vision, the same sense of commitment
Considering the new organisational structure of Nors , the Head Office of People and Communication is defined as a strategic corporate area for the Group's positioning and future vision, reflecting the premises of this same restructuring process. With the Human Resources Directors of the Local Corporate Centres now reporting to the central structure, the transversal nature of the governance model implemented encourages a view of harmonisation and convergence through processes, which is crucial for an increasingly global presence. The ambition to define a path under a single rhythm, in all geographies in where we operate is based on three main guidelines:
alignment communication sharing
Implementing guidelines and processes transversal to all the Group's companies, capable of reconciling our global presence.
To be the driving force for better articulation regarding the message, positioning and strategy of the different structures that make up our operation.
Aiming a collaborative perspective that ensures that all solutions, ideas and alternatives play an active role in developing a transversal strategy.

CHAPTER 03. PAGE 136
3.2.
people management - governance model
Corporate Centre (Holding)
Head Office of People and Communication
Local Corporate Centres
People

Communication
Human Resources Portugal
Organisational structures, Compensation and Benefits
Talent, Training and Development
Communication and Culture
Communication, Brand and Institutional relations
Human Resources Angola & Southern Africa
Human Resources Brazil
Human Resources Canada
CHAPTER 03. PAGE 137
a mission to attract the best
With the ambition to "develop the best strategies to attract the best people", the Recruitment and Selection area played, throughout 2021, the main role of unquestionable challenges and opportunities. Still marked by the pandemic context that has changed everything - from the processes and formats for approaching the market, to the selection criteria, priorities and needs within the business, Nors has seen the true spirit of mission in all its teams, when it comes to attracting talent.
The strategies for identifying talent and approaching candidates - whether in corporate and backoffice functions or in technical and operational layers - are based on the creation of a truly differentiating Employee Value Proposition, attentive and fully adaptable to the different professional profiles' idiosyncrasies, so distinct, that fit into the Nors universe.
With the remote model prevailing for much of the year, the numerous stages inherent to this sphere - from the identification of talent to the onboarding process - were equipped with the growing digitalisation of processes within the different operations. Thus, 2021 was the time to start implementing the SAP - Success Factors "Recruiting & Onboarding" module at a global level, whose purpose is to enhance a candidate experience that is as lean, personalised and close as possible, optimising and converging the processes that occur across the Group.

3.3. recruitment and selection
CHAPTER 03. PAGE 138

CHAPTER 03. PAGE 139
mapping talent, nurturing and developing it
The context substantively marked by the effects of the pandemic on the labour market, exalted, globally, a reflective posture regarding professional purpose, the role we embrace in society and the way we balance personal life and career goals.

With this background, encouraging our people's know-how, development and talent,contributing to fulfilled professionals, valued and committed to the organisation's purpose, is on Nors top-of-mind. To create an ecosystem of continuous development and evolution, with a learning culture rooted across the operation, is key.
We bet on development and training as the major drivers of a successful career. With a multiplicity of functions and training needs within the organisation, we seek to ensure a comprehensive, differentiating offer and, above all, one that translates into valid and promising opportunities for the future of our employees. Thus, in 2021, we highlight two of the corporate training programmes that have assumed a greater relevance:
3.4. training and development PAGE 140 CHAPTER 03.
Nors business academy
The main goal of the Nors Business Academy (NBA) is to guarantee a targeted and continuous training offer, taking advantage of e-learning through an intuitive, user-friendly digital platform that promotes the pragmatism and interactivity of sessions. In 2021, within a scope that cuts across the entire organisation, we highlight the course "General Data Protection Regulation - GDPR", whose goal was to raise awareness among all employees about the issues of privacy, information security and data protection.
growing
Growing is the Nors remunerated internship programme in Portugal. Encompassing areas such as Mechanics, Mechatronics, Logistics, Metalworkers, Workshop Reception, among many others, Growing began its 5th edition in 2021, acting as a gateway for integrating young talent in the Group's businesses. The main purpose of this training programme is to facilitate young people's integration at the beginning of their careers within Nors ' core areas, strengthening their skills through certified training.
In June 2021, the selected candidates began their internship in two of the companies that make up the Group's mobility sector: Auto Sueco Portugal and Galius. Given the high number of applications, the programme had two classes: one in the north and the other in the south of the country.

CHAPTER 03. PAGE 141
3.5. compensation and benefits
an adjusted, evolving and attractive policy
Ensuring a compensation & benefits policy aligned with the Group's strategic goals, the ability to continuously answer the challenges of attracting and developing our People is today, more than ever, crucial.
At the beginning of 2021, this area embarked on the internal processes' digitalisation with the go-live of the SAP Success Factors module - "Employee Central", whose main purpose is to converge information and optimise methodologies and work procedures related to people management.
In the area of digitalisation, the year was also defined by the launch of the Group's Performance Management System, which is now supported on a new platform, SAP Success Factors, through the "Performance & Goals" module, harmonising the definition of goals and evaluation of Nors employees’ skills.

Embodying the strategic vision of ensuring an adjusted, evolving and attractive remuneration policy, at the final months of the year, we've started a structural project to reformulate Nors ' Remuneration Policy, recasting the guiding principles and aiming to adopt new approaches and remuneration strategies. The implementation path of this new Retributive Policy will start in the first half of 2022, through a journey of several stages and investment moments.
Regarding the benefits area, the end of 2021 was time to plan and structure a benefits programme transversal to the whole Group. The mission is to aggregate all the advantages and special conditions granted to Nors employees - discounts and partnerships, flexible benefits, and many others. Its launch is expected for the second quarter of 2022.
PAGE 142 CHAPTER 03.

PAGE 143 CHAPTER 03.
continuing a robust and prompt response
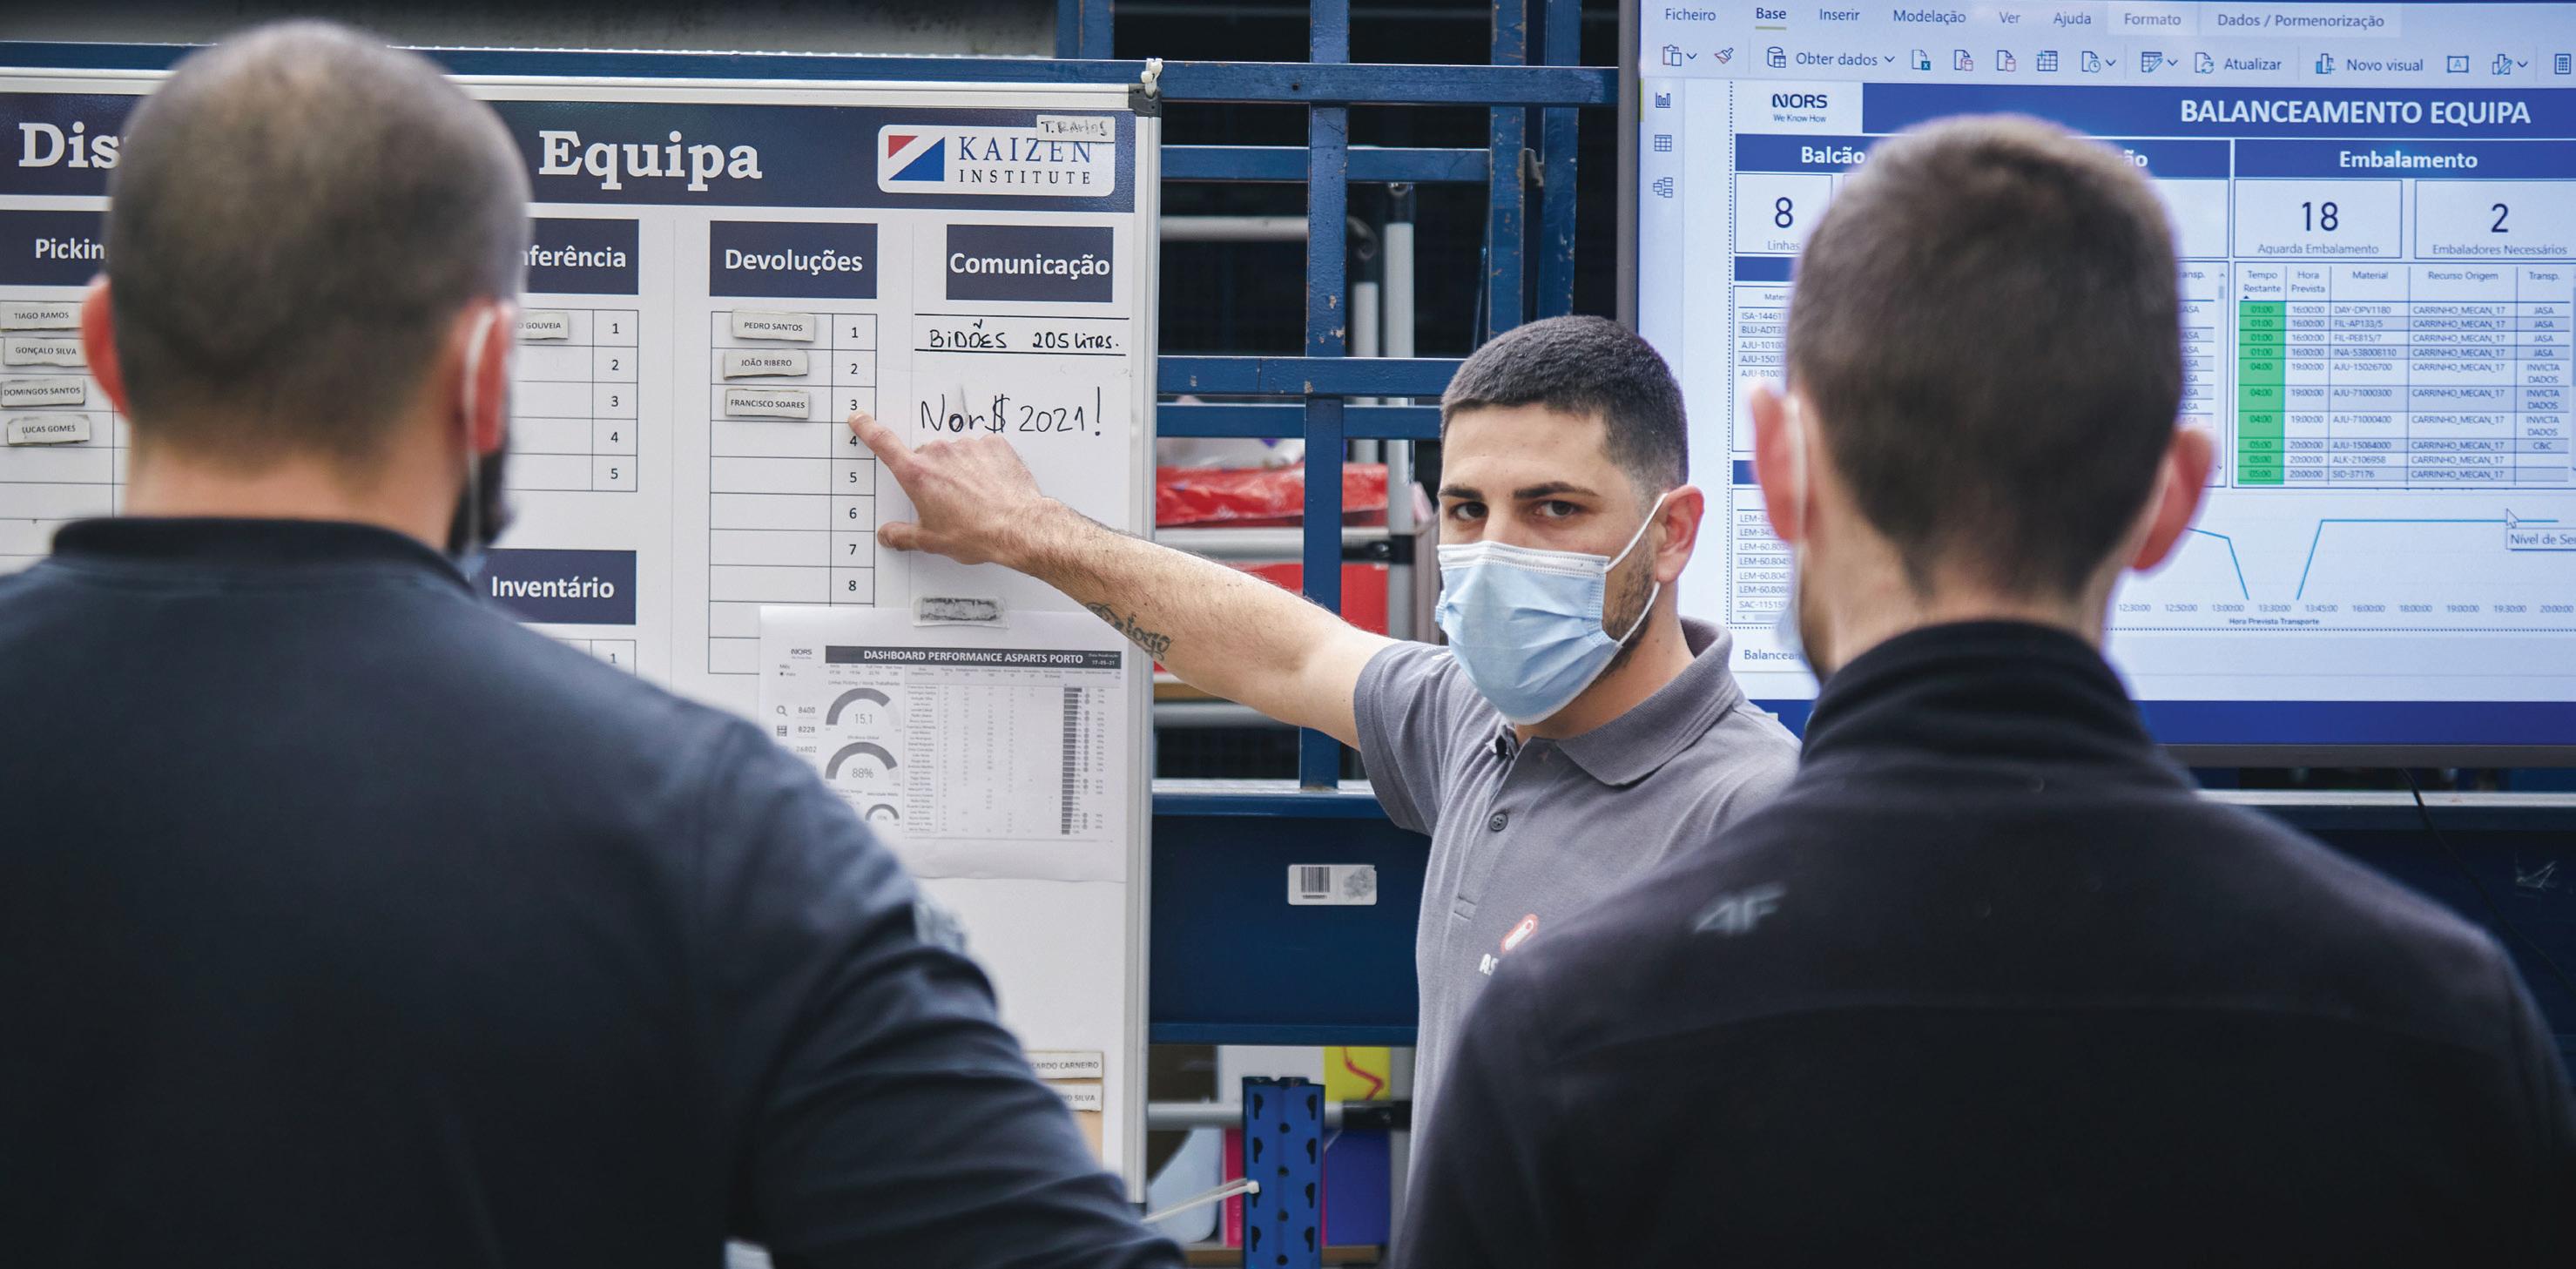
3.6. Covid-19 PAGE 144 CHAPTER 03.
In 2021, the effects caused by the Covid-19 pandemic mirrored across the world, especially in the area of People Management. The demand for flexible working models (inherent to the increasingly desired work-life balance) has brought to the Group the urge to listen to its people, frame their preferences and design new working approaches, able to be adapted to the functional morphology of the different companies and structures that make up Nors .
Thus, in the last four months of the year, constant feedback from the different employees and decision-makers brought Nors a hybrid working scenario: with the possibility of electing up to two remote
work days per week, and focusing on the functions eligible to work remotely, the Group witnessed a new way of working and a new perspective for the future. Although this model still operates within a logic that is closely related to the pandemic context, it was an important step towards the implementation of flexible models that affirm a logic of continuity.
Focusing on a more global scope, 2021 was seen as a year of recovery and capitalisation of all the efforts made in response to the pandemic impacts, with an evident recovery in the markets where Nors operates. This was only possible because Nors , throughout the different waves of the pandemic, continued its
management of proximity, support and total dedication to the health, safety and well-being of all those who relate to the operation, prioritising employees and their families.
Considering the diligent spirit in response to the pandemic crisis that the world experienced, as well as Nors ' particular efforts in conducting clear communication and consolidating its working models, we believe that 2022 will be a crucial year in normalising our operations and the wellbeing of our people.

PAGE 145 CHAPTER 03.
communicating to involve, in a single tone of voice
The year 2021 marked a strategic turning point concerning Corporate Communication: the creation of an area dedicated to Communication and Culture issues mirrors, clearly and unequivocally, Nors ' will to create an ever-greater connection between the People axis and Communication, seeing this approach as a strategic link. The creation of strong and cohesive Employer Branding strategies and the purpose of creating an increasingly substantive connection with the Nors community, worldwide, are some of the pillars that drive a more relevant, more human and closer communication. We believe that this endogenous vision, of "looking inwards, converging, involving and recognising" advocates the conciliatory message that such a diverse and multidisciplinary Group needs to hear.

3.7. communication CHAPTER 03. PAGE 146

CHAPTER 03. PAGE 147
we Nors awards
Despite the pandemic context making it impossible to hold the event in 2020, the We Nors Awards returned in 2021 with the usual spirit of celebration. The event, which aims to recognise the contribution of all the Group's employees in different areas of activity, is an opportunity to thank the effort, dedication and talent that the Nors teams put into their work every day.
Held in digital format, the event was transmitted via live streaming to all Nors employees, present in the different countries in which we operate, with simultaneous translation and interaction with the different recognised nominees. To recognise the best initiatives in the fields of team spirit, customer orientation, leadership, innovation, business performance and in the "being Nors " category, the 12 winners who stood out throughout 2019 and 2020 were elected. Additionally, this edition had the special participation of "heavyweight" guests: the scenography of the event included two trucks, a wheel loader and a bus, personifying, live and in colour, some of the business areas that the Nors universe comprises.
CHAPTER 03. PAGE 148

CHAPTER 03. PAGE 149
annual meeting
For the Group, it is crucial to share with all employees and partners, on an ongoing basis, its strategic vision, the goals achieved and the projections it envisions for the future. Transparency, openness and clarity are crucial to Nors ' actions: it is thanks to these pillars that we have built a path of strength and ambition. Inspired by these values, several years ago, we held the Nors Annual Meeting: a meeting designed for the Group's leadership layer in which the main guidelines of the organisation's strategy are presented and discussed.
The 2021 event was marked by the concept of sustainability: the aim was to address the topic in a global approach, from a perspective of consistency and determination for the future. Thus, structured on a holistic approach, the meeting agenda was organised around four pillars: Sustainable Numbers, Sustainable Markets, Sustainable Motions and Sustainable Future.
CHAPTER 03. PAGE 150
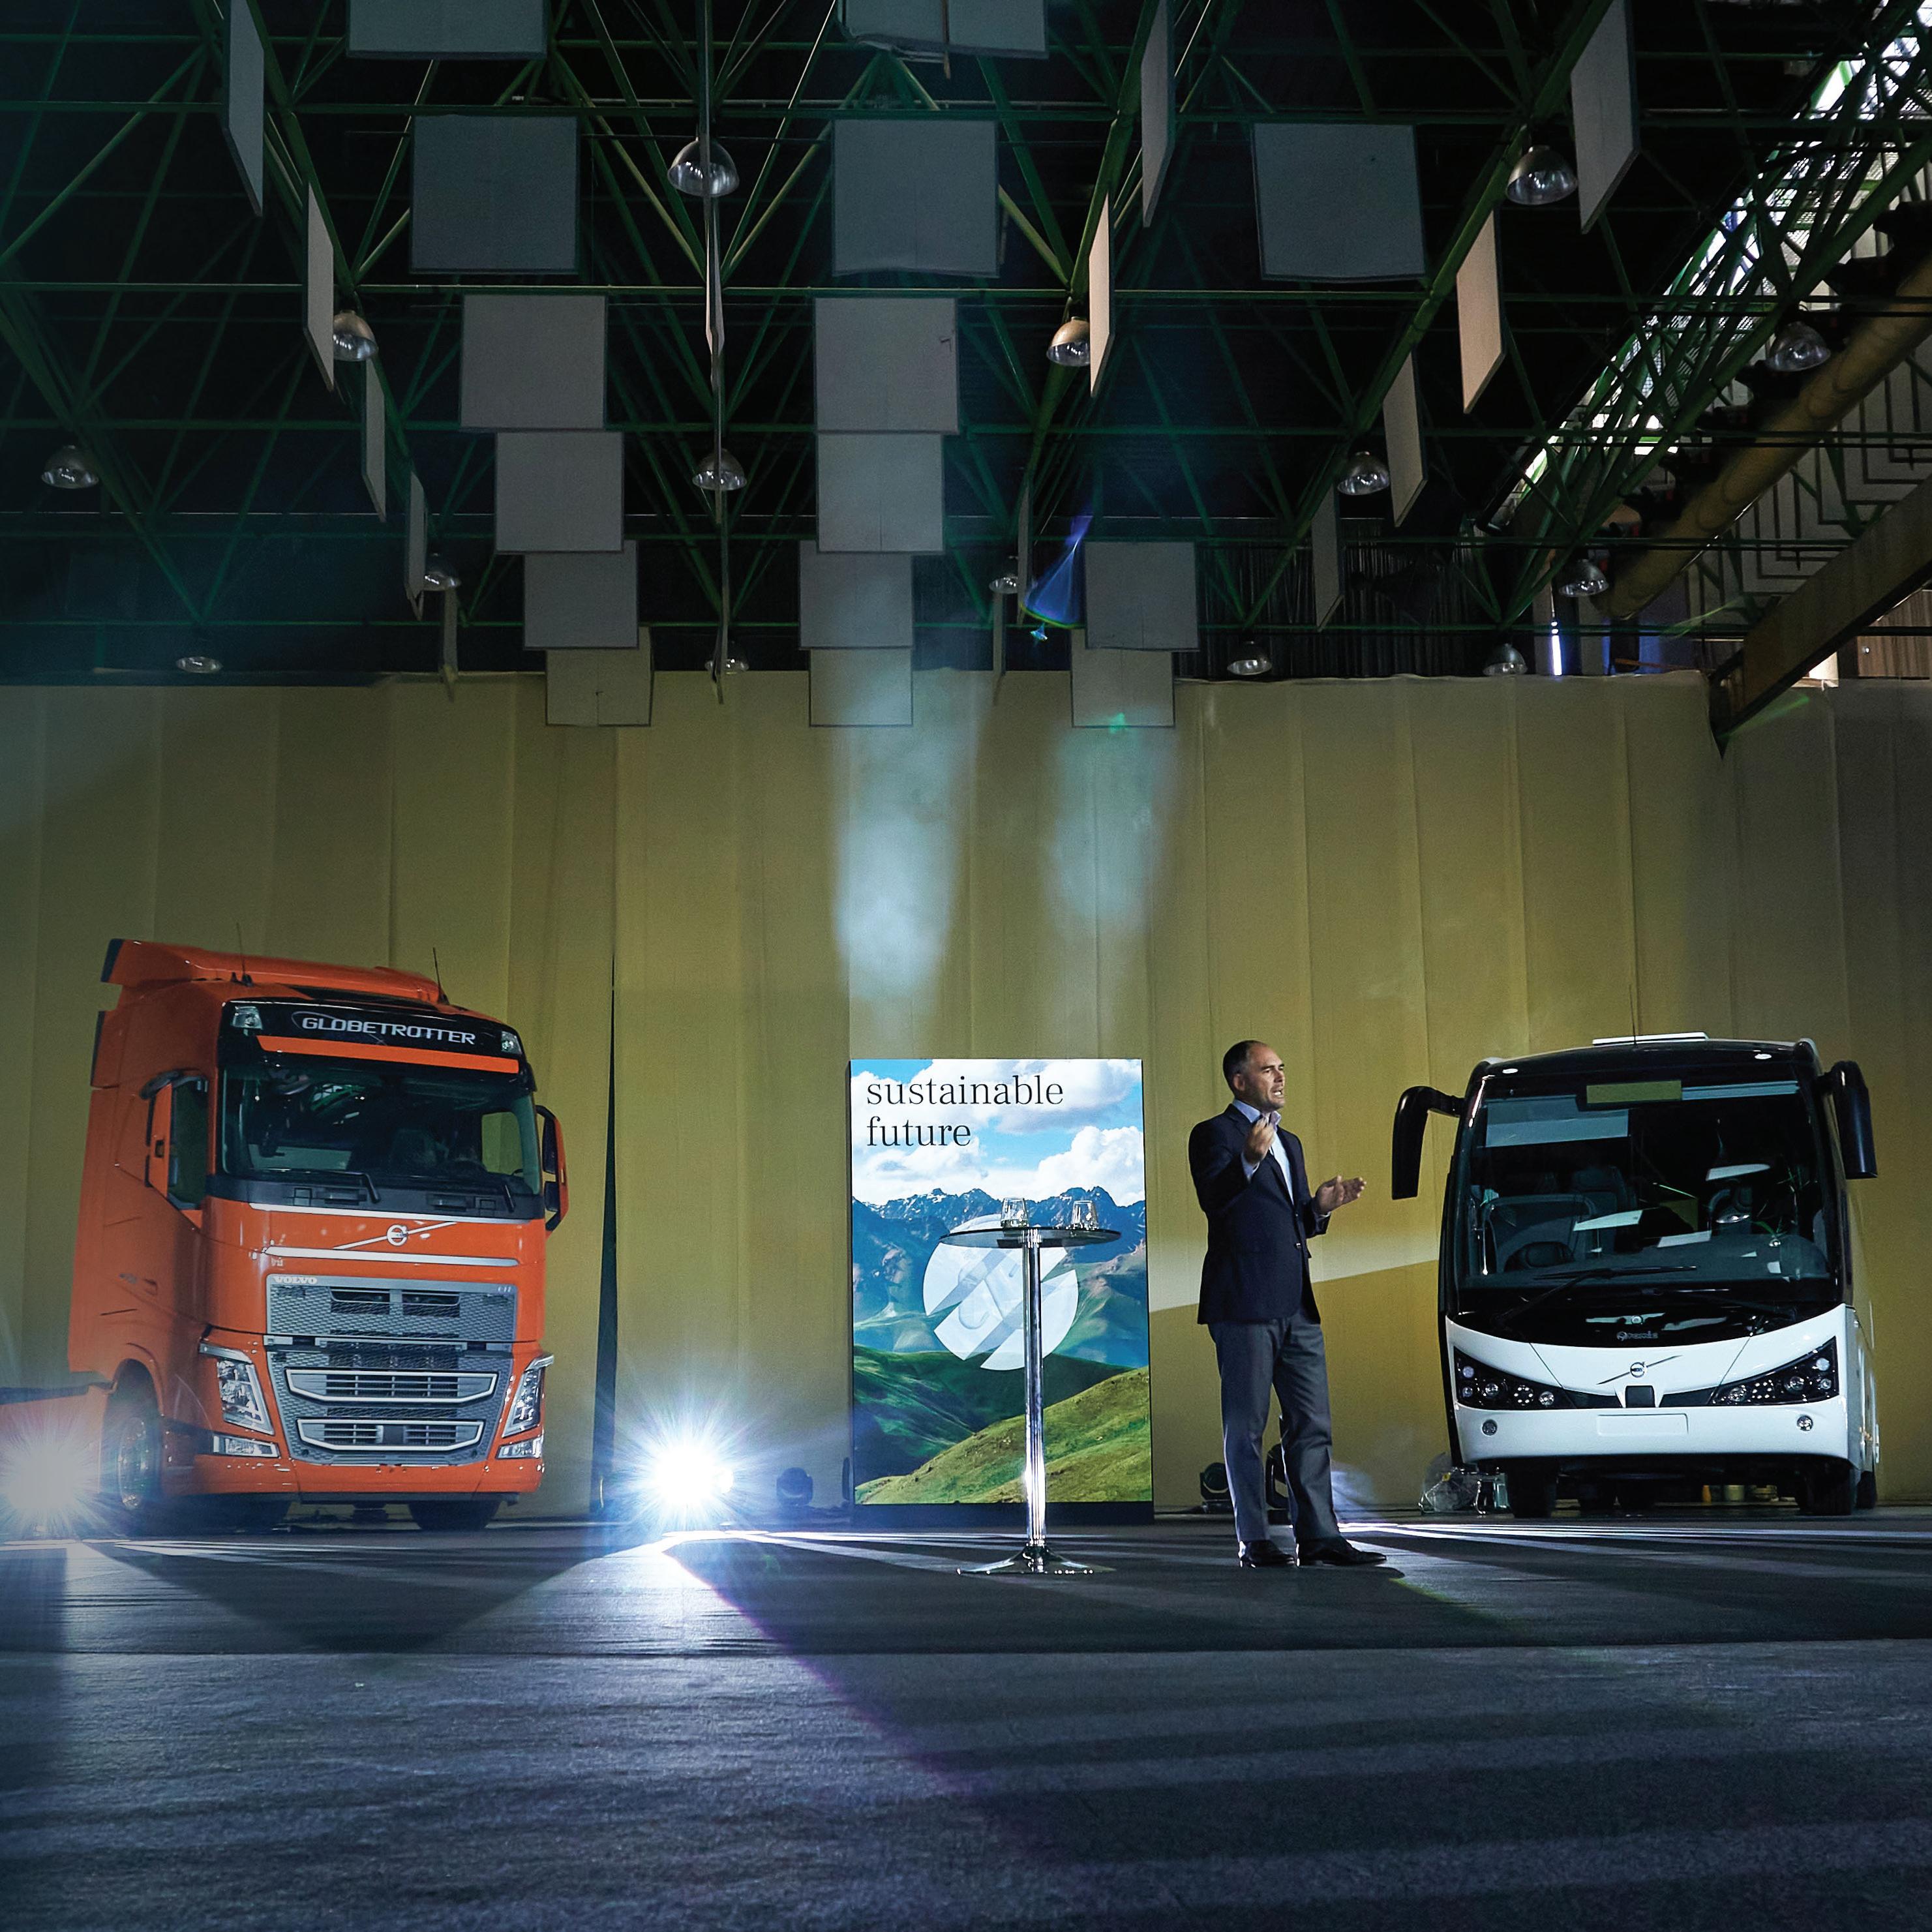
CHAPTER 03. PAGE 151
Nors magazine

The year 2021 also marked the launch of the Group's new corporate magazine, named Nors Magazine. Published biannually, the publication brings together different interviews, news and articles that focus on the numerous projects, themes and the People that make up the organisation. In addition to the digital version, available on internal channels and the Group's institutional website, a printed version is produced, distributed and delivered to the homes of each of our employees around the world.
The latest 2021 edition, distributed in November, had a strong involvement from all the People who contribute to a diverse, culturally rich and truly inspiring Group. Covering a range of topics - from business and process optimisation, interviews with employees from different geographies, generations and functions, culturally driven articles and themes such as equality, new working models and innovation - we believe this is one of the main vehicles for sharing and celebrating Nors ' organisational culture.
CHAPTER 03. PAGE 152
CHAPTER 03. PAGE 153
mark the day

Mark the Day was born in 2021 to mark relevant dates worldwide, in all of the Group's geographies and structures. Promoting activities and sharing information and content of global interest, this initiative is part of the Employee Advocacy & Engagement strategy, with an intervening and aggregating nature, which aims to raise awareness among the Nors community about issues integrated into the ESG (Environmental, Social and Governance) concept.
Throughout the year, we've celebrated many days such as World Book Day, with the sharing of literary suggestions and relevant authors worldwide, International Youth Day, with testimonials on the historical events that have marked the different generations that the organisation comprises, the International Human Rights Day, among many others. With a pipeline of initiatives defined every year, all the activations are supported by allusive activities and communications that frame the different themes.
CHAPTER 03. PAGE 154

CHAPTER 03. PAGE 155
organisational climate

Held every two years, the Nors Organisational Climate survey aims to give a voice to the employees and understand their level of satisfaction regarding the work environment promoted in all the companies and countries where we operate. In 2021, this iniative's communication plan was developed based on the personalisation and humanisation of the message: we elected employees from different countries, of different age groups, functions and paths to be the faces of the organisation's #voiceofthefuture, the motto that set the tone of the campaign.
With an enormous involvement by the Human Resources areas of the Local Corporate Centres, who endorsed and gave voice to the communication of the project in loco, we achieved a participation rate of 74%, a record number for the Group. All the results inherent to this initiative will be communicated to the organisation during the second quarter of 2022.
CHAPTER 03. PAGE 156
CHAPTER 03. PAGE 157

04. 4.1. main macroeconomic indicators 163 4.2. economic performance 191 4.2.1. Global economic performance 192 4.2.2. Economic performance by business unit 204 4.3. risks and uncertainties 231 4.4. 2022 in perspective 237
main macroeconomic indicators performance
4.1. main macroeconomic indicators
a global overview of the markets
portugal
According to the latest year-end projections, Portuguese GDP rebounded above expectations in the second and third quarters of 2021. Portugal achieved economic growth of 4.9% with the gradual easing of pandemicrelated constraints positively impacting consumer demand.
Part of the 2021 economic growth stems from an increase in private consumption of 4.5%, which had declined by 7.1% in the previous year. This growth is partly due to a strong recovery in spending on services, benefiting from the lifting of containment measures and the generalised increase of confidence inherent to the progress on vaccination.
Regarding public consumption, growth is expected to reach 4.3% in 2021, representing a strong development compared to the previous year, when there was a decline of 0.4%. This development is justified by the increase in the number of hours worked in public administrations, which was substantially impacted during lockdown periods in 2020.
Reflecting on the lifting of restrictions on international mobility and increased confidence, exports of services - in particular tourism and associated transport services - have been recovering sharply, after falling abruptly in 2020 (-18.6%) and early 2021, reaching an increase of 9.2%. This recovery is distinct between goods and services, with exports of goods exceeding prepandemic levels by the end of 2021. After a strong growth of 9.2% in 2021, projected imports show moderate growth over the next few years.
Over the same period, the unemployment rate has reduced to 6.6%, after a slight increase to 7.1% in 2020. It is important to mention that in 2019 this indicator recorded its lowest value since 2003, showing a rate of 6.5%, with the tourism sector at its peak. With the progressive elimination of employment retention schemes, labour indicators should improve at a much slower rate than GDP, with a gradual recovery in labour productivity. Thus, the unemployment rate is expected to decline marginally to 6.5% in 2022, and 6.4% in 2023.
PAGE 162 CHAPTER 04.
Inflation, meanwhile, increased to 0.9% in 2021 and it is forecasted that it will increase by 4.0% in 2022, stabilizing at 1.5% in 2023 and 1.3% in 2024. This increase and subsequent moderation largely reflect the significant evolution of the prices of energy goods, which keeps up with the price of oil in the international markets, that result of the restrictions in the supply chains and the embargoes from the war in Ukraine.
In addition, industrial goods and base effects in tourism-related services also contributed to the rise in inflation. Nevertheless, the rise in inflation in Portugal was moderate compared to other countries in the Euro Zone.
In 2022, GDP is predicted to grow 4.0%, followed by a 2.1% growth in the following year, 2023. It is therefore anticipated that the Portuguese economy will reach pre-pandemic levels in the first semester of 2022.
GDP growth rate in Portugal Inflation rate in Portugal 2019 1,2% 0,9% 4,0% 2021 2022E -0,1% 2020 0,3% 2018 2019 2,8% 2,7% 2021 2022E 2020 2018 -8,4% 4,9% 4,0% Source International Monetary Fund OECD - Economic Report December 2021 Banco de Portugal - Economic Bulletin December 2021 PAGE 163 CHAPTER 04.
spain
Lockdown measures dragged down Spanish economic activity in the first half of 2021. However, since the lifting of the state of emergency in mid-May, the economy has entered a steady recovery, supported by the success of the vaccination campaign carried out in the country. While the services sector (including leisure and tourism activities) is finally supporting the country's recovery, an acceleration in job creation has also been observed in recent months, which contributes to strengthening confidence in both industry and services. In this context, after having registered the deepest GDP plunge of the Euro Area in 2020 (-10.8%), GDP should reach an annual growth rate of 5.1% in 2021, with private consumption as its main driver.
The strong recovery of private consumption, driven by demand and the reopening of the services sectors, will substantially support the Spanish economy to regain momentum from pre-pandemic economic levels.
GDP is expected to grow by 4.8% in 2022 and 3.3% in 2023, supported by expansionary fiscal and monetary policies.
Domestic demand will be the main driver of growth since rising confidence, improved labour market conditions, favourable financing conditions and EU funds boost private consumption and investment.
Although uncertainties have eased thanks to the control of the health situation at national level, the persistence or resurgence of the pandemic in other countries may weigh on economic growth, notably by delaying a full recovery in the tourism sector.
Inflation reached 3.1% in 2021, and is expected to reach 5.3% in 2022 and to decrease to 1.3% in 2023. This decrease is due to strong negative effects on energy prices, considering that in Spain the energy crisis continues to dominate inflation dynamics.
The labour market has shown remarkable resilience compared to previous crises. Both the number of workers and the unemployment rate showed a positive development - namely the reduction of the unemployment rate from 15.5% in 2020 to 14.8% in 2021. The unemployment rate is expected to decrease to the pre-crisis level in the year 2022 (14.1%).
PAGE 164 CHAPTER 04.
growth
in Spain Inflation rate in Spain 2,3% 2019 -10,8% 2021 2022E 2020 2,1% 5,1% 2018 4,8% 1,7% 2019 5,3% -0,3% 2021 2022E 2020 0,7% 2018 3,1% Source International Monetary Fund OECD - Economic Report December 2021 PAGE 165 CHAPTER 04.
GDP
rate
brazil
In the Brazilian market, GDP grew by 4.6% in 2021, however, this indicator is expected to decelerate to 0.8% in 2022, with a slight recovery to 1.4% in 2023. The vaccination campaign accelerated economic activity, sustained by private consumption and investment, which picked up as restrictions were alleviated. Exports benefited from the global economic recovery, namely from the consistent demand for commodities by major international partners. Nevertheless, delivery shortfalls, lower purchasing power, higher interest rates and political uncertainties slowed down the pace of recovery.
Although Brazil has one of the highest Covid-19 rates in the world, the impact on the economy has been relatively modest, when comparing to other emerging countries. This inference is due to a combination of the health sector strategy - which can be described as less restrictive when compared to other economies - and an aggressive fiscal policy focused on supporting households.
Accelerating inflation is undermining the recovery in wholesale trade, retail sales and services (8.3% in 2021 compared to 3.2% in 2020). Inflation is aggravated by the water crisis that is reducing water levels and contributing to higher domestic electricity prices, considering that two-thirds of electricity supply relies on hydropower. This rate of growth has pressured the Central Bank of Brazil to increase the Selic rate from 2.0% to 9.25% in 2021, achieving 11.75% in early 2022, reiterating that controlling inflation will be a priority in 2022. Lower purchasing power and higher interest rates have interrupted the regeneration of consumption and business confidence, postponing the recovery of domestic demand.
PAGE 166 CHAPTER 04.
GDP growth rate in Brazil Inflation rate in Brazil 1,8% 0,8% 2019 -3,9% 4,6% 2021 2022E 2020 1,2% 2018 3,7% 8,2% 2019 3,2% 8,3% 2021 2022E 2020 3,7% 2018 Source International Monetary Fund Novo Banco - Monthly Information January 2022 PAGE 167 CHAPTER 04.
canada
In 2021, Canada disclosed a GDP growth of 4.6% (compared to -5.2% in 2020), which is higher than the growth achieved in pre-pandemic years. The projections for 2022 and 2023 reinforce this same recovery, with forecasts pointing to 3.9% and 2.8%, respectively.
One of the main contributors was the Gross Fixed Capital Formation (GFCF), where Canada had an exceptional performance in 2021, growing 7.5% compared to 2020 and showing a greater recovery than expected at the beginning of the year.
The increase in the price of the main energy commodities had a positive impact on Canada's exports, though it generated inflationary pressure in the other sectors. Additionally, the difficulties presented in the supply chain, the strong demand for durable goods and the extreme weather in British Columbia had a direct effect on the increase in housing and food prices. With all these repercussions, inflation was 3.4% in 2021 and it is estimated it will accelerate to 5.6% in 2022.
With the main economic indicators displaying positive developments, Public Debtended2021at112.1%,withareduction compared to 2020 (117.8%).
Regarding unemployment, a strong growth in production is expected to support the increase in demand for labour and help reduce the unemployment rate to pre-pandemic levels. Having reached an unemployment rate of 9.6% in 2020, recovery is already visible in 2021 (7.4%), reaching pre-pandemic levels in 2022, with an expected unemployment rate of 5.9%.
In 2021, the Bank of Canada maintained interest rate at 0.25% to accelerate economic recovery. Nevertheless, in April 2022 the interest rate was already raised to 1.0% to fight the inflationary pressure.
PAGE 168 CHAPTER 04.
Source International Monetary Fund OECD - Economic Report December 2021 GDP growth rate in Canada Inflation rate in Canada 2,8% 2019 4,6% 2021 2022E 2020 1,9% -5,2% 2018 3,9% 2,3% 5,6% 1,9% 0,7% 2019 3,4% 2021 2022E 2020 2018 PAGE 169 CHAPTER 04.
angola
In 2021, Angolan economy reverts its recession period, with a GDP growth of 0.7%, that compares to a decline of 5.6% last year. Projections point to a GDP growth of 3.0% in 2022, reaching about 4.0% in the medium term, driven by the implementation of structural reforms planned to strengthen growth and fiscal containment, alongside with the oil price rise.
The Angolan economy, directly impacted by the evolution of oil prices in recent years, had been in recession since 2016, which translated into an increase in the public debt-to-GDP ratio from 57.1% in 2015 to a peak of 136.5% in 2020, falling to 103.7% in 2021.
In Angola, the inflation rate was 25.8% in 2021, and is expected to reach 23.9% in 2022 and 10.3% in 2023. This predicted gradual decrease is supported by the forecasted slowdown in world food inflation and the maintenance of a restrictive monetary policy by the Central Bank of Angola. This outlook translates into an increase in the leading rate and moderate growth of the currency, the latter being necessary for the Kwanza to remain stable in medium run, after a high devaluation in recent years, followed by an appreciation in 2021 and in first months of 2022.
PAGE 170 CHAPTER 04.
At the end of 2021, the IMF concluded the sixth evaluation of the extended arrangement with Angola, under the Extended Fund Programme, allowing for the disbursement of about 748 million USD, the last advance of a total of 3,213 million USD.
The authorities' prudent policies promoted the strengthening of the Angolan economy's stability and sustainability, despite the difficult economic conditions.
Benefiting from the oil price increase during 2021, and from a disciplined vision regarding the implementation of structural reforms under the entire economic panorama, Angola is now in conditions to present GDP growths, in the next few years, and to consolidate economic sustainability, not only in the oil sector, but also in the financial, agricultural and telecommunications sectors.
GDP growth rate in Angola Inflation rate in Angola
2019 19,6% 2021 2022E 22,3% 2020 17,1% 2018 25,8% 23,9% 2019 -2,0% 2021 2022E 2020 -0,7% 0,7% 2018 -5,6% 3,0% Source International Monetary Fund Banco BPI - Angola Weekly Briefing January 2022 African Development Bank PAGE 171 CHAPTER 04.
botswana
After Botswana's economy contracted by about 8.7% in 2020, in 2021 it is estimated that growth was 12.5% in 2021 and that it will grow 4.3% in 2022, based on a reactivation of domestic demand and a recovery in commodity prices as economies reopen globally.
With regard to the inflation rate, it is estimated to be 6.7% in 2021, accelerating to 8.9% in 2022 and stabilising at around 4.6% in the following years.
Growth prospects remain unstabledespite projected GDP growth above 4% from 2022 onwards - due to substantive poverty levels, unemployment, deep social inequalities and Botswana's dependence on diamond exports.
PAGE 172 CHAPTER 04.
GDP growth rate in Botswana Inflation rate in Botswana 4,2% 4,3% 2019 -8,7% 2021 2020 3,0% 2018 12,5% 2022E 3,2% 2019 1,9% 2021 6,7% 8,9% 2022E 2020 2,7% 2018 Source International Monetary Fund PAGE 173 CHAPTER 04.
namibia
After the deepest contraction in history recorded during 2020 (-8.5%), Namibia's economic performance improved in 2021, with the same recovery expected to continue in the year 2022. GDP growth was 0.9% in 2021 and is estimated to reach 2.8% in 2022. These signs of improvement are mainly due to the forecasts of recovery in primary and tertiary industries - which include financial services, tourism, agriculture and mining industries - as well as a positive outlook regarding the global economic environment. The mining sector is predicted to improve significantly as global demand from major importing markets recovers to pre-pandemic levels.
Risks concerned to domestic growth remain dominated by the impact of both Covid-19 and persistently low international prices for some of Namibia’s commodities.
The inflation rate is anticipated to be 3.6% and 5.5% in 2021 and 2022 respectively, with expected increases in housing, utilities, public services and food prices, together with a steady depreciation of the Namibian dollar which, during 2021, fell by 8.1% against the US dollar.
PAGE 174 CHAPTER 04.
Source International Monetary Fund African Development Bank GDP growth rate in Namibia Inflation rate in Namibia 1,1% 2019 -8,5% 2021 2022E 2020 -0,9% 2,8% 2018 4,3% 5,5% 2019 2,2% 2021 3,6% 2022E 2020 3,7% 2018 0,9% PAGE 175 CHAPTER 04.
mozambique
In 2021, Mozambique returns to the growth course with an increase of 2.2% in GDP. The onset of the Covid-19 pandemic caused a sudden interruption in Mozambique's good economic performance in the last few years. Real GDP contracted by about 1.2% in 2020: the first drop in 28 years, after growing by 2.3% in 2019. The slowdown in the construction, tourism and transport sectors, as well as a sharp decline in export demand, were the main drivers of the market downturn. Economic activity was also hampered by the conflict in the northern province of Cabo Delgado. Thus, growth prospects are more positive in the medium term, with GDP growth of 3.8% in 2022, at which point it is expected to surpass the pre-pandemic level, encouraged by the gas investments.
Despite the negative growth in 2020, inflation increased slightly, from 2.8% in 2019 to 3.1% in 2020, driven by a 19.7% depreciation of the metical against the US dollar. Thus, inflation is expected to have achieved 5.7% in 2021 and get to 8.5% in 2022, spurred by domestic demand during the economic recovery and by the increase in energetic and food goods.
Although the perspectives are promising for the gas sector in Mozambique, the main risks highlighted for a recovery in Mozambique are the climate shocks, the reduced prices of some Mozambican commodities and the military disturbances in the north and centre of the county.
PAGE 176 CHAPTER 04.
Source International Monetary Fund African Development Bank BPI - Monthly Information February 2022
growth rate in Mozambique Inflation rate in Mozambique 3,4% 2019 2021 2,2% 3,8% 2022E 2020 2,3% 2018 -1,2% 3,9% 2019 3,1% 5,7% 8,5% 2021 2022E 2020 2,8% 2018 PAGE 177 CHAPTER 04.
GDP
usa
After the sharp fall in GDP in 2020 (-3.4%), the year 2021 was marked by economic recovery, with GDP standing at 5.7%, with a slight deceleration expected for the following years: 3.7% in 2022 and 2.3% in 2023. Supply interruptions will gradually decrease, facilitating the recovery of companies' inventories and stronger consumption growth, in the short term.
The recovery of the labour market continues to progress, although the unemployment rate in 2021 (5.4%) is still above pre-pandemic levels (3.7% in 2019).
As the labour market continues to recover, nominal wage growth will increase even further, along with purchasing power.
While price inflation is anticipated to be moderate in some sectors - as supply disruptions decline - higher wages, together with recent increases in property rents and shipping rates, will lead to a stronger consumer price growth when comparing to pre-pandemic periods. The inflation rate has settled at 4.7%, reaching a whopping 7.7% expected in 2022.
The pandemic-related fiscal measures announced in 2020 and early 2021 have largely expired. Still, supplemental unemployment assistance payments and expanded benefit coverage have resulted in accumulated savings that will continue to support the recovery of the US economy.
PAGE 178 CHAPTER 04.
Source International Monetary Fund OECD - Economic Report December 2021 GDP growth rate in USA Inflation rate in USA 2,4% 1,8% 7,7% 2019 1,2% 2021 4,7% 2022E 2020 2018 2019 2021 3,7% 2022E 2020 2018 -3,4% 2,9% 2,3% 5,7% PAGE 179 CHAPTER 04.
turkey
In 2021, the Turkish economy recorded GDP growth of around 11.0%, a positive development compared to the 1.8% growth recorded in 2020, with this growth rate expected to fall to 2.7% in 2022 and stabilizing close to 3.3% in the following years. Growth has been dynamic and driven by very significant exports. Manufacturers took advantage of the opportunities that arose in their traditional European markets and in new foreign markets, after interruptions in the international value chains.
With regard to price evolution, inflation will have reached 19.6% by 2021, with the Turkish Lira depreciating 67.2% against the Euro. The evolution of monetary policy and the developments related to the exchange rate are difficult to predict in the current environment: however, it is estimated that inflation will remain at a high level, 60.5% in 2022, devaluating the Turkish currency, reducing purchase power and hampering growth in 2022.
PAGE 180 CHAPTER 04.
Source International Monetary Fund OECD - Economic Report December 2021 GDP growth rate in Turkey Inflation rate in Turkey 3,0% 2019 2021 11,0% 2022E 2020 0,9% 2018 19,6% 16,3% 2019 12,3% 60,5% 2021 2022E 2020 15,2% 2018 1,8% 2,7% PAGE 181 CHAPTER 04.
austria
The Austrian economy is among the most affected by Covid-19 in Europe, becoming one of the countries with the largest GDP decline in 2020. The vital importance of the tourism sector, heavily affected by restrictions on mobility, largely explains this substantial drop. Looking ahead to 2021, GDP is expected to grow by 4.5%, settling below the European average, partly due to the low vaccination rate against Covid-19.
In 2021, the economic recovery is driven by private consumption and a considerable increase in investment, particularly in equipment. Economic expansion is expected to accelerate in 2022 and continue in 2023, reaching GDP growth of 2.6% in 2022 and 3.0% in 2023.
The inflation rate was 1.4% in 2020 and is estimated to close 2021 at 2.8%, before jumping to 5.6% in 2022.
PAGE 182 CHAPTER 04.
Source International Monetary Fund OECD - Economic Report December 2021 GDP growth rate in Austria Inflation rate in Austria 2,5% 2019 4,5% 2021 2022E 2020 1,5% -6,7% 2018 2,6% 2,1% 1,5% 1,4% 2019 2,8% 2021 2022E 2020 2018 5,6% PAGE 183 CHAPTER 04.
hungary
The Hungarian economy continued to grow robustly, with GDP recovering to pre-pandemic levels in the second quarter of 2021, despite temporary restrictions on certain services aimed at containing the pandemic. Annual GDP grew significantly to 7.1% in 2021, following a 4.7% contraction in 2020. The positive evolution of the economy is expected to remain strong in 2022 (3.7%), driven by continued fiscal stimulus.
The unemployment rate remains at low levels, reaching 4.1% in 2021. Job creation should continue as the economy grows and is estimated to stabilise at 4.0% in the coming years.
In 2021 inflation was 5.1%, accelerating to 10.3% in 2022, before a downward trend in the coming years (6.4% in 2023 and 4.0% in 2024).
romania
After a GDP decline of 3.7% in 2020, the Romanian economy has triggered a strong recovery, mainly driven by domestic demand, achieving the pre-pandemic levels in the first half of 2021. Growth is expected to remain robust, at around 5.9%, with domestic consumption and investments supported by the European Union's Recovery and Resilience Mechanism as the main protagonists of this scenario.
Inflation increased, largely due to the sharp rise in gas, energy and oil prices, but also due to higher food prices. Annual inflation is expected to reach 5.0% in 2021, peaking at 9.3% in 2022 and dropping to 4.0% in 2023.
Unemployment - despite the uncertainties arising from potential new waves of Covid-19 infection and the war in the neighbouring Ukraine - is expected to be near 5% in the coming years.
Source
International Monetary Fund OECD - Economic Report December 2021
Source
International Monetary Fund OECD - Economic Report December 2021
PAGE 184 CHAPTER 04.
czech republic
After a sharp contraction of -5.8% in 2020, GDP in Czech Republic is expected to grow by 3.3% and 2.3% in 2021 and 2022, respectively. The reduction of most of the containment measures, as well as the steady evolution of the vaccination process, will translate into a strong recovery in services, boosting household consumption. Meanwhile, exports and manufacturing activity will face challenging times until mid-2022, considering the supply shortages in these sectors.
Currently, inflation reached 3.8% in 2021 and is expected to scale up to 9.0% in 2022, heading towards the 2% target by the end of 2023.
This scenario is due to rising energy prices, supply-side bottlenecks and robust demand.
The unemployment rate is expected to increase only slightly this year, to 2.8%. Economic growth is expected to improve working conditions in the coming years, with the unemployment rate declining to 2.5% in 2022 and to 2.3% in 2023, close to the minimum achieved in 2019 (2.0%).
Source International Monetary Fund OECD - Economic Report December 2021
PAGE 185 CHAPTER 04.
croatia
In the Croatian market, there was a 10.4% growth in GDP in 2021, enhanced by strong private consumption and a better than expected performance in the tourism sector. The economy is expected to slow down in 2022 to 2.7%, accelerating to 4.0% in 2023. Consequently, GDP volume achieve its pre-pandemic level still in 2021.
Inflation is expected to accelerate, reaching 2.6% in 2021 and 5.9% in 2022, followed by a gradual stabilisation.
mexico
Among Latin American countries, Mexico is one of the most affected by the Covid-19 pandemic. The economy is estimated to expand 2.0% in 2022 and 2.5% in 2023, after growing 4.8% in 2021, with consumption standing out as the main driver of growth. The Mexican economy remains highly dependent on the US, its largest trading partner and the destination of 80% of its exports.
Rising energy and food prices were the main contributors to this increase, triggered by global factors.
After reaching 9.0% in 2020, the unemployment rate decreased to 8.2% in 2021.
Moreover, in 2021, the general government deficit as a % of GDP fell from 87,3% in 2020 to 80,9%, largely thanks to the strong economic recovery and the phasing out of incentives.
Source International Monetary Fund OECD - Economic Report December 2021
Public indebtedness reduced to 57.6% of GDP in 2021, comparing to 60.3% in 2020, and allowing for stabilization of the public debt as a percentage of GDP below 60%.
An inflation rate of 5.7% is forecasted for 2021, moving to 6.8% and 3.9% in 2022 and 2023, respectively.
Source International Monetary Fund OECD - Economic Report December 2021
PAGE 186 CHAPTER 04.
slovakia
The intensification of supply chain disruptions and the resurgence of Covid-19 infections had a significant impact on Slovak economic activity, hampering annual GDP growth to 3.0% in 2021. Slovakia is expected to reach its pre-pandemic production level by early 2022 and will continue to expand at a rate of 2.6% in 2022 and 5.0% in 2023, mainly due to strong investment growth, aided by the Recovery and Resilience Mechanism and EU structural funds.
Strong price dynamics are expected to persist in 2021, leading to an inflation rate of 2.8%. As energy prices soar and constraints in the supply chain are still expected, prices are expected to rise in 2022 by 8.4%.
Unemployment rate will ascend to 6.8% in 2021, slightly above the one registered in 2020 (6.7%).
The general government debt is forecast to increase from 59.7% in 2020 to 60.4% of GDP in 2021, driven by temporary pandemic-related support measures, including short-term work schemes, health expenditure and support for specific sectors.
Source International Monetary Fund OECD - Economic Report December 2021
PAGE 187 CHAPTER 04.
4.2. economic performance
our results
an overview on our performance
turnover
After witnessing, in 2020, an economic context highly impacted by the pandemic, we were able, in 2021, to take full advantage of the recovery in our markets and sectors, achieving a global growth of 30.0%, compared to 2020.
Thus, 2021 was an extremely successful year for Nors , with the consolidated turnover reaching 1,016 million Euros: an all-time record achieved by the Group, which is a clear reflection of the growth strategy initiated over the last few years.
Although all geographies have registered a positive evolution, we highlight the extraordinary growth registered in the Brazilian and Canadian markets, with an evolutionof42.1%and61.3%,respectively.
A full year for the Canadian Strongco, acquired by the Group in March 2020, as well as an environment of strong demand in all geographies - fuelled by the reduction in restrictions arising from the pandemic - and the global appreciation of raw materials contributed particularly to the achievement of these results.

Exchange rate variations favourable to the business also contributed to this global scenario, especially in the second half of the year, in Angola and Canada.
In this sense, despite the constraints in our supply chain, limiting the amount of product available in our markets, we found that most operations managed to ensure a diligent response to strong demand, both in the commercial area and in the after-sales segment, mirroring our flexibility and high level of commitment to our customers.
4.2.1. global economic performance
CHAPTER 04. PAGE 190
In 2012, joint ventures stopped being consolidated using the proportional method and began using the equity method. However, for the purpose of this analysis, all values are adjusted to the equity method.

2011 2012 2013 2014 2015 2016 2017 2018 2019 2020 2021 808 563 551 619 644 783 1 016 844 841 947 781 consolidated turnover (millions of Euros)
CHAPTER 04. PAGE 191
The breakdown of turnover by geography and business area is as follows:

thousands of Euros sales 2021 607 091 105 348 64 372 73 400 108 249 199 354 24 563 338 903 55 302 14 712 4 727 2 052 30 615 3 196 14 520 205 1 016 021 % total sales 59,8% 33,4% 5,4% 1,4% 0,0% sales 2020 498 367 91 691 42 029 84 115 82 915 136 309 40 053 207 436 60 642 17 442 4 057 8 835 26 961 3 346 14 243 618 781 305 % total sales 63,8% 26,5% 7,8% 1,8% 0,1% NORS MOBILITY AS Portugal Galius AS Automóveis AS Centro Oeste AS São Paulo 17 395 4 950 11 389 3 280 7 660 6 143 AS Botswana AS Namibia AS Moçambique AS Angola 1 801 443 KinLai NORS OFF-ROAD 291 098 180 484 Strongco 20 497 11 617 AgroNew 27 308 15 335 Auto Maquinaria
AFTERMARKET Civiparts Portugal Civiparts Angola Civiparts Espanha OneDrive Portugal OneDrive Angola NORS VENTURES 12 254 12 068 Sotkon 1 297 1 090 Amplitude 970 1 085 Vitrum others total % total sales 35% 30% 23% 8% 2% 1% 0% 1% PAGE 192 CHAPTER 04.
NORS

AgroNew Auto NORS AFTERMARKET Civiparts Civiparts Civiparts OneDrive OneDrive NORS VENTURES Sotkon Amplitude Vitrum others total thousands of Euros sales 2021 % total sales Portugal 302 202 30% Brazil 328 099 32% Canada 291 098 29% Namibia 17 395 2% Botswana 7 660 1% total 1 016 021 sales 2020 % total sales 276 012 35% 230 841 30% 180 484 23% Angola 62 566 6% 64 322 8% 11 389 2% 6 143 1% 781 305 Mozambique 4 950 0% Spain 2 052 0% 3 280 0% 8 835 1% PAGE 193 CHAPTER 04.
gross margin
Along with the strong growth in turnover, we also saw a clear improvement in our gross margin, which grew from 129.9 million Euros in 2020 to 173.1 million Euros in 2021 (+33.3%), supported, above all, by the excellent performance of the companies operating in the Brazilian and Canadian markets, with these geographies showing growth in their gross margins of 13.2 million Euros (+41.7%) and 16.3 million Euros (+49.7%), respectively.
In 2021, the profitability of the gross margin amounted to 17.1% of turnover, compared to the 16.8% achieved in 2020, which translates into a growth of 0.3 p.p.
ebitda
In 2021, EBITDA reached 106.1 million Euros, the highest EBITDA reached in the more than 88 years of the Nors Group's history. This corresponds to an increase of 37.5 million Euros (+54.6%) compared to the one reached in 2020. In addition to the increase of 3.3 million Euros (+34.6%) achieved by Portugal, we highlight the Brazilian and Canadian markets, which showed significant increases in EBITDA, of 12.8 million Euros (+71.1%) and 12.1 million Euros (+44.6%) compared to 2020, respectively.
Despite the significant increase in activity, the structure was able to keep frugal in 2021, which allowed for significant gains in scale. This contributed to a double-digit EBITDA margin in 2021, at 10.4%, up from 8.8% in 2020.
Along with EBITDA’s evolution, it is also important to highlight its breakdown by origin.
breakdown of ebitda by main contributors Portugal 16% Namibia 1% Botswana 1% Angola 10% Ascendum EM 20% Others 0% Canada 34% Brazil 29% Holding -9% Mozambique 0% Spain -2% CHAPTER 04. PAGE 194
net income
In addition to the positive evolution of activity and EBITDA profitability, in 2021 we also registered a decrease in the financial expenses of 1.6 million Euros, as well as a positive exchange rate impact of 3.4 million Euros, compared to the loss of 0.5 million Euros recorded in 2020.
We effectively managed the foreign exchange impacts from Angola, caused by exposure to the exchange rate risk of the Kwanza and the United States Dollar. The former was mitigated by effective management of liquid monetary assets in Kwanza, which were always kept at low levels. The second was managed through a natural hedging strategy, achieved by the creation of financial liabilities denominated in US dollars on the Portuguese market. Overall, these measures translated into gains in exchange rate differences.
Thus, the Group ended the year 2021 with an impressive net income of 45.6 million Euros, which represents an increase of 30.7 million Euros (+206.0%) over the previous year, and reaching 4.5% of turnover, more than doubling the margin obtained in 2020, of 1.9%.
assets
Our consolidated assets remained controlled at 785.4 million Euros, which, compared to the value recorded at the end of 2020, corresponds to an increase of 52.6 million Euros (+7.2%). Thus, there is a clear stabilization of net assets, after a significant increase observed in 2020, resulting from the impact of the Strongco acquisition (+173.8 million Euros), which allowed us to achieve remarkable gains of scale, arising from the careful management of inventory levels and credit granted to customers.
CHAPTER 04. PAGE 195
capital employed
We continue to closely monitor the allocation of resources to existing businesses in the various geographies. Thus, this effort translated into the building of an investment policy focused only on assets necessary to the activity of operations, as was the case of the real estate investment in Burlington, Canada, which totalled an investment of c. 7.2 million Euros.
We also highlight the reduction in working capital needs by about 51.3%, supported mainly by the cautious management of the balances of customers and suppliers. This decrease represents a reduction of 46.0 million Euros in capital employed which, associated with the significant increase of 30.0% in activity, demonstrates the success of working capital management in 2021. Therefore, the working capital needs in days of sales reduced significantly, from 42 days in 2020 to 16 days in 2021.
net debt and financial activity
We closed the year 2021 with a Net Debt (including Lease Liabilities) of 167.2 million Euros, representing a decrease of 28.7% (or 67.4 million Euros) compared to the end of 2020.
Regarding Financial Net Debt (Financing obtained - cash and bank deposits - available for sale investments - debt instruments at amortized cost), Nors ended 2021 with 80.5 million Euros, which compares to 148.1 million Euros in 2020 and 72.1 million Euros in 2019. This trend demonstrates our commitment to focus on a solid balance sheet, managing, in just one year, to reduce Financial Net Debt to levels close to the period preceding the Strongco acquisition.
Thus, we remain committed to strengthening our financial position so that we can evaluate and take advantage of new investment opportunities.
CHAPTER 04. PAGE 196
net debt through leases and financial activity net losses
net debt (through leases) financial activity net losses
In 2012, joint ventures stopped being consolidated using the proportional method and began using the equity method. However, for the purpose of this analysis, all values are adjusted to the equity method.
Reflecting the lower need of financial debt due to the good results achieved in 2021, interest expenses show an effective decrease of 1.6 million Euros (-11.8%).
As shown, the combination resulting from the increase in EBITDA and the decrease in net debt with leases generated an improvement in the net debt/EBITDA ratio, demonstrating the sustainability of debt in relation to the activity generated.
19.1 23.8 20.4 21.1 19.5 15.1 10.8 9.0 10.2 2011 2012 2013 2014 2015 2016 2017 2018 2019 187.5 207.0 160.1 117.5 114.8 126.3 164.6 196.0 215.8 13.8 2020 234.6 12.1 2021 167.2
CHAPTER 04. PAGE 197
financial autonomy
Net equity grew from 184.6 to 240.1 million Euros, corresponding to an increase of about 30.1%, consisting essentially of the positive impact of the Nors ’ net income. This, combined with the growth of only 7.2% in assets resulted in a financial autonomy of 30.6%, a significant improvement compared to the 25.2% registered in 2020, impacted by the acquisition of Strongco, in March of that same year.
net debt (through leasing)/ebitda
autonomy
28% 28% 28% 32% 34% 34% 35% 33% 25% 2012 2013 2014 2015 2016 2017 2018 2019 2020 2021 31% 32% 2011
2011 2012 2013 2014 2015 2016 2017 2018 2019 3.2 9.0 3.9 2.2 2.6 2.2 2.7 3.8 2.8 2020 3.4 2021 1.6
financial
In 2012, joint ventures stopped being consolidated using the proportional method and began using the equity method. However, for the purpose of this analysis, all values are adjusted to the equity method.
CHAPTER 04. PAGE 198
In 2012, joint ventures stopped being consolidated using the proportional method and began using the equity method. However, for the purpose of this analysis, all values are adjusted to the equity method.
As for the profitability ratios, the ROE more than doubled from 9.5% to 24.9%, explained by the 206.0% increase in net income, which was greater than the 18.0% increase in shareholder investment, measured by the increase in net equity excluding net income.
Moreover, also in 2021, the ROI showed a noticeable growth compared to 2020: from 8.9% to 16.3%. The 78.0% increase in operating income and the 2.8% decrease in total capital invested contributed to this performance.
In 2012, joint ventures stopped being consolidated using the proportional method and began using the equity method. However, for the purpose of this analysis, all values are adjusted to the equity method.
25% 2012 2013 2014 2015 2016 2017 2018 2019 2020 2021 2011 roie roe ROI ROE 2015 2016 2017 2018 2019 -8.5% 6% 11.1% 10.7% 14% 3.6% 8.9% 14.4% 10.8% 12% 2020 9.5% 8.9% 2021 25.1% 16.5% roi e roe
CHAPTER 04. PAGE 199
consolidated performance
thousands of Euros 2021 turnover¹ 1 016 021 ebitda² 106 109 %turnover 10,4% Amortisation and Depreciation -39 060 ebit 66 475 %turnover 6,5% Net foreign exchange differences 3 436 Financial activity result³ -12 128 income before taxes 57 782 %turnover 5,7% net income 45 550 %turnover 4,5% 2020 781 305 68 615 8,8% -31 269 Impairments of depreciable investments -575 0 37 347 4,8% -504 -13 751 23 092 3,0% 14 885 1,9% ¹ Sales + services rendered + own works ² Earnings Before Interest, Taxes, Depreciation and Amortisation ³ Revenue and charges associated to financing CHAPTER 04. PAGE 200
property performance
thousands of Euros with non-controlled interests 2021 assets 785 363 Non-current assets 385 751 Inventories 228 918 Customers 68 968 Other current assets 35 051 Cash and cash equivalents 66 675 liabilities 545 237 Loans obtained 156 493 Provisions 8 067 Suppliers 167 251 Other liabilities 213 426 equity 240 126 Capital 30 000 Global reserves 152 711 Net income 45 565 Non-controlled interests 11 851 financial autonomy 30,6% 2020 732 748 352 915 230 443 63 300 35 985 50 105 548 154 208 200 10 507 154 164 175 282 184 594 30 000 124 778 14 745 15 071 25,2%
CHAPTER 04. PAGE 201
2021 in each of our businesses

4.2.2.
CHAPTER 04. PAGE 202
economic performance by business unit
4.2.2.1. NORS MOBILITY
In Portugal, despite the restrictions in supply resulting from the difficulties in production, caused by the shortage of semiconductors, in 2021, the heavy-duty truck market expanded by 21.8% and the light vehicle market did not decline. However, throughout the year, there were some postponing of deliveries to 2022 of some deals carried closed within 2021. Also in 2021, Nors began implementing the Core Project in Auto Sueco Portugal, Galius and Auto Sueco Automóveis, aiming to increase efficiency, integration and connectivity with internal and external stakeholders, to leverage our future growth and profitability, using modern, agile and flexible process digitization layers.
In Brazil, 2021 marked the end of the pandemic restrictions, with a considerable increase in the markets of São Paulo and Centro Oeste, translating into the largest combined market since the Group entered Brazil.
Thus, although there was a relative maintenance in market share, it resulted in a considerable increase in turnover, EBITDA and margins for Auto Sueco São Paulo and Auto Sueco Centro Oeste.
In Angola, 2021 meant the end of the recessionary cycle that dragged since 2015 and the beginning of a new cycle of economic growth (+0.7% GDP).
In the same sense, the heavy-duty truck market grew (+62.8%), as did our combined market share (Auto Sueco Angola and KinLai), which rose from 32.6% to around half of the total market.
Nevertheless, sales volume fell 34.9%, but this was offset by the excellent growth in EBITDA (+107.9%), results which were greatly influenced by the accounting recognition in the two years of the deliveries of buses linked to the BRT project in Luanda.
In Mozambique, Namibia and Botswana, the year 2021 marks another important milestone in an upward course, resulting in an extremely positive performance. All three markets directly contributed to this achievement, with special mention to the 945.8% EBITDA growth obtained by Auto Sueco Namibia, adding the EBITDA growth of Auto Sueco Botswana (157.6%) and Auto Sueco Moçambique (348.4%).
NORS MOBILITY Trucks Buses Cars 4 472 230 1 761 6 172 164 1 518 4 322 215 2 293 2020 2021 2018 2019 5 283 215 2 295 280 036 41 085 60 256 408 975 18 170 51 415 411 591 14 454 70 998 2020 2021 2019 2018 308 624 15 006 63 806 units amount in thousands EUR Not all business unit activities are considered PAGE 203 CHAPTER 04.
in thousands EUR sales 2021 var. AS Portugal 105 348 14,9% AS Automóveis 73 400 -12,7% Galius 64 372 53,2% AS São Paulo 199 354 46,3% AS Centro Oeste 108 249 30,6% AS Angola 24 563 -38,7% total 607 091 ebitda 2021 var. AS Portugal 9 452 17,4% AS Automóveis 601 -54,9% Galius 1 147 3 712,2% AS São Paulo 16 143 90,9% AS Centro Oeste 12 279 40,1% AS Angola 2 930 85,0% total 45 066 2020 91 691 84 115 42 029 136 309 82 915 40 053 AS Namíbia 17 395 52,7% AS Moçambique 4 950 50,9% AS Botswana 7 660 24,7% 6 143 11 389 3 280 KinLai 1 801 306,9% 443 498 367 2020 8 053 1 331 -32 8 455 8 764 1 584 AS Namíbia 1 294 945,8% AS Moçambique 320 348,4% AS Botswana 782 157,6% 304 124 71 KinLai 117 198,7% -119 28 537 PAGE 204 CHAPTER 04.
Auto Sueco Portugal
Auto Sueco Portugal, core company to Nors Group, is the exclusive distributor of Volvo trucks, Volvo buses and Volvo Penta marine and industrial engines for Portugal. Auto Sueco Portugal is also the exclusive distributor of Kohler-SDMO generator sets for Portugal.
Despite the impacts generated by the supply restrictions of semiconductors and the reduction in market share in heavy-duty trucks (over 16 tons) from 17.2% to 14.2%, Auto Sueco Portugal recorded an increase in sales of 14.9%.
In terms of EBITDA, Auto Sueco Portugal grew 17.4%, a positive evolution based not only on the cautious management of costs but also on the profitability improvement, with growth in the margin in the commercial area as well as in the after sales segment.
The year 2021 consolidated the results of the projects implemented in previous years, in terms of customer segmentation and commercial follow-up model, which built close trust in the relationships with its customers. On the other hand, 2021 was also the launch of the Core project, which marks the kick-off of the transformation of the business relationship models to a more modern and convergent, together with the different stakeholders that are part of the operation.
Auto Sueco Portugal
Volvo Trucks medium-duty trucks year mshare market 2020 9,5% 148 2021 7,0% 142 2017 7,3% 220 2018 4,6% 302 2019 5,8% 225 heavy-duty trucks year mshare market 2020 17,2% 3 026 2021 14,2% 3 685 2017 13,6% 4 534 2018 14,3% 4 307 2019 14,2% 4 410
PAGE 205 CHAPTER 04.
Auto Sueco Angola
Auto Sueco Angola distributes Volvo trucks, buses and cars throughout Angola and is also the representative of the Kohler-SDMO gensets units in this country. Considering the aforementioned context of the Angolan market and as demonstrated when analysing the indicators, the general results were positive.
The heavy-duty truck market (over 16 tons) recorded a 62.8% increase over the previous year, going from 86 vehicles in 2020 to 140 in 2021. Nonetheless, Auto Sueco Angola was able to achieve slight growth in market share (27.9% in 2021 compared to 25.6% in 2020). Despite the drop in sales volume, which results from the impact of the large bus business (with the delivery of 110 units in 2020 and 42 in 2021), Auto Sueco Angola managed to almost double EBITDA in absolute terms.
year mshare market 2020 2017 2018 2019 25,6% 47,1% 36,3% 31,7% 86 2021 27,9% 140 110 168 123 year mshare market 2020 2017 2018 2019 4,0% 0,1% 0,8% 3,2% 1 263 2021 1,9% 2 259 2 879 1 698 2 057 heavy-duty trucks cars PAGE 206 CHAPTER 04.
Auto Sueco Botswana, Auto Sueco Namíbia e Auto Sueco Moçambique
Auto Sueco Botswana is the exclusive representative of Volvo trucks and buses and of the Renault Trucks brand of trucks for that country. Auto Sueco Namibia has the exclusive representation of Volvo trucks and buses and the Renault Trucks and UD Trucks brands of trucks in the Namibian market. Auto Sueco Moçambique is engaged in distributing Volvo trucks and buses and SDLG construction equipment.
Analysing the three operations, only Auto Sueco Moçambique presented an increase in market share in the heavy-duty truck market (over 16 tonnes): 66.7% in 2021 against 52.0% in 2020. Auto Sueco Botswana saw a decrease in market share from 25.1% to 19.3% and in Namibia the decrease in market share was 7.6 p.p. (26.9% in 2021 against 34.5% in 2020).
Nevertheless, Auto Sueco Botswana registered a sales growth of 24.7%, supported both by the commercial activity and after sales, a segment in which it performed at a very high level. In this context, the structure remained light and agile, which caused EBITDA to increase 1.6 times in 2021.
At the same time, Auto Sueco Namibia lost its dominant market position, ending up in second position; even so, it benefited from the 67.0% growth in the heavy-duty truck market. Thus, it recorded a 52.7% growth in sales and, even more remarkable, a 10 times growth in EBITDA.
Auto Sueco Moçambique substantially strengthened the position of the Volvo brand, maintaining its dominant position in the market in a scenario of slight contraction (-2.0%) of the heavy-duty truck market (over 16 tonnes) compared to 2020, almost dominating the full market in the country, with a 66.7% share. Thus, sales grew 50.9% and EBITDA grew 3.5 times.
year mshare market 2020 2017 2018 2019 25,1% 13,4% 16,2% 28,2% 171 2021 19,1% 270 276 222 301 Auto Sueco Botswana Volvo Trucks heavy-duty trucks year mshare market 2020 2017 2018 2019 32,2% 22,0% 16,8% 21,9% 270 2021 25,3% 451 259 286 347 Auto Sueco Namíbia Volvo Trucks heavy-duty trucks year mshare market 2020 52,0% 98 2021 66,7% 96 Auto Sueco Moçambique Volvo Trucks heavy-duty trucks
CHAPTER 04. PAGE 207
Auto Sueco Centro Oeste e Auto Sueco São Paulo
Auto Sueco São Paulo and Auto Sueco Centro Oeste are Volvo truck and bus dealers in Brazil. The first, in the state of São Paulo and the second in the states of Mato Grosso, Rondônia and Acre.
The combined market in Brazil - MHDVs and HDVs, medium and heavy-duty trucksgrew 48.3% to 99,069 units. This trend was also seen in the states where Auto Sueco São Paulo and Auto Sueco Centro Oeste operate, with the heavy-duty market growing by 48.8% and 34.3% respectively, reaching 9,281 in São Paulo and 3,734 in Centro Oeste, which represents the largest combined market since Nors began operating in the Brazilian market.
From 2020 to 2021, Auto Sueco São Paulo slightly decreased its heavy-duty market share (22.0% in 2020 and 21.1% in 2021) and increased from 7.9% to 10.1% in the medium-duty segment. At the same time, Auto Sueco Centro Oeste managed to capture a further 3.3 p.p. in its share of the medium-duty market, increasing from 10.5% to 13.8%, however, in the opposite direction, its share of the heavy-duty market decreased from 29.1% in 2020 to 27.7% in 2021.
Auto Sueco São Paulo stands out, almost doubling its EBITDA, in absolute terms, in the year, while Auto Sueco Centro Oeste increased by 40.1%.
year mshare market 2020 2017 2018 2019 7,9% 3,0% 6,5% 6,3% 3 750 2021 10,1% 5 045 2 300 3 164 4 526 year mshare market 2020 2017 2018 2019 22,0% 25,0% 22,3% 22,4% 6 236 2021 21,1% 9 281 3 003 5 415 7 189
Volvo Trucks medium-duty trucks heavy-duty trucks year mshare market 2020 2017 2018 2019 10,5% 7,2% 10,2% 11,2% 636 2021 13,8% 1 137 414 713 687 year mshare market 2020 2017 2018 2019 29,1% 24,7% 25,6% 25,5% 2 781 2021 27,7% 3 734 1 199 2 195 3 810 Auto
Volvo Trucks medium-duty trucks heavy-duty trucks PAGE 208 CHAPTER 04.
Auto
Sueco São Paulo
Sueco Centro Oeste
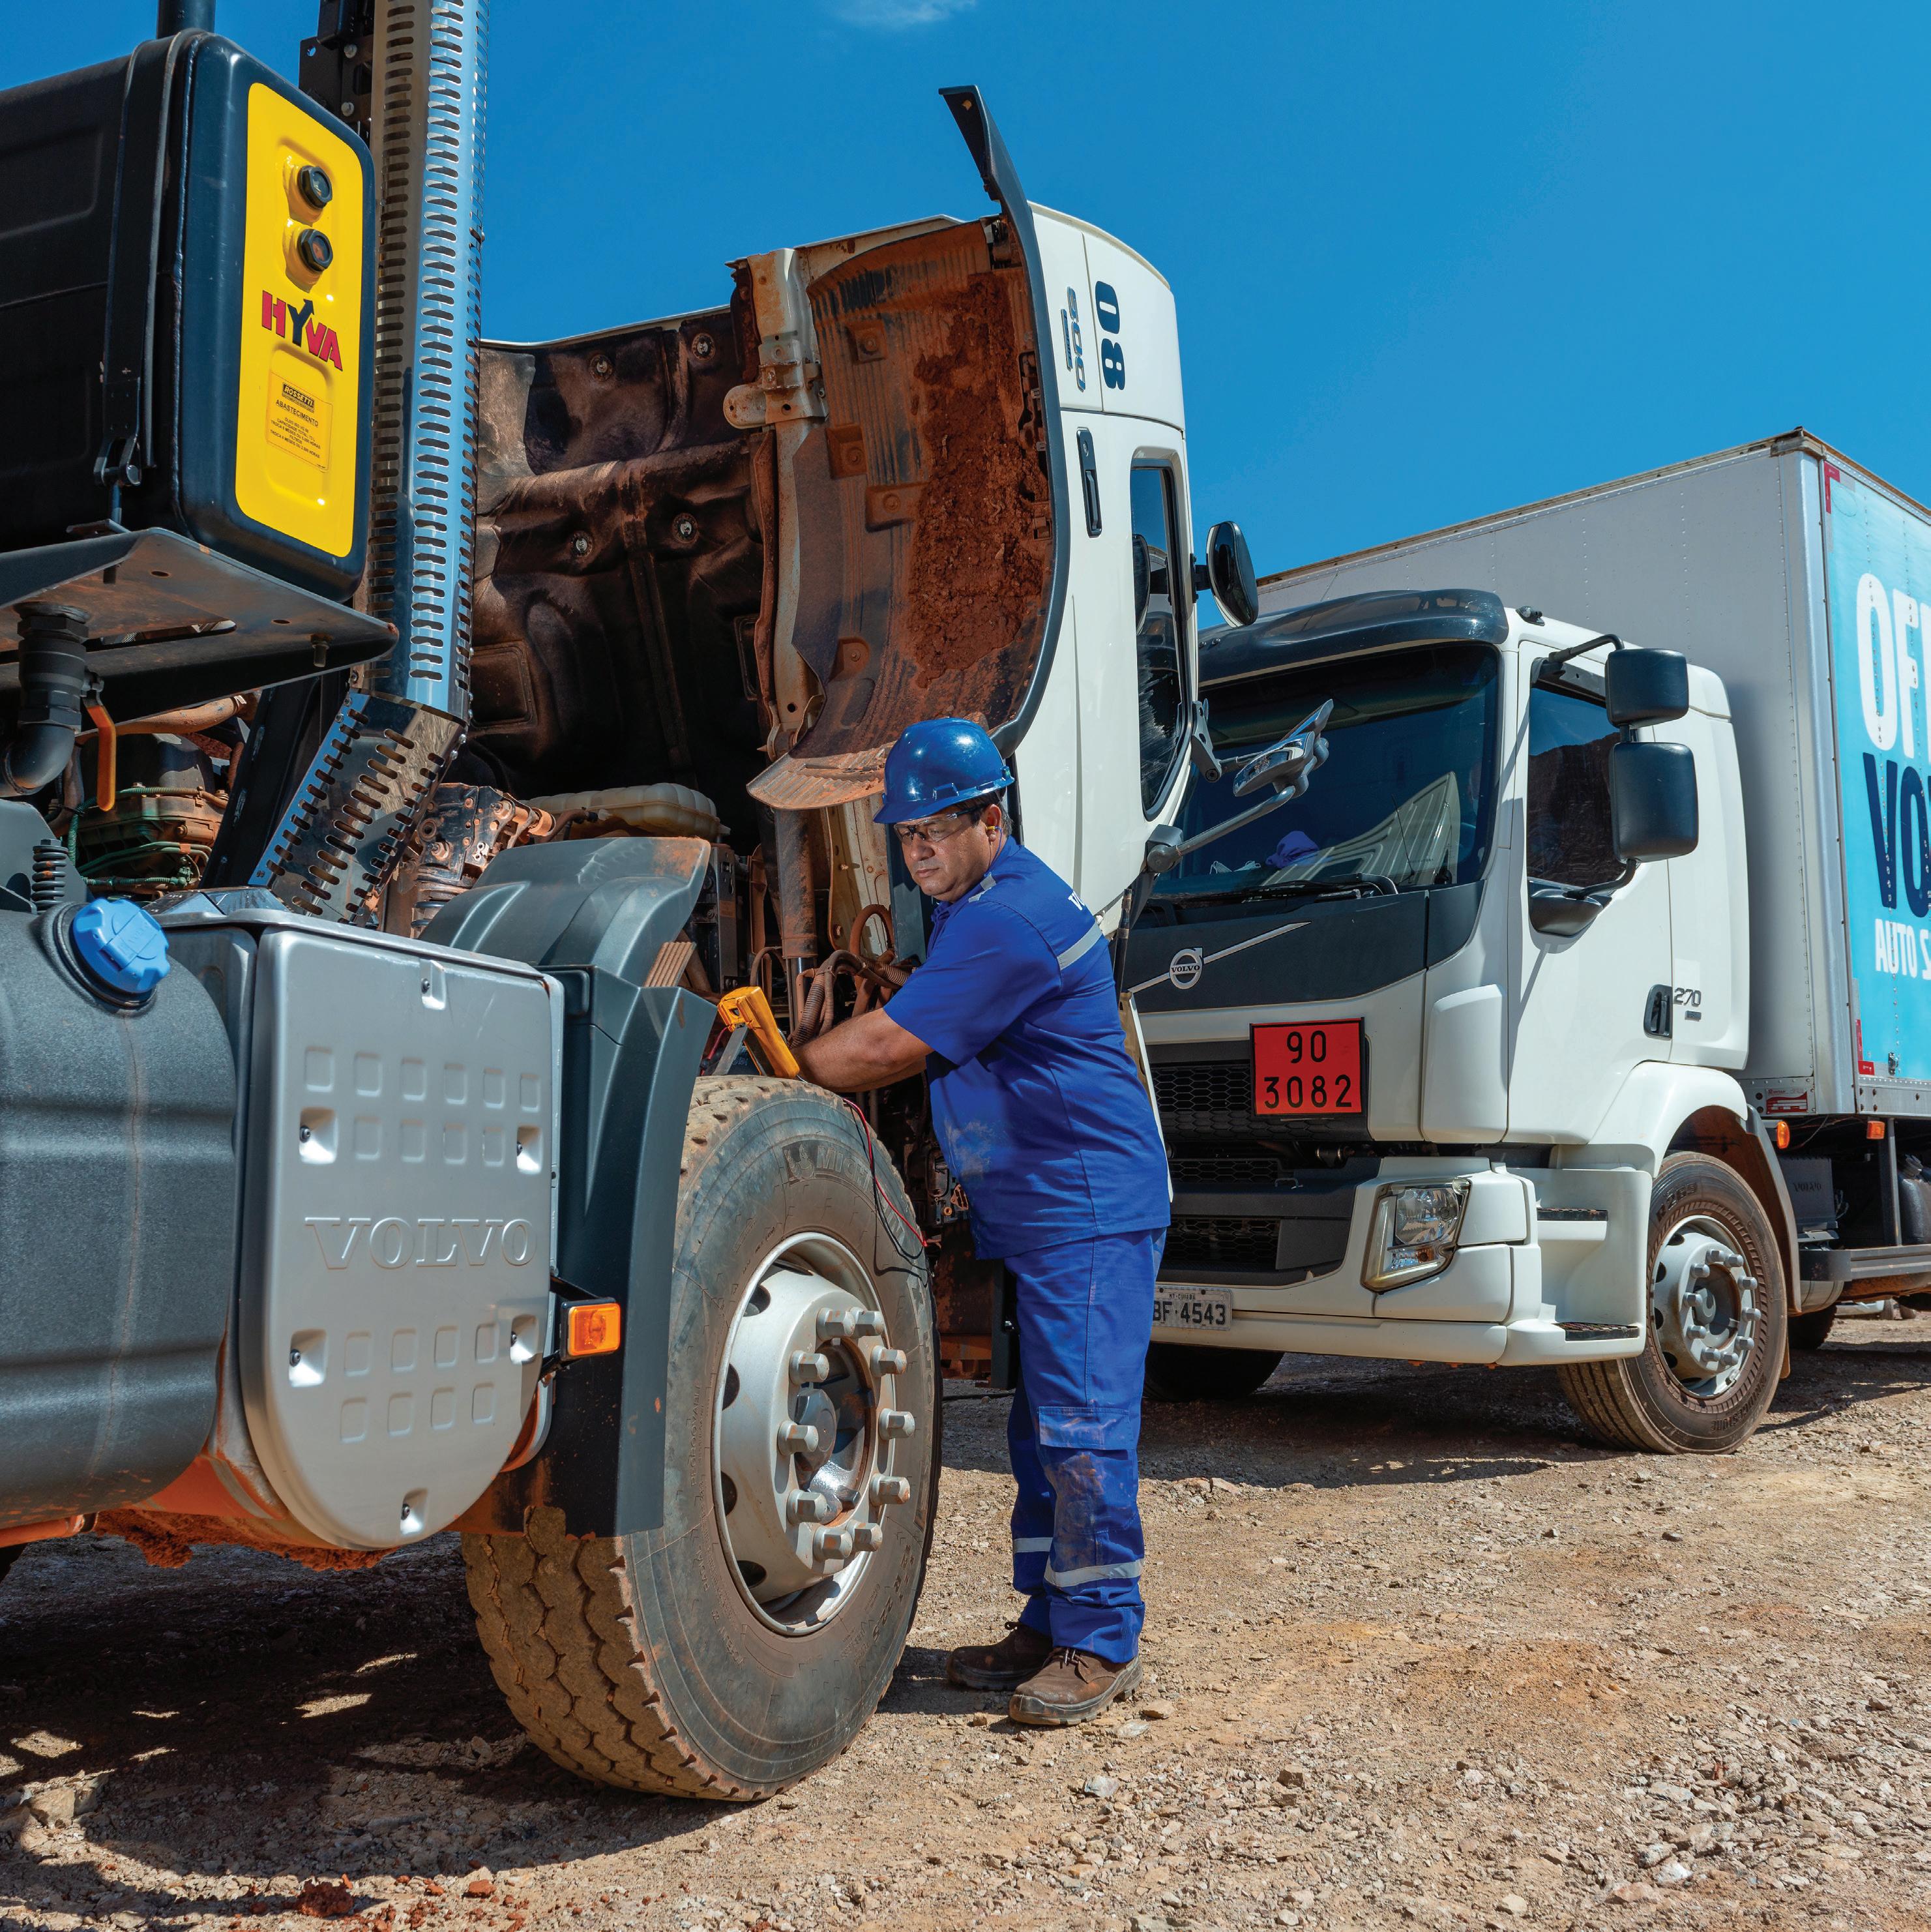
CHAPTER 04. PAGE 209
Auto Sueco Automóveis
Auto Sueco Automóveis is a car retail company with multi-brand dealerships in Porto (Volvo, Mazda and Honda), Lisbon (Volvo, Honda, Jaguar, Land Rover and Mazda), Braga (Volvo) and Guimarães (Volvo).
The year 2021 began with a new period of confinement, during January, which forced the company to close its activity, keeping only the workshops open. This new interruption, due to the worsening of the pandemic context, negatively impacted the results. Adding to this, the unavailability of cars due to the shortage of components (semiconductors) began to worsen in the brands marketed by Auto Sueco Automóveis, a paradigm observed throughout the industry.
Thus, the total market for light passenger vehicles ended 2021 practically unchanged compared to 2020 (+0.8%); still lagging by about 35%, when compared to the market in 2019. In after sales, 2021 was very similar to 2020, both in terms of occupation and turnover. In general terms, the pandemic once again affected the movement of our customers' cars, but the high level of absenteeism experienced within the teams also made it difficult to manage efficiently the flow in the workshops. Thus, in terms of turnover, the company recorded a drop of 12.7%.
In 2021, we began the implementation of the Core Project, an extremely important project for the activity of Auto Sueco Automóveis, and which comes at a crucial moment of transformation in the Automotive Retail business. This project aims to make the company more agile in its decision-making processes, thus allowing it to continue to be a reference in the sector where it operates.
year mshare market 2020 2017 2018 2019 1,2% 0,9% 1,0% 1,0% 145 417 2021 0,9% 146 637 222 134 228 290 223 799 year mshare volvo 2020 2017 2018 2019 28,0% 2021 23,8% 27,7% 28,2% 27,7% cars Volvo brand share PAGE 210 CHAPTER 04.
Galius
Galius is the exclusive distributor of Renault Trucks for Portugal. At Galius, the year 2021 was marked by a substantial increase in the commercial activity of new and used trucks, which increased total sales by 53.2% when compared with the year 2020. More importantly, the year was also marked by the turnaround of the negative EBITDA of 2020 (-32 thousand Euros) to a positive EBITDA of 1.3 million Euros in 2021.
As to market share, the company recorded an increase from 10.8% (2020) to 13.5% (2021) in the heavy-duty truck market (over 16 tons), which represents an increase of 170 units registered compared to 2020. In the after sales segment, once again we achieved very positive results compared to 2020, with a growth of 14.1% from 2020.
Also, during the year, Galius completed the opening of a new after-sales unit in Mangualde - a region with great exposure to the Renault brand - providing gains in volume and profitability of after-sales in the region, and integrated, like the other Nors Mobility companies in Portugal, the Core Project, a cornerstone for its future growth.
KinLai
KinLai is the official distributor of Dongfeng Trucks - the top-tier Chinese truck brand - in Angola. Aiming to introduce trucks with a high level of quality in the Angolan market, focused on safety, durability and performance, KinLai's offer promises to boost different sectors of the Angolan economy.
In 2021, KinLai captured a major stake in the heavy-duty truck market (over 16 tons) of 19.3% compared to 7.0% in 2020, representing an increase of 21 registered units, when compared to 2020.
Supported by market and share growth, KinLai achieved positive EBITDA for the first time since its launch in 2020.
year mshare market 2020 2017 2018 2019 8,1% 14,1% 11,6% 6,2% 148 2021 4,3% 142 220 302 225 medium-duty trucks year mshare market 2020 2017 2018 2019 10,8% 15,3% 14,9% 12,4% 3 026 2021 13,5% 3 685 4 534 4 307 4 183 heavy-duty trucks
PAGE 211 CHAPTER 04.
Galius Renault Trucks
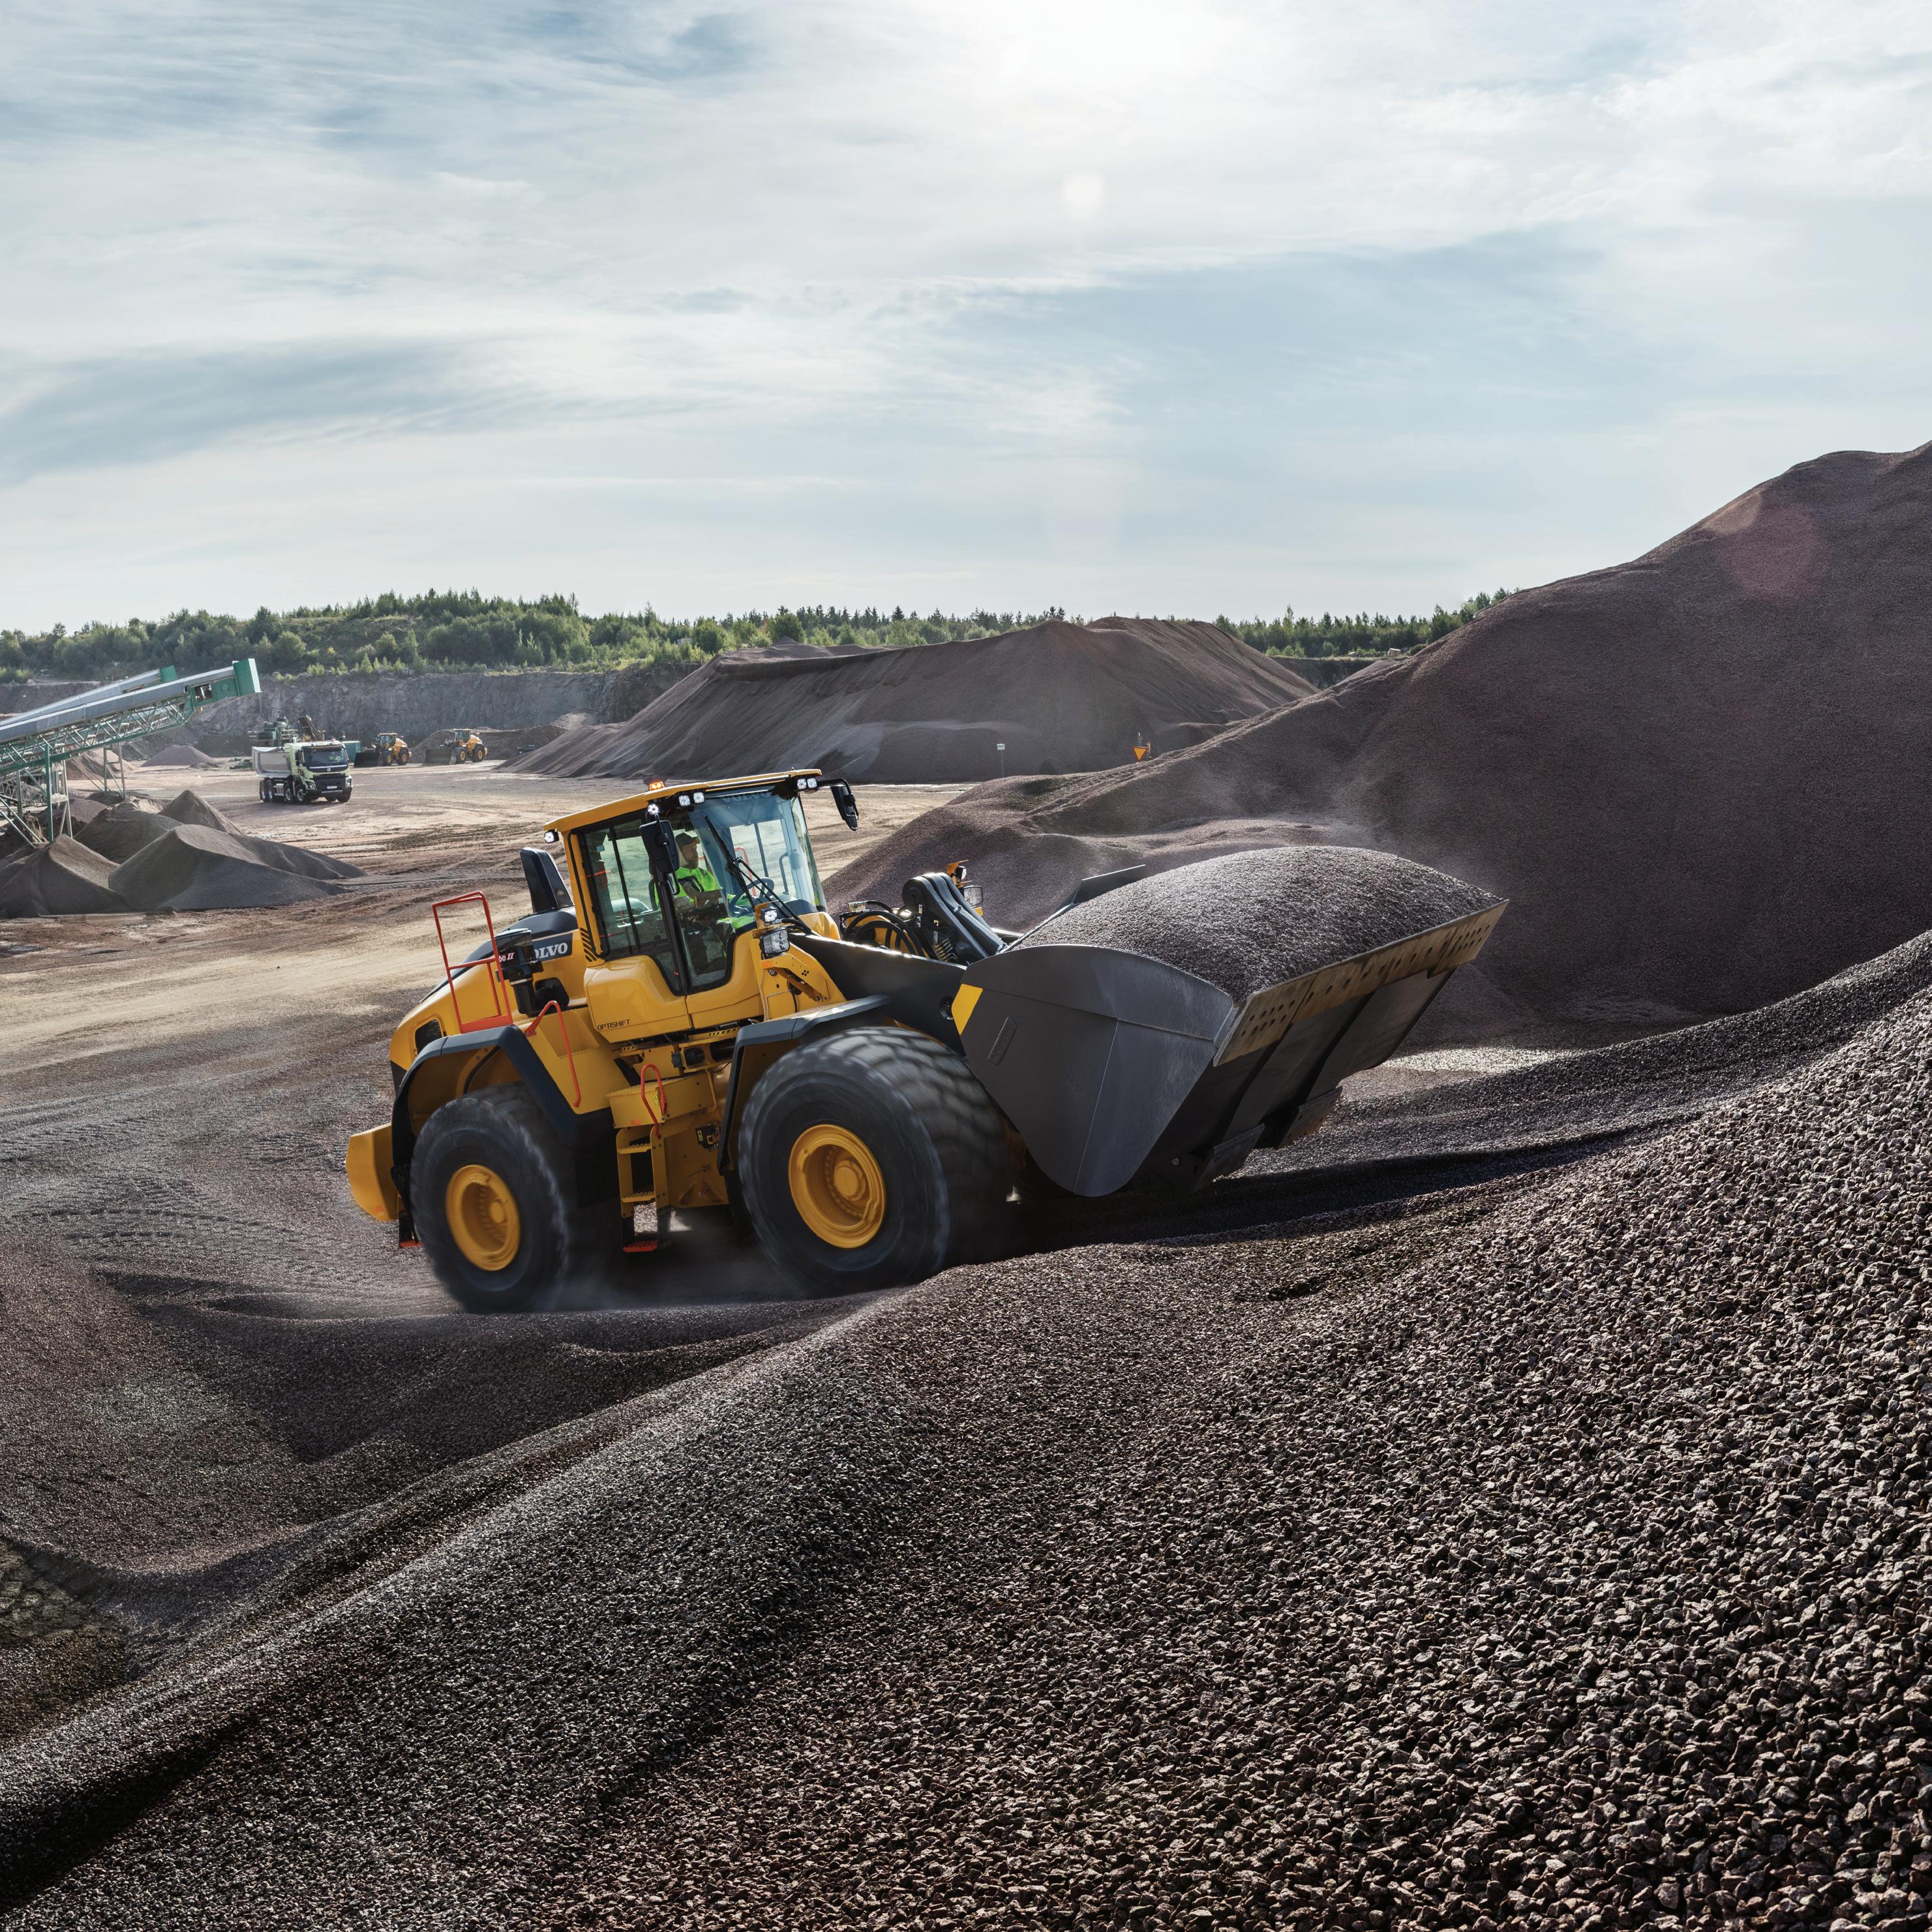
CHAPTER 04. PAGE 212
NORS OFF-ROAD
Nors directly operates the off-road business in Canada, Brazil and Angola. Additionally, it is present, indirectly through its subsidiary Ascendum, in the markets of Portugal, Spain, USA, Turkey, Mexico and in Central Europe (Austria, Hungary, Czech Republic, Slovakia, Romania, Croatia, Slovenia, Bosnia and Moldova).
In Brazil, 2021 was an excellent year for the agricultural machinery business in Brazil. Moreover, once again, AgroNew's market share increased in comparison with last year.
In Angola, despite the challenging macroeconomic context, the year 2021 was positively marked by the high volume of commercial sales, achieved mainly in the second half of the year.
This scenario is the result of increased demand caused by inflation in the price of raw materials and the consequent increase in mining activity in the country.
Acquired in March 2020, Strongco – based in Canada – sells, rents and services heavy equipment for various sectors such as construction, infrastructure, mining, utilities, municipalities, waste management and forestry, with 26 branches across Canada (in the provinces of Alberta, Ontario, Quebec and the Atlantic provinces). Strongco represents major equipment manufacturers with globally recognized brands, including Volvo Construction Equipment, Case Construction, Manitowoc Crane, National, Grove, Terex Cedarapids, Terex Trucks, Fassi,
Sennebogen, Konecranes and SDLG. Although Strongco represents various brands, Volvo Construction Equipment, particularly the GPE (General Purpose Equipment) segment, stands out considerably in the scope of its activity. The Ascendum Group, 50% owned by Nors , is one of the world's largest suppliers of Volvo Construction Equipment (VCE) construction and infrastructure equipment.
Construction Equip. Agricultural Equip. NORS OFF-ROAD 2 633 2 584 2 186 164 89 98 3 761 211 2020 2021 2018 2019 911 349 884 562 829 389 9 966 9 128 9 365 1 276 914 14 914 2020 2021 2018 2019 units amount in thousands EUR in thousands of Euros sales 2021 var. Ascendum 1 025 416 31,4% Auto Maquinaria 27 308 78,1% AgroNew 20 497 76,4% total 1 364 319 Strongco 291 098 61,3% 2020 780 415 15 335 11 617 987 851 180 484 4.2.2.2. Not all business unit activities are considered PAGE 213 CHAPTER 04.
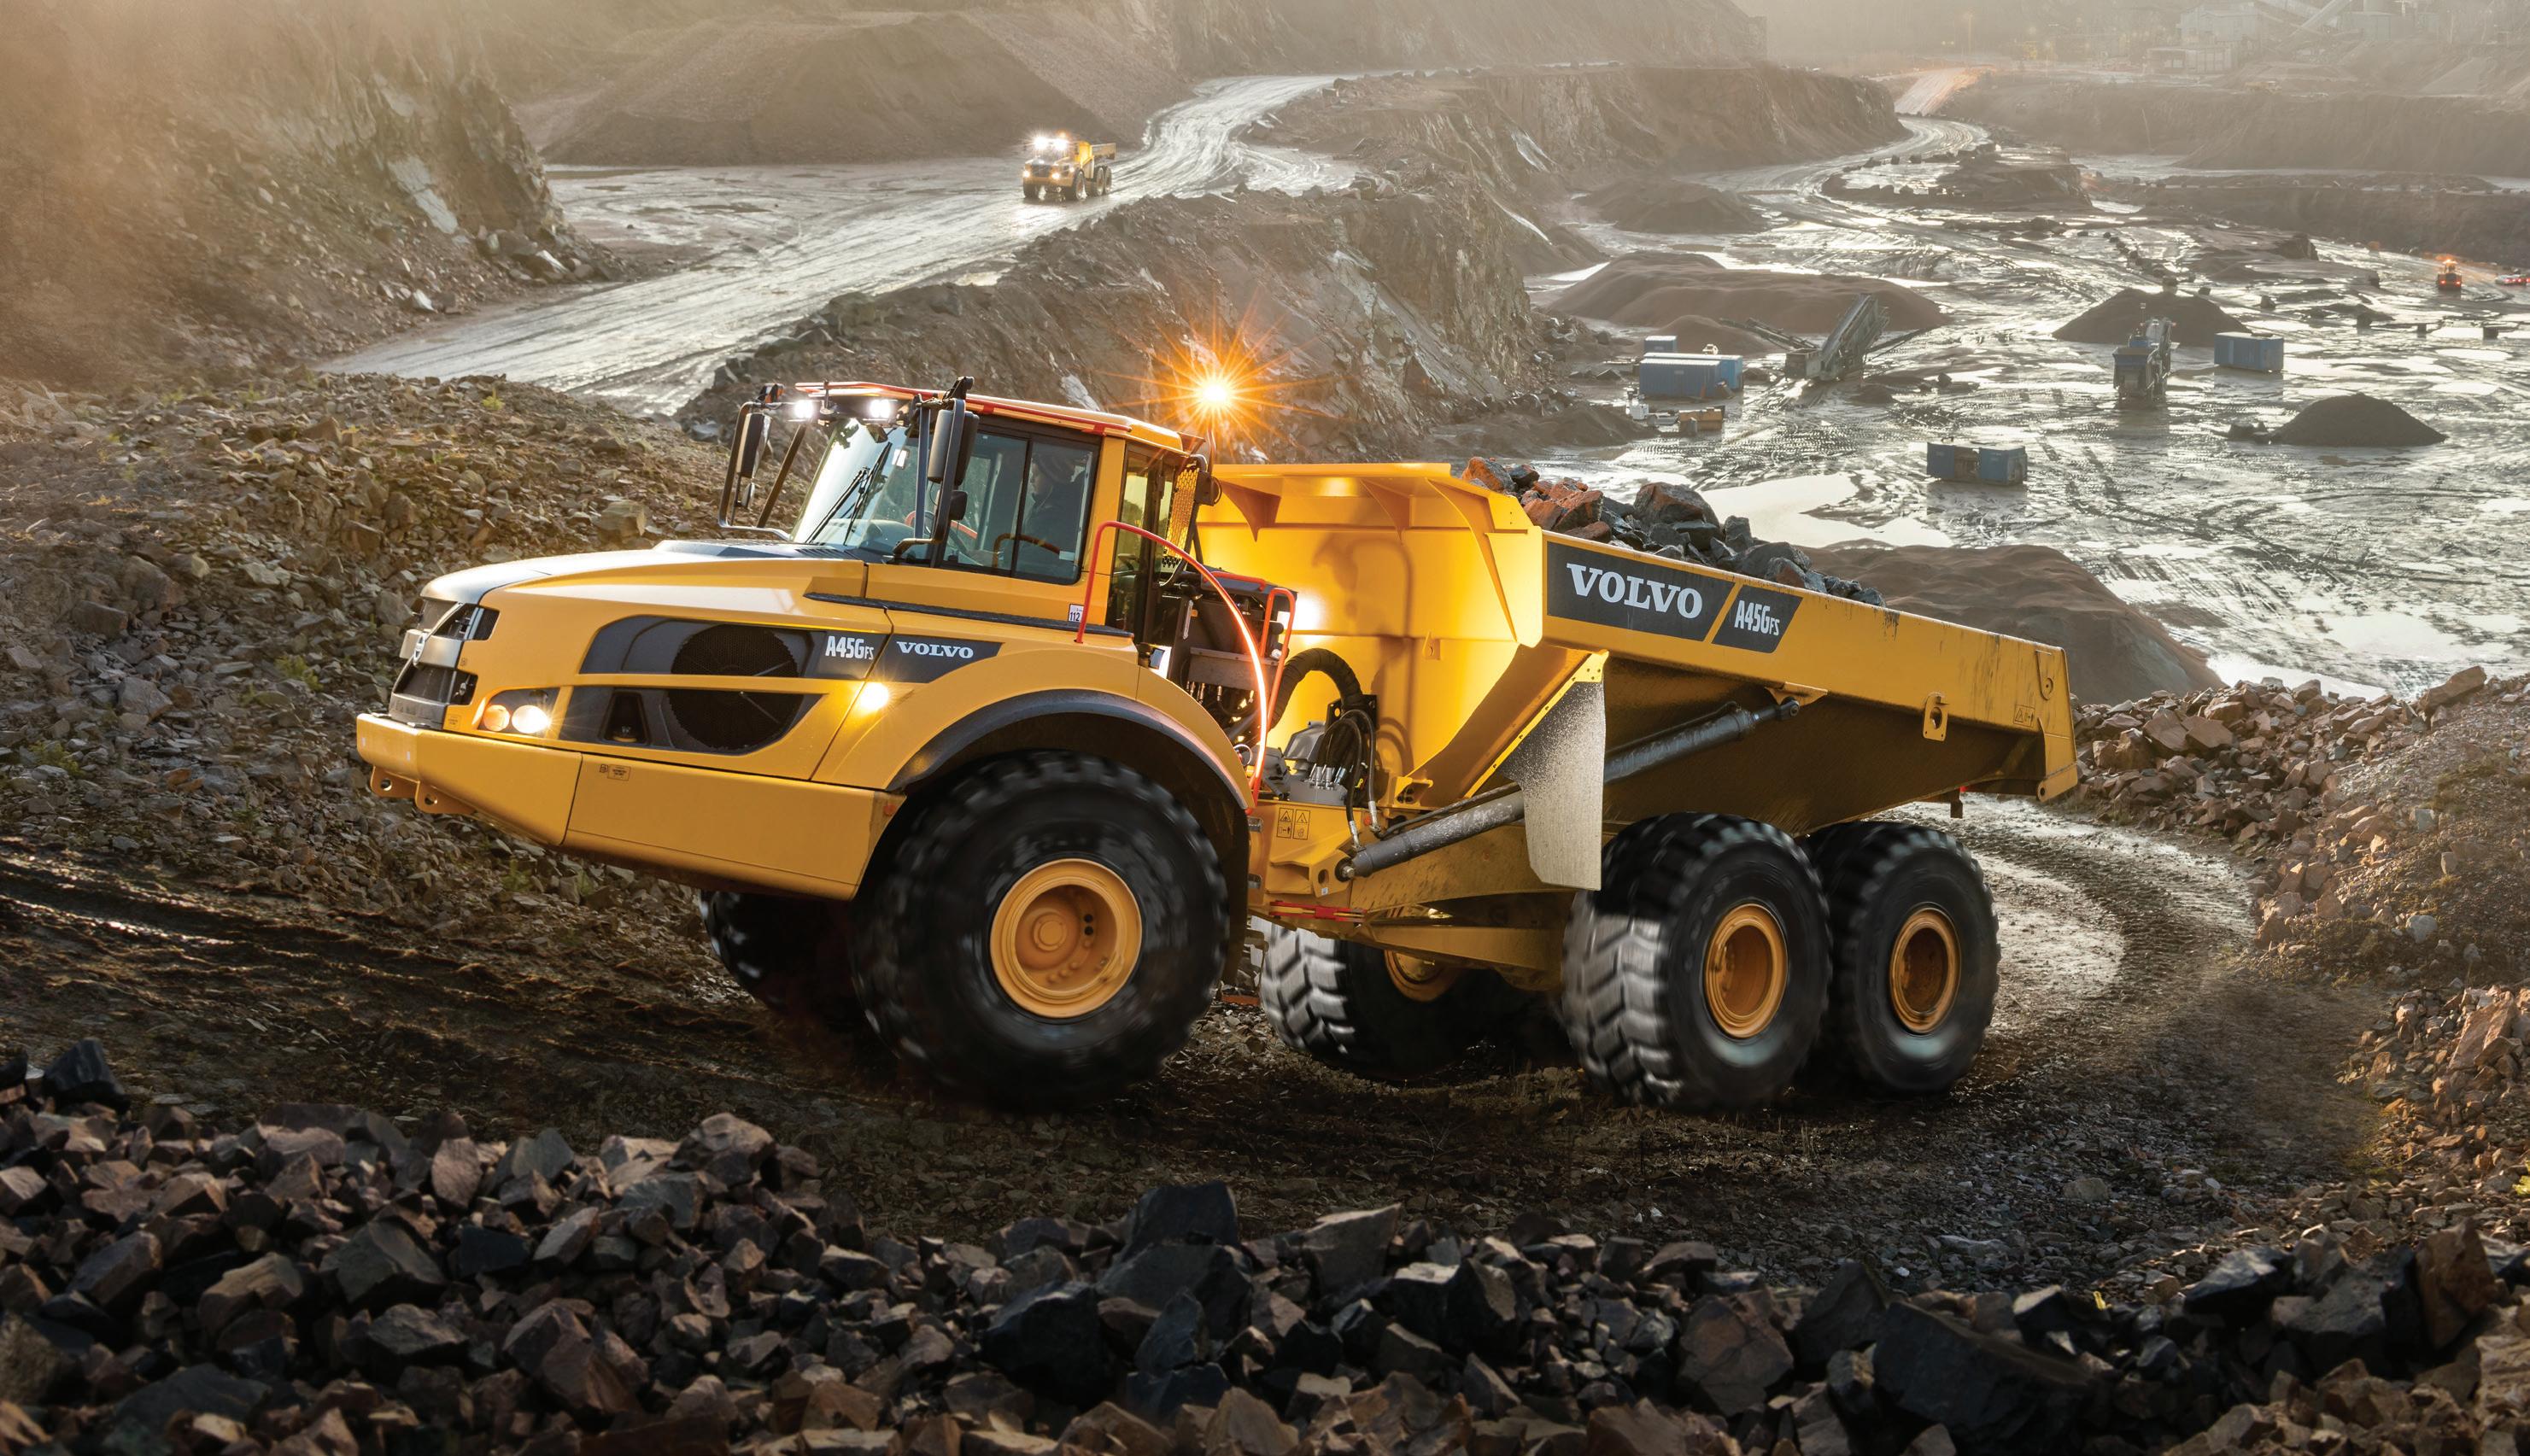
Construction Equip. Agricultural Equip. 2 633 2 584 2 186 164 89 98 3 761 211 911 349 884 562 829 389 9 966 9 128 9 365 1 276 914 14 914 in thousands of Euros sales 2021 var. Ascendum 1 025 416 31,4% Auto Maquinaria 27 308 78,1% AgroNew 20 497 76,4% total 1 364 319 ebitda 2021 var. Ascendum 111 391 42,4% Auto Maquinaria 6 095 242,4% AgroNew 2 125 139,4% total 155 819 Strongco 291 098 61,3% Strongco 36 113 2020 780 415 15 335 11 617 987 851 2020 78 214 1 780 887 105 856 180 484 24 975 44,6% Ascendum's contribution to the EBITDA of the Nors Group is via E.M.A., being in 2021 21,109 thousand Euros and in 2020 7,614 thousand Euros. PAGE 214 CHAPTER 04.
Strongco
Strongco Corporation sells, leases and provides product support for heavy equipment for various sectors, such as construction, infrastructures, mining, utilities, municipalities, waste management and forestry, through its 26 branches in Canada, in the provinces of Alberta Ontario, Quebec and the Atlantic provinces.
The GPE (General Purpose Equipment) market, Strongco's main market, recorded a 32.5% growth compared to 2020, largely due to the recovery of the economy following the profound impact of the pandemic in 2020, as well as the increase in the main commodities exploited in Canada. In this context, Strongco maintained its market share in this type of equipment with 7.7% in 2020 and in 2021, leading to a natural increase in units sold (+133 units). As for GPE equipment, the share in the loader market evolved positively from 9.9% in 2020 to 10.7% in 2021, and in the crawler excavator market stabilised at 4.9%. On the other hand, articulated trucks saw their market share decrease marginally from 18.9% in 2020 to 18.6% in 2021.
Despite the global recovery, the Road market registered a 14.6% year-on-year drop. Even so, Strongco saw its market share grow from 6.2% (2020) to 7.2% (2021), with 24 units sold.
In turn, the Compact market proved resilient, showing growth of around 35.1% compared to 2020, with Strongco keeping its market share intact in this range. The units sold grew in the same proportion as the market, closing the year with a total of 45 units, 5 more than 2020.
As for the rental business, Strongco maintained its strategy, corresponding in 2021 to about 5.3% of the company's turnover, which represents a slight decrease compared with 2020. This scenario is closely linked to the priority given to the sale of equipment, in a scenario of equipment supply restrictions by manufacturers, which therefore did not allow for an increase in Strongco's rental fleet.
year 2021 2020 mshare 7,7% 7,7% market 6 148 4 640 GPE – general purpose equipment year 2021 2020 mshare 7,2% 6,2% market 345 404 road year 2021 2020 mshare 0,6% 0,6% market 7 975 5 902 compact GPE - Excavators GPE - Wheel loaders units 165 GPE - Articulated haulers 63 Road 24 Compact 45 235 units sold in 2021 PAGE 215 CHAPTER 04.
Ascendum turnover by country
1 CEG corresponds to 6 Central European countries - Austria, Hungary, Czech Republic, Slovakia, Romania and Croatia.
Group Ascendum Ebitda in thousands of Euros and in sales %
The turnover of the Ascendum Group in the Portuguese market recorded a growth of 16.1% compared to 2020, reaching approximately 197.0 million Euros.
in thousands of Euros Portugal Spain USA Turkey Mexico CEG1 total 2017 135 845 97 091 289 051 203 438 37 149 144 649 907 223 2018 161 520 126 141 299 687 147 846 33 265 173 115 941 574 2019 182 668 130 100 280 910 75 831 21 178 187 724 878 411 2020 169 530 83 029 255 065 91 512 19 040 162 239 780 415 2021 196 950 97 775 346 698 149 676 46 929 187 388 1 025 416 78 214 2020 111 391 2021 73 198 2017 78 402 2018 83 510 2019 10% 10.9% 8.1% 8.3% 9.5%
Ascendum 2020 2017 2018 2019 16.8% 2021 15.1% 14.5% 15.0% 13.6% Evolution of the Construction Equipment Market Share in Portugal
PAGE 216 CHAPTER 04.
In 2021, the Group began importing and distributing the Valtra brand of agricultural equipment in Portugal, thus expanding its already extensive experience in the agricultural sector with a new company exclusively dedicated to this market segment - Ascendum Agro.
We also note that in 2021 the cargo handling sector in Portugal was sold. After the reduction in turnover in 2020, essentially as a result of the change in the consolidation method of Air-Rail (no longer consolidated through the full consolidation method, but through the equity method) and of the slowdown in the construction sector due to the impacts caused by the pandemic, there was a recovery in the Spanish market, with the Group's performance in that geographical area recording a positive variation of around 18% when compared to the turnover in 2020.
Resuming the growth trend recorded in the pre-pandemic years, the US construction equipment market, where Ascendum Machinery, Inc. operates, recorded a growth of about 22% (when compared to 2020), representing about 86% of the market recorded in the best year ever (2005).
In the USA, the Ascendum Group achieved a turnover of 347 million Euros, representing an increase of 36% compared to the 255 million Euros recorded in 2020, thus proving the fast recovery levels of that market to the impacts resulting from the pandemic.
Notwithstanding the uncertainty and vulnerability of the macroeconomic context in Turkey, to which add the increase in inflation, the contraction of investment and the vulnerabilities of the financial sector –as well as the chronic issue of geopolitical tensions felt in the territory - the Turkish economy continues to perform positively, a fact proven by the performance recorded by the Group in that market.
Continuing the good momentum of the Turkish market (which was coming from an internal crisis in 2018), the recovery remains at strong levels, with a 64% increase in turnover in 2021 compared to the same period.
In Mexico, the levels of public investment remain low, except for some presidential projects, such as the Dos Bocas refinery, the international airport in Mexico City (Aeropuerto Internacional Felipe Ángeles) and the Trem Maya railway project.
Thus, despite the macroeconomic and operational context still not proving favourable for the activity of Ascendum Maquinaria México, and because of the company's direct involvement, in particular, in the Trem Maya project, turnover in 2021 was 1.5 times greater than that recorded in 2020, and this was the company's best year in terms of turnover.
2020 2017 2018 2019 2021 12.9% 11.1% 13.4% 12.5% 2020 19.5% 2021 2017 2018 2019 3.8% 3.2% 3.0% 2.5% 2020 4.5% 2021 2017 2018 2019 13.2% 12.9% 16.5% 13.0% 2020 2017 2018 2019 Evolution of the Construction Equipment Market Share in Spain 2020 2017 2018 2019 2021 12.9% 11.1% 13.4% 12.5% 2020 19.5% 2021 2017 2018 2019 3.8% 3.2% 3.0% 2.5% 2020 4.5% 2021 2017 2018 2019 13.2% 12.9% 16.5% 13.0% 2020 13.3% 2021 2017 2018 2019 Evolution of the Construction Equipment Market Share in USA 2020 2017 2018 2019 2021 12.9% 11.1% 13.4% 12.5% 2020 19.5% 2021 2017 2018 2019 3.8% 3.2% 3.0% 2.5% 2020 4.5% 2021 2017 2018 2019 13.2% 12.9% 16.5% 13.0% 2020 13.3% 2021 2017 2018 2019 Evolution of the Construction Equipment Market Share in Turkey
PAGE 217 CHAPTER 04.
In 2021, the Central Europe operation achieved a turnover of approximately 187 million Euros (16% above the 2020 turnover), with Austria (62% of total Central Europe turnover), followed by the Czech Republic (16% of total Central Europe turnover) and Romania (7% of total Central Europe turnover) as the largest contributors.
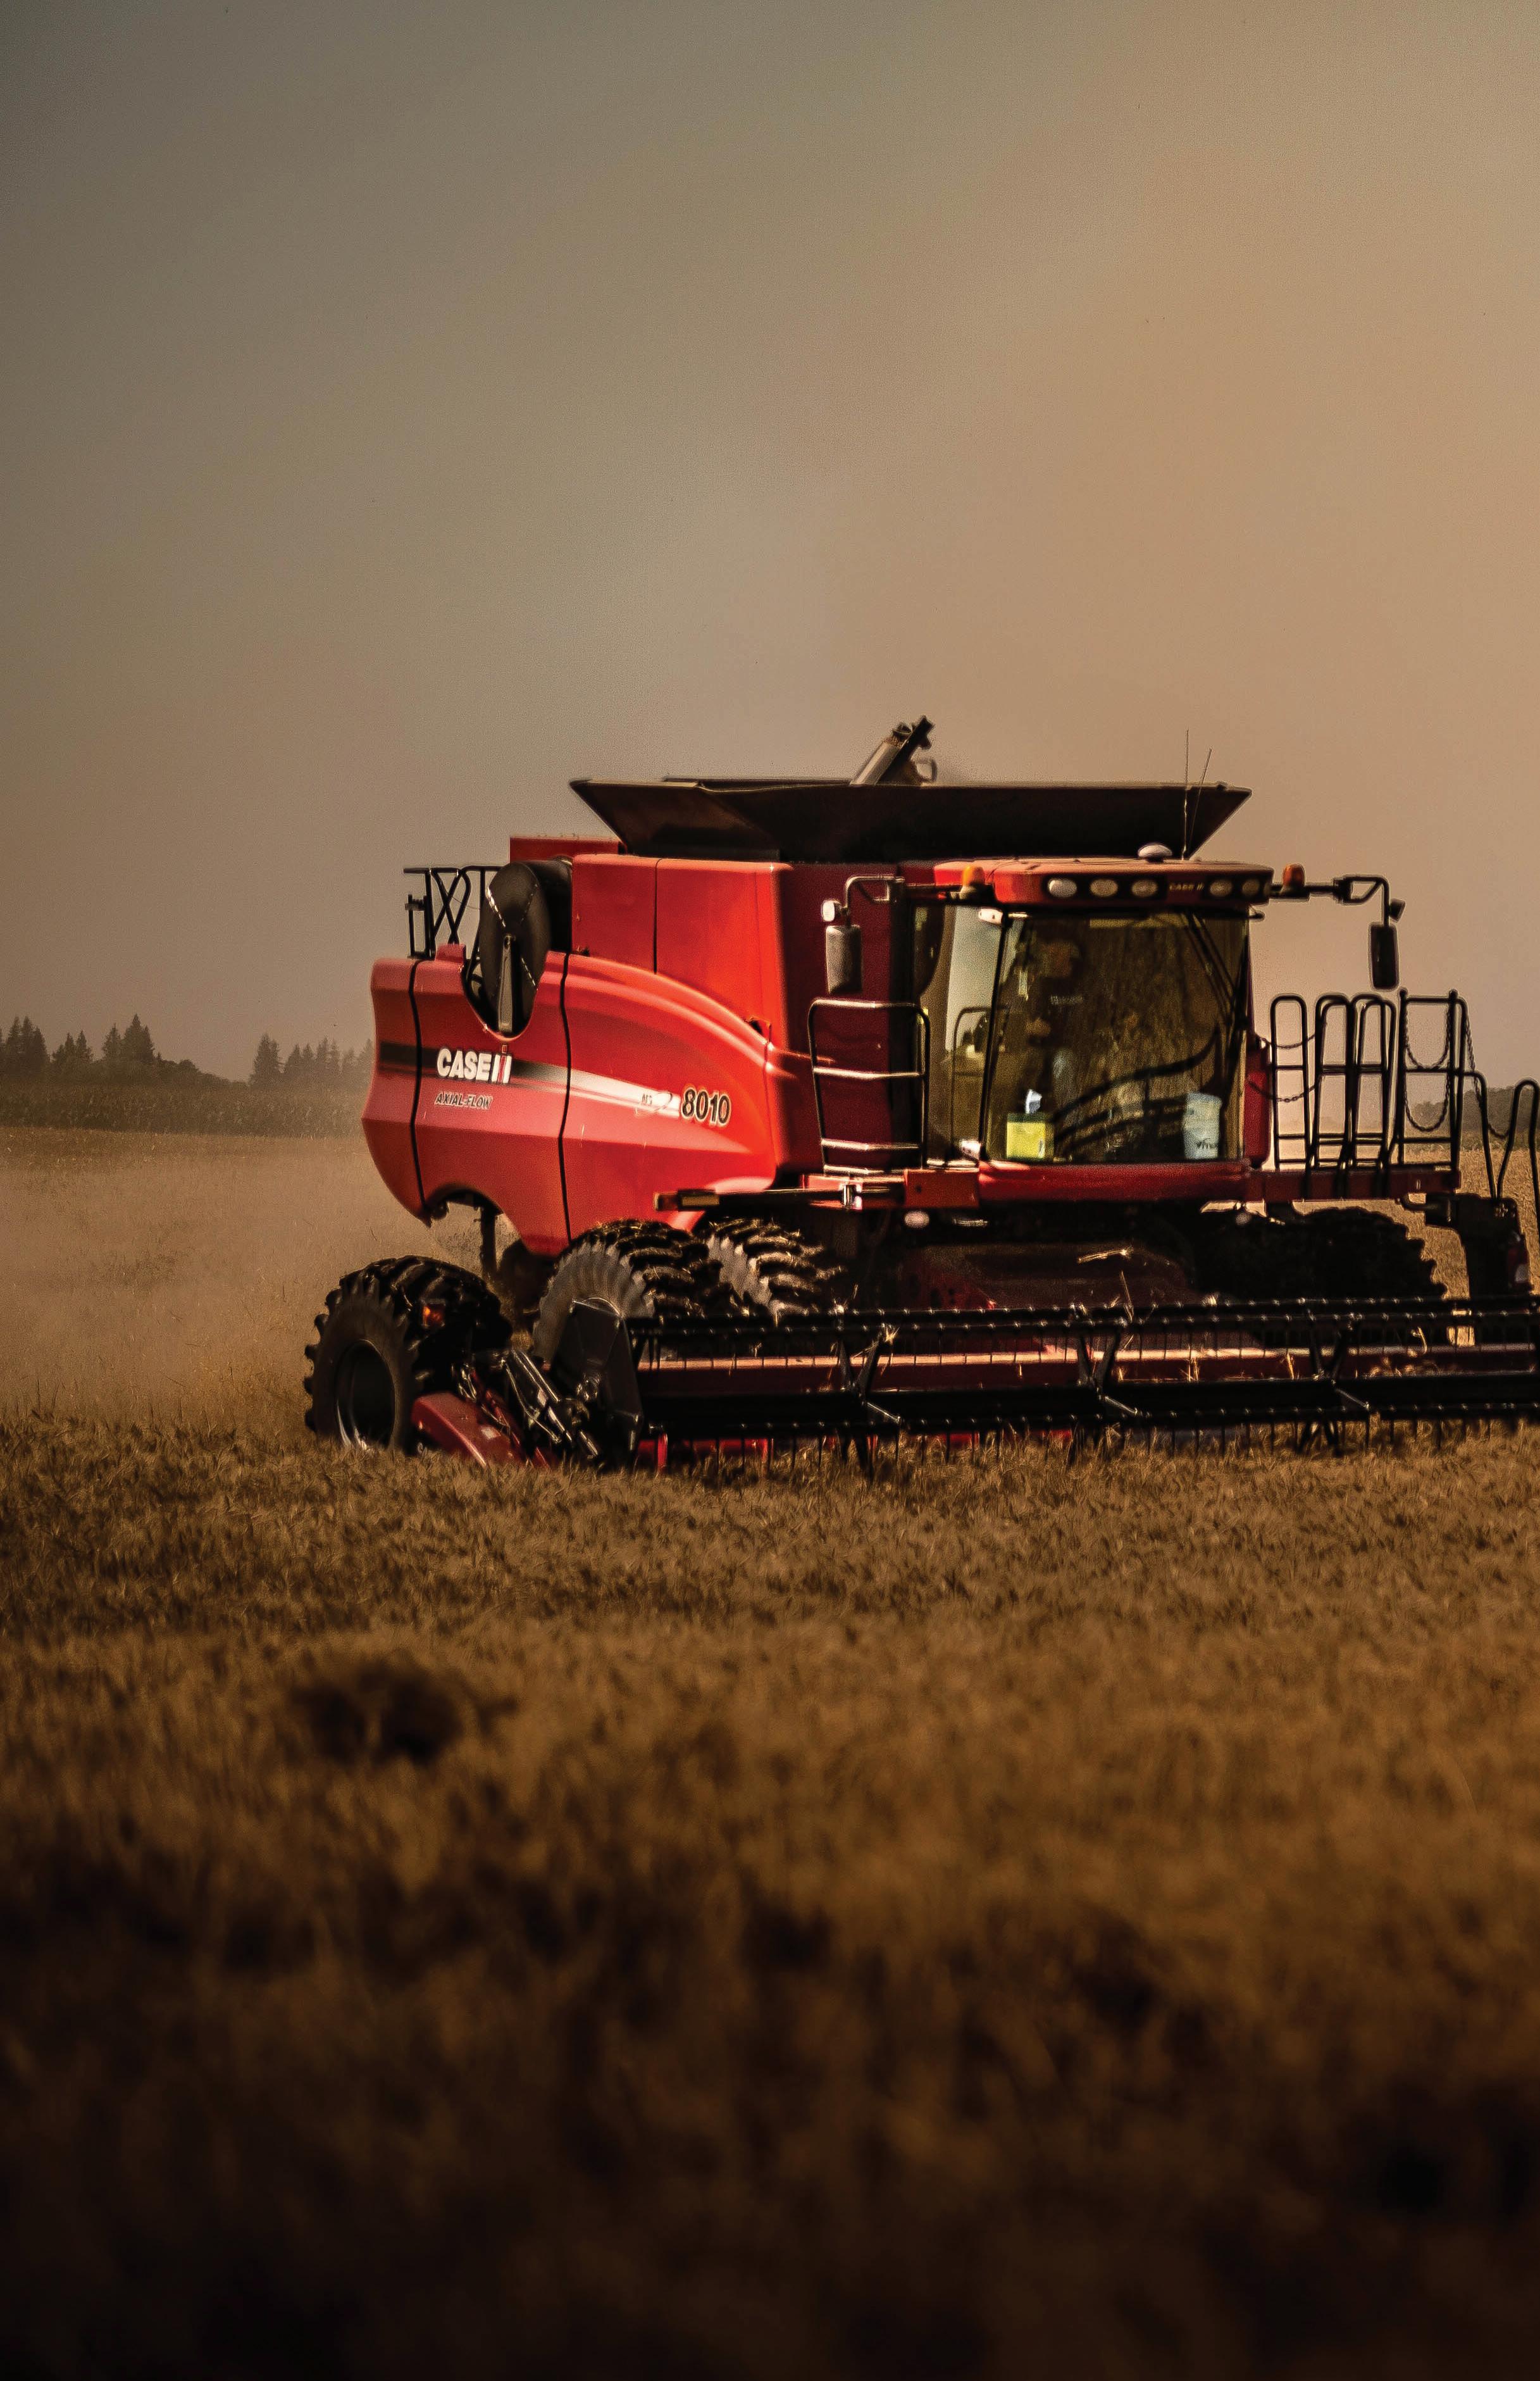
In consolidated terms, the turnover of the Ascendum Group exceeded the 1,000 million Euros mark for the first time in the Group's history, recording 1,025 million Euro (31% above the figures recorded in 2020).
A historic milestone was also achieved in terms of EBITDA, which grew by around 42% when compared to 2020, reaching the 111 million Euro mark.
CHAPTER 04. PAGE 218
Auto Maquinaria
Auto Maquinaria is the distributor for Angola of Volvo Construction Equipment and SDLG construction equipment and is also the exclusive representative of Groove, Hyster and Epiroc products.
In 2021, and despite the decrease in market share, sales increased 78.1%, driven essentially by the market expansion (+116.0%) resulting from the recovery of the mining sector, reactivated by the revaluation of the price of some commodities in international markets.
Worthwhile noting was the EBITDA growth above 2.5 times, ending 2021 with 6.2 million Euros compared to the 1.8 achieved in 2020.
AgroNew
AgroNew represents Case IH Agriculture in the municipalities of Catanduva and Votupuranga, in the interior of the State of São Paulo, with three major products: agricultural tractors, grain harvesters and sugar cane harvesters, the latter being the main product in AgroNew’s product portfolio.
In 2021, the company recorded high sales growth (+76.4%) compared to 2020, driven by an excellent performance in commercial (harvester sales: 53 in 2021 compared to 34 in 2020) and after-sales, which led to an EBITDA increase of 139.4% compared to 2020.
The company captured an additional 2.2 p.p. of market share, closing 2021 with a 6.6% stake.

year mshare market 2020 2017 2018 2019 35,2% 15,1% 12,2% 31,1% 125 2021 28,9% 270 325 288 180 GPPE construction equipment harvesters year mshare market 2020 2017 2018 2019 35,2% 15,1% 12,2% 31,1% 125 2021 28,9% 270 325 288 180 GPPE construction equipment year mshare market 2020 2017 2018 2019 4,4% 6,8% 3,9% 4,2% 770 2021 6,6% 809 721 643 649 harvesters
PAGE 219 CHAPTER 04.
CHAPTER 04. PAGE 220
NORS AFTERMARKET
2021 was a year of profound changes and challenges in the Aftermarket segment, largely due to the internal restructuring of our companies. On one hand, the scenario led to the closure of the Civiparts Spain operation and, on the other hand, to the operational merger of the light vehicle Aftermarket (OneDrive and AS Parts) with the heavy vehicle Aftermarket (Civiparts) in Portugal.
In Angola, the performance was positive, largely explained by the measures taken around maximising profitability, with the adjustment of the structures of the different companies to the needs of the market, which helped to step up to the adverse economic situation caused by the pandemic in this market. Also in Angola, the consolidation of the light and heavy vehicle operations started, with the operational and legal merger of the entities being concluded in 2022.
thousands EUR sales 2021 var. Civiparts Portugal 14 712 -15,7% Civiparts España 2 052 -76,8% Civiparts Angola 4 727 16,5% OneDrive Portugal 30 615 13,6% OneDrive Angola 3 196 -4,5% total 55 302 ebitda 2021 var. -2 008 -411,9% -1 857 1,5% 1 046 158,3% 2 342 65,3% -15 88,1% -491 2020 17 442 8 835 4 057 26 961 3 346 60 642 2020 644 -1 886 405 1 416 -123 456 Civiparts Portugal Civiparts España Civiparts Angola OneDrive Portugal OneDrive Angola total 4.2.2.3. Not all business unit activities are considered PAGE 221 CHAPTER 04.
in
Civiparts Portugal
Civiparts Portugal distributes parts and workshop equipment for multi-brand trucks and buses.

At Civiparts Portugal, in 2021 the commercial performance was below expectations, due to the decrease in national and international activity. This context contributed to a significant decrease in the circulation of buses and trucks, which resulted in a drop in the demand for Civiparts Portugal products.
Thus, Civiparts Portugal registered a 15.7% drop in turnover, when compared to 2020, and a negative EBITDA, already recognising almost all the expenses related to the restructuring started in 2021. However, for 2022, the recovery of the activity is expected along with the national economic environment and the upside of the operational restructuring process.
Civiparts Angola and OneDrive Angola
Civiparts Angola distributes parts and workshop equipment for multi-brand trucks and buses. OneDrive Angola is responsible for light vehicle parts retail in that market.
In 2021, Civiparts and OneDrive presented distinct behaviours in the Angolan market. On one hand, OneDrive Angola showed a slight decrease in sales (-4.5%) and again negative EBITDA. On the other hand, Civiparts increased sales by 16.5% and EBITDA by 158.4%.
Also in 2021, the Aftermarket Angola was consolidated, with the operational merger of both light and heavy operations, and the legal merger materialised in early 2022, marking an important step towards the creation of more agile structures for the future of this operating segment.
PAGE 222 CHAPTER 04.
OneDrive and AS Parts
OneDrive Portugal and AS Parts are the brands responsible for retail parts for light vehicles in Portugal.
In Portugal, the year 2021 was marked by a 13.6% increase in sales and a 65.3% growth in EBITDA, motivated by the lifting of part of the restrictions in light vehicles circulation, which allowed a steep recovery in the demand for parts for vehicle maintenance and repair.
In the operational merger with Civiparts Portugal, aimed to reproduce a lighter structure and more efficient processes, the light vehicle Aftermarket structure is now capable of reacting with more agility to the challenges presented by the market, meeting the customers' high expectations in terms of service level.
The consolidation in 2021 of the benefits arising from the implementation of the Core Project, among other factors, boosted the increase in EBITDA, demonstrating its importance for the future of the operations.
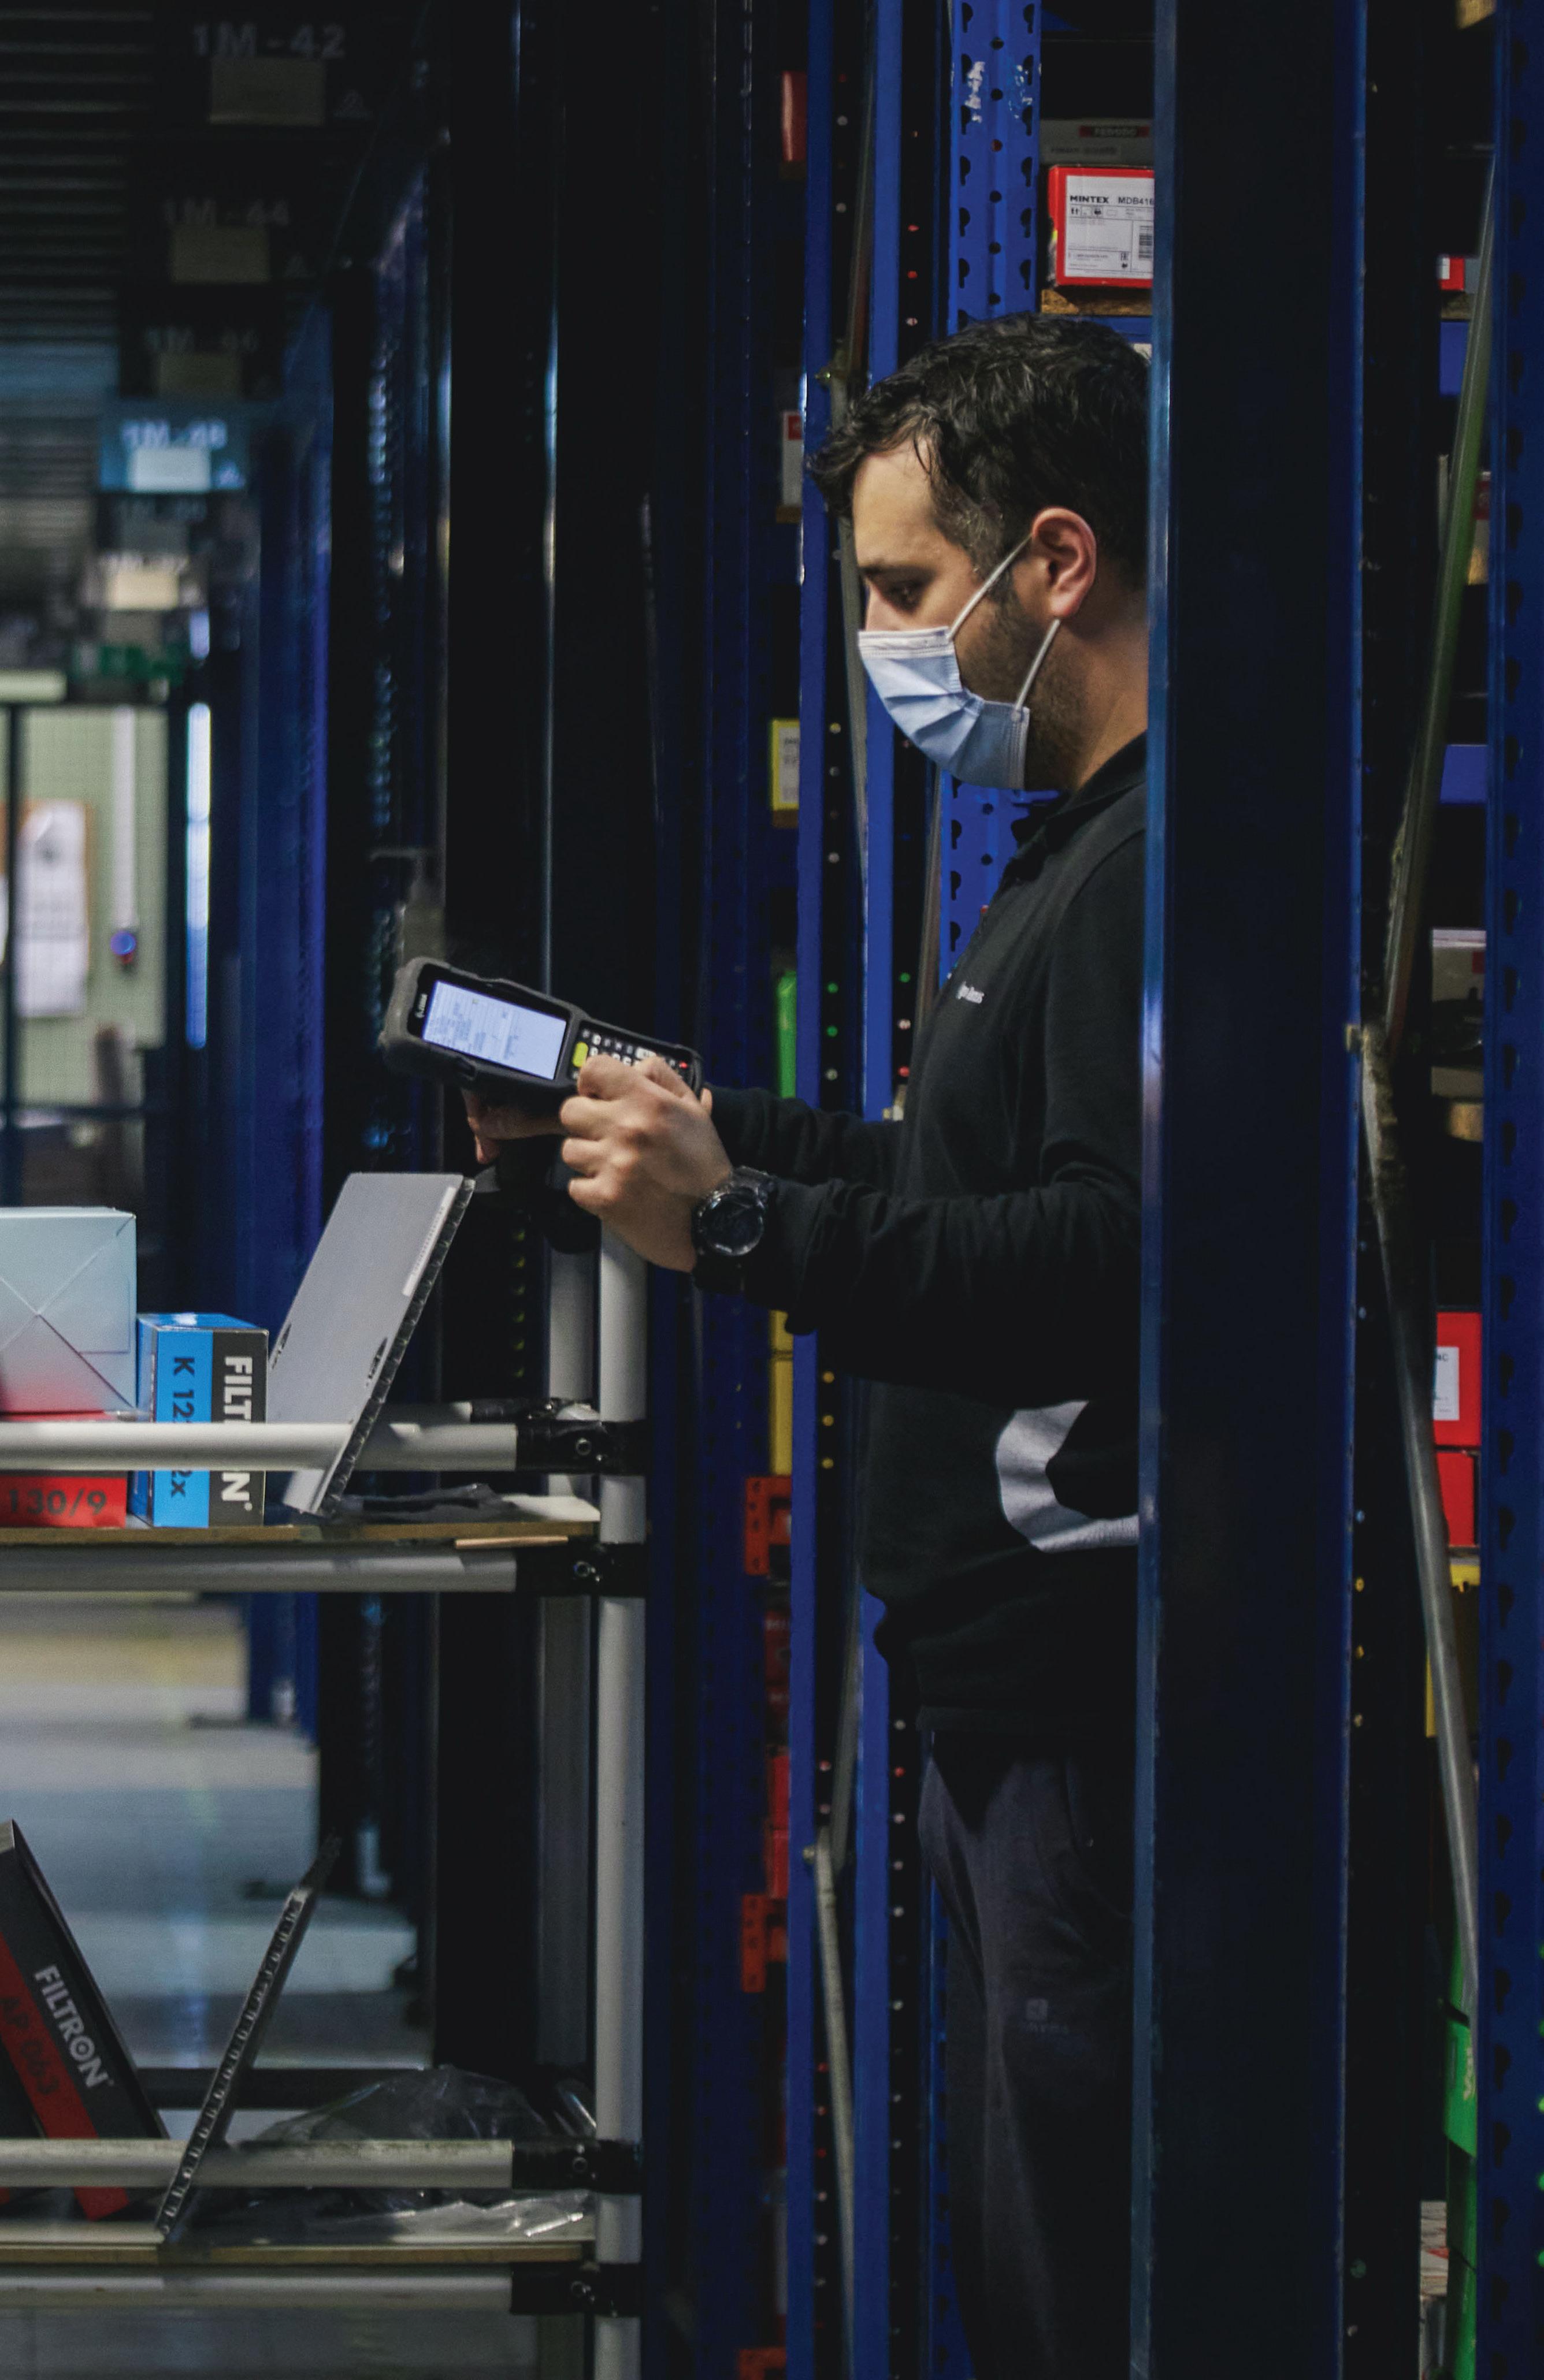
PAGE 223 CHAPTER 04.
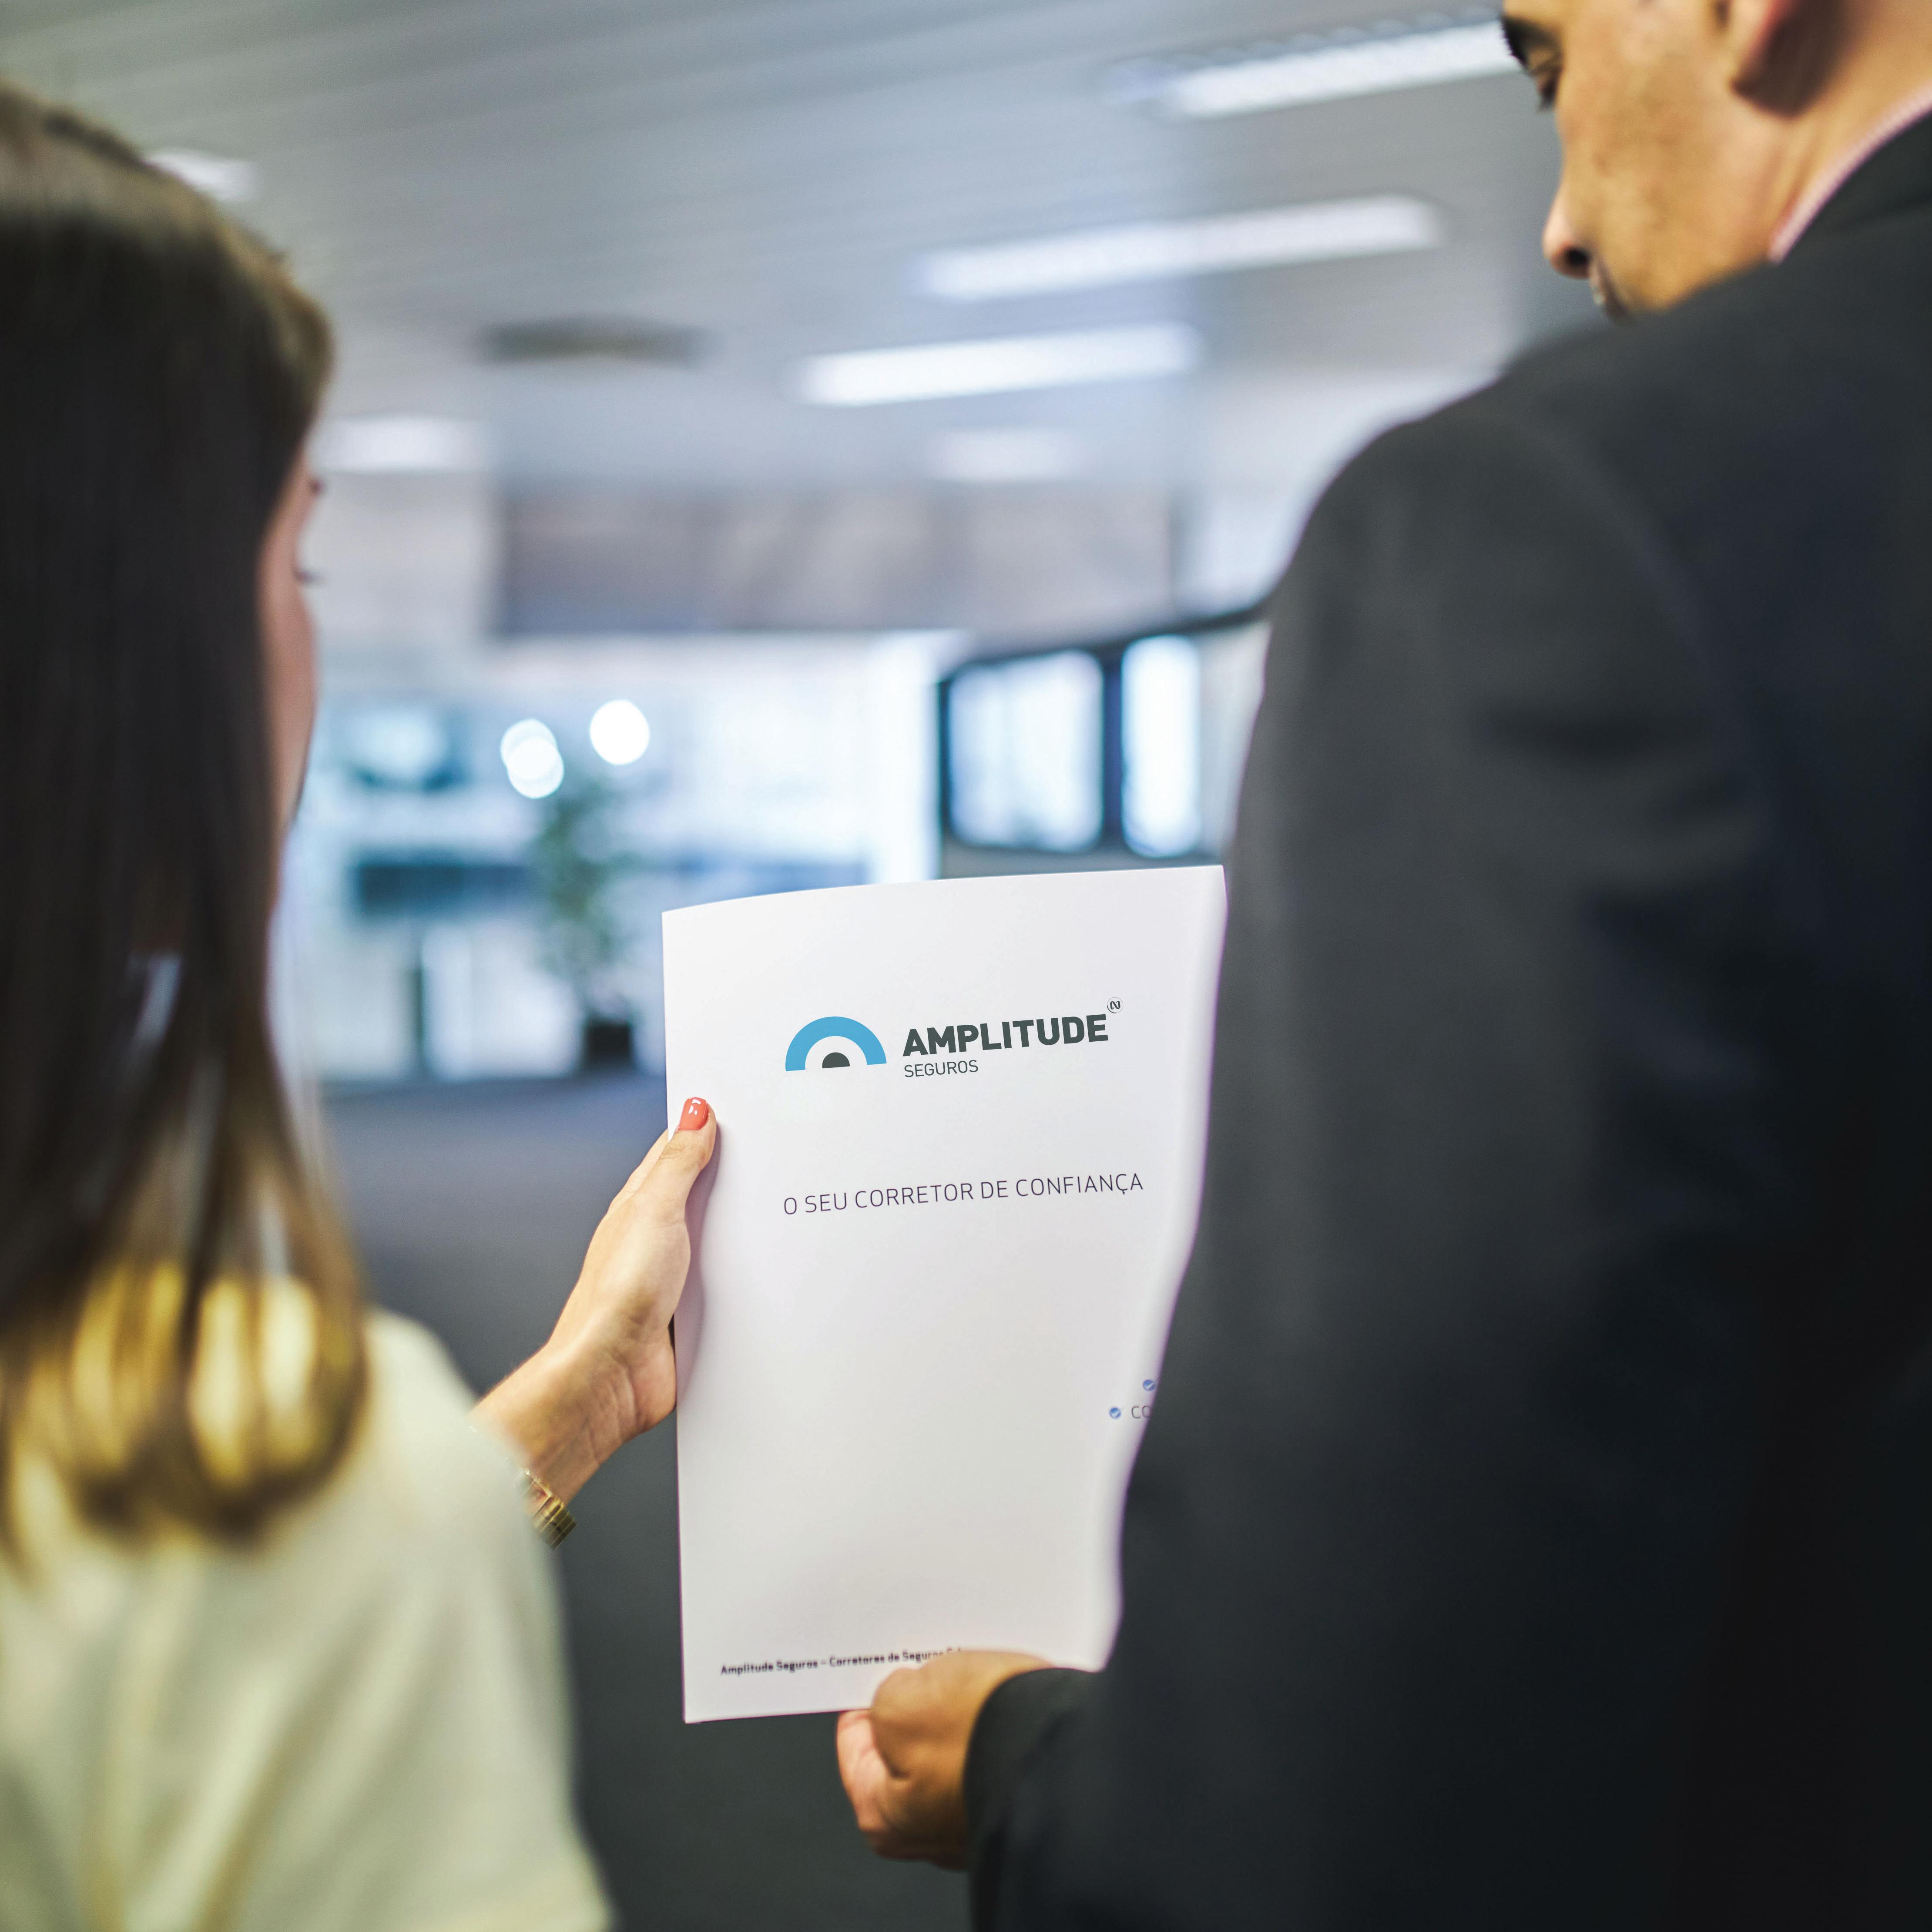
CHAPTER 04. PAGE 224
NORS VENTURES
In 2021, most of Nors Ventures' companies recorded positive results, with Sotkon and Amplitude standing out, whose EBITDA grew 13.6% and 31.4% respectively.
in thousands EUR sales 2021 var. Sotkon 12 254 1,5% Amplitude 1 297 19,0% Vitrum 970 -10,6% total 14 520 ebitda 2021 var. Sotkon 3 395 13,6% total 3 879 Amplitude 469 31,4% Vitrum 16 2020 12 068 1 090 1 085 14 243 2020 2 988 3 585 357 240 -93,5%
PAGE 225 CHAPTER 04.
4.2.2.4. Not all business unit activities are considered
Sotkon
Sotkon is a company with several patented products, dedicated to the design, manufacture and sale of modular systems for recycling and collection of solid urban waste through underground containers. Sotkon is present in several markets, namely Portugal, Spain, France and Turkey.
2021 continued to be marked by the pandemic, which deeply affected Sotkon’s economic activity, as well as by the challenges inherent to global supply chains, that resulted in the shortage of raw materials and other goods, which implied a substantial increase in production costs.
Despite the adverse conditions, in 2021 Sotkon maintained an excellent performance.
Consolidated turnover stood at 12.3 million Euros, recording an increase of 1.5% compared to the previous year. Regarding EBITDA, Sotkon continued to grow with +13.6%, closing the year with an absolute value of 3.4 million Euros. This result is essentially due to a more favourable mix of products and services. Also, during 2021 Sotkon liquidated Sotkon Turkey, which had no operational activity, maintaining its presence in this country through a joint venture with a local partner that already explored commercially this market.
The strategy followed by Sotkon in recent years, with investment and development of the activity in the markets where it has a direct presence (Portugal, Spain, France, Turkey and Morocco) and the expansion of the network of international distributors, through the selection of partners renowned in their sector of activity, have strongly contributed to the Group's consolidation of its turnover and international presence.

PAGE 226 CHAPTER 04.
Amplitude Seguros
Amplitude Seguros is a full-service insurance and risk consultant, operating in various segments and sectors of the economy. In 2021, Amplitude reported a turnover of 1.3 million Euros (+19.0% compared to 2020), reinforcing its relevant position in the segment of Insurance Brokers in Portugal.
The increase resulted from the acquisition of new clients and the increase in variable commissions related to the management of the insurance portfolio quality. The growth in sales is also reflected in the EBITDA, where Amplitude grew 31.4%.
Vitrum
Vitrum is positioned in the Angolan market as the company specialising in construction glass and in the production of vinyl projects. The particularly unfavourable macroeconomic conditions and the financial scenario in Angola led to a sharp contraction in construction activity that impacted Vitrum's sales, as the building glass market was particularly affected, having decreased overall by 10.6%.
This decrease in activity meant a 93.5% reduction in EBITDA to marginally positive values.

PAGE 227 CHAPTER 04.
5.3. risks and uncertainties
an unquestionable ability to overcome adversity
go around adversity, generating opportunities
In light of the extent of our international presence, there is a set of inherent risks that we quickly seek to identify and analyse in order to mitigate their impact on the organisation. We can categorise them as endogenous, when related to quality policies, human resources or financing, or exogenous, encompassing factors such as exchange rate variation, regulation, political instability or economic evolution. Thus, the year 2021 was marked by those that we present below.
CHAPTER 04. PAGE 230
credit risk
Exposure to default risk correlates with the commercial and operational activity of the Group's companies. In order to ensure its management, Nors has a specific department, governed by defined procedures and mechanisms for collecting financial and qualitative information. This department is responsible for evaluating debtors, for the fulfilment of their obligations, as well as the management of customer accounts and respective collection.
exchange rate risk
The global nature of our operation exposes us to the possibility of registering gains or losses resulting from variations in the exchange rate between the different currencies in which we operate. This risk, with an impact on shareholders' equity, earnings and cash flow, affects the operational view and the measurement of the capital invested in foreign subsidiaries with a currency other than the Euro. Occasionally, in order to mitigate this impact, foreign exchange forwards are contracted, namely in commercial operations where the purchase and sale currencies are different, and to financing instruments in a currency different from the functional currency, to implement a natural hedging with balances in the same currency. Within the scope of managing exchange rate risk on equity, we seek to opt, whenever possible, for natural hedging strategies.

The exchange rate risk is monitored on a monthly basis, to adapt the necessary coverage level, whenever necessary.
interest rate risk
Although part of our structured debt is contracted at a fixed rate, interest rate risk allows for fluctuations in the value of the financial charges borne by Nors in connection with borrowings in the countries in which we operate. However, with a comprehensive presence over several markets and different inherent economic environments, we obtain a financing and investment portfolio that is less sensitive to interest rate increases affecting certain countries.
We use our geographic dispersion to maintain diversified funding sources with different interest rates, mitigating the risk of interest rate hikes.
CHAPTER 04. PAGE 231
oil price risk
The oil price variation affects the economy of some markets in which we are present, becoming a risk indicator, namely in the Angolan market and, to a lesser extent, in the province of Alberta, Canada. The impact of the oil sector on the Angolan economy has a large influence on the country's economic performance, affecting the various economic agents in a direct or indirect manner - from the State to the business sector, and including individual consumers and families. Thus, as observed in the recent past, when there are significant drops in the price of oil on international markets, the impact on the Angolan economy is felt directly and expressively - tax revenues and the stock of foreign currency fall, leading to a contraction of imports and local trade. Most recently, the oil price increase has created liquidity in the Angolan market, demonstrating its’ high correlation with international commodity price.
In other markets, such as the province of Alberta in Canada, exposure to oil exploration correlates investment levels with the price of oil, reducing at times of falling oil prices and increasing at times of oil inflation, opening the door to conjunctural fluctuations in the activity of the group's operations in these markets.
liquidity risk
Another of the challenges identified lies in the inability to settle or comply with obligations within the defined time frames and at a reasonable price – the so-called liquidity risk. In this context, it is imperative to reach three objectives: liquidity, security and financial efficiency. Liquidity guarantees permanent, efficient access to sufficient funds in order to meet current payments on the respective due dates, as well as any requests for funds within the defined deadlines. Security, on the other hand, guarantees that the probability of default on the reimbursement of any investment of funds is minimised. Finally, financial efficiency guarantees that Nors and our business units/management structures maximise the value created and minimise the cost of the opportunity of holding short-term surplus liquidity.

CHAPTER 04. PAGE 232
Responsibility for managing liquidity risk is allocated to Nors ’ Finance Department: however, to ensure there is liquidity within the group, and in the various business units, there are working capital management parameters that safely and efficiently enable the return obtained to be maximised while minimising the costs of the associated opportunities.
At Nors , all existing surplus liquidity must be used to amortise short-term debt: to do so, the most pessimistic scenario is taken into account to analyse the maturity of each of the financial instruments classified as a liability, minimising the risk of liquidity linked to such obligations.

In a context of high uncertainty, regarding the evolution of the pandemic and, most recently, of the war in Ukraine, in order to mitigate the undesired effects, such as the reduction in turnover, constraints in
product availability or significative price increases, Nors implemented several various measures, including credit lines maintenance, reduction of indebtedness and careful revision of its investment plan for 2022.
The Board of Directors believes that, given its financial and liquidity situation, Nors will overcome the negative impacts resulting from international developments, without calling into question the going concern principle applied in the preparation of these financial statements.
At 31 December of 2021 and 2020, respectively, we recorded a net debt of 80.6 million Euros and 148.1 million Euros. These amounts are divided between Current and non-current loans, Cash in hand and at banks contracted with various institutions, as well as Debt securities with liquidity (Treasury bonds).
capital risk
The capacity to ensure the continuity of operations, providing adequate returns to shareholders and corresponding benefits to the other stakeholders of the company, is at the centre of our ambition. Therefore, careful management of the capital employed in the business, affirming an optimal capital structure and ensuring the necessary reduction of its cost, becomes fundamental. With a view to maintaining or adjusting the capital structure considered adequate, the Board of Directors may propose to the Shareholders' General Meeting any measures it deems necessary. Simultaneously, we seek to maintain a level of equity capital that is adequate to the characteristics of the core business, preserving a vision of continuity and expansion.
CHAPTER 04. PAGE 233
predicting tomorrow
4.4. 2022 in perspective
Compared to the troubled period of the pandemic in 2020, the second half of 2021 encompassed the pace of the recovery of global economic growth, due to the progress of population immunization and the easing of restrictive sanitary measures.
Despite the different growth speeds, the first months of 2022 reflect a trajectory of economic growth in all of the Group's geographies.
For Portugal, a more mature market with less volatility, growth is expected, in line with the full recovery of the sectors in which we operate, which are not so exposed to the risk of demand contraction due to the increase in inflation and potential interest rate increases in the Eurozone.
In Brazil, economic growth is accelerating along with international growth in commodity prices. Considering that the country is one of the main international producers and exporters, and despite the uncertainties about the political course in elections’ year, as well as the significant increases in interest rates to fight inflation, positive results are expected.
In Canada, we foresee record levels of potential market, namely due to the increase in the price of raw materials - particularly oil - that will provide an extraordinary boost to the market and the economy, altogether.
This macroeconomic scenario will also affect Angola, driven by the appreciation of the Kwanza in the foreign exchange markets, and by the continuity of the economic diversifying policy to reduce its’ almost total dependence on oil.
Although there are still global threats associated with the war in Ukraine, the effects of this conflict are being monitored and closely followed by the Head Office of Risk and Compliance that, together with the Group companies, has been anticipating impacts and preparing contingency plans to mitigate risks and undesirable effects. However, the outlook for 2022 is positive for all geographies, supported by the economic growth expected in each country and the closed deals in portfolio. In addition to these factors, the Group has substantially reduced its indebtedness in 2021, and is now in a solid financial position to face the challenges that may eventually affect the different businesses.
Thus, always with the prudence that characterizes us, we look optimistically to 2022, with opportunities to continue to strengthen the Group's financial position, by reducing Net Debt and increasing Financial Autonomy, while maintaining the firm objective of expanding the Mobility and Offroad businesses.
In conclusion, Nors ' Executive Board firmly states that the going-concern basis assumed for the preparation of the consolidated financial statements remains applicable.

PAGE 236 CHAPTER 04.
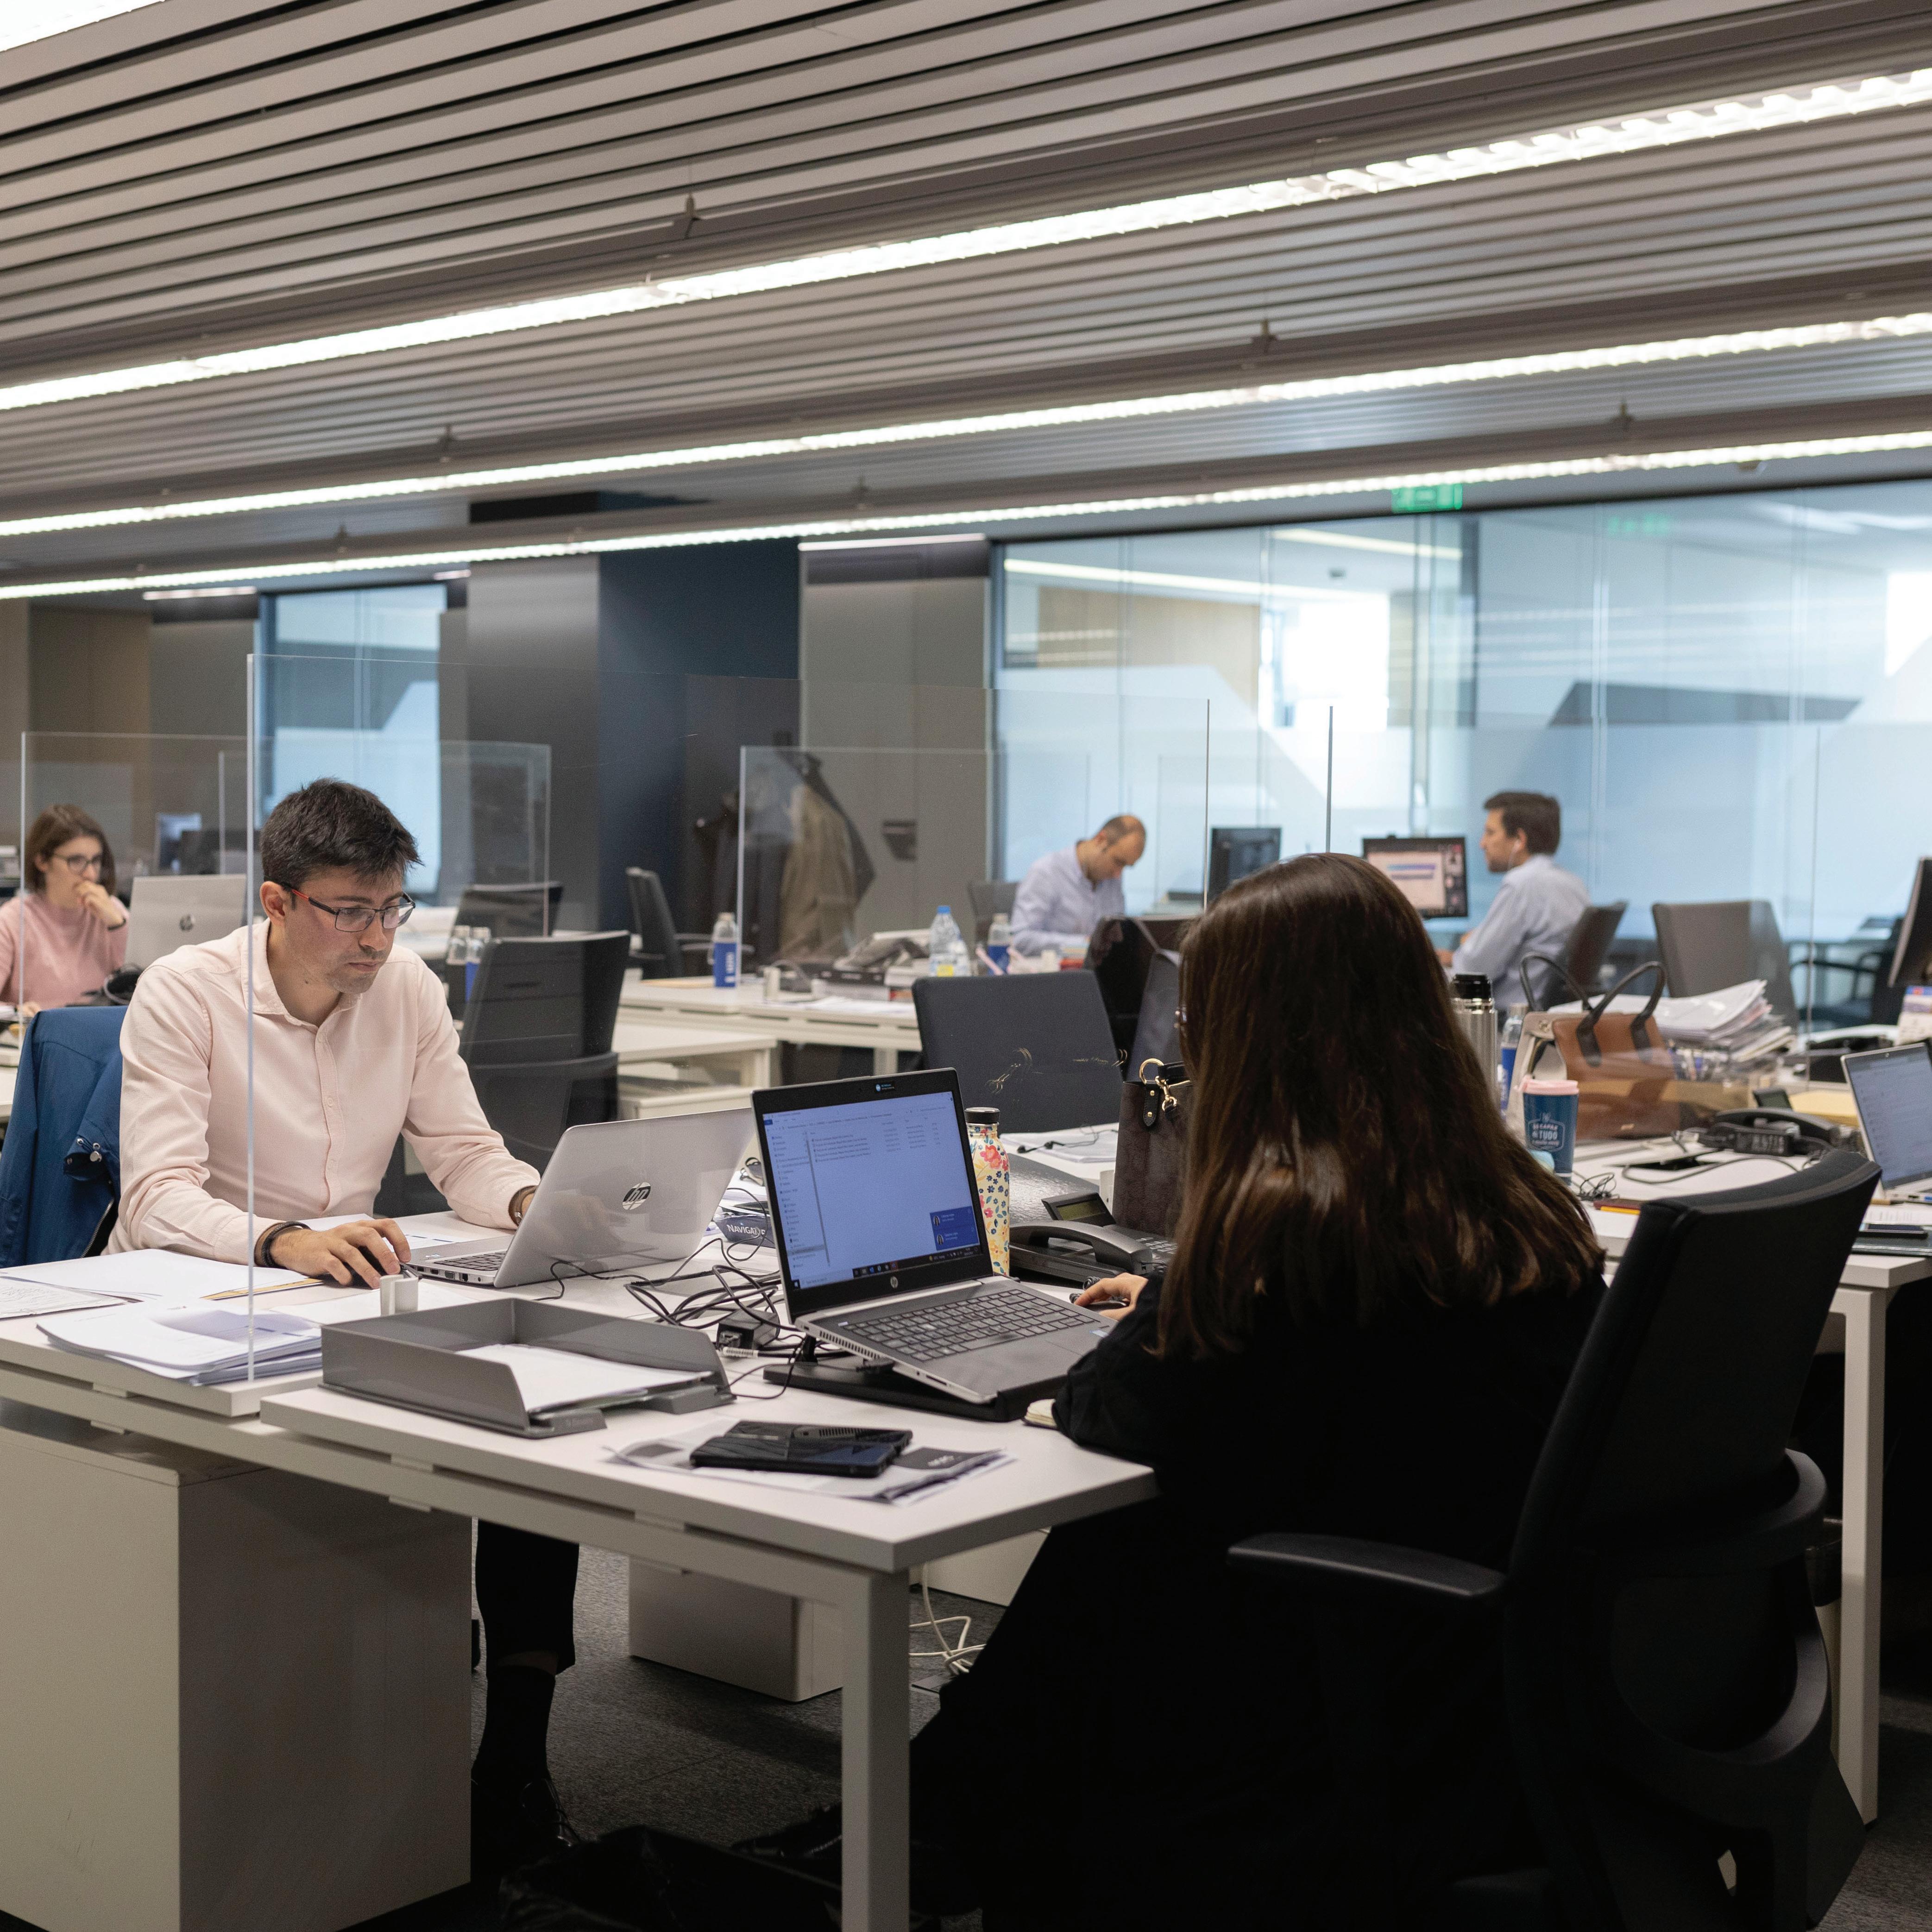
PAGE 237 CHAPTER 04.
statement on internal control over financial information
The Board of Nors is responsible for maintaining an appropriate internal control system. The company’s internal control over financial reporting is designed to provide reasonable assurance of the reliability of the information and the preparation of the financial statements for internal and external purposes, in accordance with prudent criteria determined by top management and in compliance with the international accounting standards and principles issued by the IASB.
The company’s internal control includes policies and processes that:
i. relate to maintaining records that provide reasonable detail in order to accurately and appropriately reflect the transactions and changes in the company’s assets, minimising its equity risk;
ii. provide a reasonable guarantee that the transactions are recorded as necessary to enable the financial statements to be prepared in compliance with IFRS, enabling uniform accounting of the financial information obtained from the different Nors companies in different countries;
iii.ensure, with a high degree of confidence, that the company’s receivables and expenditure are solely realised upon authorisation from the management and the board;
iv. provide reasonable security with regard to the timely prevention and detection of the inappropriate use of Nors ’ assets.
Due to the inherent limitations, all and any internal control over the financial reports may not prevent errors from being detected. In addition, projections of any assessment of efficacy in the future are subject to the risk that the controls may become inadequate due to changes in the conditions or that the degree of compliance with the policies and procedures may deteriorate.
Porto, 12th May 2022
the board of directors
Tomás Jervell
Álvaro Nascimento
Álvaro Neto
Artur Santos Silva
Francisco Jervell
Francisco Ramos
Jorge Nieto Guimarães
José Jensen Leite de Faria
José Manuel Bessa Leite de Faria
Júlio Rodrigues
Luís Jervell
Paulo Jervell
Rui Miranda

6.1. financial statements 183 6.1.1. Consolidated statement of financial position 184 6.1.2. Consolidated statement of income 186 6.1.3. Consolidated statement of comprehensive income 187 6.1.4. Consolidated statement of cash flows 188 6.1.5. Consolidated statement of changes in equity 189 6.2. annex to the financial statements 191 6.3. statutory auditor's report 310 a journey of performance financial information
5.1. financial statements
the transparency of the results
5.1.1. consolidated statement of financial position
consolidated statement of the financial position of Nors , S.A. (in thousands of Euros)
assets note 31.12.2021 non-current assets Intangible assets 6. 4 525 Tangible fixed assets 7. 134 950 Investment properties 8. 10 264 Assets through lease 9. 55 517 Goodwill 10. 57 896 Investments in associates and joint ventures 11.1. 100 478 Equity instruments at fair value through equity 11.2. 1 556 Debt instruments at amortized cost 11.3. 9 366 Deferred tax assets 12. 10 959 385 751 current assets Inventories 13. 228 918 Customers 14. 68 968 Income tax recoverable 15. 1 451 Other accounts receivable 16. 28 290 Deferrals 17. 5 310 Cash and Bank Deposits 18. 66 675 399 613 total assets 785 363 Other accounts receivable 16. 239 31.12.2020 3 441 124 542 11 710 56 268 59 475 80 750 516 10 037 9 100 356 170 230 443 63 300 4 755 23 476 4 499 50 105 376 578 732 748 333 PAGE 244 CHAPTER 05.
the certified accountant
Lúcia Mendonça the board of directors
Tomás Jervell
Álvaro Nascimento
Álvaro Neto
Artur Santos Silva
Francisco Jervell
Francisco Ramos
Jorge Nieto Guimarães
José Jensen Leite de Faria
José Manuel Bessa Leite de Faria
Júlio Rodrigues
Luís Jervell
Paulo Jervell
Rui Miranda
equity and liabilities equity Share capital 19. 30 000 Legal reserves 20. 6 000 Adjustments in financial assets 20. 71 686 Results carried over and other reserves 20. 75 025 182 711 net income for the year 45 565 228 275 non-controlling interests 21. 11 851 total equity 240 126 non-current liabilities Provisions 22. 8 067 Financing Obtained 23. 101 017 Liabilities through leasing 9. 63 020 Deferred tax liabilities 12. 4 286 176 389 current liabilities Suppliers 24. 167 251 Income tax payable 15. 4 820 Financing Obtained 23. 55 476 Liabilities through leasing 9. 23 776 Other accounts payable 25. 111 895 Deferrals 17. 5 629 Financial assets held for trading 26. 368 848 total liabilities 545 237 total equity and liabilities 785 363 30 000 6 000 65 502 53 276 154 778 14 745 169 523 15 071 184 594 10 507 125 764 67 182 3 656 207 110 154 164 3 852 82 436 19 367 74 586 6 621 17 341 044 548 154 732 748 PAGE 245 CHAPTER 05.
5.1.2. consolidated statement of income consolidated statement of income of Nors , S.A. (in thousands of Euros)
Lúcia Mendonça the board of directors
Tomás Jervell
Álvaro Nascimento
Álvaro Neto
Artur Santos Silva
Francisco Jervell
Francisco Ramos
Jorge Nieto Guimarães
José Jensen Leite de Faria
José Manuel Bessa Leite de Faria
Júlio Rodrigues
Luís Jervell
Paulo Jervell
Rui Miranda
income and expenses note 2021 Turnover 27. 1 016 021 Operating subsidies 443 Gains/Losses allocated to subsidiaries, associated companies and joint ventures 11.1. 21 771 Variations in production inventories -50 Cost of goods sold andmaterials consumed 13. -780 347 External supplies and services 28. -50 161 Staff costs 29. -95 426 Inventory impairments (losses/reversals) 22. -1 886 Inventory impairments (losses/reversals) 22. 171 Provisions and impairment losses (increases/decreases) 22. -4 226 Impairment of non-depreciable/amortizable investments (losses/reversals) Other income and gains 30. 10 534 Other expenses and losses 30. -10 735 earnings before depreciation, interest and taxes 106 109 Depreciation and amortization costs/reversals 6. a 9. -39 060 -575 Impairment of depreciable/amortizable investments (losses/reversals) operating income (before interest and taxes) 66 475 Net foreign exchange differences 33. 3 436 Income from financial activity 31. -12 128 income before tax 57 782 Income tax for the year 32. -12 232 net income for the year 45 550 net income for the period attributable to: Shareholders of the parent company 45 565 Non-controlling interests -15 net income for the financial year 45 550 Basic earnings per share 19. 1,52 2020 781 305 611 10 447 57 -596 235 -48 888 -74 758 -3 756 -135 247 11 491 -11 770 68 615 -31 269 37 347 -504 -13 751 23 092 -8 208 14 885 14 745 139 14 885 0,50
the certified accountant
PAGE 246 CHAPTER 05.
5.1.3. consolidated statement of comprehensive income
consolidated statement of comprehensive income of Nors , S.A. (in thousands of Euros)
the certified accountant
Lúcia Mendonça
the board of directors
Tomás Jervell
Álvaro Nascimento
Álvaro Neto
Artur Santos Silva
Francisco Jervell
Francisco Ramos
Jorge Nieto Guimarães
José Jensen Leite de Faria
José Manuel Bessa Leite de Faria
Júlio Rodrigues
Luís Jervell
Paulo Jervell
Rui Miranda
2021 consolidated net income for the financial year, including non-controlling interests 45 550 components of other comprehensive income for the year Variation in currency translation reserves 11 458 Other comprehensive income allocated to subsidiaries, associates and joint ventures 2 570 Late entries regarding previous financial year 114 Impact of accounting for exchange rate risk hedging instruments comprehensive consolidated income for the period 64 931 attributable to: Shareholders of the parent company 63 940 Non-controlling interests 991 Impact of actuarial variation with obligations for post-employment benefits 5 238 2020 14 885 -24 874 -5 257 -63 -17 372 -15 918 -1 454 -1 109 -955
PAGE 247 CHAPTER 05.
cash flows from operational activities
5.1.4. consolidated statement of cash flows consolidated Statement of Cash Flows of Nors , S.A. (in thousands of Euros) the
cash flow from funding activities
Artur Santos Silva
Francisco Jervell
Francisco Ramos
Jorge Nieto Guimarães
José Jensen Leite de Faria
José Manuel Bessa Leite de Faria
Júlio Rodrigues
Luís Jervell
Paulo Jervell
Rui Miranda
note 2021
Receivables from Customers 1 039 258 Payments to Suppliers -822 596 Payments to Staff -90 510 cash flow generated by operations 126 152 Income tax payments/receivables -9 357 Other receivables/payments 18. -8 024 cash flow from operating activities (1) 108 771 cash flows from investment activities payments concerning: Acquisition of Tangible Fixed Assets -13 996 Acquisition of Intangible Assets -3 194 Acquisition of Financial Investments 1.3. e 18. payments from investment activities -17 190 receivables from: Divestments of Tangible Fixed Assets 4 450 Financial divestments 1.3. e 18. 1 583 Interest and similar income 1 589 Dividends and additional/supplementary payments 18. 4 000 receivables from investment activities 11 622 cash flow from investment activities (2) -5 568
receivables from: Financing Obtained 23. 127 717 receivables from funding activities 127 717 payments concerning: Financing Obtained 23. -185 246 Operating Leases -16 443 Interests similar expenses -9 287 Dividends -6 000 payments from funding activities -216 976 cash flow from funding activities (3) -89 259 net change in cash and cash equivalents (4)=(1)+(2)+(3) 13 944 Perimeter variation Financial assets impairments 0 Net foreign exchange effect 2 626 net cash and cash equivalents - beginning of period 50 105 net cash and cash equivalents - end of period 18. 66 675 0 2020 795 599 -628 674 -78 517 88 426 -6 772 -575 81 060 -3 384 -1 090 -32 818 -37 292 2 171 40 830 4 325 4 000 51 325 14 033 193 188 193 188 -239 539 -13 606 -12 118 -6 000 -271 263 -78 075 17 018 0 -6 042 39 129 50 105 0
certified accountant
Mendonça
board of directors
Lúcia
the
Tomás Jervell Álvaro Nascimento Álvaro Neto
PAGE 248 CHAPTER 05.
5.1.5. consolidated statement of changes in equity
consolidated tatement of changes in equity of Nors , S.A. (in
balance at 1 January 2020 30 000 6 000 69 062 62 448 137 510 23 408 190 918 16 577 207 495 changes in the period: Appropriation of the consolidated 2019 9 211 14 197 -23 396 23 408 -23 408 Variation in currency translation reserves -23 396 -23 396 -24 874 Impact of actuarial variation with obligations for post-employment benefits -955 -1 013 3 303 -955 -1 013 -955 -1 013 -96 -1 478 -955 -1 109 Other comprehensive income allocated to subsidiaries, associates and joint ventures -5 257 -3 303 -5 257 -5 257 -5 257 Other -4 211 4 692 481 481 -73 408 -3 560 -3 172 -6 732 -23 408 -30 140 -1 646 -31 785 net profit for the period 14 745 14 885 consolidated comprehensive income for the year -15 918 14 745 -15 918 139 -1 454 -17 372
in the period: Distributions -6 000 -6 000 -6 000 -6 000 -6 000 -6 000 53 276 124 778 14 745 169 523 15 071 -6 000 -6 000 balance at 31 December 2020 30 000 6 000 65 502 184 594
of associated companies
transactions with equity holders
Reclassifications due to the sale
hedging instruments
reserves share capital legal reserves adjustments in financial assets res. carried over and other reserves total reserves Net Profit subtotal non controlling interests total
Impact of accounting for currency
capital attributable to parent company
thousands of Euros)
PAGE 249 CHAPTER 05.
capital attributable to parent company
transactions with equity holders
the certified accountant
Lúcia Mendonça
the board of directors
Tomás Jervell
Álvaro Nascimento
Álvaro Neto
Artur Santos Silva
Francisco Jervell
Francisco Ramos
Jorge Nieto Guimarães
José Jensen Leite de Faria
José Manuel Bessa Leite de Faria
Júlio Rodrigues
Luís Jervell
Paulo Jervell
Rui Miranda
balance at 1 January 2021 30 000 6 000 65 502 53 276 124 778 14 745 169 523 15 071 184 594 changes in the period: Appropriation of the consolidated 2020 7 614 7 132 14 745 -14 745 Variation in currency translation reserves 10 448 10 448 10 448 1 010 11 458 Impact of actuarial variation with obligations for post-employment benefits 5 238 5 238 5 238 5 238 Other -4 000 4 932 932 932 -437 494 6 184 27 749 33 932 -14 745 19 187 573 19 760 net profit for the period 45 565 45 550 consolidated comprehensive income for the year 63 940 45 565 63 940 -15 991 64 931
in the period: Distributions -6 000 -6 000 -9 779 -6 000 -6 000 -6 000 75 025 152 711 45 565 228 275 11 851 -6 000 -3 779 -3 779 -9 779 balance at 1 January 2021 30 000 6 000 71 686 240 126 Other comprehensive income allocated to subsidiaries, associates and joint ventures 2 570 2 570 2 570 2 570
reserves share capital legal reserves adjustments in financial assets res. carried over and other reserves total reserves Net Profit subtotal non controlling interests total
PAGE 250 CHAPTER 05.
5.2. annex to the financial statements
notes to the consolidated financial statements
Nors , S.A. is a public limited company, dating back to 1949, which has its registered offices are in Porto, Portugal. The company and its affiliates mainly carry out economic activities within the motor vehicle trade, namely cars, trucks, machinery and other industrial equipment, their components and workshop services.
Nors is the corporate and institutional name for a set of companies, while there are specific individual trade names depending on each company’s business.
The group is especially directly active in Portugal, Angola, Brazil and Canada, as well as in Turkey, the United States of America and Central Europe through joint ventures.
At 31st December 2021, Nors ’ subsidiaries, their respective registered offices and main line of business are as follows:
companies with registered offices based in Portugal business activity
Amplitude Seguros - Corretores de Seguros S.A.
Registered offices: Rua Brito Capelo, 97 4º A
4450-072 Matosinhos
ASFC S.G.P.S., S.A.
Registered offices: Rua Conde da Covilhã, 1637
4100-189 Porto
Asinter - Comércio Internacional, Lda.
Registered offices: Via Marechal Carmona,1637
4100 - 189 Porto
ASMOVE - Consultoria e Projetos Internacionais, S.A.
Registered offices: Rua Manuel Pinto de Azevedo, 711 - 2
4100-321 Porto
Auto-Sueco II Automóveis, S.A.
Registered offices: Rua Manuel Pinto de Azevedo, 711 - 2
4100-301 Porto
Nors , S.A.
Registered offices: Rua Manuel Pinto de Azevedo, nº 711, 1º
4100 - 189 Porto
Civiparts - Comércio de Peças e Equipamentos, S.A.
Registered offices: Rua D. Nuno Álvares Pereira, Armaz 13/14/15
Parque Oriente, Bobadela, 1990-502 Sacavém
Insurance Mediation
Management of shareholdings
International Trade
Import and export
Provision of consultancy services
Trade and Repair of vehicles
Shareholdings management in other companies
Trade, import and export of autoparts and provision of services
1. introductory note
PAGE 252 CHAPTER 05.
Galius - Veiculos, S.A.
Registered offices: Rua Conde Covilhã, 1637
4100 - 189 Porto
Grow - Formação Profissional, S.A.
Registered offices: Rua Manuel Pinto de Azevedo, 711 - 2
4140 - 010 Porto
Imosócia – Sociedade Imobiliária, S.A.
Registered offices: Rua Conde da Covihã, 1637
4100-189 Porto
NewOneDrive, S.A.
Registered offices: Parque Industrial do Seixal, 2ª Fase-Lote1, Quinta Nova, 2840-068 Paio Pires
Auto Sueco Portugal, S.A.
Registered offices: Rua Conde Covilhã, 1637
4149-010 Porto
Plurirent – Serviços de Aluguer, S.A.
Registered offices: Rua Conde da Covihã, 1637
4100-189 Porto
Promotejo - Compra e Venda de Propriedades, S.A.
Registered offices: Estrada Nacional 10, n.ºs 2-A e 2-B
2810-801 Almada
SARI Serviços Aftermarket Região Ibéria, S.A.
Registered offices: Rua Manuel Pinto de Azevedo, 4
4100-320 Porto
SGNT, SGPS S.A.
Registered offices: Rua da Restauração, 348
Miragaia - Porto
Sotkon Portugal - Sistemas de Resíduos, S.A.
Registered offices: Zona Industrial, Lote I - 27
2330-210 Entroncamento
Import, sale and After Sale of trucks and components
Vocacional Training Services
Purchase, sale,management and Administration of real estate
Trade in Parts and Accessories for vehicles
Import, sale and After Sale of Volvo Trucks, Buses, Gensets,marine engines and components
Purchase, sale and rental of passenger and goods vehicles without driver
Purchase, sale and rental of land and buildings
Provision ofmanagement support services
Management of shareholdings in other companies
Production and Marketing of underground containers for MSW
PAGE 253 CHAPTER 05.
companies with registered offices in other countries business activity
AgroNew Máquinas Agrícolas, Ltda
Registered offices: Rua Martinópolis nº720, Jardim Del Rey 15802-040 Catanduva, São Paulo (Brazil)
AS-Glass Angola, Lda.
Registered offices: Estrada do Cacuaco, Bairro Petrangol, Km 4,3, Ed.5, Município do Sambizanga, Luanda (Angola)
AS Parts Angola, Lda.
Registered offices: Estrada do Cacuaco, Bairro Petrangol, Km 3,4, Ed. 2, Município do Sambizanga, Luanda (Angola)
Auto-Maquinária, Lda.
Registered offices: Rua da Volvo, Bairro Candua, Município do Cacuaco, Luanda (Angola)
Nors International B.V.
Registered offices: Amsteldijk 166 - 6HG 1079LH Amsterdam (Holanda)
Auto Sueco Centro Oeste Concessionária de Veículos Ltda.
Registered offices: RDV BR 364, Km 16,3, Distrito industrial, Cuiabá (Brazil)
Auto Sueco São Paulo Concessionária de Veículos Ltda.
Registered offices: Av. Otaviano Alves de Lima, Nº4694 029.0001-000 São Paulo (Brazil)
Auto-Sueco (Angola), S.A.R.L.
Registered offices: Av. 4 de Fevereiro, 95-3º, Apartado 34 Luanda (Angola)
Auto-Sueco Kenya, Ltd.
Registered offices: Plot 12080 - Units 6 & 7 Apex Business Centre, Mombasa Rd, Industrial Area, Nairobi (Quénia)
Auto-Sueco (Tanzania) - Trucks, Busses and Const. Eq., Ltd.
Registered offices: Kipawa Industrial Area Plot Nr. 92 Nyerere (Pugo) Road, P.O.Box 9303
Dar es Salaam (Tanzânia)
Trade, Import and Export of agricultural equipment, parts, lubricating oils and After Sales services
Trade in glass for construction
Trade in parts and accessories for vehicles
Trade, import and distribution of industrial and construction equipment, parts, tires, fuel and After Sales services
Management of shareholdings in other companies
Sale and After Sale of new and used trucks
Sale and After Sale of new and used trucks and buses
Import, trade, and distribution of Volvo products
Import, export, sale ofmotor vehicles, industrial equipment, engines, and components
Import, export, sale ofmotor vehicles, industrial equipment, engines, and components
PAGE 254 CHAPTER 05.
Auto Sueco Moçambique, S.A.
Registered offices: Av. Da Namaacha nº 8274
Maputo (Moçambique)
Auto-Sueco Vehicles, Spare Parts & Services (Botswana)(Pty) Ltd.
Registered offices: Plot 47 - Gaborone International Commerce Park
Gaborone (Botswana)
Civiparts Angola SA
Registered offices: Estrada do Cacuaco, Km 3,4
Luanda (Angola)
Civiparts Maroc SA
Registered offices: Chemin Tertiaire 1015 Sidi Moumen 20400
Casablanca (Marrocos)
Civiparts España
Registered offices: Av. Castilla nº 32 Nave 58
28850 Madrid San Fernando Henr (Spain)
Expressglass Angola
Registered offices: Estrada do Cacuaco, Bairro Petrangol, Km 4,3, Ed.5, Município do Sambizanga, Luanda (Angola)
Kinlai
Registered offices: Armazém Mulemba, Rua da Volvo
Luanda (Angola)
Nors Brazil Participações, Ltda.
Registered offices: Rua Pamplona 818, 9º, Conj. 92
01405-001 São Paulo (Brazil)
Nors Canada, Inc
Registered offices: 1640 Enterprise Road
Mississauga, Ontário (Canadá) L4W 4L4
Sale and After Sale of new and used trucks and buses
Sale and After Sale of new and used trucks and trailers
Trade in parts and equipment
Trade in parts and equipment
Trade in parts and equipment of parts and accessories for vehicles
Sale and After Sale of Trucks
Import, trade, and distribution of Dongfeng products
Purchase and sale of properties
Shareholdings management in other companies
PAGE 255 CHAPTER 05.
Socibil - Imobiliária, SARL.
Registered offices: Avª 4 de Fevereiro nº.95, 3º., Apº.34.
Luanda (Angola)
Sogestim, Lda.
Registered offices: Estrada do Cacuaco, Km 3,4
Luanda (Angola)
Sotkon Anadolu
Turquia
Sotkon Spain
Registered offices:: C/ Orla Etorbidea 8-10 - Oficina 409 nivel 4º
20160 Lasarte, Oria (Spain)
Sotkon France, S.A.
Registered offices: 93, Rue de la Villette
69003 Lyon (França)
Sotkon Marocco, SARLAU
Registered offices: Twin Center, Angle Bds Zerktouni - Al Massira
Tour Ouest, 16e étage
20100 Casablanca (Marrocos)
Strongco Corporation
Registered offices: 1640 Enterprise Road
Mississauga, Ontário (Canadá) L4W 4L4
Strongco General Partner, Inc
Registered offices: 1640 Enterprise Road
Mississauga, Ontário (Canadá) L4W 4L4
Strongco Limited Partnership
Registered offices: 1640 Enterprise Road
Mississauga, Ontário (Canadá) L4W 4L4
Tecnauto Vehiculos, S.L.
Registered offices: Polígono Ind. El Montavo c/Nobel
37008 Salamanca (Spain)
Acquisition and sale of properties and land, and land development
Production and Marketing of underground containers for MSW
Production and Marketing of underground containers for MSW
Production and Marketing of underground containers for MSW
Production and Marketing of underground containers for MSW
Production and Marketing of underground containers for MSW
Shareholdings management in other companies and provision of management support services
Provision of management support services
Heavy equipment and components import, sale, rental and After Sales
Real Estate Management
PAGE 256 CHAPTER 05.
At 31st December 2021, Nors ’ joint ventures and affiliates, their respective registered offices and main line of business are as follows:
companies with registered offices based in Portugal business activity
Air Rail Portugal, Sociedade Unipessoal, Lda
Registered offices: Estrada Nacional 10, Apartado 2094
2696-801 São João da Talha - Loures
Ascendum, S.A.
Registered offices: Praça Marquês de Pombal nº3 A-5º
1250 - 161 Lisboa
Ascendum Agro - Equipamentos Agrícolas, S.A.
Registered offices: Parque Industrial Vale do Alecrim, Rua do Ferro 150 | 2950-007 Palmela
Ascendum Automóveis, unipessoal, Lda.
Registered offices: R. Vasco da Gama nº 15
2685-244 Portela
Ascendum Camiões, unipessoal, Lda.
Registered offices: Rua Manuel Madeira, Marcos da Pedrulha
3021-901 Coimbra
Ascendum Máquinas, Unipessoal, Lda
Registered offices: Rua do Brazil, nº 27 – Apartado 2094
2696-801 São João da Talha
Ascendum Portugal - Serviços de Gestão, SA
Registered offices: Rua do Brazil, nº 27 – Apartado 2094
2696-801 São João da Talha
Centrocar, S.A.
Registered offices: Rua Vilar do Senhor, 461 - 1º Andar
4455-213 Lavra - Matosinhos
Glomak SGPS, S.A.
Registered offices: Rua Vilar do Senhor, 461
4455-213 Lavra - Matosinhos
Groupauto Portugal & Palop - GPLP, Lda
Registered offices: Rua José Afonso, Edificio A. Santos, Quinta de Santa Rosa, 2680-593 Camarate - Loures
Trade and distribution of industrial equipment
Management of shareholdings Provision of technical administration, and management services
Sale and After Sales services for agricultural equipment
Motor vehicles Sales and After Sales
Truck Sales and After Sales
Import, Sale and After Sale of construction equipment
Management of shareholdings Provision of technical administration, andmanagement services
Sale and After Sale of construction equipment
Management of shareholdings in other companies
Rendering of consultancy and support services, management of partnerships in the area of automotive and parts management and distribution
PAGE 257 CHAPTER 05.
companies with registered offices in other countries business activity
Air-Rail, S.L.
Registered offices: Calle Alsasua, 16
28023 Madrid (Spain)
Air-Rail Marrocos
Marrocos
Air-Rail Polska, Sp. z.o.o
Registered offices: Szpitalna 8/9, 00-031 Warszawa
Polónia
Ascendum Construction Equipment, INC.
Registered offices: 9115 Harris Corner Parkway, suite 450
Charlotte, NC 28269 (Estados Unidos da América)
Ascendum Maquinaria México, S.A de C.V
Carretera Mexico Queretaro KM 32.5
Ascendum Turk Makina, Limited Sirketi
Registered offices:Fatih Mahallesi Katip Çelebi Caddesi, nº43
Tuzla - 34940 - Istambul (Turquia)
Ascendum España, S.L.
Registered offices: Parque Empresarial San Fernando, Edificio Munich, Planta 3, 28830 MADRID (Spain)
Ascendum, GmbH
Registered offices: Grafenholzweg 1
5101 Bergheim / Salzburg (Áustria)
Ascendum Baumaschinen Österreich GmbH
Registered offices: Grafenholzweg 1
5101 Bergheim / Salzburg (Áustria)
Ascendum Épitögépek Hungária
Registeredoffices:KAPCSOLAT1141BudapestNótáriusu.13-15 (Hungria)
Ascendum Gradevinski Strojevi
Registered offices: Karlovacka 94 10250 Zagreb - Lucko (Croácia)
Trade and distribution of industrial equipment
Trade and distribution of industrial equipment
Trade and distribution of industrial equipment
Sale, After Sale and rental of construction equipment
Sale, After Sale and rental of construction equipment
Sale, After Sale and rental of construction equipment
Management of shareholdings in other companies
Management of shareholdings
Provision of technical administration, and management services
Importer of Machinery
Sale and After Sale: Construction equipment
Importer of Machinery
Sale and After Sale: Construction equipment
Importer of Machinery
Sale and After Sale: Construction equipment
PAGE 258 CHAPTER 05.
Ascendum Machinery SRL
Registered offices:Sos. Odaii, nr. 439, Sector 1 013606 Bucuresti (Roménia)
Ascendum Stavebeni Stroje Czech
Registered offices: Plzenská 430 CZ - 267 12 Lodenice (República Checa)
Ascendum Stavebné Stroje Slovensko
Registered offices: Pestovatelská 4316/10, 821 04 BratislavaRužinov-Ružinov (Eslováquia)
Bergmann Americas, INC.
Registered offices: 160 Conway Black Road Spartanburg, SC 29307 (USA)
Centrocar España
Registered offices: Pol. Ind. La Sendilla, Avda. de las Palmeras, esq. C/ del Castaño | 28350 Ciempozuelos - Madrid (Spain)
Centrocar Moçambique
Registered offices: Avenida da namaancha, nº 730
Maputo (Moçambique)
Importadora Distribuidora de Maquinaria Industrial
ZEPHIR, S.L.
Registered offices: Calle Alsasua, 16 | 28023 Madrid (Spain)
Tea Aloya, Inmobiliaria, S.A.U.
Registered offices: Parque Empresarial San Fernando, Edificio Munich, Planta 3, 28830 Madrid (Spain)
Volmaquinaria de Construcciòn España, S.A.U.
Registered offices: Parque Empresarial San Fernando, Edificio Munich, Planta 3, 28830 Madrid (Spain)
Volrental Atlântico, S.A.U
Registered offices: Carretera de Castilla nº167
Betanzos - La Coruña (Spain)
Importer of Machinery
Sale and After Sale: Construction equipment
Importer of Machinery
Sale and After Sale: Construction equipment
Importer of Machinery
Sale and After Sale: Construction equipment
Construction equipment sales, After Sales and rental
Sale and After Sale
Construction equipment
Sale and After Sale
Construction equipment
Import and trade of industrial equipment
Acquisition and sale of properties, and land, construction of buildings, and land development
Importer of Machinery
Sale and After Sale: Construction equipment
Rental of construction equipment
PAGE 259 CHAPTER 05.
2. main accounting policies
The main accounting policies adopted in the preparation of the attached consolidated financial statements are the following
2.1. basis for presentation
The Nors Group’s consolidated Financial Statements were prepared using the financial and accounting information of the companies included in the consolidation. To do so, the historic cost principles were followed, as well as the principles of fair value for some financial instruments, on a going concern basis. (note 2.4)
These financial statements were prepared in accordance with the International Financial Reporting Standards (IFRS) and the International Accounting Standards (IAS) issued by the International Accounting Standards Board (IASB) and Interpretations issued by the International Financial Reporting Interpretations Committee (IFRIC) or by the previous Standing Interpretations Committee (SIC), in force on 1st January 2021 and approved by the European Union.
For the companies considered to be joint ventures, where Nors ’ interests are consolidated using the Equity Method, their registered offices and the share of capital held are described in notes 1 and 4.
During the year ended 31st December 2021, the consolidated statement of financial position for the year ended 31st December 2020 has been restated due to the change in presentation of asset values associated with repurchase agreements (forward and put option). These values are now presented as Tangible fixed assets instead of Assets through lease, as detailed in the table below:
During the 2021 financial year, the following standards and interpretations became applicable for this year or the following years:
currency closing exchange rate 2020 average historical exchange rate 2020 BRL closing exchange rate 2021 average historical exchange rate 2021 6,3101 6,3779 6,3735 5,8943 before reclassification reclassification after reclassification Tangible fixed assets 97 656 26 885 124 542 Assets through lease 83 153 -26 885 56 268 PAGE 260 CHAPTER 05.
1.Recently issued pronouncements already adopted by the Group in the preparation of the financial statements are the following:
a. Covid-19-Related Rent Concessions Amendment to IFRS 16
In May 2020, the International Accounting Standards Board (Board) issued Covid-19-Related Rent Concessions, which amended IFRS 16 Leases.
If certain conditions are met, the Amendment would permit lessees, as a practical expedient, not to assess whether particular Covid-19-related rent concessions are lease modifications. Instead, lessees that apply the practical expedient would account for those rent concessions as if they were not lease modifications, so that, for example, the amount of rent forgiven on or before 30 June 2021 is taken to income the same year that the concession is granted, instead of being allocated over the duration of the contract as would be the case were the practical expedient not allowed.
The Amendment shall be applied for annual reporting periods beginning on or after 1 June 2020.
In 2021, IASB has extended the practical expedient by 12 months – i.e. permitting lessees to apply it to rent concessions for which any reduction in lease payments affects only payments originally due on or before 30 June 2022.The 2021 amendments are effective for annual reporting periods beginning on or after 1 April 2021. Lessees are permitted to apply it early.
The 2021 amendments are applied retrospectively with the cumulative effect of initially applying it being recognised in opening retained earnings. The disclosure requirements of Paragraph 28(f)1 of IAS 8 Accounting Policies, Changes in Accounting Estimates and Errors do not apply on initial application.
The application of this expedient had implications only for the comparative period of the financial statements by its application in that fiscal year, but without a material impact on them.
PAGE 261 CHAPTER 05.
b. Interest Rate Benchmark Reform – Phase 2 (Amendments to IFRS 9, IAS 39, IFRS 7, IFRS 4 and IFRS 16)
In August 2020, the IASB issued Interest Rate Benchmark Reform—Phase 2, which amends IFRS 9 Financial Instruments, IAS 39 Financial Instruments: Recognition and Measurement, IFRS 7 Financial Instruments: Disclosures, IFRS 4 Insurance Contracts and IFRS 16 Leases.The objective of the Amendments is to assist entities with providing useful information to users of financial statements and to support preparers in applying IFRS Standards when changes are made to contractual cash flows or hedging relationships, as a result of the transition from an IBOR benchmark rate to alternative benchmark rates, in the context of the ongoing risk-free rate reform (‘IBOR reform’). The Amendments are the results of the second phase of the IASB project that deals with the accounting implications of the IBOR reform, which originated the Interest Rate Benchmark Reform (Amendments to IFRS 9, IAS 39 and IFRS 7) issued by the IASB on 26 September 2019. They complement the first phase of the project which dealt with pre-replacement accounting implications of the IBOR reform and which have been issued by the IASB in 2019.
The Amendments shall be applied retrospectively for annual periods beginning on or after 1 January 2021. The application of these changes has not caused material changes in the financial statements.
c. Extension of the Temporary Exemption from Applying IFRS 9 (Amendments to IFRS 4)
IASB has issued Extension of the Temporary Exemption from Applying IFRS 9 (Amendments to IFRS 4) ('the Amendments') on 25 June 2020.
The objective of the Amendments is to extend the expiry date of the temporary exemption from applying IFRS 9 (i.e. to 2023) in order to align the effective dates of IFRS 9 Financial Instruments with IFRS 17 Insurance Contracts. The application of these changes has not caused material changes in the financial statements.
PAGE 262 CHAPTER 05.
2. The Group decided to opt for not having an early application of the following standards endorsed by EU:
a. Reference to the Conceptual Framework (Amendments to IFRS 3)
In May 2020 the IASB issued Reference to the Conceptual Framework, which made amendments to IFRS 3 Business Combinations.The amendments updated IFRS 3 by replacing a reference to an old version of the Board’s Conceptual Framework for Financial Reporting with a reference to the latest version, which was issued in March 2018. The Amendments shall be applied to business combinations for which the acquisition date is on or after the beginning of the first annual reporting period beginning on or after 1 January 2022. Earlier application is permitted if at the same time or earlier an entity also applies all the amendments made by Amendments to References to the Conceptual Framework in IFRS Standards, issued in March 2018. The adoption of these changes will not cause material impacts on the financial statements.
b. Property, Plant and Equipment – Proceeds before Intended Use, Amendments to IAS 16 Property, Plant and Equipment
In May 2020, the IASB issued Property, Plant and Equipment—Proceeds before Intended Use, which made amendments to IAS 16 Property, Plant and Equipment. The Amendments would prohibit deducting from the cost of an item of property, plant and equipment any proceeds from selling items produced while bringing that asset to the location and condition necessary for it to be capable of operating in a manner intended by management. Instead, an entity would recognise those sales proceeds in profit or loss. The Amendments shall be applied retrospectively for annual periods beginning on or after 1 January 2022, with earlier application permitted. The adoption of these changes will not cause material impacts on the financial statements.
c. Onerous Contracts - Cost of Fulfilling a Contract
In May 2020, the IASB issued Onerous Contracts—Cost of Fulfilling a Contract, which made amendments to IAS 37 Provisions, Contingent Liabilities and Contingent Assets. The objective of the Amendments is to clarify the requirements of IAS 37 on onerous contracts regarding the assessment of whether, in a contract, the unavoidable costs of meeting the obligations under the contract exceed the economic benefits expected to be received under it.
PAGE 263 CHAPTER 05.
The Amendments shall be applied for annual periods beginning on or after 1 January 2022, with earlier application permitted. The adoption of these changes will not cause material impacts on the financial statements.
d. Annual Improvements to IFRS Standards 2018 – 2020
On 14 May 2020, the IASB issued Annual Improvements to IFRS Standards 2018–2020 containing the following amendments to IFRSs:
I permit an entity that is a subsidiary, associate or joint venture, who becomes a first-time adopter later than its parent and elects to apply paragraph D16(a) of IFRS 1 First-time Adoption of International Financial Reporting Standards, to measure the cumulative translation differences using the amounts reported by the parent, based on the parent’s date of transition to IFRSs;
II clarify that the reference to fees in the 10 per cent test includes only fees paid or received between the borrower and the lender, including fees paid or received by either the borrower or lender on the other’s behalf;
III remove the potential confusion regarding the treatment of lease incentives applying IFRS 16 Leases as was illustrated in Illustrative Example 13 accompanying IFRS 16; and
IV remove the requirement in paragraph 22 of IAS 41 Agriculture for entities to exclude cash flows for taxation when measuring fair value applying IAS 41.
The Amendments shall be applied for annual periods beginning on or after 1 January 2022, with earlier application permitted. The adoption of these changes will not cause material impacts on the financial statements.
e. Amendments to IAS 1 Presentation of Financial Statements and IFRS
Practice Statement 2: Disclosure of Accounting policies
Following feedback that more guidance was needed to help companies decide what accounting policy information should be disclosed, the Board has today issued amendments to IAS 1 Presentation of Financial Statements and IFRS Practice Statement 2 Making Materiality Judgements. The key amendments to IAS 1 include: i) requiring companies to disclose their material accounting policies rather than their significant accounting policies; clarifying that accounting policies related to immaterial transactions, other events or conditions are themselves immaterial and as such need not be disclosed; and clarifying that not all accounting policies that relate to material transactions, other events or conditions are themselves material to a company’s financial statements.
PAGE 264 CHAPTER 05.
The Board also amended IFRS Practice Statement 2 to include guidance and two additional examples on the application of materiality to accounting policy disclosures. The amendments are consistent with the refined definition of material:
“Accounting policy information is material if, when considered together with other information included in an entity’s financial statements, it can reasonably be expected to influence decisions that the primary users of general purpose financial statements make on the basis of those financial statements”.
The amendments are effective from 1 January 2023 but may be applied earlier. The Group is evaluating the impacts that these changes will have on its financial statements and disclosures, and preliminary analysis indicates that the impact will not be material.
f. Amendments to IAS 8 Accounting policies, Changes in Accounting Estimates and Errors: Definition of Accounting Estimates
The IASB has issued amendments to IAS 8 Accounting Policies, Changes in Accounting Estimates and Errors to clarify how companies should distinguish changes in accounting policies from changes in accounting estimates, with a primary focus on the definition of and clarifications on accounting estimates. The amendments introduce a new definition for accounting estimates: clarifying that they are monetary amounts in the financial statements that are subject to measurement uncertainty.
The amendments also clarify the relationship between accounting policies and accounting estimates by specifying that a company develops an accounting estimate to achieve the objective set out by an accounting policy. The effects of changes in such inputs or measurement techniques are changes in accounting estimates.
The amendments are effective for periods beginning on or after 1 January 2023, with earlier application permitted, and will apply prospectively to changes in accounting estimates and changes in accounting policies occurring on or after the beginning of the first annual reporting period in which the company applies the amendments.
The adoption of these changes will not cause material impacts on the financial statements.
PAGE 265 CHAPTER 05.
IFRS 17 – Insurance Contracts
The IASB issued on 18 May 2017 a standard that superseded IFRS 4 and completely reformed the treatment of insurance contracts. The standard introduces significant changes to the way in which the performance of insurance contracts is measured and presented with various impacts also at the level of the financial position. The standard expected to be effective for annual periods beginning on or after 1 January 2023.This standard will not be applicable to the Group as it does not include insurance companies.
3. Recently Issued pronouncements that are not yet effective for the Group , as they have not been endorsed by the European Union:
a. Clarification requirements for classifying liabilities as current or non-current (amendments to IAS 1 – Presentation of Financial Statements)
IABS issued on 23 January 2020 narrow-scope amendments to IAS 1 Presentation of Financial Statements to clarify how to classify debt and other liabilities as current or non-current. IABS issued on 23 January 2020 narrow-scope amendments to IAS 1 Presentation of Financial Statements to clarify how to classify debt and other liabilities as current or non-current. The amendments clarify an IAS 1 criteria for classifying a liability as non-current: the requirement for an entity to have the right to defer the liability’s settlement at least 12 months after the reporting period. The amendments aim to:
I specify that an entity's right to defer settlement must exist at the end of the reporting period;
II clarify that the classification is not affected by management's intentions or expectations as to whether the entity will exercise its right to postpone settlement
III clarify how loan conditions affect classification; and
IV larify the requirements to classify the liabilities that an entity will settle, or may settle, by issuing its own equity instruments. This amendment is effective for periods starting on 1 January 2023. The adoption of these changes will not cause material impacts on the financial statements.
g.
PAGE 266 CHAPTER 05.
b. Amendments to IAS 12: deferred tax related to assets and liabilities arising from a single transaction
The IASB (‘ the Board’) issued amendments to IAS 12 - ‘Income Taxes’, on 7 May 2021. The amendments require companies to recognise deferred tax on transactions that, on initial recognition, give rise to equal amounts of taxable and deductible temporary differences. In specified circumstances, companies are exempt from recognising deferred tax when they recognise assets or liabilities for the first time. Previously, there had been some uncertainty about whether the exemption applied to transactions such as leases and decommissioning obligations—transactions for which companies recognise both an asset and a liability. The amendments clarify that the exemption does not apply and that companies are required to recognise deferred tax on such transactions. The aim of the amendments is to reduce diversity in the reporting of deferred tax on leases and decommissioning obligations. The amendments are effective for annual reporting periods beginning on or after 1 January 2023. The adoption of these changes will not cause material impacts on the financial statements.
c. Amendments to IFRS 17 - Insurance contracts: Initial Application of IFRS 17 and IFRS 9 – Comparative Information
The International Accounting Standards Board (IASB) has issued a narrow-scope amendment to the transition requirements in IFRS 17 - Insurance Contracts, providing insurers with an option aimed at improving the usefulness of information to investors on initial application of the new Standard. The amendment does not affect any other requirements in IFRS 17. IFRS 17 and IFRS 9 Financial Instruments have different transition requirements. For some insurers, these differences can cause temporary accounting mismatches between financial assets and insurance contract liabilities in the comparative information they present in their financial statements when
applying
IFRS 17 and IFRS 9 for the first time. The amendment will help insurers to avoid these temporary accounting mismatches and, therefore, will improve the usefulness of comparative information for investors. IFRS 17, including this amendment, is effective for annual reporting periods starting on or after 1 January 2023. These changes will not apply to the Group as it does not include insurance companies.
PAGE 267 CHAPTER 05.
2.2. consolidation principles
Nors adopts the following consolidation principles:
a. Financial investments in Nors ’ companies
Financial holdings in companies in which Nors has a controlling interest were included in the attached consolidated financial statements, using the full consolidation method. Nors is understood to have controlling interest when the company has power over the affiliate or is exposed or has rights over the variable returns of the company in question. This power arises directly (for example, voting right at the general assembly and/or board of directors) or in a complex manner (for example, through contractual agreements with third parties). The ability to allocate returns is determined by the effective power the Nors holds in the affiliate without the need to join forces with third parties. The net income and other items of other comprehensive income and equity of the controlled companies corresponding to a third-party holding in them (noncontrolling interests) are presented in the consolidated statement of financial position and the consolidated statement of other comprehensive income in specific items of “Non-controlling interests”. The Nors companies included in the consolidated financial statements are detailed in note 4. Accrued losses of a subsidiary are attributed to non-controlling interests, in the proportions held, which may imply recognising negative non-controlling interests. In business combinations prior to 2010, the acquisition method is followed. The assets and liabilities of each subsidiary are identified at fair value on the date of acquisition. Any surplus from the acquisition cost compared to the fair value of net assets and liabilities acquired is recognised as Goodwill (note 2.2 c)). If the difference between the acquisition cost and the fair value of the acquired net assets and liabilities is negative, this is recognised as a gain in the income statement for the year, after reconfirming the attributed fair value. Interests of the holders of non-controlling interests are shown in proportion to the fair value of the identified assets and liabilities.
PAGE 268 CHAPTER 05.
For business combinations that took place after 1 January 2010, Nors applied the revised IFRS 3 standard. According to this revised standard, the acquisition method continues to be applied to business combinations, with some significant changes: I all amounts that make up the purchase price are valued at fair value, with the transaction-to-transaction option of measuring “non-controlling interests” by the proportion of the value of the net assets of the entity acquired, or at the fair value of the assets and liabilities acquired. II all costs associated with the acquisition are recorded as expenses. Since 1 January 2010, the revised IAS 27 has also been implemented. This requires that all transactions with “non-controlling interests” be recorded in Equity, when there is no change in the control over the Entity, without the possibility of recording goodwill or gains or losses. When there is loss of control over an entity, any remaining interest in the entity is remeasured at fair value, and a gain or loss is recognised in profit or loss for the year. The income of subsidiaries that are acquired or sold during the period is included in the income statement as from the date of taking or losing control.
Whenever necessary, adjustments to the financial statements of the subsidiaries are made to align their accounting policies with those used by Nors . Transactions, margins generated between group companies, balances and dividends distributed among Nors companies are eliminated during the consolidation process.
In situations where Nors has, in substance, control over other entities created with a specific purpose, even if it does not have a direct shareholding in those entities, these are consolidated using the full consolidation method.
b. Financial investments in associates and joint ventures
Financial investments in associates and joint ventures (companies where Nors has a significant influence but does not hold control over them by participating in the financial and operational decisions - generally investments representing between 20% and 50% of the capital of a company and/or for which there are shareholder agreements) are recorded using the equity method.
PAGE 269 CHAPTER 05.
According to the equity method, financial investments are initially recorded at their acquisition cost and annually adjusted by the amount corresponding to the group’s share in the variations in equity (including net income) of the associates against gains or losses for the year, plus the dividends received and possible gains or losses generated in operations with other group companies, which affect the value of the group’s assets.
The differences between the acquisition cost and the fair value of the associate’s identifiable assets and liabilities at the date of acquisition, if positive, are recognised as Goodwill. If those differences are negative, they are recorded as a gain for the period in the item “Other Income and Gains” in the income statement, after reconfirming the attributed fair value.
An evaluation is made of the investments in associates when there are signs that the asset might be impaired, and the impairment losses that are confirmed are recorded as an expense. When impairment losses recognised in previous periods no longer exist, they are reversed.
When Nors ’ share in the accrued loses of the associate company exceeds the book value of the financial investment, the investment is reported at nil whilst the equity of the affiliate is not positive. An exception to this is when Nors has taken on commitments with the associate, in which case a provision is recorded to meet those obligations.
Unrealised gains in transactions with these associates are eliminated in proportion to Nors ’ interest in them, to offset the financial investment in it. Unrealised losses are eliminated in a similar manner, but only up to the point where the asset transferred has no sign of impairment.
Whenever necessary, adjustments to the financial statements of the associates are made to align their accounting policies with those adopted by Nors .
PAGE 270 CHAPTER 05.
c. Goodwill
Following the transition to the IFRS and as permitted by IFRS 1 - “First time Adoption of IFRS”, Nors chose to maintain the Goodwill resulting from business combinations that took place prior to the transaction date, recorded according to the previous accounting rules used by Nors . The value of Goodwill is not amortised but is tested annually to check if there are any impairment losses. The recoverable amount is determined based on the highest out of the present value of estimated future cash flows expected to arise from continued use of the asset, and the value of the disposal less its sale costs. Goodwill impairment losses recorded in the financial year are recorded in the income statement for the year in the item “Impairment of non-depreciable assets”. Impairment losses related to Goodwill cannot be reversed.
Up to 31 January 2009, the contingent acquisition prices were determined based on the best estimate of probable payments, while subsequent changes were recorded in Goodwill. Since 1 January 2010, Goodwill is no longer corrected according to the final calculation of the value of the contingent price paid, that impact being recognised in profit or loss.
PAGE 271 CHAPTER 05.
d.
Conversion of financial statements of foreign entities
Assets and liabilities expressed in the financial statements of foreign companies (companies that do not use the euro as their working currency) are converted into Euros using the exchange rates in force on the reference date of the consolidated statement of financial position. Income and expenses, as well as cash flows, are converted into Euros using the average foreign exchange rates ascertained during the financial year. The foreign exchange difference generated after 1 January is recorded in equity in the item “Other Reserves”. Accrued foreign exchange differences generated up to 1 January 2009 (date of transition to IFRS) were cancelled in the equity item “Other reserves”.
Whenever a foreign entity is sold or liquidated, the accrued foreign exchange difference is recognised in the income statement as a gain or a loss on the disposal or on the liquidation.
In the 2021 and 2020 financial years, the rates used for converting Euros in the accounts of consolidated foreign entities were as follows:
currency closing exchange rate 2020 average historical exchange rate 2020 BRL USD CAD BWP NAD MZN AOA MAD CVE TZS closing exchange rate 2021 average historical exchange rate 2021 6,3101 6,3779 1,1326 1,1827 1,4393 1,4826 13,2802 13,0880 18,0625 17,4766 72,4030 77,7584 624,5396 740,2572 10,5115 10,7805 110,2650 110,2650 2 617,2926 2 621,7057 KES 127,9932 129,7641 TRY 15,2335 10,5124 6,3735 5,8943 1,2271 1,1422 1,5633 1,5300 13,2626 13,0699 18,0219 18,7655 92,7767 79,4089 809,4581 661,6631 11,0446 10,8328 110,2650 110,2650 2 764,4883 2 630,7201 133,8950 121,6465 9,1131 8,0547 before reclassification reclassification after reclassification Tangible fixed assets 97 656 26 885 124 542 Assets through lease 83 153 -26 885 56 268 PAGE 272 CHAPTER 05.
2.3. main valuation criteria
The group uses the following main valuation criteria to prepare its consolidated financial statements:
a. Tangible fixed assets
Tangible fixed assets acquired up to 1 January 2009 (date of transition to IFRS), are recorded at their deemed cost, which corresponds to their acquisition cost, or re-evaluated acquisition cost according to the generally accepted accounting principles in Portugal (and in the countries of Nors ’ respective subsidiaries) up until that date, less any accrued depreciation and impairment losses.
Tangible fixed assets acquired after that date are recorded at acquisition cost, less the accrued depreciation and accrued impairment losses. Impairment losses detected in the realisable value of the tangible fixed assets are recorded in the income statement for the year in which they are estimated, in the item “Impairment of depreciable investments”.
Depreciation is calculated as from the time when the assets are ready for use, using the straight-line method, according to the following estimated useful lives:
The expenses with repairs and maintenance of the tangible fixed asset are considered to be an expense during the financial year in which they occur. Improvements of a significant amount which increase the estimated period of use of the respective assets are capitalised and amortised according to the remaining useful life of the corresponding assets.
Tangible fixed assets in progress represent a tangible asset that is still in the construction/development stage, and are recorded at acquisition cost, less accrued impairment losses.
Buildings and other structures Basic equipment Transport equipment Tools and utensils Office equipment Other tangible fixed assets years 20–50 7–16 4–5 4–14 3–14 4–8 PAGE 273 CHAPTER 05.
These assets are transferred to tangible fixed assets and amortised as soon as the underlying assets are available for use and in the right condition to operate as intended by management.
Gains or losses resulting from the sale or write off of tangible fixed assets are determined as the difference between the selling price and the net book value on the date of disposal/write off, and are recorded in the income statement as “Other income and gains” or “Other expenses and losses”. Depreciation of the tangible fixed assets for the year is recorded in the consolidated income statement under the item “Depreciation and amortisation expenses/reversals”.
b. Intangible assets
Intangible assets are recorded at acquisition cost, less the accrued amortisations and accrued impairment losses. They are only recognised if it is probable that they will generate future economic benefits for Nors , if it is possible to reasonably measure their cost and if Nors has control over them.
Research expenses incurred with new technical knowledge are recognised as an expense in the income statement when incurred.
Development expenses, for which Nors demonstrates its ability to complete the development and begin marketing and/or using them, are capitalised if it is probable that the asset created will generate future economic benefits. Development expenses that do not meet these criteria are recorded as an expense in the income statement for the year in which they are incurred.
Internal costs linked to the maintenance and development of software are recorded as expenses in the income statement when incurred, except when such costs are directly linked to projects which will probably generate future economic benefits for Nors . In such situations, these costs are capitalised as intangible assets.
Intangible assets are amortised using the straight-line method, for a period of three to six years, except those related to concession rights, which are considered to have an indefinite useful life, and as such, are not amortised, but subject to an annual impairment test.
Amortisation of intangible assets in the year is recorded in the income statement under “Depreciation and amortisation expenses/reversals”.
PAGE 274 CHAPTER 05.
c. Investment properties
Investment properties, which are the equivalent of real estate assets held for obtaining income through their rental, or for their increased capital value, and not for use in production or supply of goods and services or for administrative purposes, are recorded at acquisition cost, their respective fair value being subject to disclosure.
Whenever the fair value of these assets is lower than their respective acquisition cost, an impairment loss is recorded in the income statement for the year in which it is estimated, under “Impairment of depreciable investments”. Once the recorded accrued impairment losses no longer exist, they are immediately reversed in impairments in the same item in the income statement up to a maximum of the amount that was ascertained, net of amortisation or depreciation, if no impairment loss has been recognised in previous years.
The fair value of investment properties that is subject to disclosure is determined based on real estate evaluations carried out by an independent specialised entity. Depreciation is calculated as from the time the assets are ready for use, using the straight-line method, according to their estimated useful life, for a period of 20 to 50 years.
d. Leases
Leases from the tenant's point of view
Starting on 1 January 2019, operating leases where Nors is a lessee are recognised within the scope of IFRS 16 - Leases. During the transition, Nors opted for the modified partial retrospective approach.
As such, a lease contract is based on “the right to control the use of an identified asset”. For all lease contracts, Nors recognises operating lease liabilities that reflect future lease payments, and “right of use” assets under “Assets through lease”. Exceptions to this recognition are only permitted in certain short-term leases, in contracts under 12 months whose renewal is not foreseen, and with low-value assets.
PAGE 275 CHAPTER 05.
At the beginning of each contract, in order to determine its “rights of use” and its lease liability, future rentals are updated to the present time, for which fixed discount interest rates are used, taking into account the risk profile of each Nors subsidiary, its country of origin and the asset leased. These are defined for each contract following the practical procedures provided for in the standard. The main interest rate ranges in use at Nors are:
Leases from the landlord's point of view
Leases from the lessor's point of view are classified as:
I finance leases when all the risks and advantages inherent to the possession of the vehicles are substantially transferred to the third party, and as
II operational leases if all the risks and advantages inherent to the possession of the leased asset are not substantially transferred through them.
The leasing contracts where the group acts as lessor under operating leases, the values of the assets are maintained in the statement of financial position, under the heading of tangible fixed assets, and income is recognized over the lease contract on a straight-line basis.
discount interest rate Portugal 1,4% – 4,5% Spain 3,4% – 3,8% Angola 34,9% – 36,0% Brazil 8,6% – 13,4% Namibia 9,0% – 12,1% Botswana 9,0% Canada 7% - 8% Mozambique 21,8% – 22,3% PAGE 276 CHAPTER 05.
e. Inventories
Goods and raw materials, by-products and consumables are valued at the lower out of the acquisition cost and the respective net realisable value (estimate of its selling price less the costs incurred with the disposal).
Equipment that was, or is, under short-term rental contracts (less than 1 year) during the year are considered to be available for immediate sale, and are included in the balance sheet under “Inventories” at the net book value. Such equipment is depreciated based on the production units method, as this best reflects its specific wear and tear. The expenses of this depreciation are shown in the income statement under “Depreciation and amortisation expenses/reversals”.
Finished and semi-finished goods, as well as products and works in progress are valued at production cost, which is lower than the market value. Production costs include the cost of the incorporated raw materials, direct labour, general manufacturing expenses and services carried out externally.
Accrued impairment losses for depreciation of inventories reflect the difference between the acquisition or production cost and the market net realisable value of the inventories.
In the case of Inventories, impairment losses are calculated based on market values and on various inventory turnover indicators, which are subsequently reviewed and adjusted by the departments responsible, so as to ensure that the value of the inventories does not exceed their net realisable value.
f. Subsidies from Government or other public bodies
Government subsidies are recognised according to their fair value when there is reasonable assurance that they will be received and that the group will fulfil the conditions required for their being granted.
Non-refundable subsidies and co-payments received to finance tangible fixed assets are recorded under “Deferrals” only when there is a reasonable guarantee of receipt, and are recognised as an expense in the income statement in proportion to the amortisation of the subsidised tangible fixed assets.
PAGE 277 CHAPTER 05.
Subsidies related to expenses incurred are recorded as an expense as long as there is a reasonable guarantee that they will be received, that the company has already incurred the subsidised expenses and that they fulfil the conditions required for their being granted. Whenever there is unequivocal allocation to an expense, the gain is recognised as a deduction from the respective expense.
g. Impairment of assets, other than Goodwill and concession rights
Pursuant to IAS 36 - Impairment of Assets, an impairment test is performed on Nors ’ assets at the date of each statement of financial position and whenever an event or change in circumstances is identified that indicate that the asset's book value might not be recoverable.
Whenever the asset’s book value is higher than its recoverable amount (defined as the highest out of the net sale price and the value in use, or as the net sale price for held-for-sale assets) an impairment loss is recognised. The net sale price is the amount that would be obtained with the disposal of the asset, less the costs directly attributable to the disposal, in a transaction between independent and knowledgeable entities. Value in use is the present value of the estimated future cash flows which are expected to arise from the continued use of the asset and from its disposal at the end of its useful life. The recoverable amount is estimated for each asset individually, or if that is not possible, for a cash flow-generating unit to which the asset belongs.
The reversal of impairment losses recognised in previous periods is recorded when it is concluded that the recognised impairment losses no longer exist or that they have decreased. This analysis is performed whenever there are signs that the previously recognised impairment loss has reversed. The reversal of impairment losses is recognised in the income statement. However, the reversal of an impairment loss is carried out up to the maximum amount that is recognised (net of amortisation or depreciation) should the impairment loss not have been recognised in previous reporting periods.
PAGE 278 CHAPTER 05.
h. Financial charges
Financial charges related to loans obtained (interest, premiums, ancillary costs and interest on finance leases) are recognised as an expense in the income statement for the period in which they are incurred, according to the principle of accrual accounting.
Should they relate to qualifying assets, the financial charges will be duly capitalised as defined in the applicable IFRS standards.
i. Provisions
Provisions are recognised when, and only when, Nors has a current obligation (legal or constructive) as the result of a past event, whenever it is probable that in order to resolve that obligation, there will be an outflow of resources and the amount of the obligation may be reasonably estimated. Provisions are reviewed on the date of each statement of financial position and are adjusted so as to reflect the best estimate of the fair value at that date.
i.i. Restructuring provisions
Nors recognises provisions for restructuring costs whenever there is a formal, detailed restructuring plan and the latter has been communicated to stakeholders.
i.ii. Provisions for future employee benefit obligations
a. Pension obligations
In the countries where it is mandatory, employees have rights under the group’s pension plans, which are defined contribution or defined benefit plans.
The liability recognised in the consolidated statements of financial position related to the defined benefit pension plans is the present value of the defined benefit obligation at the end of the period covered by the report less the fair value of the plan’s assets. The defined benefits obligation is updated every year by the Board of Directors using key assumptions supplied by independent actuaries, using the projected credit unit method. Actuarial evaluations of the defined benefit plans
PAGE 279 CHAPTER 05.
are carried out every three years. The present value of the defined benefit obligation is determined by discounting the estimated future cash outflows using high quality corporate bond interest rates which are quoted in the currency in which the benefits are paid and which have maturity dates close to the terms of the respective pension obligation.
Net interest is determined by multiplying the defined benefits obligation or net asset by the discount rated used to determine the defined benefits obligation (at the beginning of the year) and is included in the employee’s future benefits.
Changes to actuarial gains and losses that arise when calculating the present value of the defined benefits obligation and of the fair value of the plan’s assets are recognised in OCI in the period in which they arise and are debited or credited in retained earnings. On a provisional basis, management estimates the changes in actuarial gains and losses. These estimates are adjusted when the annual evaluation or estimate is concluded by the independent actuaries.
The cost of past services are immediately recognised in operating expenses in the consolidated income statements.
For defined contribution plans, the contributions are recognised as post-employment benefit expenses when they are due. Contributions paid in advance are recognised as an asset, in as far as a monetary reimbursement or a reduction in future payments is available.
b. Other future employee benefit obligations
The group also has other future obligations to its employees, including a pension plan without an associated fund and a noncontributory dental and healthcare plan. The expected costs with these benefits are accrued throughout the employment period, using the same accounting method used for the defined benefit pension plans. These obligations are evaluated annually by independent, qualified actuaries.
PAGE 280 CHAPTER 05.
j.i. Financial assets
Nors classifies its financial assets in the following categories:
- Debt instruments; and
- Equity instruments
Debt instruments
a. Debt instruments at amortised cost
Debt instruments are measured at amortised cost if both the following criteria are met:
- The asset is held to receive contractual cash flows; and
- The contractual cash flows of the asset represent solely principal and interest payments.
Financial assets included in this category are initially recognised at fair value and subsequently measured according to the amortised cost. At 31st December 2021 and 2020, Nors held investments classified in this category, corresponding to Angola State Treasury Bonds accepted for trading on the Angola Securities Exchange (BODIVA), which have been acquired since 2016.
b. Debt instruments at fair value through equity
Debt instruments are measured at fair value through equity if both the following criteria are met:
- The objective of the business model is reached both through receipt of contractual cash flows and through the sale of financial assets; and
- The contractual cash flows of the asset represent solely principal and interest payments.
The financial assets included in the category of fair value through equity are initially recognised and subsequently measured at fair value. Movements in the carrying amount are entered through other comprehensive income, except to recognise gains or impairment losses, income from interest and foreign exchange gains or losses, which are recognised in profit or loss. When the financial asset is derecognised, the accrued gain or loss previously recognised in other comprehensive income is reclassified as equity for the result.
j.
instruments
Financial
PAGE 281 CHAPTER 05.
c. Debt instruments at fair value through profit or loss
Financial assets are classified at fair value through profit or loss if they do not meet the criteria of fair value through other comprehensive income or amortised cost. This occurs when the initial objective is to recover the investment by selling the financial asset.
Financial assets included in the category of fair value through profit or loss are measured at fair value with all the variations recorded in profit or loss.
Reclassifications
Reclassifications within the categories are only permitted when there are changes in the business model for financial asset management. Reclassifications are accounted for prospectively as from the date of reclassification.
Equity instruments
Investments in equity instruments (shareholdings under 20%) are measured at fair value. Equity instruments held for trading are measured through fair value, with changes in fair value accounted for in profit or loss. All other shareholdings are measured through fair value, with changes in fair value (except dividends) being accounted for in other comprehensive income. The values are not recycled from other comprehensive income to income (even when an equity instrument is sold). Accrued gains or losses are reclassified within equity through retained earnings. Equity instruments measured at fair value through equity are not reclassified to equity instruments at fair value through profit or loss. Equity instruments at fair value through profit or loss are not subject to impairment tests.
Equity instruments at fair value through equity are subject to impairment tests, and the impairment is accounted for in other comprehensive income.
At 31st December 2021 and 2020, Nors holds shareholdings in equity instruments through equity. Their variations in fair value are not materially relevant.
PAGE 282 CHAPTER 05.
j.ii. Accounts receivable
Non-interest-bearing accounts receivable are recorded according to their nominal value, less any impairment losses so that they reflect their present net realisable value. These amounts are not discounted, as the effect of being financially updated is not considered to be material.
Nors follows a simplified approach to calculate impairment related to customers and other debtors. In the simplified approach, an entity measures the impairment losses in an amount equal to the expected credit losses for the life of the asset for accounts receivable resulting from transactions within the scope of IFRS 15, and which do not contain a significant financing component. For amounts receivable which have a significant financing component, Nors also chooses to apply the simplified approach.
Expected credit losses are an estimate of credit losses weighted by probability. A credit loss is the difference between the cash flows that are owed to an entity according to a contract and the cash flows that an entity expects to receive discounted at the original effective interest rate. As the expected credit loss considers the value and the time of the payments, a credit loss arises even if the entity expects to receive in full, but after the contractually defined time.
Nors considers payment default to be balances unpaid 180 days after the agreed due date and uses two levels to recognise impairments:
a. Specific impairment
A specific impairment is recognised in relation to cases in litigation, namely cases where collection relies on the intervention of third parties external to Nors (lawyers and similar agents), including in these cases those which are already in court, due to dispute or insolvency.
The specific impairment is recognised on the total balance due by the third party, only excluding the amounts covered by credit insurance and/or real guarantees.
PAGE 283 CHAPTER 05.
b. Generic impairment
When calculating generic impairments, the following third-party balances are excluded:
- Nors Companies (parent company; subsidiaries; associates; other related parties)
- Financial Entities (Lessors, Banks)
- Nors employees
- Third parties with an overall creditor balance (for example, advances)
- Values covered by credit insurance and/or real guarantees
To estimate credit losses to customers, contractual assets, and amounts receivable from leases, not included in the specific impairment, Nors uses the following intervals:
- not overdue
- 30 days overdue
- 31-60 days overdue
- 61-90 days overdue
- 91-180 days overdue
- More than 180 days overdue
For the “not overdue”, to “91 - 180 days overdue” periods, the values ascertained for 2021 for Nors led to an impairment percentage of 0% being applied on the book value.
j.iii. Loans
Loans are recorded in liabilities according to their nominal value less the transaction costs that are directly attributable to the issue of those liabilities. Financial charges are calculated according to the effective interest rate and accounted for in the income statement for the period in accordance with the principle of accrual accounting.
The effective interest rate is the rate that discounts future payments over the expected life of the financial instrument to the net carrying amount of the financial liability.
PAGE 284 CHAPTER 05.
Non-interest-bearing accounts payable are recorded according to their nominal value, as the effect of the financial activity is not considered to be material.
j.v. Derivative financial instruments
Nors uses derivative financial instruments when managing its financial risks, as a means of reducing its exposure to those risks. The derivative financial instruments normally used are “Foreign exchange forwards” (Cash flow hedges) and they aim to hedge the risk of foreign exchange rate variation in intra-group operations or margin protection on business with customers, as well as variable to fixed interest rate swaps, to hedge interest rate risk (Cash flow hedges).
The derivatives are initially recognised at their fair value at the date of entering into their contractual provisions and subsequently measured at their fair value. The method for recognising variations in fair value depends on whether or not that derivative is designated as a hedging instrument and, if designated, the nature of the hedged item.
For each transaction, and at the time of their origin, Nors prepares documentation that justifies the relation between the hedging instrument and the item hedged, as well as the risk management objective and the strategy for the hedge transaction. Both at the date of negotiating the hedge and on an ongoing basis, Nors also documents its analysis of the efficacy with which the hedging instrument offsets the variations in fair value, or of the cash flows from the hedged instruments. According to IAS 39, the fair value of option type derivatives is separated into their intrinsic value and their temporary value, given that only the intrinsic value of these instruments may be designated as a hedging instrument. As such, the efficacy tests of the option type derivative only include the intrinsic value of these instruments.
j.iv. Accounts payable
PAGE 285 CHAPTER 05.
The fair value of the contracted derivatives for the purpose of hedging is presented in a specific note. Movements in the hedging reserve are presented in the consolidated statement of changes in equity. The total fair value of a hedging derivative is classified as a non-current asset or liability when the residual maturity of the hedging instrument is more than 12 months, and as a current asset or liability when it is less than 12 months. Negotiation derivatives are classified as current assets or liabilities.
Derivative instruments for which the company used hedge accounting are initially recorded according to their cost, which is the equivalent of their fair value, and are subsequently re-evaluated at fair value; the variations in the latter are recorded in “Fair Value Reserves”, in the case of cash flow hedges, in “Other reserves” in the case of foreign exchange risk hedges, in “net investment in a foreign operation “ and in the income statement for the year in the case of fair value hedges.
Derivative instruments for which the company has not used hedge accounting, although they were contracted with economic hedging objectives, are initially recorded according to their cost, which is the equivalent of their fair value, if any, and are subsequently reevaluated at their fair value, whose variations calculated through evaluations made by banks with whom Nors enters into the respective contracts, have a direct effect on the items of Financial income in the consolidated income statement.
j.vi. Cash at bank and in hand
The amounts included in the heading “Cash at bank and in hand” correspond to the values in cash, bank deposits, term deposits and other treasury investments with a maturity of less than three months, and which may be immediately mobilizable with an insignificant risk of a change in value.
PAGE 286 CHAPTER 05.
Contingent assets and liabilities
Nors defines contingent liabilities as being (i) possible obligations that arise from past events and whose existence will only be confirmed by the occurrence or otherwise of one or more future uncertain events, which are not fully under Nors ’ control or (ii) current obligations that arise from past events, but which have not been recognised because it is not probable that an outflow of resources incorporating economic benefits will be necessary to settle the obligation, or the amount of the obligation cannot be measured with sufficient reliability.
Contingent liabilities are not recognised in Nors ’ financial statements, but are disclosed in the Notes to the Consolidated Financial Statements, unless there is only a remote chance of an outflow of funds affecting future economic benefits, in which case they are not even disclosed. Contingent assets are assets that might arise from past events and whose existence will only be confirmed by the occurrence or otherwise of one or more uncertain future events that are not fully under Nors ’ control.
Contingent assets are not recognised in Nors ’ financial statements but are disclosed in the Notes to the Consolidated Financial Statements when it is probable that there will be a future economic benefit.
l. Income tax
Income tax for the year is calculated based on the taxable results of the companies included in the consolidation, according to the tax rules in force in the location of the registered office of each Nors company, and considers deferred taxation. Current income tax is calculated based on the taxable results of the companies included in the consolidation.
Deferred taxes are calculated based on the statement of financial position liability method and reflect the temporary differences between the amount of assets and liabilities for the purpose of accounts reporting and the respective amounts for the purpose of taxation. Deferred tax assets and liabilities are not recognised when the temporary differences arise from Goodwill or from the initial recognition of assets and liabilities other than through business combination operations. Deferred tax assets and liabilities are calculated and evaluated annually using the taxation rates in force, or announced as being in force, at the expected date of reversal of the temporary differences.
k.
PAGE 287 CHAPTER 05.
Deferred tax assets are only recorded when there are reasonable expectations of enough future tax profits for their use, or where there are taxable temporary differences that offset the temporary differences that are deductible in the period of their reversal. At the end of each financial year, a review of those deferred taxes is made, and these are reduced whenever their future use is no longer probable.
Deferred taxes are recorded as an expense or income for the year, except if they are the result of items recorded directly in equity, in which case the deferred tax is also recorded against the same item.
m. Tax consolidation
Whenever available, income tax for the year is calculated based on the taxation regimes for groups of companies. Nors has a Special Taxation Regime for Groups of Companies (“RETGS”) with their registered offices in Portugal. This includes the companies with a registered office in this country and in which Nors , S.A. directly or indirectly owns more than 75%.
The remaining Nors companies with their registered offices abroad or which do not fulfil the rules for taking part in similar regimes are taxed on an individual basis and in accordance with the applicable legislation.
Accrual accounting
Income and expenses are recorded according to the principle of accrual accounting, and so they are recorded as they are generated, regardless of the time when they are received or paid. The differences between the amounts received and paid and the corresponding income and expenses generated are recorded in the items “Other accounts receivable”, “Other accounts payable” and “Deferrals”.
Expenses and income whose real value is not known are estimated based on the best evaluation of the Boards of Directors of Nors and of its affiliates.
n.
PAGE 288 CHAPTER 05.
o. Revenue from contracts with customers
According to IFRS 15, revenue from sales and services is recognised according to the 5-step model:
I Identify the contract with a customer
II Identify the distinct performance obligations in the contract
III Determine the transaction price
IV Allocate the transaction price to each performance obligation
V Recognise revenue when the entity fulfils a performance obligation
Step 1
There is a contract covered by IFRS 15 when:
- It has been approved
- It establishes rights and obligations of the parties
- It establishes payment terms
- There is commercial substance
- Receipt is probable
There is a contract combination when the contracts are entered into on the same date or on dates close to each other with the same customer, as long as the following criteria are met:
- Contracts are negotiated as a pack with a sole commercial objective;
- The value of the consideration to be paid in a contract depends on the price or performance of another contract;
- The goods or services promised in the contracts are a sole performance obligation. Contract modifications are treated as separate contracts when there are new products/services at market price. Contract modifications are treated as part of the original contract when there are new products/services at prices different from the market or when there are new products/services that are not different from the original contract. In the first case the adjustment is prospective and in the second case it is cumulative (the adjustment to the values already realised affects the profit or loss for the year).
PAGE 289 CHAPTER 05.
Step 2
Performance obligations may be:
- A distinct product or service that may be used/sold separately
- Different products or services only sold jointly
- A set of different services provided over time (uniform pattern for transferring services within a period of time)
When a contract has an option to buy additional goods/services at no cost or with a discount, it is considered to have an additional performance obligation.
Step 3
The variable price component is only considered if it is highly probable that there will be no reversal of income to be recognised in the future. When there is no such risk, the entity determines the most probable result or the expected result.
When there is a significant financial component, not charged to the customer at a market interest rate, the price is adjusted, except if:
- The period between the performance obligation and the payment is less than one year
- The payment time depends on the customer
- The payment deferral is not related to the customer’s financial needs
- The payment time varies according to factors not controlled by the customer or the seller.
The discount rate used is:
- the customer’s discount rate: if the payment occurs after the performance obligations have been fulfilled
- the seller’s discount rate: if the payment occurs before the performance obligations have been fulfilled.
The discounted value is recognised as revenue. Interest is recognised against receivables applying a discount rate on the amount owed.
When there is no cash consideration, the non-monetary consideration received is measured according to the fair value of the non-monetary consideration received. If this is not possible to determine, the fair value of the products/services delivered is used.
PAGE 290 CHAPTER 05.
Values payable to customers are recorded as follows:
- as a price reduction, if the sum paid is not related to any service to be incurred by the seller as a means of meeting the performance obligation.
- as an expense, if the sum paid is similar to other purchases of goods/ services made by the entity.
Step 4
The price is allocated to each identified performance obligation based on their relative prices.
The relative price (separate sale price) is estimated, if not directly observed, considering:
- Increased cost method
- Market price of similar goods/services
- Residual approach
Discounts are allocated proportionally to all performance obligations. Specific performance obligations are attributed only if:
- The goods or services are sold separately
- The goods or services are sold as a pack with a discount on a regular basis.
- The discount attributed to goods/services sold as a pack is similar to the discount in the contract under analysis.
The variable component is allocated proportionally to all performance obligations. It is attributed to specific performance obligations only if:
- The variable price component refers to specific goods/service
Allocation of the variable component is consistent with the principle of allocating the contract price to the performance obligations.
PAGE 291 CHAPTER 05.
Step 5
Revenue is recognised:
- On a specific date; or
- Over time.
Revenue is recognised when there is a transfer of control, which may occur when there is:
- Legal property ownership
- Physical property
- Acceptance by the customer
- Right to receipt
When revenue is recognised over time, the following are used:
- Output methods (units produced or delivered); or
- Input methods (costs incurred, time spent).
Revenue is measured according to the fair value of the consideration received. Revenue is recorded net of returns, write offs and similar situations.
Revenue from service provision is recognised in accordance with the percentage of finishing or based on the contract period when the provision of services is not linked to the execution of specific activities, but to providing a continuous service.
The cost of these repairs includes the incorporated materials and labour, the final cost and concomitantly the price to be paid by the customers known only on the date of concluding the repairs, with the issue of the respective invoice and delivery of the repaired item to the customer; it is also at that time that the respective revenue is recognised. During the repair period, the cost is considered in “Inventories - Works in Progress”.
Incremental costs
Incremental costs from contracts are capitalised if the contract period is more than one year and a return is expected. Incremental costs are costs that would not be incurred if the contract were not obtained (such as commissions). Marketing costs and salaries of the commercial department are not incremental costs.
PAGE 292 CHAPTER 05.
Agent/Principal
An entity is acting as a principal if:
- It is responsible for the services provided or the products delivered
- It retains the inventory risk
- It has the liberty to establish prices and offer additional prices/services.
Revenue is recognised by the principal when the merchandise is sold by the agent to third parties. The agent accounts for the commission received as revenue.
Sales with repurchase agreements
A repurchase agreement is a contract where an entity sells an asset and has the obligation or the option to repurchase the asset at a later date. Repurchase agreements generally take three forms:
I obligation of an entity to repurchase the asset (forward);
II right of an entity to repurchase the asset (call option); and
III obligation of an entity to repurchase the asset at the customer’s request (put option).
If an entity sells products and has the right (call option) or the obligation to repurchase (forward) at a lower price than the original price and:
a. the transaction is a sale and leaseback operation, the contract is accounted for as a financing contract
- the sale is not recognised
- the sum received is accounted for through financial liabilities
- the asset is reclassified from Inventories to Tangible Fixed Assets
- the difference between the book value of the inventory and the repurchase price is depreciated over the period of the contract
- the rentals paid during the lease period are recorded against financial debt and interest.
b. the transaction is not a sale and leaseback operation, the contract is accounted for as an operating lease
- the sale is not recognised
- the part of the sum received corresponding to the book value of the inventory is recorded against lease liabilities
- the difference between the sale price and book value of the inventory is deferred and recognised in profit or loss for the period of the lease
PAGE 293 CHAPTER 05.
- the asset is reclassified from Inventories to “Assets through lease”
- the difference between the book value of the inventory and the repurchase price is depreciated over the period of the contract
- the difference between the initial lease debt and the updated repurchase price at the present time is recognised as rentals in profit or loss during the lease period.
If the entity has the obligation to repurchase at the customer’s request (put option) and the repurchase price is lower than the original price and the fair value at the date of repurchase and:
a. the customer has no economic incentive to exercise the option: the contract is accounted for as a sale with the right of return - on the sale date: the sale and corresponding sale cost are recognised according to the amounts that are not expected to be returned and a contractual asset (for the sale cost pending recognition) and a contractual liability (for the sale pending recognition) are accounted for in the amounts expected to be returned - on the date of repurchase:
- if the customer does not exercise the option and keeps the asset, the value of the sale and the cost of the sale that had been pending recognition are recognised and the contractual asset and contractual liability are derecognised.
- if the customer exercises the option to return the asset, the repurchase price must be paid to the customer, the asset must be recognised in inventories and the contractual asset and contractual liability are de-recognised.
b. the customer has an economic incentive to exercise the option: the contract is recognised as a lease (note 2.3.d).
Sales with the right of return
The following procedures are followed:
- Recognition of revenue in the value of the expected consideration.
- Non-recognition of revenue for products that are expected to be returned.
- Recognition of a contractual liability for the sum expected to be reimbursed to the customer.
- Capitalisation of an asset according to the right to recover products from customers (adjustment to the sales cost).
PAGE 294 CHAPTER 05.
The customer’s right to exchange a product for a product of the same type, quality, price and condition is not a sale with the right of return. If the customer only has the right of return when the product sold is not working properly, IAS 37 is applied.
Sale of equipment to financial intermediaries with a repurchase commitment
This type of transaction generally involves 3 entities:
- Nors (supplier)
- The customer (lessee)
- The finance entity (lessor)
The normal process is:
- Nors issues an invoice to the lessor, in accordance with the sale price agreed with the Customer (lessee), and the Finance Entity (lessor) pays Nors the value of the invoice.
- At the same time, a rental contract is signed by the 3 parties, with the schedule of the instalments that must be paid by the lessee to the lessor, and the supplier undertakes, in favour of the financial institution, to repurchase the asset at the end of the rental period at a certain fixed price, should the lessee not exercise the option to buy the asset.
- Upon delivery of the asset, the supplier no longer has any control over the asset or management of it.
In cases where the repurchase value is less than half the initial value and where the contract period is more than half the useful life of the asset, and historically, it is found that the customer exercises the option to keep the asset, sales are accounted for as sales with the right of return. In any other cases, sales are accounted for as sales with repurchase agreements.
Licenses
Revenue from licenses to grant use of software is accounted for on a specific date. Revenue from licenses to grant access to software is accounted for over time.
PAGE 295 CHAPTER 05.
Bill and hold operations
Bill and hold operations are sales where the delivery is delayed at the request of the customer, but the buyer receives ownership and accepts invoicing.
The revenue is recognised when the buyer receives ownership as long as:
- It is probable that the delivery will be made
- The items are available, identified and ready to deliver to the buyer at the time at which the sale is recognised
- The buyer specifically recognises the deferred delivery instructions; and
- Usual payment terms are applied.
Goods sold subject to installation and inspection
The revenue is immediately recognised when the customer accepts the goods, the installation is a simple process and the inspection is only made to check the contract values.
If the installation is a complex process, the revenue is recognised when the customer accepts the goods and the installation has been concluded.
Guarantees
If the customer can buy the guarantee separately, the latter is recognised as a separate obligation. Otherwise, the guarantee is accounted for in accordance with IAS 37.
There is no separate obligation when the guarantee is required by law, when the duration of the guarantee period is less than one year or when the guarantee pledge only includes services to guarantee the promised specifications of the product.
When the equipment is sold, the provision for costs arising from a repair obligation is made when the obligation is probable and the costs can be reliably measured.
The guarantees linked to the goods sold by Nors are the responsibility of their manufacturers.
As standard guarantees cannot be sold separately from the equipment, a provision for estimated future costs that are not reimbursable by the factories is considered in accordance with IAS 37.
PAGE 296 CHAPTER 05.
Guarantee extensions and Assistance Contracts
Guarantee extensions and assistance contracts may be sold separately or in conjunction with the equipment. Sales of guarantee extensions and assistance contracts are considered to be a separate performance obligation.
The revenue from these is accounted for during the validity of the guarantee or the duration of the assistance contract, based on historic curves of use of the contract.
Their related costs are accounted for when borne.
A provision is set up when, on the date of sale, the foreseen costs for fulfilling the contract are higher than the revenue from the sale. Recognition follows the pattern for standard guarantees.
p. Subsequent events
Events occurring after the date of the statement of financial position, which provide additional information on the condition that existed at the date of the statement of financial position (adjusting events) are reflected in the consolidated financial statements. Events after the date of the statement of financial position, which provide information on conditions that occur after the date of the statement of financial position (non-adjusting events) are disclosed in the Notes to the Consolidated Financial Statements, if they are material.
q. Classification of statement of financial position
Realisable assets and liabilities due more than one year after the date of the statement of financial position are classified, respectively, as non-current assets and liabilities, with deferred tax assets and liabilities also being included in these items.
PAGE 297 CHAPTER 05.
Balances and transactions expressed in foreign currency
Assets and liabilities expressed in foreign currency were converted into Euros using the exchange rates in force on the date of the statements of financial position. Favourable and unfavourable differences in foreign exchange, arising from the differences between the exchange rates in force on the date of the transactions and those in force on the date of collection, payment or on the date of the statement of financial position, are recorded as gains and losses in the consolidated income statement for the period.
s. Non-current assets held for sale
Non-current assets (and their related set of assets and liabilities to be disposed of) are classified as held for sale if their book value is expected to be recovered through their sale and not through their continuous use. This condition is only considered to be met at the time in which the sale is highly probable and the asset (and their related set of assets and liabilities related to be disposed of) is available for immediate sale in its current conditions. In addition, actions should be in progress that lead to the conclusion that the sale will take place within a period of 12 months after the date of being classified in this item.
Non-current assets (and their related set of assets and liabilities to be disposed of) classified as held for sale are measured according to the lower of their book value or fair value, less the costs of their sale.
t. Judgements and estimates
When preparing the consolidated financial statements, the Board of Directors of Nors used as a basis its best knowledge and experience of past and/or current events, considering certain assumptions regarding future events. The most significant accounting estimates reflected in the consolidated financial statements for the years ended 31st December 2021 and 2020 include:
a. Useful lives of tangible fixed assets and intangible assets
The main sources of uncertainty arise from the period in which the assets will be ready for use, the predictions of their cash flows, estimates of the recoverable amounts, obtaining market comparisons, growth rates, discount rates and sensitivity assumptions (see notes 6 and 7)
r.
PAGE 298 CHAPTER 05.
b. Record of adjustments to the asset’s values (accounts receivable and inventories) and provisions
Relevant estimates given the complexity and degree of judgement inherent to the contingencies, as well as the level of uncertainty associated with the outcome of the processes in progress (see note 22)
c. Impairment tests carried out on Goodwill
The complexity and level of judgement inherent to the model adopted to calculate impairment and to identify and aggregate cash-generating units (CGUs) mean that this topic is considered a significant accounting estimate (see note 10)
d. Interest rates to be used on the discount of lease assets and liabilities
Important judgements are made to determine the incremental interest rate as well as the period to be considered for determining the lease liability and right of use
e. Actuarial assumptions
In determining its obligations with benefits to retired employees and with defined benefit pension funds, the Group uses actuarial assumptions, such as the discount rate and expectations of average life expectancy, being a matter that requires judgments and estimates to be made by the management.
The estimates and underlying assumptions were determined based on the best existing knowledge of events and transactions in progress, as well as on the experience of past and/or current events, at the date of approving the financial statements. Nevertheless, there may be situations in subsequent periods that were not foreseeable at the date of approving the financial statements and were therefore not considered in those estimates. Changes to estimates that occur after the date of the financial statements will be corrected prospectively. For that reason, and given the associated degree of uncertainty, the actual results of the transactions in question might differ from the corresponding estimates. Changes to those estimates, which occur after the date of the consolidated financial statements, will be corrected in profit or loss prospectively, in accordance with the provisions of IAS 8.
PAGE 299 CHAPTER 05.
The main estimates and assumptions related to future events included in the preparation of the consolidated financial statements are described in the corresponding attached notes.
The Covid-19 pandemic brought additional unpredictability regarding the assumptions to be considered when evaluating assets:
• The group analysed whether there were signs of impairment arising from the impacts of Covid-19, in accordance with current forecasts, based on the projections for GDP growth and inflation in the relevant markets, according to the IMF and the Bank of Portugal, which could indicate the existence of impairment of goodwill. No signs were identified of impairment of goodwill and there is a substantial buffer compared to the book value of the cash generating units (see note 10)
• With regard to recoverability, useful life and depreciation of tangible fixed assets and inventory recoverability, the group was obliged to temporarily close points of sale during the lockdown, and therefore immediately adapted the level of orders of goods, avoiding the accumulation of stocks in the value chain and preserving its working capital. Despite the impact verified, arising from the mandatory lockdown, there is no indication of impairments of tangible fixed assets. On the other hand, the group believes that compared to the margins practised during the pandemic, the net realisable value of its inventories is higher overall than their book value, impairments having been created on inventories following the group’s accounting policies, without the need to significantly reinforce them during 2020
• As far as the recoverability of trade balances and other amounts receivable are concerned, impairment losses are recorded based on the simplified model provided for in IFRS 9, recording the expected losses until maturity. As such, the group periodically evaluates losses on expected credit and the impacts on all financial assets measured at amortised cost. To this end, the group assessed the current exposure to credit risk and the possible impact on future economic forecasts, having concluded that the impact of this component is limited
• In the actuarial assumptions, the group evaluated the discount rate applicable to the employee defined benefit plan and other post-employment benefits. As a result of that evaluation, the group updated the discount rate according to the indicative reference market rates to calculate the liability from postemployment benefits and other long-term benefits (see note 22).
PAGE 300 CHAPTER 05.
2.4. risk management policy
The main objective of financial risk management is to support Nors in pursuing a long-term strategy, seeking to reduce unwanted financial risks, the associated volatility and trying to mitigate any negative impact on the group’s results that might arise from such risks. To this end, the group has developed a risk management methodology based on best practices, in order to ensure that there is independent and objective analysis of the organisational risks, so that they can be monitored, managed, consolidated and benchmarked between Nors ’ various organisational levels.
Identification of Nors ’ corporate risks is incumbent upon the Board of Directors, with the advice of the Risk and Compliance Department, establishing the main risks to which the group as a whole is exposed, and defining the appropriate level of exposure of each of them. This combination is used to ascertain the organisational Risk Profile, which should guide the actions and initiatives to be adopted and implemented throughout Nors . Within this context, the main initiative carried out was the design and permanent update of Nors ’ Corporate Policies. For each topic, these Corporate Policies define the main responsibilities, decisions and approvals among the Management Bodies, the Corporate Structures and the Business Units/Nors Companies.
a. Environment Risk
Environment risk arises from factors external to the company, which might affect the feasibility of its business model, jeopardising the fulfilment of the strategy and objectives.
The more critical risks in this category were worked on by the Board of Directors and the action plan will be monitored and developed over time.
b. Process and Decision-making Information Risk
Process Risk is the risk of Nors not acquiring, managing, renewing and using the business’s assets in an efficient and effective manner. Decision-making information risk is the risk of the information used to support the execution of the business model, for internal or external reporting on performance and for continuous assessment of the business model. Process risk and information for decision-making risk will be mitigated both through actions by the Directors in each Business Unit and Company, and through the standards set out in the Corporate Policies.
PAGE 301 CHAPTER 05.
c. Exchange rate risk
Nors has international operations, with companies operating in different jurisdictions, and is, therefore, exposed to exchange rate risk.
As Nors ’ presence is geographically spread across various Regions and international markets, its activity is based on different currencies, and so the risk must be duly managed from a global perspective and at a central level. As such, it the exclusive responsibility of the CFO to define the preferential measures and initiatives that Nors and the Business Units and Management Structure must carry out in order to mitigate foreign exchange risk.
Currencies with more significant exposure are the US dollar, the Brazilian real and the Canadian dollar.
This balance sheet foreign exchange exposure is managed through natural hedging operations, namely by contracting financial debt in the currency of the place where the risk has been acknowledged.
Nors ’ Finance Department manages the foreign exchange variations of the companies, using greater or lesser structured financial instruments: forwards and financial debt.
The amount of Nors ’ assets and liabilities (thousands of Euros) recorded in a currency other than the Euro, can be summarised as follows:
in thousands of Euros assets liabilities currency Dec 2021 Dec 2021 Brazilian Real BRL 108 974 72 038 US Dollar USD 139 493 Canadian Dollar CAD 203 474 124 654 Namibian Dollar NAD 8 316 5 287 Mozambique Metical MZN 3 092 1 750 Angolan kwanza AOA 369 Moroccan Dinar MAD 93 Cape Verde Escudo CVE 0 0 Tanzanian Shilling TZS 45 0 67 749 0 80 Botswana Pula BWP 3 397 2 260 Kenyan Shilling KES 0 0 Dec 2020 36 552 167 496 3 334 3 825 0 0 40 268 0 401 1 917 0 0 0 Turkish Lira TRY 109 Dec 2020 74 074 123 439 215 400 5 779 4 214 928 89 1 42 2 699 0 158 PAGE 302 CHAPTER 05.
Assuming a foreign exchange scenario with a devaluation of 2% against the 2021 foreign exchanges of each currency, applying this to the direct contribution to Nors ’ financial position and Net Income in 2021, the main impacts (in thousands of Euros) can be summarised as follows:
currency assets liabilities equity net income Brazilian Real BRL -2 137 -1 413 -724 -390 Canadian Dollar CAD -3 990 -2 444 -1 545 -225 Namibian Dollar NAD -163 -104 -59 -12 Mozambique Metical MZN -61 -34 -26 -8 Angolan kwanza AOA -7 -2 -6 -4 Moroccan Dinar MAV -2 0 -2 0 Cape Verde Escudo CVE 0 0 0 0 Tanzanian Shilling TZS -1 0 -1 0 US Dollar USD -2 735 -1 328 -1 407 -60 Botswana Pula BWP -67 -44 -22 -8 Kenyan Shilling KES 0 0 0 0 Turkish Lira TRY -2 0 -2 0
PAGE 303 CHAPTER 05.
d. Price risk
Price risk is related to other assets and financial instruments and has additional exposure, and so the mechanisms to control or minimise it may involve using more sophisticated hedging instruments. Thus, Nors ’ sensitivity and activity vis-à-vis variations in the prices of the said “held-for-sale investments” must be monitored by the Planning and Controlling Management Department and managed by the CFO, in accordance with the guidelines defined by the Board of Directors, whenever necessary.
e. Interest rate risk
Nors ’ indebtedness is indexed to variable interest rates, exposing the cost of debt to volatility in the financial market. The impact (in thousands of Euros) of this volatility on Nors ’ income and equity is not significant due to the effect of the following factors: possible correlation between the level of market interest rates and economic growth (natural hedge) and the existence of liquidity or consolidated liquid assets at variable rates.
Dec 2021 change income income obtained funding +1p.p. 1 565 obtained funding -1p.p. -1 565 Dec 2020 2 082 -2 082 PAGE 304 CHAPTER 05.
risk
Liquidity risk is defined as the risk of being unable to settle or fulfil obligations within the defined deadlines and at a reasonable price. There are three principal objectives of managing this risk at Nors
• Liquidity: ensuring permanent, efficient access to sufficient funds to meet current payments on the respective due dates, as well as any requests for funds within the deadlines defined for that purpose, even if unforeseen;
• Security: minimising the probability of default in reimbursing any investment of funds;
• Financial efficiency: ensuring that Nors and the Business Units/ Management Structure maximise the value created and minimise the cost of the opportunity of holding short-term surplus liquidity.
Generally speaking, responsibility for the management of liquidity risk is incumbent upon Nors ’ Finance Department. However, to ensure that Nors and the Business Units/Management Structures have liquidity, working capital management parameters have been defined, enabling the maximum return to be obtained, while minimising the associated opportunity costs in a secure and efficient manner. It is important to mention that at Nors , all existing surplus liquidity must be invested in amortising short-term debt, and the most pessimistic scenario must be used as a basis for analysing the maturity of each of the liability financial instruments, so as to minimise the liquidity risk linked to these obligations.
At 31st December 2021 and 2020, Nors has a net bank indebtedness of 89 818 thousand Euros and 158 096 thousand Euros, respectively, split between current and non-current loans and cash and bank deposits, taken out with various institutions.
As at 31st December 2021, there are unused credit lines in the value of 384 230 thousand Euros (see note 23).
The Group has contracted loans that have associated contractual clauses that define compliance with certain financial covenants. The percentage, based on the balance outstanding at 31st December with financial covenants, is 93%, and at the date of the statement of financial position the Group is complying with the contracted covenants.
f. Liquidity
PAGE 305 CHAPTER 05.
Loans in the form of commercial paper issues are classified as non-current liabilities when they are guaranteed for a period exceeding one year and it is the intention of the Group's Board of Directors to use this source of financing also for a period exceeding one year.
At 31st December 2021, Nors has Current assets of 399 613 thousand Euros, which is higher than the Current liabilities of 368 848 thousand Euros.
Given the high degree of uncertainty as to the evolution of the pandemic, with the objective of mitigating the potential reduction in its turnover, the group implemented several cost-reduction measures in 2020, with an impact in 2021. This also implied making a significant review of its investment plan for 2020. The Board of Directors firmly believes that in view of its financial situation and liquidity, the group will overcome the negative impact of this crisis, without jeopardising the going concern basis used for preparing these financial statements.
g. Credit risk
Credit risk refers to the risk of the counterparty defaulting on its obligations, resulting in possible losses for Nors , and so its exposure is mostly linked to trade receivables arising from operations. To cover credit risk, credit insurance or other hedging instruments can be contracted. When contracting credit insurance, the Accounts Receivable Areas of Norshare in the Regions must make an assessment of the need and the cost/benefit of contracting it, their conclusions being submitted to the Finance Department. Contracting any other hedging instruments is exclusively incumbent upon the CFO.
The Board of Directors has approved a Customer and Credit Management Policy that mitigates this risk, namely in the following points:
- For all deals regarding products on credit from the commercial area, it is mandatory for the financial area of Accounts Receivable of Shared Services to analyse the credit and issue a technical opinion;
- Perform monthly impairment analyses on receivables;
- Monitor the evolution of credit at regular meetings.
PAGE 306 CHAPTER 05.
3. changes to accounting policies and correction of fundamental errors
During the year ended 31st December 2021, there were no changes to accounting policies.
PAGE 307 CHAPTER 05.
4. Nors companies included in the consolidation
The Nors companies included in the consolidation using the full consolidation method and their respective share in the equity held at 31st December 2021 and 2020 are as follows:
method
company
capital
consolidation
Nors, S.A.
AgroNew Máquinas Agrícolas, Ltda 99,99% Full Amplitude Seguros - Corretores de Seguros S.A. 82,50% Full AS - Glass Angola, Lda. 73,50% Full ASParts Angola, Lda. 98,01% Full ASParts Cabo Verde, S.A. - Full Asinter - Comércio Internacional, Lda. 70,00% Full ASMOVE - Consultoria e Projectos Internacionais, S.A. 100,00% Full Auto Sueco (Lobito), Ltd. - Full Auto Sueco Centro-Oeste Concessionária de Veículos Ltda. 99,99% Full Auto Sueco Moçambique, S.A. 100,00% Full Auto Sueco São Paulo, Ltda. 99,99% Full Auto Sueco Vehicles, Spare Parts & Services (Namibia) (Pty), Ltd. 100,00% Full Auto-Maquinária, Lda. 99,00% Full Auto-Sueco (Angola), S.A.R.L. 79,90% Full Auto-Sueco (Tanzania) - Trucks, Bussesand Const.Eq., Ltd. 99,99% Full Auto-Sueco II Automóveis, S.A. 100,00% Full Auto-Sueco Kenya, Ltd. 99,99% Full Auto-Sueco Vehicles ,Spare Parts & Services (Botswana) (Pty) Ltd. 99,19% Full Civiparts - Comércio de Peças e Equipamentos, S.A. 100,00% Full Civiparts Angola - Comércio de Componentes e Equipamentos, S.A. 100,00% Full Civiparts Espanha 100,00% Full Civiparts Marrocos 100,00% Full ExpressGlass Angola 98,01% Full Galius - Veículos, S.A. 100,00% % of capital held 2020(1) parent company 99,99% 82,50% 73,50% 98,01% 82,50% 70,00% 100,00% 79,90% 99,99% 100,00% 99,99% 100,00% 99,00% 79,90% 99,99% 100,00% 99,99% 99,19% 100,00% 100,00% 100,00% 100,00% 98,01% 100,00% Full
% of
held 2021(1)
parent company -
PAGE 308 CHAPTER 05.
These companies were included in the consolidation using the full consolidation method, as established in IFRS 10 - “Consolidated financial statements” (control of the subsidiary through majority voting rights, or another mechanism, as holder of the company’s equity - note 2.2 a)).
Nors ’ companies included in the consolidation through the full consolidation method and the respective proportion of equity held at 31st December 2021 and 2020 are as follows:
Grow - Formação Profissional, S.A. 100,00% Full Holding Expressglass, BV - Full Imosócia – Sociedade Imobiliária, S.A. 100,00% Full NewOnedrive, S.A. 100,00% Full Nors Brasil Participações, Ltda. 99,99% Full Nors International B.V. 100,00% Full Plurirent – Serviços de Aluguer, S.A. 100,00% Full Promotejo - Compra e Venda de Propriedades, S.A. 100,00% Full SARI Serviços Aftermarket Região Ibéria 100,00% Full SGNT, S.G.P.S. 100,00% Full Socibil - Imobiliária, SARL. 100,00% Full Sogestim, Lda. 55,00% Full Sotkon Angola, Lda. - Full Sotkon Espanha 100,00% Full Sotkon France, S.A. 100,00% Full Sotkon Marocco, SARLAU 100,00% Full Sotkon Portugal - Sistemas de Resíduos, S.A. 100,00% Full Sotkon TRAtik Sustemleri Sanayi Ve Ticaret Anonim Sirketi - Full Strongco Corporation 100,00% Full Nors Canada, Inc 100,00% Full Auto Sueco Portugal, S.A. 100,00% Full ASFC S.G.P.S., S.A. 100,00% Full Strongco General Partner, Inc 100,00% Full Strongco Limited Partnership 100,00% Full Tecnauto Vehiculos, S.L. 100,00% 100,00% 100,00% 100,00% 100,00% 99,99% 100,00% 100,00% 100,00% 100,00% 100,00% 100,00% 55,00% 50,00% 100,00% 100,00% 100,00% 100,00% 83,00% 100,00% 100,00% 100,00% 100,00% 100,00% 100,00% 100,00% Full
- Direta e indiretamente PAGE 309 CHAPTER 05.
(1)
% capital held 2020(1)
method
(1) - Directly and Indirectly
- EquityMethod
- EquityMethod
These companies were included in the consolidation using the equity method through shareholder agreements whose conditions determine the existence of joint control, as established in IFRS 11 - “Joint Ventures”.
Air Rail Portugal, Sociedade Unipessoal, Lda 25,00% E.M. Air-Rail Marrocos 25,00% E.M. Air-Rail Polska, Sp. z.o.o 12,50% E.M. Air-Rail, S.L. 25,00% E.M. Ascendum Agro 50,00% E.M. Ascendum Construction Equipment, INC. 50,00% E.M. Ascendum Turk Makina, Limited Sirketi 50,00% E.M. Ascendum Baumaschinen Österreich GmbH 50,00% E.M. Ascendum Épitögépek Hungária 50,00% E.M. Ascendum España, S.L. 50,00% E.M. Ascendum Gradevinski Strojevi 50,00% E.M. Ascendum Camiões, Unipessoal, LDA 50,00% E.M. Ascendum Máquinas, Unipessoal, LDA 50,00% E.M. Ascendum Machinery SRL 50,00% E.M. Ascendum Makina Yatirim Holding, A.S - E.M. Ascendum Maquinaria México, S.A de C.V 50,00% E.M. Ascendum Portugal - Serviços de Gestão, SA 50,00% E.M. Ascendum Stavebeni Stroje Czech 50,00% E.M. Ascendum Stavebné Stroje Slovensko 50,00% E.M. Ascendum, GmbH 50,00% E.M. Ascendum, S.A. 50,00% E.M. Centrocar Moçambique 32,00% E.M. Centrocar, S.A. 40,00% E.M. Centrocar España, S.L. 40,00% E.M. E.M. E.M. E.M. E.M. E.M. E.M. E.M. E.M.
- Directly
Indirectly E.M.
Ascendum Automóveis, unipessoal, Lda. 50,00% E.M. company % capital held 2021(1) 25,00% 25,00% 12,50% 25,00%50,00% 50,00% 50,00% 50,00% 50,00% 50,00% 50,00% 50,00% 50,00% 50,00% 50,00% 50,00% 50,00% 50,00% 50,00% 50,00% 32,00% 40,00% 40,00% 50,00% Glomak SGPS, S.A. 50,00% Groupauto Portugal & Palop - GPLP, Lda 50,00%50,00% 50,00% - Importadora Distribuidora de Maquinaria Industrial ZEPHIR, S.L. 25,00% Sotkon Anadolu 50,00% TeaAloya, Inmobiliaria, S.A.U. 50,00% 25,00% 50,00% 50,00% - Volmaquinaria de Construcciòn España, S.A.U. 50,00% Volrental Atlântico, S.A.U 34,50% Bergmann Americas, INC. 50,00% 50,00% 34,50% 50,00%
E.M.
(1)
and
consolidation
PAGE 310 CHAPTER 05.
5. changes to the consolidation perimeter
During the year ended 31 December 2021, there were the following changes in the composition of the consolidation perimeter:
- Liquidation of AS Parts Cabo Verde, S.A., Auto Sueco (Lobito), Ltd., Holding Expressglass, BV, Sotkon Angola, Lda. and Ascendum Makina Yatirim Holding, A.S., with no impact on the consolidated financial statements, as they are holding management companies and/or without operational activity.
- Liquidation of Sotkon TR Atik Sustemleri Sanayi Ve Ticaret Anonim Sirketi, which generated immaterial impacts, related to the recognition in the result for the year of the currency translation reserves in equity at the level of the consolidated financial statements.
- Incorporation of Ascendum Agro, without material impacts on the consolidated financial statements.
During the year ended 31 December 2020, there were the following changes in the composition of the consolidation perimeter:
-Acquisition of Strongco Corporation on 17 March 2020, through the legal amalgamation model in Canada, with the following accounting impacts:
contributo 31.12.2019 31.12.2018 contribution 31.12.2020 Tangible fixed assets 4 345 Deferred tax assets 5 143 Inventories 126 853 Customers 22 487 Cash and cash equivalents 9 573 Others 4 893 total assets 215 338 194 899 Suppliers 46 625 Financing obtained 67 251 8 757 Provisions Others 11 711 total liabilities 167 429 Turnover 180 484 Cost of goods sold -123 730 ESF’s and Personnel Expenses -36 654 Others 4 879 ebitda 24 979 Depreciations -13 032 Interest and exchange rate diferences -4 590 Income for the period 87 net income 7 444 17.03.2020 3 519 5 154 128 036 19 903 0 6 773 25 164 95 678 7 733 15 383 177 667 Assets through lease 29 667 31 515 Goodwill 12 378 0 Liabilities through lease 33 085 33 708
PAGE 311 CHAPTER 05.
Goodwill accounted for at the date of acquisition amounted to 12 611 thousand Euros (19 350 thousand CAD), stemming from the acquisition of assets with a net book value of 27 583 thousand Euros (42 323 thousand CA) after a purchase price allocation of 14 972 thousand Euros (22 973 thousand CAD).
When accounting for a business combination, the acquiring entity has a period of time deemed reasonable to identify and determine the value of the acquired identifiable assets, liabilities undertaken and non-controlling interests in the acquired entity, the consideration transferred to the acquired entity or the sum used to measure the Goodwill and the recognised Goodwill. The group therefore has a measurement time of up to one year after the date of acquisition to re-evaluate the sums calculated and disclosed herein. In this period it was identified the need to correct the value of the Goodwill associated with this acquisition decreasing it by 2 740 thousand Euros (3 944 thousand CAD) allocating this amount to Assets through lease, revaluing them accordingly in IFRS 3 and IFRS 16.
- Formation of the joint venture Groupauto Portugal & Palop - GPLP, Lda in Portugal
- Sale of Dalia - Gestão e Serviços, S.A, with effect as of 31 December 2020. The deal entailed the sale of 100% of the company’s share capital for an overall sum of 6 900 thousand Euros, which generated gains of 2 668 thousand Euros recognised in “Gains/ Losses allocated to subsidiaries, associates and joint ventures”. It was carried out with a related party, but following market prices.
PAGE 312 CHAPTER 05.
6. tangible assets
In the years ended 31st December 2021 and 2020, the movements that took place in intangible assets, as well as in the respective accrued amortisation and impairment losses were as follows:
development projects computer software industrial property other intangible assets investments in progress total 1 January 2020 Acquisition value net of impairment 2 554 4 196 3 981 688 1 205 0 12 624 Accumulated depreciation - 1 838 - 3 019 -3 590 -687 -9 133 initial net value 716 1 177 391 1 1 205 3 490 movements in 2020 Initial net value 1 177 391 1 1 205 3 490 716 Changes in perimeter — Accumulated value 0 - 255 -42 -58 -354 Changes in perimeter — Accumulated depreciations 4 150 38 58 19 -19 0 0 250 Additions 37 208 8 818 0 0 1 090 Transfer, sales and Write-offs/ Acquisition cost 405 - 125 33 -616 0 0 -321 Transfer, sales and Write-offs/Accumulated amortization 157 116 7 281 Depreciation for the financial year - 466 - 414 -115 -995 closing net value 854 858 321 1 1 407 3 441 31 December 2020 Acquisition or revalued cost 2 997 4 025 3 981 629 1 407 0 13 038 Accumulated depreciation - 2 143 -3 166 -3 660 -628 - 9 597 closing net value 854 858 321 1 1 407 3 441 movements in 2021 Initial net value 858 321 1 1 407 3 441 Changes in perimeter — acquisition value 0 854 0 0 0 0 0 0 0 0 17 38 53 108 Changes in perimeter — Accumulated depreciations -4 - 11 -36 - 53 -102 Additions 1 365 19 20 1 791 3 194 Transfer, sales and Write-offs/Acquisition cost -108 178 -1 -1 949 -1 881 Transfer, sales and Write-offs/Accumulated amortization 539 - 66 0 473 Depreciation for the financial year -453 - 173 -82 -708 closing net value 2 193 823 261 1 1 248 4 525 31 December 2021 Acquisition or revalued cost 4 253 4 238 4 038 682 1 248 0 14 460 Accumulated depreciation -2 061 - 3 415 -3 777 - 681 - 9 935 closing net value 2 193 823 261 1 1 248 4 525
PAGE 313 CHAPTER 05.
7. tangible fixed assets
In the years ended 31st December 2021 and 2020, the movements that took place in tangible fixed assets, as well as in the respective accrued depreciation and impairment losses were as follows:
1 January 2020 Acquisition or revalued cost net of impairment Accumulated depreciation closing net value land and natural resources 23 632 0 23 632 23 632 66 - 874 0 0 0 0 0 0 0 22 824 22 824 22 824 buildings and other constructions 144 399 - 72 607 71 792 71 792 4 165 - 3 178 - 8 665 3 048 438 244 83 - 3 818 64 109 140 581 - 76 472 64 109 basic and transport equipment 25 619 - 19 621 5 998 5 998 5 663 - 4 316 - 2 498 1 899 2 166 791 - 846 - 1 386 7 472 31 741 - 24 270 7 472 office equipment 12 229 - 10 588 1 641 1 641 18 211 -17 100 -1 459 1 284 288 -1 682 1 147 - 467 1 865 27 587 -25 723 1 865 other tangible fixed assets 5 853 -4 942 911 911 0 0 - 378 333 57 16 114 - 405 648 5 548 -4 900 648 contracts with repurchase agreement 23 195 -3 468 19 727 19 727 0 0 -23 0 10 961 -766 351 -3 365 26 885 33 368 -6 482 26 885 investments in progress 1 672 0 1 672 1 672 0 0 0 0 0 0 0 177 -1 109 739 739 739 total 236 600 - 111 226 125 374 125 374 28 105 - 24 594 - 13 897 6 563 14 087 - 2 506 850 - 9 440 124 542 262 389 - 137 847 124 542 movements in 2020 Initial net value Translation differences — Acquisition cost Changes in perimeter — Acquisition cost Translation differences — Accumulated depreciation Changes in perimeter — Acquisition depreciation Acquisition Transfer, sales and Writeoffs Acquisition cost Transfer, sales and Writeoffs Accumulated depreciation Depreciation for the financial year closing net value 31 December 2020 Acquisition or revalued cost net of impairment Accumulated depreciation closing net value
PAGE 314 CHAPTER 05.
In 2021, the amounts disclosed in the lines “Transfers, disposals and write-offs” also include accounting reclassifications in accordance with Nors ’ policies, namely for Investment Property, due to the change in use of the assets.
In 2021, the presentation of the "Repurchase agreements" was changed and they were presented as Tangible Fixed Assets, while in 2020 they were presented as " Assets through lease". The comparative figures were restated in 2021.
land and natural resources 22 824 638 6 657 0 0 0 0 204 30 323 30 323 30 323 buildings and other constructions 64 109 6 159 - 1 982 3 654 - 1 125 551 0 65 623 149 268 - 83 645 65 623 basic and transport equipment 7 472 1 450 - 1 111 3 302 - 3 496 1 312 0 7 224 32 997 - 25 773 7 224 office equipment 1 865 1 941 - 1 856 234 237 - 209 0 1 816 30 000 - 28 183 1 816 other tangible fixed assets 648 348 - 312 109 472 - 269 0 647 6 476 - 5 829 647 contracts with repurchase agreement 26 885 127 0 7 277 - 2 932 1 279 - 575 28 009 37 265 - 9 256 28 009 investments in progress 739 8 0 552 0 0 0 8 1 307 1 307 1 307 total 124 542 10 669 -5 261 21 785 - 6 632 2 663 - 575 134 950 287 636 - 152 686 134 950 movements in 2021 Initial net value Acquisition Changes in perimeter — Acquisition cost Changes in perimeter — Accumulated depreciations Transfer, sales and WriteOffs Acquisition cost Transfer, sales and WriteOffs Accumulated depreciation Impairment Loss/Reversal closing net value 31 December 2021 Acquisition or revalued cost net of impairment Accumulated depreciation closing net value 0 - 5 742 - 1 704 - 396 - 347 -4 053 0 - 12 242 Depreciation for the financial year
PAGE 315 CHAPTER 05.
At 31st December 2021 and 2020, the item “Investment properties” refers to real estate assets held by Nors , which are generating revenue through their respective rental or appreciation in value. These assets are recorded at acquisition cost or revalued cost on the date of first applying the IFRS (01 January 2009).
The breakdown of the real estate assets recorded in the item “Investment properties” at 31 December 2021 and 2020 can be shown as follows:
real estate location Algarve house and land Algarve Porto building and land Porto S. João da Talha building S.João da Talha Barreiro building and land Barreiro Matosinhos land Matosinhos Figueira da Foz apartment Figueira da Foz Francos building Porto Gonçalo Cristóvão building Porto Tecnauto building Galiza Moreira da Maia building and land Maia Brito Capelo offices Matosinhos Ovar building and land Ovar Monte dos Burgos building and land Porto Dec 2021 net book value appraisal value 311 612 378 1 228 1 997 4 891 458 477 2 925 2 926 121 148 147 167 557 2 126 929 967 2 430 5 880 10 13 12 10 264 19 436 net book value appraisal value 312 612 400 1 228 2 053 4 795 468 477 2 925 2 926 117 142 124 148 150 167 542 1 333 1 141 4 090 943 967 2 524 5 880 11 11 710 22 778 Dec 2020 8. investment properties PAGE 316 CHAPTER 05.
The Board of Directors believes that a possible change (within a normal scenario) in the main assumptions used to calculate fair value will not give rise to impairment losses, beyond the loss already recorded.
The fair value of investment properties that are subject to disclosure at 31st December 2021 and 2020 was determined through a real estate evaluation carried out by the expert evaluator José Carlos Santos, who used the arithmetic average of the results of the market comparison method and the costs method. Despite the changes to the book value that took place, the fair value of the real estate did not undergo any change based on the evaluations made.
During the financial years ended 31st December 2021 and 2020, income and operating expenses directly linked to these investment properties were as follows:
Dec 2021 Rents and other income 894 Depreciation -267 Maintenance and repair -131 Dec 2020 826 -312 -87 PAGE 317 CHAPTER 05.
Movement in the item “Investment properties” at 31 December 2021 and 2020 was as follows::
In 2021, the amounts disclosed in the lines “Transfers, disposals and write-offs” also include accounting reclassifications in accordance with Nors ’ policies, namely for Tangible Fixed Assets, due to the change in use of the assets.
land and natural resources buildings and other constructions investments in progress total 1 January 2020 Acquisition or revalued cost net impairment Accumulated depreciation initial net value movements in 2020 initial net value Acquisitions Transfer, sales and Write-offs/Acquisition cost Transfer, sales and Write-offs Accumulated depreciation Depreciation for the financial year closing net value 31 December 2020 Acquisition or revalued cost net of impairment Accumulated depreciation closing net value movements in 2021 Initial net value Acquisitions Transfer, sales and Write-offs/Acquisition cost Transfer, sales and Write-offs/Accumulated depreciation Depreciation for the financial year closing net value 31 December 2020 Acquisition or revalued cost net of impairment Accumulated depreciation closing net value 8 054 9 088 128 17 270 0 - 5 403 0 - 5 403 8 054 3 684 128 11 867 8 054 3 684 128 11 867 0 32 0 32 0 177 - 53 124 0 0 0 0 0 - 312 0 - 312 8 054 3 581 75 11 710 8 054 9 297 75 17 426 0 - 5 716 0 - 5 716 8 054 3 581 75 11 710 8 054 3 581 75 11 710 0 37 0 37 - 717 - 1 448 19 - 2 146 0 929 0 929 0 - 267 0 - 267 7 337 2 832 94 10 264 7 337 7 886 94 15 317 0 - 5 053 0 - 5 053 7 337 2 832 94 10 264
PAGE 318 CHAPTER 05.
9.1. assets by lease
At 31st December 2021 and 2020, the following operations were carried out, which are recorded in accordance with the rules provided for in IFRS 16 - Leases:
movements in 2020 Initial net value 1 859 Perimeter variationAcquisition value Perimeter variationAccumulated depreciation Translation differences — Acquisition cost - 219 Translation differences — Accumulated depreciation Increases Decreases and other regularizations/Accumulated depreciation Depreciation for the financial year closing net value Decreases and other regularizations Acquisition cost 1 January 2020 Acquisition or revalued cost net impairment Accumulated depreciation initial net value 31 December 2020 Acquisition or revalued cost net impairment Accumulated depreciation closing net value operating lease of buildings 30 823 30 374 - 4 777 - 5 368 1 050 2 871 1 777 - 9 286 46 259 - 1 205 35 768 - 4 945 30 823 62 440 - 16 181 46 259 operating lease of basic equipment 2 152 - 34 - 92 35 0 - 434 - 40 817 1 228 5 - 2 2 1 292 - 476 817 operating lease of vehicles 1 361 8 996 - 3 196 - 365 154 3 282 1 589 - 2 773 7 839 - 1 210 2 286 - 924 1 361 12 988 - 5 149 7 839 operating lease of office equipment 0 0 45 567 173 - 466 1 353 - 607 2 369 - 510 1 859 2 110 - 757 1 353 total 34 045 39 522 - 8 007 - 6 044 1 284 6 720 3 105 - 12 564 56 268 - 1 794 40 427 - 6 382 34 045 78 831 - 22 563 56 268 9. leases PAGE 319 CHAPTER 05.
movements in 2021 Initial net value Translation differences — Accumulated depreciation Increases Decreases and other regularizations/Acquisition cost Decreases and other regularizations/Accumulated depreciation Depreciation for the financial year closing net value 31 December 2021 Gross Value Accumulated depreciation closing net value operating lease of buildings 46 259 - 1 000 6 532 186 964 - 10 027 46 161 72 405 - 26 243 46 161 operating lease of basic equipment 817 - 13 0 97 - 178 - 56 697 1 420 - 723 697 operating lease of vehicles 7 839 - 405 904 48 1 127 - 3 029 7 438 14 895 - 7 457 7 438 operating lease of office equipment 1 353 0 2 007 - 1 712 137 - 565 1 220 2 405 - 1 185 1 220 total 56 268 Translation differences — Acquisition cost 3 247 31 955 0 4 233 - 1 418 9 442 - 1 381 2 049 - 13 676 55 517 91 125 - 35 608 55 517 PAGE 320 CHAPTER 05.
9.2. lease liabilities
At 31s December 2021 and 2020, there are the following obligations related to contracts with a repurchase agreement and leases:
Recognition obligations for future years at 31st December 2021 and 2020 respectively are: Contracts with a repurchase agreement:
Dec 2021 Contracts with repurchase agreement 28 574 Operating leases 58 222 liabilities through leasing 86 796 current liabilities 23 776 non-current liabilities 63 020 Dec 2020 26 876 59 673 86 549 19 367 67 182 Dec 2021 deferred rent deferred interest repurchase price total 2022 4 253 -287 5 862 9 829 2023 2 832 -197 5 703 8 338 2024 1 747 -121 3 976 5 601 2025 717 -49 4 092 4 761 2026+ 17 -1 28 45 total 9 566 -655 19 662 28 574 year Dec 2020 deferred rent deferred interest repurchase price total 2021 3 914 -294 3 086 6 706 2022 3 061 -220 6 013 8 854 2023 1 946 -139 3 295 5 101 2024 875 -64 3 868 4 678 2025 179 -12 1 371 1 537 total 9 974 -730 17 632 26 876 year Dec 2021 Contracts with repurchase agreement 28 574 Operating leases 58 222 liabilities through leasing 86 796 current liabilities 23 776 non-current liabilities 63 020 Dec 2020 26 876 59 673 86 549 19 367 67 182 Dec 2021 deferred rent deferred interest repurchase price total 2022 4 253 -287 5 862 9 829 2023 2 832 -197 5 703 8 338 2024 1 747 -121 3 976 5 601 2025 717 -49 4 092 4 761 2026+ 17 -1 28 45 total 9 566 -655 19 662 28 574 year Dec 2020 deferred rent deferred interest repurchase price total 2021 3 914 -294 3 086 6 706 2022 3 061 -220 6 013 8 854 2023 1 946 -139 3 295 5 101 2024 875 -64 3 868 4 678 2025 179 -12 1 371 1 537 total 9 974 -730 17 632 26 876 year
PAGE 321 CHAPTER 05.
Leases:
Dec 2021 year deferred interest total 2022 2023-2026 total 2027+ 15 939 -3 658 12 281 39 658 -7 489 32 169 15 350 -1 578 13 772 70 947 -12 725 58 222 deferred rent Dec 2020 ano deferred interest total 2021 2022-2025 total 2026+ 15 046 -3 867 11 179 42 445 -9 382 33 064 16 530 -1 099 15 431 74 022 -14 348 59 673 deferred rent PAGE 322 CHAPTER 05.
During the year ended 31 December 2020, the acquisition of Strongco Corporation took place, and during the 2021 fiscal year, the Goodwill generated by this operation was reviewed in accordance with the provisions of IFRS 3 - Business Combinations. For further information, see note 5.
Goodwill is not amortised. Impairment tests are performed annually. For the purpose of analysing impairments, the recoverable amount was determined based on the value in use, according to the discounted cash flow method, based on business plans developed by the heads of the respective companies and duly approved by the Board of Directors of Nors , and using discount rates that reflect the risks inherent to the business, or in the case of real estate firms, the disposal value less sale costs, as provided for in the regulations.
At 31st December 2021, the method and assumptions used to gauge whether any impairment exists, were as follows:
goodwill Dec 2021 company growth rate discount rate (after tax) Auto Sueco Centro Oeste 1 176 3,00% 10,21% NewOneDrive 2 258 2,00% 7,77% Arrábida Peças 913 2,00% 7,77% Auto Sueco São Paulo 6 470 3,00% 10,21% ASFC 11 442 2,00% 7,79% Civiparts S.A. 15 696 2,00% 7,77% Amplitude 1 614 2,00% 9,49% Promotejo 812 AgroNew 2 324 3,00% 10,21% Galius 4 474 2,00% 7,77% 7,99% 57 896 Strongco 10 704 2,00% goodwill Dec 2020 company growth rate discount rate (after tax) Auto Sueco Centro Oeste 1 176 3,25% 7,99% NewOneDrive 2 258 2,00% 5,46% Arrábida Peças 913 2,00% 5,46% Auto Sueco São Paulo 6 410 3,25% 7,99% ASFC 11 442 2,00% 6,21% Civiparts S.A. 15 696 2,00% 5,46% Amplitude 1 614 2,00% 8,42% Promotejo 812 AgroNew 2 301 3,25% 7,99% Galius 4 474 2,00% 5,46% 59 475 Strongco 12 378 2,00% 10. Goodwill PAGE 323 CHAPTER 05.
At 31st December 2020, were as follows:
Movement in the item “Goodwill” at 31st December 2021 and 2020 was as follows:
Supported by the value of the 5-year forecast for cash flows, discounted at the rate considered to be applicable, the Board of Directors concluded that at 31st December 2021, the book value of the cash-generating units is not higher than their recoverable value.
Cash flow projections were based on historic performance and on the expectations of improved efficiency and organic growth. Management believes that a possible change (within a normal context) in the main assumptions used to calculate the recoverable value will not cause impairment losses, making the WACC and the business growth rate vary by 1 p.p., while Goodwill remains without impairment.
In the companies engaged in real estate, the recoverable value was determined using the fair value of the property less costs of disposal, the latter being higher than the book value of the net assets, including Goodwill, and so an asset impairment is not considered necessary.
1 January 2020 50 870 31 December 2020 59 475 Additions/reviews -2 740 Impact of exchange rate variations 1 162 31 December 2021 57 896 Additions/reviews 12 899 Impact of exchange rate variations -4 295 goodwill Dec 2021 company growth rate discount rate (after tax) Auto Sueco Centro Oeste 1 176 3,00% 10,21% NewOneDrive 2 258 2,00% 7,77% Arrábida Peças 913 2,00% 7,77% Auto Sueco São Paulo 6 470 3,00% 10,21% ASFC 11 442 2,00% 7,79% Civiparts S.A. 15 696 2,00% 7,77% Amplitude 1 614 2,00% 9,49% Promotejo 812 AgroNew 2 324 3,00% 10,21% Galius 4 474 2,00% 7,77% 7,99% 57 896 Strongco 10 704 2,00% goodwill Dec 2020 company growth rate discount rate (after tax) Auto Sueco Centro Oeste 1 176 3,25% 7,99% NewOneDrive 2 258 2,00% 5,46% Arrábida Peças 913 2,00% 5,46% Auto Sueco São Paulo 6 410 3,25% 7,99% ASFC 11 442 2,00% 6,21% Civiparts S.A. 15 696 2,00% 5,46% Amplitude 1 614 2,00% 8,42% Promotejo 812 AgroNew 2 301 3,25% 7,99% Galius 4 474 2,00% 5,46% 59 475 Strongco 12 378 2,00% PAGE 324 CHAPTER 05.
11.1. investments in associates and joint ventures
The balance and composition of the item “Investments in Associates and Companies excluded from the Consolidation” at 31st December 2021 and 2020 is as follows:
Movements recorded between the two periods are as follows:
The main indicators of the companies that are included using the equity method are:
% shareholding Dec 2021 Grupo Ascendum 50,00% 100 139 Sotkon Anadolu 50,00% Groupauto Portugal & Palop 50,00% 231 100 478 Dec 2021 balance at 1 January 80 750 Perimeter variation 0 Share of the profit (loss) 21 158 Distributed Profits -4 000 - Divestments Other movements in own capitals 2 570 balance at 31 December 100 478 109 Reclassification for Provisions 0 Dec 2020 80 387 205 80 750 Dec 2020 85 911 0 8 123 -4 000 -4 232 -5 257 80 750 158 205 % shareholding Dec 2021 Grupo Ascendum 50,00% 100 139 Sotkon Anadolu 50,00% Groupauto Portugal & Palop 50,00% 231 100 478 Dec 2021 balance at 1 January 80 750 Perimeter variation 0 Share of the profit (loss) 21 158 Distributed Profits -4 000 - Divestments Other movements in own capitals 2 570 balance at 31 December 100 478 109 Reclassification for Provisions 0 Dec 2020 80 387 205 80 750 Dec 2020 85 911 0 8 123 -4 000 -4 232 -5 257 80 750 158 205
share capital (local currency) currency assets equity sales net income % group Grupo Ascendum 15 000 EUR 200 693 590 570 1 025 416 42 641 50,00% Groupauto Portugal & PALOP - GLPL 25 EUR 462 1 201 566 58 50,00% Sotkon Anadolu 50 TRY 217 236 52 41 50,00% 11. financial investments PAGE 325 CHAPTER 05.
11.2. equity instruments at fair value through equity
The balance and composition of the item “Equity instruments at fair value through equity” at 31st December 2021 and 2020 is as follows:
11.3. debt instruments at amortised cost
The balance of the item “Debt instruments at amortised cost” corresponds to Treasury Bonds from the Angola Popular Republic, with the intention of holding them until maturity.
Movements recorded between the two periods are as follows:
The maturity of the lines currently held is as follows:
Groupauto Portugal & PALOP - GLPL 25 EUR 462 1 201 566 58 50,00% Sotkon Anadolu 50 TRY 217 236 52 41 50,00% Grupo Auto Union Espanha GAUESL 3,44% Aliance Automotive Espanha, S.L. 15,75% 516 1 000 Other equity instruments1 556 516 0 516 % shareholding Dec 2021 Lince Innovation FundDec 2020
Dec 2021 balance at 1 January 10 037 Acquisitions in the fiscal year 0 Exchange variation 913 Divestments -1 583 balance at 31 December 9 366 Dec 2020 48 694 5 235 -3 063 -40 830 10 037 2022 2023 Treasury Bonds 7 507 1 860 total 7 507 1 860 Dec 2021 balance at 1 January 10 037 Acquisitions in the fiscal year 0 Exchange variation 913 Divestments -1 583 balance at 31 December 9 366 Dec 2020 48 694 5 235 -3 063 -40 830 10 037 2022 2023 Treasury Bonds 7 507 1 860 total 7 507 1 860
PAGE 326 CHAPTER 05.
The breakdown of the amounts and type of deferred tax assets and liabilities recorded in the consolidated financial statements at 31st December 2021 and 2020, can be summarised as follows:
Deferred tax assets: reporting tax losses provisions and adjustments not accepted as tax costs other total 31 December 2020 4 593 4 187 320 9 100 Exchange rate variation 12 514 526 Perimeter Variation 0 -1 695 - 1 695 Impact on Income statement 1 399 1 112 516 0 0 3 028 Other Adjustments 0 127 - 127 0 1 January 2020 5 506 1 085 273 6 865 Exchange rate variation - 256 - 1 068 - 1 324 Perimeter Variation 0 5 154 5 154 Impact on Income statement - 689 - 1 070 46 0 0 - 1 714 Other Adjustments 32 87 0 119 31 December 2021 6 004 4 246 708 10 959 12. deferred taxes PAGE 327 CHAPTER 05.
Deferred tax liabilities:
The tax reporting that gave rise to Deferred Tax Assets as at 31st December 2021 is broken down as follows:
Portugal Brazil Spain France total base dta base dta base dta base dta base dta 2020 600 126 600 126 2009 1 311 262 1 311 262 2010 285 76 285 76 2011 181 48 181 48 2012 882 176 262 69 1 144 246 2013 629 214 833 167 1 461 380 2014 1 551 326 24 5 398 80 68 18 2 017 423 2015 86 29 171 34 31 8 288 72 2016 2 1 180 36 182 37 292 366 2017 835 284 1 075 366 627 213 15 3 83 17 874 2018 1 075 2019 11 777 2 473 12 405 2 687 18 591 3 904 3 255 1 107 3 872 774 827 219 6 004 26 544 13 948 2 929 6 016 623 3 789 758 1 013 284 4 593 24 765 2021 balance at 31.12.2021 balance at 31.12.2020 4 638 974 4 722 991 deferral of capital gains tax effect of fair value valuation on land others total 1 January 2020 Exchange rate variation Impact on Income statement Other Adjustments 31 December 2020 Exchange rate variation Impact on Income statement Other Adjustments 31 December 2021 416 1 907 828 3 151 - 274 - 274 0 0 0 2 742 744 0 35 0 35 416 1 909 1 332 3 656 52 52 - 21 598 577 0 0 0 0 0 416 1 888 1 982 4 286
“Other settlements/uses” refers essentially to the use/reclassification of adjustments not accepted as a tax expense.
PAGE 328 CHAPTER 05.
Pursuant to the legislation in force in Portugal, losses from 2014 to 2016 can be reported for 12 years. Losses generated in 2017 and the following years can be reported for 5 years. Under the Covid-19 measures, the Portuguese government increased all these periods by 2 years.
In light of the State Budget for 2013, as from that year, deduction of tax losses is limited to 70% of the value of the taxable profit ascertained in the period in question, regardless of the period in which the tax loss was ascertained. Pursuant to the legislation in force in Spain (Basque Country), tax losses generated between 2008 and 2017 can be reported for a period of fifteen years. Deduction of tax losses is limited to 50% of the value of the taxable profit ascertained in the period in question, regardless of the period in which the tax loss was ascertained. In France, tax losses have no limited period of use.
In Brazil, tax losses have no limited period of use, although there is a yearly deduction limit of 30% of the taxable profit ascertained in the period in question. In Angola, tax losses can be reported for a period of 3 years.
Nors ’ companies based in Portugal, in which Nors S.A. directly or indirectly owns more than 75%, are taxed for Corporation Tax in accordance with the “RETGS” (Special Tax Regime for Groups of Companies), provided for in articles 69 and the following articles of the IRC (Portuguese Corporation Tax) Code. For taxation periods starting on or after 1 January 2017, local state tax is applied to the part of taxable profit subject to and not exempt from IRC that is in excess of 1 500 thousand Euros, with a rate of 3% up to 7 500 thousand Euros, a rate of 5% up to 35 000 thousand Euros and of 7% if it is higher than the latter amount.
According to the legislation in force, the tax declarations of Nors ’ companies based in Portugal are subject to review and correction by the tax authorities for a period of four years (five years for Social Security), except when there have been tax losses, when tax benefits have been granted, or inspections, claims or other challenges are in progress, in which case, depending on the circumstances, the deadlines are extended or suspended. As such, the tax declarations of Nors ’ companies since 2016 could still be subject to review.
PAGE 329 CHAPTER 05.
The Board of Directors of Nors believes that any possible corrections resulting from reviews/inspections by the tax authorities on those tax declarations for the years open to inspection should not have a significant effect on the attached consolidated financial statements.
Pursuant to article 88 of the Portuguese Corporation Tax Code, companies based in Portugal are also subject to autonomous taxation on a series of charges at the rates envisaged in the above-mentioned article.
PAGE 330 CHAPTER 05.
At 31st December 2021 and 2020, this item had the following composition:
The Cost of goods sold and materials consumed in the years ended 31st December 2021 and 2020 was ascertained as follows:
inventories Dec 2021 Raw materials and consumables 3 Products and work in progress 4 475 Finished and intermediate products 0 Goods 236 237 240 715 Accumulated impairment losses on Inventories (note 22) -11 797 total 228 918 cogs Dec 2021 Initial Inventories 240 759 Perimeter Variation 0 Net Purchases 787 994 Closing Inventories 236 240 total 780 347 Rental fleet depreciations -12 167 Dec 2020 1 3 490 0 240 758 244 249 -13 806 230 443 Dec 2020 129 065 128 036 587 852 240 759 596 235 -7 958 inventories Dec 2021 Raw materials and consumables 3 Products and work in progress 4 475 Finished and intermediate products 0 Goods 236 237 240 715 Accumulated impairment losses on Inventories (note 22) -11 797 total 228 918 cogs Dec 2021 Initial Inventories 240 759 Perimeter Variation 0 Net Purchases 787 994 Closing Inventories 236 240 total 780 347 Rental fleet depreciations -12 167 Dec 2020 1 3 490 0 240 758 244 249 -13 806 230 443 Dec 2020 129 065 128 036 587 852 240 759 596 235 -7 958 13. inventories PAGE 331 CHAPTER 05.
At 31st December 2021 and 2020, this item had the following composition:
The amounts shown in the statement of financial position are net of accrued impairment losses that were estimated by Nors in accordance with the accounting policy adopted and disclosed, as well as on the assessment of the climate and economic environment at the date of the statement of financial position. Credit risk concentration is limited as the customer base is wide and not inter-related. The Board of Directors believes that the book values of trade accounts receivable is close to their fair value.
To determine the recoverability of the values of trade receivables, the group analyses all changes in the quality of counterparty credit from the date of granting the credit up until the reporting date of the consolidated financial statements. As already mentioned, the group does not have a significant concentration of customer credit risks, given that the risk is diluted over a vast number of customers. We therefore believe that the credit risk does not exceed the recorded impairment losses.
The group uses the simplified approach to calculate and record the estimated credit losses required by IFRS 9, which allows the impairments to be used for estimated losses on all trade balances. In order to measure estimated credit losses, the balances were aggregated based on the shared credit risk characteristics, as well as on the number of overdue days. Impairment losses at 31 December 2020 can be allocated to customers with doubtful debts, corresponding to customers for whom the group has turned to legal support (internal or external) for their recovery.
The amounts of trade balances recorded in assets are not influenced by advances made for acquiring services/goods, which are presented in liabilities in the item “Other accounts payable (customer advances)” and which at 31 December 2021 and 2020, amount to 48 691 thousand Euros and 19 590 thousand Euros, respectively (note 25).
14. customers
customers Dec 2021 Customers, current account 72 616 Customers, bills of exchange receivable 830 73 446 Accumulated impairment losses on customers (nota 22) -4 478 total 68 968 Dec 2020 66 383 1 034 67 416 -4 117 63 300 PAGE 332 CHAPTER 05.
At 31st December 2021 and 2020, this item can be broken down as follows:
Dec 2021 Income tax recoverable 1 451 Income tax payable 4 820 Dec 2020 4 755 3 852 15. current tax assets and liabilities PAGE 333 CHAPTER 05.
16. other accounts receivable
At 31st December 2021 and 2020, this item had the following composition:
The group uses the simplified approach to calculate and record the estimated credit losses required by IFRS 9, which allows the impairments to be used for estimated losses on all trade balances. In order to measure estimated credit losses, the balances were aggregated based on the shared credit risk characteristics, as well as on the number of overdue days. Impairment losses at 31 December 2021 can be allocated to others debtors with doubtful debts, corresponding to third-party balances for whom the group has turned to legal support (internal or external) for their recovery.
“Other balances with the State and other public bodies” corresponds to tax balances receivable/deductible by Nors entities in the various countries where they operate, other than value added tax and income tax for the year.
Dec 2021 Advances to suppliers 2 429 Value Added Tax 4 136 Other balances with State and other public entities 4 647 Bonus receivable 3 214 Accrued Income 3 958 Other debtors 10 217 28 601 Impairment losses (note 25) -72 current asset 28 529 28 290 non-current asset 239 Dec 2020 2 369 4 716 2 600 3 170 3 942 7 131 23 929 -120 23 809 23 476 333 PAGE 334 CHAPTER 05.
At 31st December 2021 and 2020, this item in Assets had the following composition:
Nors recognises expenses according to their economic specialisation, regardless of their payment. At the end of each period, expenses already paid, but which should only economically affect the following period(s), are deferred in this item.
The balance of other expenses to be recognised relates to deferred invoices awaiting credit notes, sickness allowance and rentals to be recognised in short-term contracts.
At 31st December 2021 and 2020, this item can be broken down as follows:
Dec 2021 Insurances to be recognized 313 Interest to be recognized 25 Other expenses to be recognized 4 972 total 5 310 Dec 2021 Sales to be recognized 24 Other income to be recognized 5 337 Margin to be recognised - contracts with repurchase agreement 267 total 5 629 Dec 2020 282 13 4 204 4 499 Dec 2020 92 5 882 647 6 621 Dec 2021 Insurances to be recognized 313 Interest to be recognized 25 Other expenses to be recognized 4 972 total 5 310 Dec 2021 Sales to be recognized 24 Other income to be recognized 5 337 Margin to be recognised - contracts with repurchase agreement 267 total 5 629 Dec 2020 282 13 4 204 4 499 Dec 2020 92 5 882 647 6 621 17. deferrals PAGE 335 CHAPTER 05.
At 31 December 2021 and 2020 the breakdown of cash and cash equivalents was as follows:
Explanations on the items in the Statement of Cash Flows is summarised in the table below:
Other receipts/payments Payments of Withholding Tax
Other
Payments in Financial Investments in 2020 refers to the acquisition of Treasury Bonds and to the payment of 27 583 thousand Euros was made related to the acquisition of Strongco Corporation (see note 5).
Receipts in Financial Divestments refer to Treasury Bonds which matured during the period and in 2020 the receipt of 6 900 thousand Euros was recorded from the disposal of Dália (see note 5).
In addition, dividends were received from the affiliate Ascendum, SA in the sum of 4 000 thousand Euros, in both years.
18. cash in
hand and at banks
Cash 356 Bank deposits 66 320 total 66 675 Dec 2021 366 49 739 50 105 Dec 2020 item source of flows
Receivables from Real estate Rents Compensation Claims Cash 356 Bank deposits 66 320 total 66 675 Dec 2021 366 49 739 50 105 Dec 2020 item source of flows
Payments of Social Security Contributions Withheld Valued Added Tax Payments and Receipts
Receivables from Real estate Rents Compensation Claims PAGE 336 CHAPTER 05.
receipts/payments Payments of Withholding Tax Payments of Social Security Contributions Withheld Valued Added Tax Payments and Receipts
At 31 December 2021, the capital of Nors , S.A, which is fully subscribed and paid up, is 30 million Euros (30,000,000 shares with a nominal value of 1 (one) euro).
Identification of the corporate entities with more than 20% of the subscribed capital is as follows:
company and registered office holding nominal value
capital
Earnings per share may be expressed from a “basic earnings” or “diluted earnings” point of view.
Basic earnings per share is calculated by dividing the profits or losses for the year by the weighted average number of ordinary shares in circulation during the period. Diluted earnings per share is calculated by dividing the profits or losses for the year by the weighted average number of ordinary outstanding shares during the period, adding the number of ordinary shares that can be issued, as a result of converting other instruments issued by the entity.
During the 2021 and 2020 financial years, there was no issue/reduction or amortisation of shares, and so the average number of ordinary outstanding shares during the year was 30,000,000.
There was also no issue or amortisation of any instruments that could be converted into ordinary shares.
There are no shares with special and/or limited rights. Earnings per share is disclosed below:
percentage of
PrimeJervell Holdingconsultoria e gestão, S.A. Registered offices: Largo do Terreiro, nº4 4050-603 Porto 18 801 000 1,00€ 62,80% CADENA - S.G.P.S., S.A. Registered offices: Rua Alberto Oliveira, 83 8 700 000 1,00€ 29,00% Net income for the period 45 550 294 Average number of ordinary shares 30 000 000 basic earnings per share 1,52 Dec 2021 14 884 658 30 000 000 0,50 Dec 2020 19. breakdown of share capital and earnings per share PAGE 337 CHAPTER 05.
Dividends
In accordance with the decision at the General Partners Assembly, this year dividends were paid through the distribution of free reserves in the total amount of 6 000 thousand Euros.
Legal reserve
Portuguese commercial legislation establishes that at least 5% of the annual net income of each company, ascertained in their individual accounts, must be used to reinforce the legal reserve until the latter represents at least 20% of the share capital. This reserve is not distributable unless the company is liquidated, but it may be used to absorb losses after other reserves are depleted or incorporated into capital.
The sum shown in the Financial Position corresponds to the Legal Reserve of Nors , S.A.
Fair value reserves
Fair value reserves reflect the hedge accounting of the variation in market value of the hedging instrument.
Adjustments to financial assets
Adjustment to financial assets covers variations from applying the equity method to the company’s affiliates. This reserve cannot be distributed to the partners.
Retained earnings and other reserves
This items includes conversion reserves that reflect the foreign exchange variations that occurred when transposing the subsidiaries’ financial statements in a currency other than the euro, as well as revaluation surplus in the amount of 12 478 thousand Euros calculated before the adoption of IFRS.
Reserves available for distribution to the partners are ascertained based on the Individual Financial Statements of Nors , S.A.
20.
equity
PAGE 338 CHAPTER 05.
21. non-controlling interests
Movement in the item in the years ended 31st December 2021 and 2020 was as follows:
non-controlling interests
opening balance at 1 January
Income for the year attributable to non-controlling interests
Information on the affiliates that contribute to Non-Controlling Interests can be found in note 4, of the balance on 31 December 2021, the most relevant amount refers to Auto-Sueco Angola (10 329 thousand Euros).
Dividends distributed Impact of exchange rate variations Other changes in equity in associated companies closing balance at 31 December Dec 2021 15 071 -15 -3 779 1 010 -437 11 851 Dec 2020 16 577 139 0 -1 478 -168 15 071 Dec 2021 opening balance customers other debtors inventories Translation differences 5 0 771 Changes in perimeter 0 169 0 Increases 1 202 33 -101 16 3 135 4 117 120 13 806 Reversals -1 304 -1 249 Uses/adjustments 295 -4 666 end balance 4 478 72 Dec 2020 11 797 customers other debtors inventories -16 0 -478 2 562 -271 7 341 1 260 53 -74 -47 4 973 4 458 203 4 274 -1 105 -1 217 -2 788 -1 086 4 117 120 13 806
PAGE 339 CHAPTER 05.
22. provisions and accrued impairment losses
22.1 accrued impairment losses
Movements that took place in “Accrued impairment losses” during the years ended 31st December 2021 and 2020 were as follows:
22.2 provisions
At 31st December 2021 and 2020, the item “Provisions” can be broken down as follows:
Other changes in equity in associated companies closing balance at 31 December -437 11 851 -168 15 071 Dec 2021 opening balance customers other debtors inventories Translation differences 5 0 771 Changes in perimeter 0 169 0 Increases 1 202 33 -101 16 3 135 4 117 120 13 806 Reversals -1 304 -1 249 Uses/adjustments 295 -4 666 end balance 4 478 72 Dec 2020 11 797 customers other debtors inventories -16 0 -478 2 562 -271 7 341 1 260 53 -74 -47 4 973 4 458 203 4 274 -1 105 -1 217 -2 788 -1 086 4 117 120 13 806 Dec 2021 Taxes 429 Guarantees to customers 292 Ongoing legal proceedings 747 Pension plans with defined benefits Other provisions 3 739 total 8 067 Post-employment benefits 718 2 141 Dec 2020 9 254 1 355 133 10 507 686 8 071 opening balance Translation differences Changes in perimeter Dec 2021 10 507 587 0 Dec 2020 4 951 -77 7 733
PAGE 340 CHAPTER 05.
The movement that took place in “Provisions” during the years ended 31st December 2021 and 2020 was the following:
Given the unpredictability at the time of reversing provisions and given their intended nature, Nors has not financially updated them.
Each type of provision takes into consideration:
a. Provisions for Taxes
Provisions for Taxes refers to provisions set up to cover additional tax settlements arising from tax contingencies.
b. Provisions for Customer Guarantees
In the item “Provisions for Customer Guarantees”, Nors discloses the best estimates of the current obligations with uncertain timing, related to guarantees provided to customers, arising from the normal course of business.
c. Lawsuits in Progress
The item “Lawsuits in Progress”, also discloses the best estimates of the overall amount of outflows that might take place in the future, arising from proceedings initiated in court by third parties.
Pension plans with defined benefits Other provisions 3 739 total 8 067 2 141 133 10 507 8 071 opening balance Translation differences Changes in perimeter Uses/adjustments end balance Dec 2021 10 507 587 0 -321 8 067 Increases 4 259 Reversals -33 Equity change -6 933 Dec 2020 4 951 -77 7 733 -2 807 10 507 -206 -42 955
PAGE 341 CHAPTER 05.
d. Post-employment benefits and Defined benefit pension funds
The item “Employee retirement benefits” includes post-employment benefits acquired by former employees of Strongco, where such benefits are unfunded liabilities.
The item “Defined benefit pension funds” includes post-employment benefits acquired by current and former employees of Strongco, where such benefits are funded liabilities, but whose value is insufficient to meet the projected future liabilities.
These provisions are exclusively associated to the entities of the group in Canada and the following information should be read taking that into consideration.
It is broken down as follows:
Employee retirement benefits correspond to 3 retired beneficiaries, and these are linked to benefits with healthcare and dental plans which are unfunded liabilities.
The employee pension fund has benefits attributable to current and former employees, among whom only 29 employees are still adding benefit. Prior to its acquisition by the Nors Group, Strongco transferred the majority of its employees participating in the defined benefit pension plan to a closed defined contribution plan with effect as of 1st January 2019. The employees maintained their rights to the pension benefits they had earned up until 31st December 2018.
The executive pension fund currently has 6 beneficiaries already in retirement.
opening balance Translation differences Changes in perimeter end balance Dec 2021 8 757 754 0 2 859 Reinforcements net of payments 280 Equity change -6 933 Dec 2020 0 -143 7 733 8 757 212 955 Dec 2021 Retiring Allowance 10 Post-retirement Benefits 708 Employee plan 2 000 post-employment benefits 718 pension plans with defined benefits 2 141 total 2 859 Executive plan 142 Dec 2020 10 675 7 911 686 8 071 8 757 161 PAGE 342 CHAPTER 05.
The movements that took place were:
The current position of each defined benefit pension fund is as follows:
Fair value of plan assets
The risks associated with these plans are similar to those typical of benefit plans, including market risk, interest rate risk, liquidity risk, credit risk, longevity risk, etc. There are no significant risks associated with these plans that might be considered unusual or require special disclosure.
opening balance Translation differences Changes in perimeter end balance Dec 2021 8 757 754 0 2 859 Reinforcements net of payments 280 Equity change -6 933 Dec 2020 0 -143 7 733 8 757 212 955 Employee plan 2 000 pension plans with defined benefits 2 141 total 2 859 Executive plan 142 7 911 8 071 8 757 161
Present value of funded obligations funded status of plan Dec 2021 executive plan employee plan 705 846 -142 accrued benefit liability 142 36 574 38 574 -2 000 2 000 Shares Dec 2021 employee plan employee plan 0,0% total 100,0% 49,8% 100,0% Bonds 97,8% 48,7% Cash and Money market 2,2% 1,5% Dec 2020 employee plan employee plan 695 856 -161 161 31 397 39 308 -7 911 7 911 Dec 2020 employee plan employee plan 44,2% 100,0% 51,4% 100,0% 52,4% 47,8% 3,4% 0,8% PAGE 343 CHAPTER 05.
The investment structure of the assets of the plan at 31st December 2021 and 2020 is the following:
Fair value of plan assets
The group measures its accumulated benefit liabilities and the fair value of the assets of the plan for accounting purposes at 31 December of each year. For the employee pension plan, the most recent actuarial evaluation for regulatory reporting purposes was carried out on 30th Jun 2021 and the next evaluation must be carried out based on the position at 30th Jun 2024, to be submitted during 2024. For the executive pension plan, the most recent actuarial evaluation for financing purposes purposes was carried out on 31st December 2020 and the next evaluation must be carried out based on the position at 31st December 2021, to be submitted during 2022.
The main actuarial assumptions used were the following:
Present value of funded obligations funded status of plan 846 -142 accrued benefit liability 142 38 574 -2 000 2 000 Shares Dec 2021 employee plan employee plan 0,0% total 100,0% 49,8% 100,0% 2,6% 3,3% Bonds 97,8% 48,7% Cash and Money market 2,2% 1,5% Male aged 45 Female aged 45 Dec 2021 employee plan employee plan duration of plan in years discount rate average life expectancy: 6,1 40,6 43,9 14,8 Male aged 65 Female aged 65 21,9 24,3 21,9 24,3 856 -161 161 39 308 -7 911 7 911 Dec 2020 employee plan employee plan 44,2% 100,0% 51,4% 100,0% 2,0% 2,6% 52,4% 47,8% 3,4% 0,8% Dec 2020 employee plan employee plan 6,7 40,5 43,8 16,5 21,8 24,2 21,8 24,2
Present value of funded obligations funded status of plan Dec 2021 executive plan employee plan 705 846 -142 accrued benefit liability 142 36 574 38 574 -2 000 2 000 Shares Dec 2021 employee plan employee plan 0,0% total 100,0% 49,8% 100,0% 2,6% 3,3% Bonds 97,8% 48,7% Cash and Money market 2,2% 1,5% Male aged 45 Female aged 45 Dec 2021 employee plan employee plan duration of plan in years discount rate average life expectancy: 6,1 40,6 43,9 14,8 Male aged 65 Female aged 65 21,9 24,3 21,9 24,3 Dec 2020 employee plan employee plan 695 856 -161 161 31 397 39 308 -7 911 7 911 Dec 2020 employee plan employee plan 44,2% 100,0% 51,4% 100,0% 2,0% 2,6% 52,4% 47,8% 3,4% 0,8% Dec 2020 employee plan employee plan 6,7 40,5 43,8 16,5 21,8 24,2 21,8 24,2 PAGE 344 CHAPTER 05.
The sensitivity of the main assumption of the current value of future liabilities is the following:
e. Other Provisions
In Other Provisions, a full set of estimates of other present obligations with uncertain timing are disclosed, which are not included in the others categories indicated above.
employee plan valuation assumption 1p.p. change impact on provisions Discount rate increase 4,3% 3,3% -5 007 Discount rate decrease 3,3% 6 357 Salary growth rate 2,9% 3,9% 2,3% 11 executive plan valuation assumption 1p.p. change impact on provisions Discount rate increase 3,6% 2,6% -49 Discount rate decrease 2,6% 55 1,6% PAGE 345 CHAPTER 05.
At 31st December 2021 and 2020, the item “Loans Obtained” is broken down as follows:
For Commercial Paper Programs, repayment is considered on the date of termination regardless of the terms for which they are contracted.
The movements that took place in the item ”Loans obtained” are explained as follows:
Dec 2021 funding obtained current noncurrent total Commercial Paper 61 765 5 750 0 0 0 67 515 Secured current accounts 9 174 9 174 Bank Loan 4 000 26 600 30 600 Commercial Credit Lines 144 144 Financial Leases 23 691 23 691 Other Financing Obtained 217 152 369 total 55 476 101 017 Dec 2020 156 493 2021 opening balance at 1 January 208 200 Exchange effect 5 822 Receipts for financing obtained 127 717 Payment for financing obtained -185 246 closing balance at 31 December 156 493 12 500 Bank Overdrafts 12 500 25 000 current noncurrent total 62 500 0 0 0 0 62 500 3 198 3 198 5 904 38 030 43 933 86 86 73 136 73 136 112 235 346 82 436 125 764 208 200 25 000 0 25 000 Perimeter variation 0 2020 159 958 -1 085 193 188 -239 539 208 200 95 678 Dec 2021 funding obtained current noncurrent total Commercial Paper 61 765 5 750 0 0 0 67 515 Secured current accounts 9 174 9 174 Bank Loan 4 000 26 600 30 600 Commercial Credit Lines 144 144 Financial Leases 23 23 691 Other Financing Obtained 217 152 369 total 55 476 101 017 Dec 2020 156 493 2021 opening balance at 1 January 208 200 Exchange effect 5 822 Receipts for financing obtained 127 717 Payment for financing obtained -185 246 closing balance at 31 December 156 493 12 500 Bank Overdrafts 12 500 25 000 current noncurrent total 62 500 0 0 0 0 62 500 3 198 3 198 5 904 38 030 43 933 86 86 73 73 112 235 346 82 436 125 764 208 200 25 000 0 25 000 Perimeter variation 0 2020 159 958 -1 085 193 188 -239 539 208 200 95 678
PAGE 346 CHAPTER 05.
23. loans obtained
The debenture loan has the following conditions:
- Amount: 25 million Euros
- Date of the contract and subscription: 12 March 2020
- Coupon: Euribor 6 months + spread
- Date of Maturity: 2023
At 31st December 2021, the maturity of non-current loans obtained is the following:
At 31st December 2021, Nors had 540 723 thousand Euros available in credit lines allocated as follows:
2023 2024 2025+ Commercial Paper 9 488 15 315 36 962 Bank Loan 26 600 Financial Leases 78 64 total 54 493 9 552 36 972 Bond Loan 12 500 0 0 10 0 0 hired credit limit available credit limit Commercial Paper 165 500 97 985 Secured Current Accounts 46 822 37 648 Bank Loan 30 600 Bank Overdrafts 11 971 11 827 Commercial Credit Lines 260 349 236 658 Financial Leases 481 Bond Loan 25 000 0 112 0 total 540 723 384 230
PAGE 347 CHAPTER 05.
At 31st December 2021 and 2020, this item was composed of current supplier balances payable, which are all due in the short term. On these dates, the aggregate balance of the item suppliers was not affected by payment plans that incorporated interest payment and so the financial risk related to changes in interest rates here is residual. Advances to suppliers are presented in Assets, in the item “Other accounts receivable” (see note 16).
24. suppliers PAGE 348 CHAPTER 05.
At 31st December 2021 and 2020 this item had the following composition:
Other balances with State and other public entities
Investment Providers
Remunerations and Expenses
Accrued Interest Expenses
Accrued Bonus Expenses
Operating Costs Payable
Other Creditors due to Additional Expenses
Other Creditors
total
The increase in "Advances from Customers" is directly related to advance payments from customers to guarantee future deliveries of vehicles and equipment, and are due in a period of less than 12 months.
Dec 2021 48 691 733 12 004 1 184 2 183 808 13 308 423 1 142 443 14 222 16 754 111 895 Dec 2020 19 590 712 10 966 1 174 1 567 259 9 425 658 1 165 374 12 165 16 529 74 586 current Advances from Customers
Withholding of Income Taxes Value Added Tax Contributions to Social Security
25. other accounts payable PAGE 349 CHAPTER 05.
The Board of Directors regularly assesses Nors ’ degree of exposure to various risks inherent to the activity of the different companies, namely price risk, interest rate risk and exchange rate risk.
As at 31 December 2021 and 2020, the degree of exposure to the risk of variation in interest rate was considered low, taking into account that a significant part of the bank liabilities is represented by medium/long-term credit lines, with previously agreed financing terms.
On the other hand, and although an increasing portion of the Consolidated Financial Position will be subject to the impacts of exchange rate variations (Euro/US Dollar, Euro/Real and Euro/Canadian Dollar), the degree of exposure was considered to be controlled by the policy followed of natural hedging through the contracting of bank loans in these currencies, especially in US dollars. As of 31st December 2021 and 2020, Nors had not negotiated any type of derivative financial instrument for exchange rate related to these currencies.
However, in order to hedge the Kwanza/US dollar risk on its operations in Angola, the group entered into a "Non-Deliverable Foward" type contract, with the following characteristics:
This instrument was accounted for as hedging, having generated the recognition of 564 thousand Euros in financial expenses in 2020, recognised in the item “Income from financial activity”, enabling gains to be recognised (hedging equivalent losses) of 547 thousand Euros in the item “Net foreign exchange differences”. In 2021, the impact of this contract was immaterial and no new similar instrument was contracted.
Nevertheless, the most recent changes in the capital market and the higher degree of exposure of Nors ’ Consolidated Financial Position to foreign exchange variations in the above-mentioned currencies or others, may lead the Board of Directors of Nors to introduce, in the short term, in its risk management, further derivative financial instruments that are duly adjusted to the type of respective risks.
tipo data operação data início data vencimento valor nominal Swap Taxa Fixa - Plain Vanilla 13/06/2014 17/06/2014 17/06/2019 30 000 0 type market value Dec 2020 start maturity date nominal value NDF - AKZ/USD 13/07/2020 19/01/21 5,000 thousands USD 26. derivative financial instruments PAGE 350 CHAPTER 05.
27.sales and services provided
In the years ended 31st December 2021 and 2020, the breakdown of sales and services provided by business area was as follows:
In addition, the distribution of sales and services provided by geographical market is as follows:
sales by business area 2021 NORS MOBILITY 607 091 NORS OFF-ROAD 338 903 NORS AFTERMARKET 55 302 NORS VENTURES 14 725 total 1 016 021 302 202 Portugal Others 32 056 sales by region 2021 total 1 016 021 2020 498 367 207 436 60 642 14 861 781 305 276 012 62 566 Angola 64 322 29 646 2020 781 305 291 098 Brazil 230 841 328 099 180 484 Canada sales by business area 2021 NORS MOBILITY 607 091 NORS OFF-ROAD 338 903 NORS AFTERMARKET 55 302 NORS VENTURES 14 725 total 1 016 021 302 202 Portugal Others 32 056 sales by region 2021 total 1 016 021 2020 498 367 207 436 60 642 14 861 781 305 276 012 62 566 Angola 64 322 29 646 2020 781 305 291 098 Brazil 230 841 328 099 180 484 Canada PAGE 351 CHAPTER 05.
At 31st December 2021 and 2020, the item “External supplies and services” has the following composition:
The main variations seen correspond to the increase in business and to adjusting Nors ’ available resources for the predicted growth cycle.
The amounts in “Rentals and leases” correspond to the expenses with short-term rental contracts (less than 12 months) and/or whose underlying asset value is considered to be low.
2021 15 397 920 1 467 4 398 3 092 3 386 958 1 841 4 902 1 316 3 858 1 511 3 814 total 50 161 1 535 1 767 2020 17 729 662 1 437 3 619 2 443 2 496 936 1 668 4 890 1 294 4 085 1 543 3 300 48 888 1 155 1 632 Subcontracts/Specialized Work Advertising and Promotion Surveillance and Security Maintenance and Repairs Electricity and Fuel Travel and Accommodation Leases and Rents Insurance Guarantees Contracts Transport Communications Other External Supplies and Services Fast wearing tools and utensils Cleanliness, hygiene and comfort 28. external supplies and services PAGE 352 CHAPTER 05.
Staff costs in the years ended 31st December 2021 and 2020 are broken down as follows:
At 31st December 2021 and 2020, the number of staff in Nors ’ service was the following:
Remuneration of the members of Nors ’ governing bodies in the years 2021 and 2020 was as follows:
2021 2 039 72 379 800 12 932 7 277 total 95 426 2020 1 853 55 378 1 323 10 314 5 891 74 758 Dec 2021 2 580 total 2 580 Dec 2020 2 586 2 586 2021 Nors, S.A. 2 031 Auto Sueco (Angola) 8 total 2 039 2020 1 844 9 1 853 Remuneration of Corporate Bodies Staff Remuneration Compensation Charges on Remuneration Other Staff Costs Number of Employees
PAGE 353 CHAPTER 05.
29. staff costs
30. other income and gains/other expenses and losses
At 31st December 2021 and 2020, the items “Other income and gains” and “Other expenses and losses” has the following composition:
other income and gains
The increase in these items is directly related to the entry of Strongco in the Nors Group’s consolidation perimeter (see note 5)
2021 106 1 321 691 178 2 634 894 1 460 119 743 2 387 10 534 2021 -248 -3 116 -2 490 -433 -193 -93 -244 -1 276 -143 -2 499 -10 735 2020 49 1 077 91 135 3 024 826 1 172 138 955 4 022 11 491 2020 -264 -3 608 -2 069 -124 -156 -89 -3 -2 225 -178 -3 055 -11 770
and gains Cash Discounts Capital Gains on Disposal of property, plant and equipment and Investment properties Surplus tax estimate Interest received from operating activities Recoveries of costs and concessions Rents and other income on investment properties Income under Guarantees Other supplementary income Remainder and other regularization of inventories Others total other costs and losses Cash discounts granted Tax Inventory Losses Corrections in relation to previous financial years Gifts and inventory samples Interested paid on operating activities Losses on sales of tangible fixed assets Other expenses on funding activities Donations Other total 2021 106 1 321 691 178 2 634 894 1 460 119 743 2 387 10 534 2021 -248 -3 116 -2 490 -433 -193 -93 -244 -1 276 -143 -2 499 -10 735 2020 49 1 077 91 135 3 024 826 1 172 138 955 4 022 11 491 2020 -264 -3 608 -2 069 -124 -156 -89 -3 -2 225 -178 -3 055 -11 770
other income
Cash Discounts Capital Gains on Disposal of property, plant and equipment and Investment properties Surplus tax estimate Interest received from operating activities Recoveries of costs and concessions Rents and other income on investment properties Income under Guarantees Other supplementary income Remainder and other regularization of inventories Others total other costs and losses Cash discounts granted Tax Inventory Losses Corrections in relation to previous financial years Gifts and inventory samples Interested paid on operating activities Losses on sales of tangible fixed assets Other expenses on funding activities Donations Other total
PAGE 354 CHAPTER 05.
31.income from financing
At 31st December 2021 and 2020, this item had the following composition:
2021 1 554 -993 -317 -4 251 -23 -319 -4 324 -623 -2 832 -12 128 2020 3 473 -1 481 -256 -6 085 -30 -291 -4 650 -496 -3 935 -13 751 Interest and similar income
in bank loans
Loan interests on bonds
on bank loans
Financial Leases
obtained Interest
- Commercial Paper
Interest
- Other Interest on
Interest on operating leases - Repurchase agreements
operating
Investment income tax Other interest and similar expenses total PAGE 355 CHAPTER 05.
Interest on
lease - Leases under IFRS 16
Income tax recognised in the years ended 31st December 2021 and 2020 is broken down as follows
The breakdown of Deferred Taxes can be found in note 12.
At 31st December 2021 and 2020, the tax rates used to ascertain current and deferred taxes were the following
Dec 2021 -14 682 2 450 -12 232 country of origin of branch Dec 2021 Portugal 21%-24,5% Angola 25% Brazil 34% Spain 20,0% France 26,5% Namibia 34% Botswana 22% Mazambique 32% Canada 25%-30% Dec 2020 -7 238 -970 -8 208 Dec 2020 21%-24,5% 25% 34% 20,0% 28,0% 34% 22% 32% 25%-30% Current Tax Deferred Tax
32. income tax PAGE 356 CHAPTER 05.
The effective tax rate by country is:
country Spain Portugal Angola Brazil Africa total Positive Income before Tax 34 637 437 0 8 625 27 417 1 975 86 007 Tax for financial year -658 -3 465 -7 167 -567 -13 295 Effective tax rate 2% 0% 40% 26% 29% 15% Negative Income before Tax -24 339 -2 154 -1 732 0 0 0 -28 224 Tax for financial year 1 241 0 -178 0 1 063 Effective tax rate 5% 0% -10% 0% 0% 4% Canadá 12 915 -1 437 11% 0 0 0% Income before Tax 10 298 -1 717 6 894 27 417 1 975 57 782 Tax for financial year 583 0 -3 643 -7 167 -12 232 Effective tax rate -6% 0% 53% 26% 29% 21% 12 915 -1 437 -567 11% PAGE 357 CHAPTER 05.
At 31st December 2021, the financial assets and liabilities are broken down as follows:
Only Financial Assets - Customers and Other accounts receivable - show impairment losses, as set out in Notes 14, 16 and 22.
9 366 24 571 68 968 66 675 169 581 156 493 86 796 82 358 167 251 492 898 financial assets Debt Instruments Other Accounts Receivable Customers Cash and Bank Deposits
liabilities
Obtained
by Operating Lease
Payable
valuation method book value Amortized cost Amortized cost Amortized cost Amortized cost valuation method book value Amortized cost Amortized cost Amortized cost Amortized cost
financial
Financing
Liabilities
Others Accounts
Suppliers
PAGE 358 CHAPTER 05.
33. financial assets and liabilities
Gains and losses in financial assets and liabilities in 2021 and 2020 were the following:
Interest and similar expenses from financial assets in 2021 and 2020 were the following:
gains/(losses)
Foreign exchange differences on financial assets and liabilities in 2021 and 2020 were the following:
exchange differences
Foreign exchange rate gains
Foreign exchange rate losses
gains/(losses)
2021 171 171 2021 1 732 -13 775 -12 043 0 0 0 15 792 -12 357 3 436 2021 2020 -135 -135 2020 3 608 -17 312 -13 704 0 0 0 14 623 -15 127 -504 2020 gains/(losses) gains and losses Accounts Receivable Other assets at amortized cost Cash and bank deposits gains and losses Accounts Receivable Liabilities at amortized cost gains/(losses) Assets available for sale exchange differences Foreign exchange rate gains Foreign exchange rate losses gains/(losses) 2021 171 171 2021 1 732 -13 775 -12 043 0 0 0 15 792 -12 357 3 436 2021 2020 -135 -135 2020 3 608 -17 312 -13 704 0 0 0 14 623 -15 127 -504 2020
gains and losses Accounts Receivable Other assets at amortized cost Cash and bank deposits gains and losses Accounts Receivable Liabilities at amortized cost
gains/(losses)
Assets available for sale
PAGE 359 CHAPTER 05.
The balances and transactions between Nors and its subsidiaries, which are related entities of Nors , were eliminated from the consolidation process, and will therefore not be disclosed in this Note.
a. Transactions
The breakdown of transactions between Nors and related entities, can be summarised as follows:
sales of products and services 2021 Group Ascendum 14 875 14 875 purchases of products and services 2021 Group Ascendum 1 917 1 917 other income and gains 2021 Group Ascendum 333 Bonusavailable Nortesaga Investimentos SGPS Lda 60 856 interest and similar income obtained 2021 Nortesaga Investimentos SGPS Lda 15 15 23 2020 17 425 17 425 2020 0 0 2020 322 12 432 2020 2 2 98 Groupauto Portugal & PALOP 13 14 0 0 interest and similar income obtained 2021 Group Ascendum 0 2020 0 interest and similar income obtained 2021 Nortesaga Investimentos SGPS Lda 0 2020 0 Groupauto Portugal & PALOP 441 0 34. related entities PAGE 360 CHAPTER 05.
The purchase and sale of goods and services provided to related entities were carried out at market prices.
b. Balances
The breakdown of transactions between Nors and related entities can be summarised as follows:
customers Dec 2021 Group Ascendum 2 449 Bonusavailable Nortesaga Investimentos SGPS Lda 21 2 733 suppliers Dec 2021 Group Ascendum 470 other accounts receivable Dec 2021 Group Ascendum 0 103 other accounts payable Dec 2021 Group Ascendum 100 100 64 Bonusavailable 78 Dec 2020 1 616 4 1 627 Dec 2020 629 Dec 2020 5 342 Dec 2020 0 0 8 87 Bonusavailable Nortesaga Investimentos SGPS Lda 3 479 6 0 629 0 Nortesaga Investimentos SGPS Lda 26 251 Groupauto Portugal & PALOP 199 0 PAGE 361 CHAPTER 05.
35. contingent assets and liabilities
The company has contingent liabilities regarding bank guarantees and another kind, and other contingencies related to its business. This is the summary of the guarantees:
Bank Guarantees refer essentially to guarantees provided to public bodies within the scope of tenders and also guarantees to customers and suppliers within the scope of Nors ’ operations.
2021 company guarantees provided to banking entities guarantees provided to importers of represented brands guarantees provided in public tenders other guarantees total Nors, S.A. 3 865 1 098 1 694 3 000 9 657 Auto Sueco Portugal, S.A. 1 514 169 1 514 Auto Sueco II Automóveis, S.A. 9 930 9 930 Sotkon Portugal 846 Galius, S.A. 846 79 169 total 3 865 11 028 4 302 3 000 22 194 Sotkon Espanha 79 2020 company guarantees provided to banking entities guarantees provided to importers of represented brands guarantees provided in public tenders other guarantees total Nors, S.A. 4 430 1 100 1 809 7 338 Auto Sueco Portugal, S.A. 912 165 912 Auto Sueco II Automóveis, S.A. 8 430 8 430 Sotkon Portugal 838 Galius, S.A. 838 61 165 total 4 430 9 530 3 785 0 17 744 Sotkon Espanha 61 2021 company guarantees provided to banking entities guarantees provided to importers of represented brands guarantees provided in public tenders other guarantees total Nors, S.A. 3 865 1 098 1 694 3 000 9 657 Auto Sueco Portugal, S.A. 1 514 169 1 514 Auto Sueco II Automóveis, S.A. 9 930 9 930 Sotkon Portugal 846 Galius, S.A. 846 79 169 total 3 865 11 028 4 302 3 000 22 194 Sotkon Espanha 79 2020 company guarantees provided to banking entities guarantees provided to importers of represented brands guarantees provided in public tenders other guarantees total Nors, S.A. 4 430 1 100 1 809 7 338 Auto Sueco Portugal, S.A. 912 165 912 Auto Sueco II Automóveis, S.A. 8 430 8 430 Sotkon Portugal 838 Galius, S.A. 838 61 165 total 4 430 9 530 3 785 0 17 744 Sotkon Espanha 61
PAGE 362 CHAPTER 05.
36. financial commitments undertaken and not included in the consolidated statement of financial position
At 31 December 2021 and 2020, Nors had not undertaken any significant financial commitments that are not included in the consolidated statement of financial position.
PAGE 363 CHAPTER 05.
37. remuneration of the statutory auditor
In the 2021 and 2020 financial years, the fees paid to the firms of statutory auditors in the various countries in which Nors is present is related to the companies included in the consolidation using the full method, and is as follows:
In 2020, the statutory audit firms corresponded to firms in the PwC international network (network of entities that are members of PricewaterhouseCoopers International Limited - PwCIL) in most geographies, and in 2021 the change was made to firms in the KPMG international network (made up of independent member firms associated with KPMG International Limited).
fees 2021 total 414 2020 606
PAGE 364 CHAPTER 05.
Nors adopts the necessary measures regarding the environment, with the aim of complying with the legislation in force. The Board of Directors of Nors does not estimate that there are any risks related to environmental protection and improvement, and received no administrative infractions related to this subject during the 2021 financial year.
38. information on the environment PAGE 365 CHAPTER 05.
The current conflict situation between Russia and Ukraine is having a significant impact in Europe, whose direct consequences for the company's activity are still difficult to estimate. Although the company's direct exposure to these markets is non-existent, the Board of Directors constantly monitors possible indirect impacts and, as of today, does not anticipate relevant impacts on the Group's activity related to the unfolding of the conflict and associated energy crisis.
On 3rd January 2022, the activity of AS Parts Angola was incorporated into Civipartes Angola, by way of transfer. The strategy of the Nors Group aims at the convergence of similar businesses in order to obtain maximum efficiency in structural costs and commercial synergies. This transfer will also result in improved financial ratios in accordance with the best market practices. Also in pursuit of this objective, on 1st April 2022, the company Civiparts, S.A. was merged into the company Newonedrive, S.A., with retroactive effect from 1st January 2022.
There were no more relevant facts after the closure of the accounts.
39. subsequent events PAGE 366 CHAPTER 05.
40. approval of the financial statements
These financial statements were approved by the Board of Directors on 12th May 2022. In addition, the attached financial statements at 31st December 2021 are pending approval by the General Shareholders Assembly. However, the Board of Directors of Nors believes they will be approved without any amendments.
Porto, 12th May 2022
Tomás Jervell
Álvaro Nascimento
Álvaro Neto
Artur Santos Silva
Francisco Jervell
Francisco Ramos
Jorge Nieto Guimarães
José Jensen Leite de Faria
José Manuel Bessa Leite de Faria
Júlio Rodrigues
Luís Jervell
Paulo Jervell
Rui Miranda
PAGE 367 CHAPTER 05.
driving trust through long-lasting relationships


www.nors.com
