RETURN OF THE ASHES?
Wildfires and the ozone layer


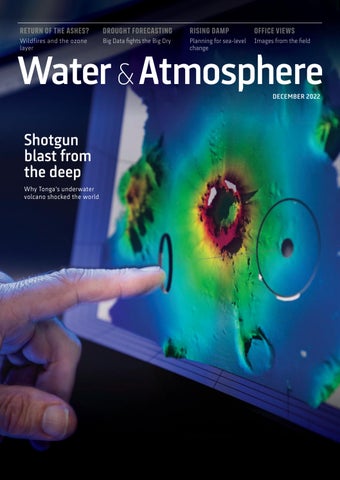


Why Tonga's underwater volcano shocked the world
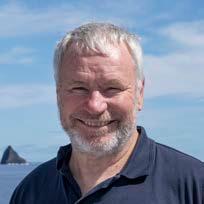
NIWA Chief Executive John Morgan urges New Zealanders to face their climate future today.
Are mega wildfires, fuelled by global warming, creating new problems for our ozone layer? 10


Researchers head out to discover why a little-known underwater volcano made such a global splash.
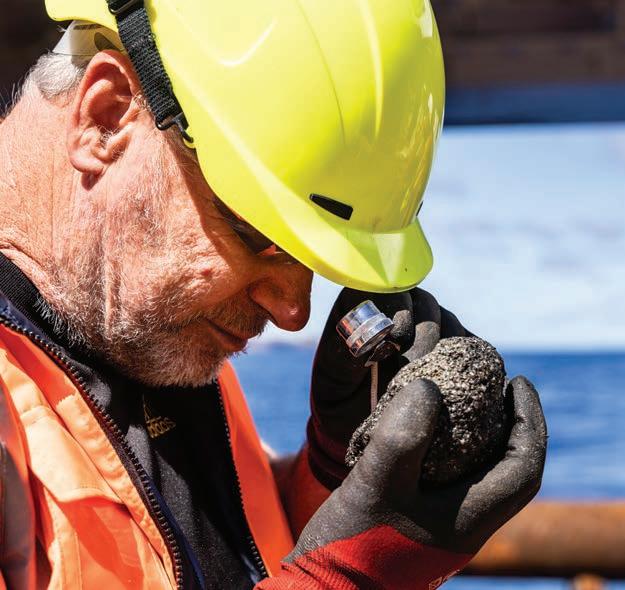
Meet the hazard scientist with first-hand experience of risk.
Using Big
to help
fight the Big Dry.
A
NIWA
The science is very clear.
The World Meteorological Organization announced just a matter of weeks ago that the ongoing march of atmospheric levels of all three greenhouse gases – carbon dioxide, nitrous oxide and methane – have reached record highs.
Evidence of the global warming and climate disruption that inevitably follows the continuing build-up of these heat trapping gases is equally very clear.
Every decade since 1980 has been warmer than the one before, and the past eight years have been the world’s hottest since records started.
Glaciers are retreating, seas are rising, oceans warming and acidifying, and extreme weather events seem to be on international repeat. Heatwaves, fires, droughts, storms, or floods – whether you take a global or local perspective, the hallmarks of global warming are already plain to see.
The science is also very clear on what our climate future already looks like.
Thanks to improvements in computer modelling, data science and processing power, NIWA has produced detailed projections for the climatic conditions that regions around New Zealand will face in the coming decades.
For example, we know that within 30 years New Zealand can expect annual, multi-region six-month
droughts, double the number of major floods and storm seas flooding low-lying coastal areas every year.
Some institutions have started to develop the adaptation strategies required to prepare for this future. The Reserve Bank, for example, has started climate change stress tests for household lending and warns that more than a quarter of Auckland mortgages may be at risk of climate change-related flooding within decades.
NIWA has developed a Climate Change Adaptation Toolbox to specifically help businesses, communities and organisations assess their climate risks and adapt their activities to survive in this markedly di erent environment.
But many organisations and businesses, at both a national and regional level, are still choosing to ignore the writing on the wall.
Virtually every organisation has a plan for earthquakes and fires, but how many have assessed the full impact of climate change on their activities, let alone developed practical adaptation strategies to deal with these impacts?
The science is very clear. We already know what our climate future looks like, and it is fast approaching. The best time to start planning for it was yesterday.
“We already know what our climate future looks like and it is fast approaching”
John Morgan
Chief Executive John Morgan asks whether New Zealanders are doing enough to prepare for what lies ahead.Lana Young
Restaurant diners around the country are set to be the winners as production of farmed premium Haku kingfish is scheduled to increase dramatically at NIWA’s Northland Aquaculture Centre in Ruakākā.
About 3 tonnes of the eagerly sought-after Haku kingfish is currently harvested from research tanks at the facility each month, with the fish distributed to selected restaurants around the country.
However, treated recycled seawater started flowing last month into eight new commercial-scale tanks which, when fully operational, will produce up to 600 tonnes of harvest fish a year.
NIWA has partnered with Northland Regional Council to construct the new complex in a programme to demonstrate the potential for commercialscale, land-based recirculating aquaculture in New Zealand.

A new online tool has kept professional and recreational snow watchers up to date during winter.
Launched in June, the Snow and Ice Network data feed shows snow conditions along the length of the Southern Alps from the Nelson Lakes to Fiordland. The measurements come from NIWA’s high-altitude weather stations which measure snow depth along with a range of other alpine weather conditions. The plots are updated weekly and show current snow depth in comparison with snow conditions over the past decade.

The new measurements are designed to help commercial users like power generators and irrigation specialists as well as the weekend powder warriors.
High-resolution underwater mapping has revealed the scale of potential damage caused by ship anchors around the globe.
Marine geologists from NIWA, University of Auckland and Auckland University of Technology used sonar and ship-tracking data to analyse the impact of high-tonnage vessels anchoring outside Picton.

They found anchors dragging across the seafloor can displace enough sediment to fill an Olympic-sized swimming pool, scarring the seafloor for years.
Scaling their findings up at a global level, the researchers conservatively estimate that maritime anchoring damages at least 6,000km2 of seabed worldwide.
NIWA has released new guidelines for landowners wanting to construct artificial wetlands to improve water run-o quality and biodiversity.

Developed in association with DairyNZ and a technical advisory group, the guidelines follow an extensive review of national and international wetland designs.
Research shows well-planned and planted wetlands are capable of significantly reducing farm sediment levels and lowering nitrate and contaminant concentrations.
Constructed wetlands can also bu er high water flows, reduce downstream flooding and provide habitat for native species.
An innovative multi-hazard risk analysis tool developed by NIWA and GNS Science scooped the Public Good Award at the New Zealand Hi-Tech Awards. RiskScape is a flexible, open-source software application that enables users to rapidly work out the dangers and e ects of natural hazard events. It allows planners and decision makers to quickly assess the impacts on people and property of events such as earthquakes, tsunamis and floods. The multi-hazard tool is used by the Earthquake Commission (EQC) to support disaster modelling and reinsurance.

A South Taranaki fisherman was intrigued when he found a tiny metallic tag as he filleted his 5.2kg snapper o the Pātea coast earlier this year.
He was even more surprised to discover the tag had been inserted by a NIWA fisheries researcher – in the same week and virtually the same location – 20 years earlier.
Tagged as part of a study into fish population movements, the seemingly “stay-at-home” snapper had doubled in weight over the intervening years.
However, fisheries scientists say it is highly unlikely the fish had remained in situ for two decades. More likely a case of good timing, with the angler dropping his line as the fish returned inshore on its seasonal migration.

Some of New Zealand’s most remote citizens received a personal introduction into the world of NIWA’s climate research during the recent Chatham Islands Festival of Science.

Forecaster and science communicator Nava Fedae joined researchers from more than a dozen mainland science organisations in the week-long outreach event.
The festival featured pub talks, school visits and community demonstrations covering a wide range of science disciplines and environmental issues.
NIWA’s sessions focused on the impacts of climate change and sea-level rise, along with special screenings of a 360° video focused on climate research in Antarctica.
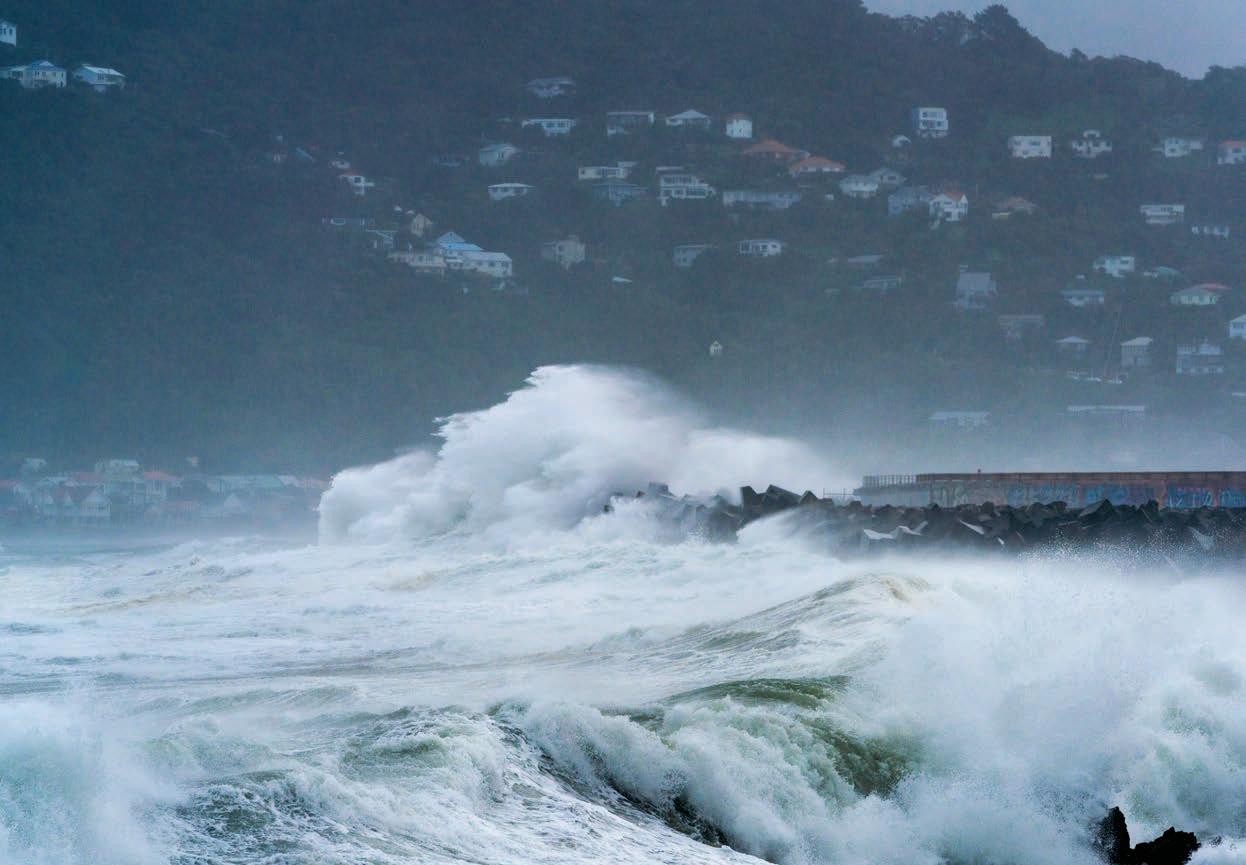
Winter 2022 was both Aotearoa New Zealand’s warmest and wettest on record.
Our coastal seas reached new winter highs, helping to push average land temperatures 1.4°C higher during the three months ending in August.
This is the country’s third consecutive record warm winter and means that six of the 10 warmest winters on record have occurred since 2013.
Persistent extreme rainfall events also brought floods and slips to many regions.
An atmospheric river swept into the top of the South Island in August bringing widespread damage to the Tasman region.

Researchers are using satellites to track sediment flows and coastal health.
The Department of Conservation has commissioned NIWA to analyse nearly 20 years of satellite images to measure changes in the levels of sediment suspended in coastal waters. Mud, silt and microalgae can cause serious issues for estuaries, oceans and aquatic life.
Results indicate generally increasing sediment concentrations around the South Island coastline, with decreasing concentrations around the North Island.
The work will show which areas to target with future conservation e ort and how conditions change with time.

New research suggests large-scale wildfires may be changing the chemical makeup of our atmosphere. Jessica Rowley explains.
n New Year’s Day 2020, many New Zealanders looked out on near apocalyptic scenes. It was mid-summer, mid-afternoon, and the skies were sci-fi orange. The sun had all but disappeared.
Within days, reports started coming in of glaciers in the Southern Alps turning from glistening white to a dirty cream.
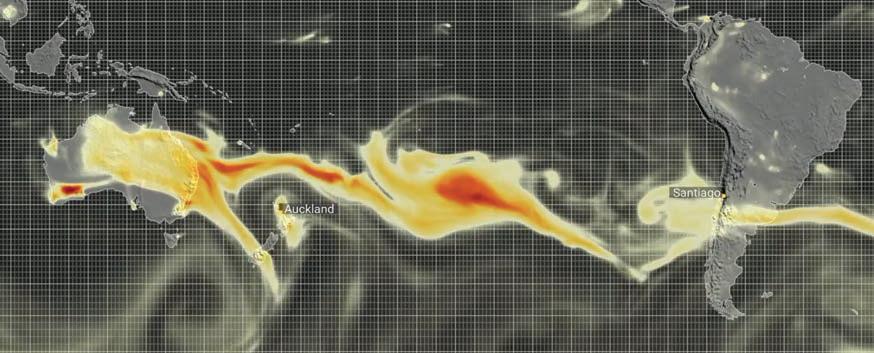
Millions of hectares of Australian bush were on fire, and the ash was billowing 2,000km across the Tasman Sea and landing on our doorstep.
Known in Australia as Black Summer, these bushfires raged for 10 months, searing the landscape and leaving a trail of destruction: 34 human lives lost, 20% of the country’s forests burnt and an estimated 3 billion dead animals. In all, approximately 14.3 million hectares of land was scorched.
According to the New South Wales Rural Fire Service, the fires were “so wild and erratic that some days they exceeded the worst-case-scenario predictions of a sophisticated computer program.”
They were also among the largest wildfires recorded. So big, they created their own weather, lofting smoke and ash as high as 20km into the stratosphere and impacting the atmosphere in ways that have not been seen before.
In Central Otago, NIWA’s Lauder Atmospheric Research Station specialises in atmospheric research, measuring CFCs, ozone, UV levels and greenhouse gases with world-class instruments and a renowned research team.
Smoke from the Australian bushfires envelopes the South Island's Lindis Pass early in the afternoon on New Year's Day, 2020.
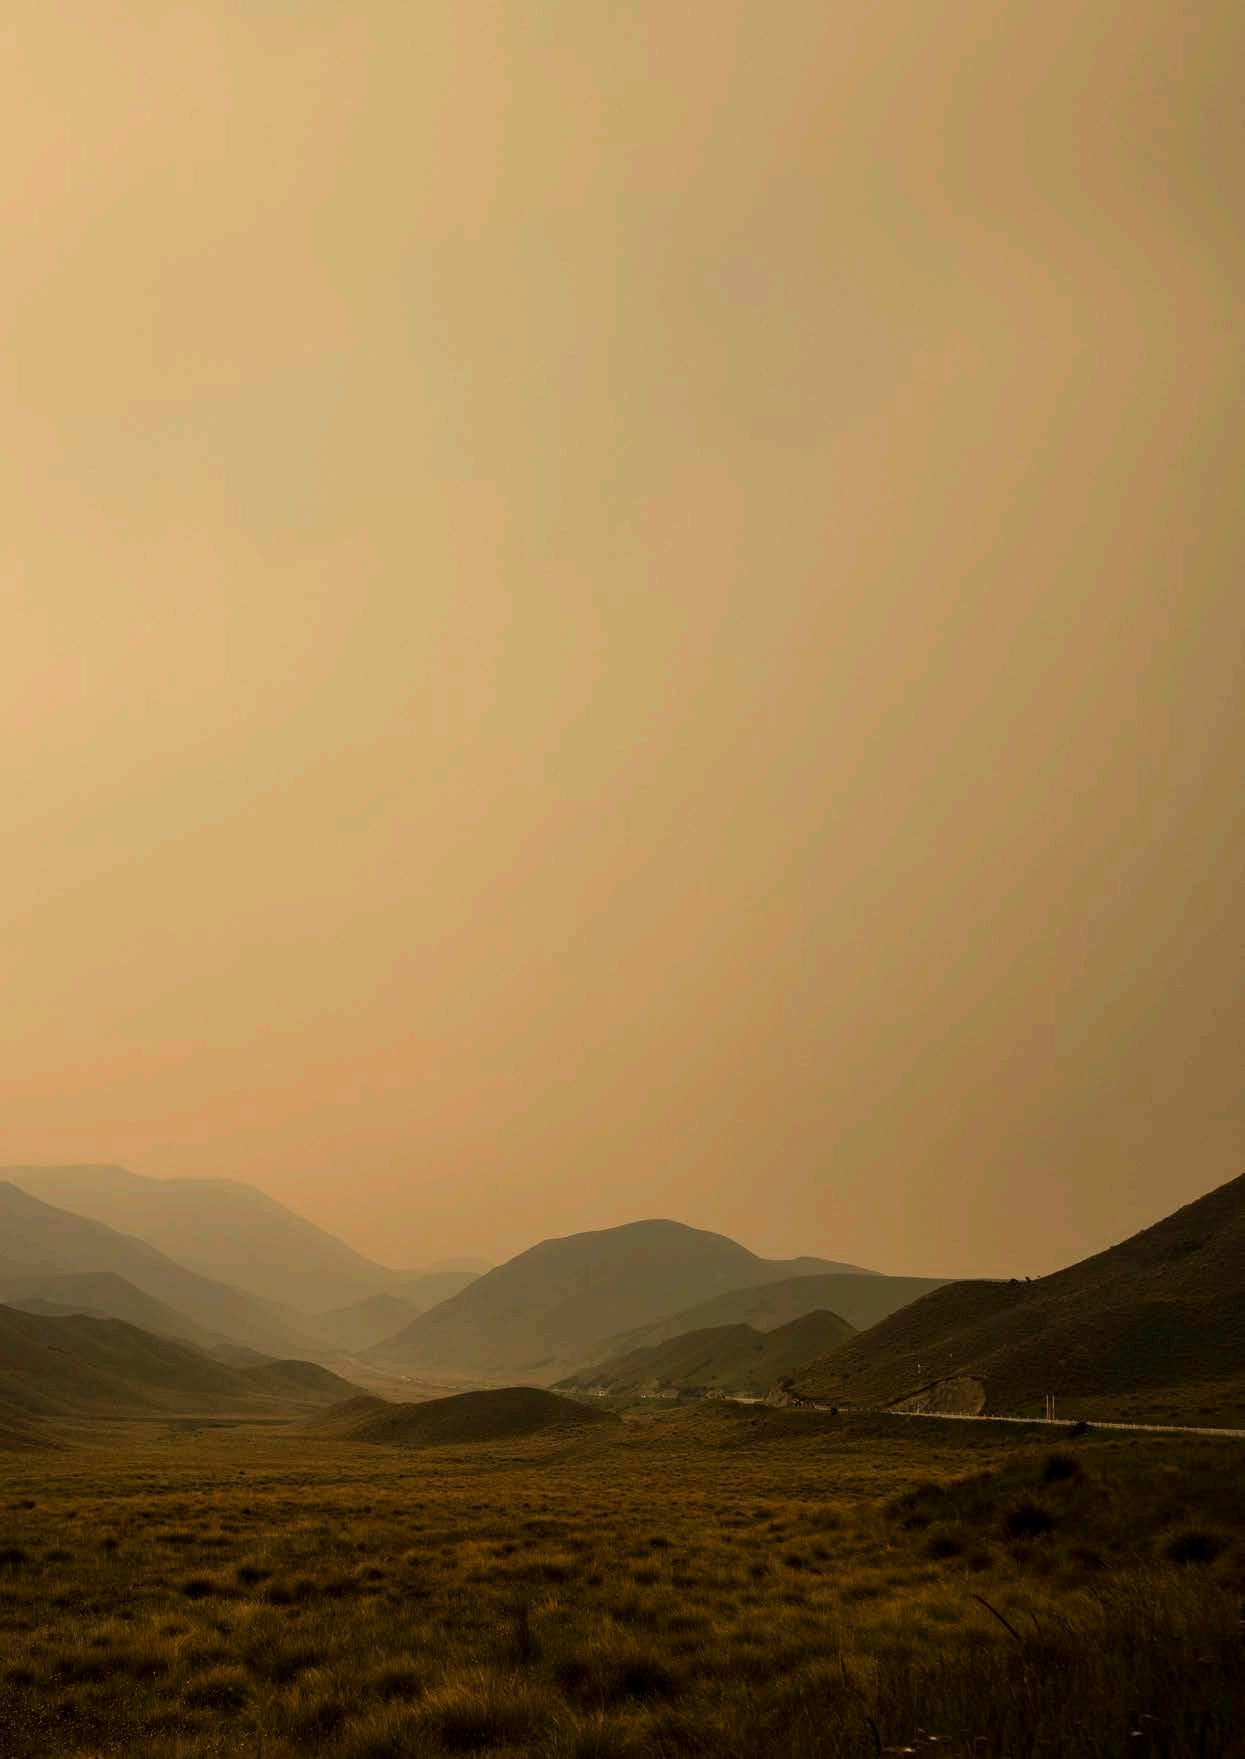
(Rebekah Parsons-King)
Michael Kotkamp is one of those atmospheric researchers. He remembers vividly the day the skies turned orange.
“You could smell it. The smoke was slowly building on New Year’s Eve and by the next day, a thick smoky duvet had formed over Lauder and was blocking out the sun,” says Kotkamp.
He immediately sent pictures to his Lauder colleagues, including fellow atmospheric technician Dan Smale, who was holidaying in Nelson at the time. “I was following the developments on the radio. I knew the fire plume was gigantic and that our measurements may capture something high up in the atmosphere. What I wasn’t expecting was the photo that Michael sent – it was not a plume in the distant skies, but smog thrown over us from over 1,500km away,” says Smale.
Immediately, Dan remotely logged into one of Lauder’s instruments and saw a prodigious spike in carbon monoxide levels.
Over the following 18 months, Dan worked with Dr Susan Strahan from NASA’s Goddard Flight Center in the United States to study the e ects of the wildfire smoke on the ozone layer. They detected unusual chemical changes in the stratosphere – the region in our atmosphere roughly 16–20km above the Earth’s surface. This is where our ozone layer resides – part of the protective shield that absorbs much of the sun’s damaging ultra-violet radiation.
“The reactions taking place in the stratosphere with these smoke aerosols are an enigma”
Dan Smale
This region is rich in chlorine-containing gases, such as hydrogen chloride (HCl). These gases are usually stable and do not undergo many chemical changes. However, if other airborne chemicals interfere with them, their structure can alter, causing them to release their chlorine atoms.
This is bad news for ozone, because just one atom of chlorine can destroy over 100,000 ozone molecules before it is removed from the atmosphere.
“Anything that messes with the chlorine family of gases – like HCl – has the potential to harm the ozone. In the months following the bushfires, we observed that HCl levels had dropped by about half. There were also increases in chlorine monoxide (ClO), another chemical that plays an important role in ozone depletion,” says Smale.
The changes occurred gradually over a four- to fivemonth period after the fires, before reversing over the following four months.
Discoloured snow, caused by ash particles, remains clearly visible across the Southern Alps two months after the bushfires were contained.
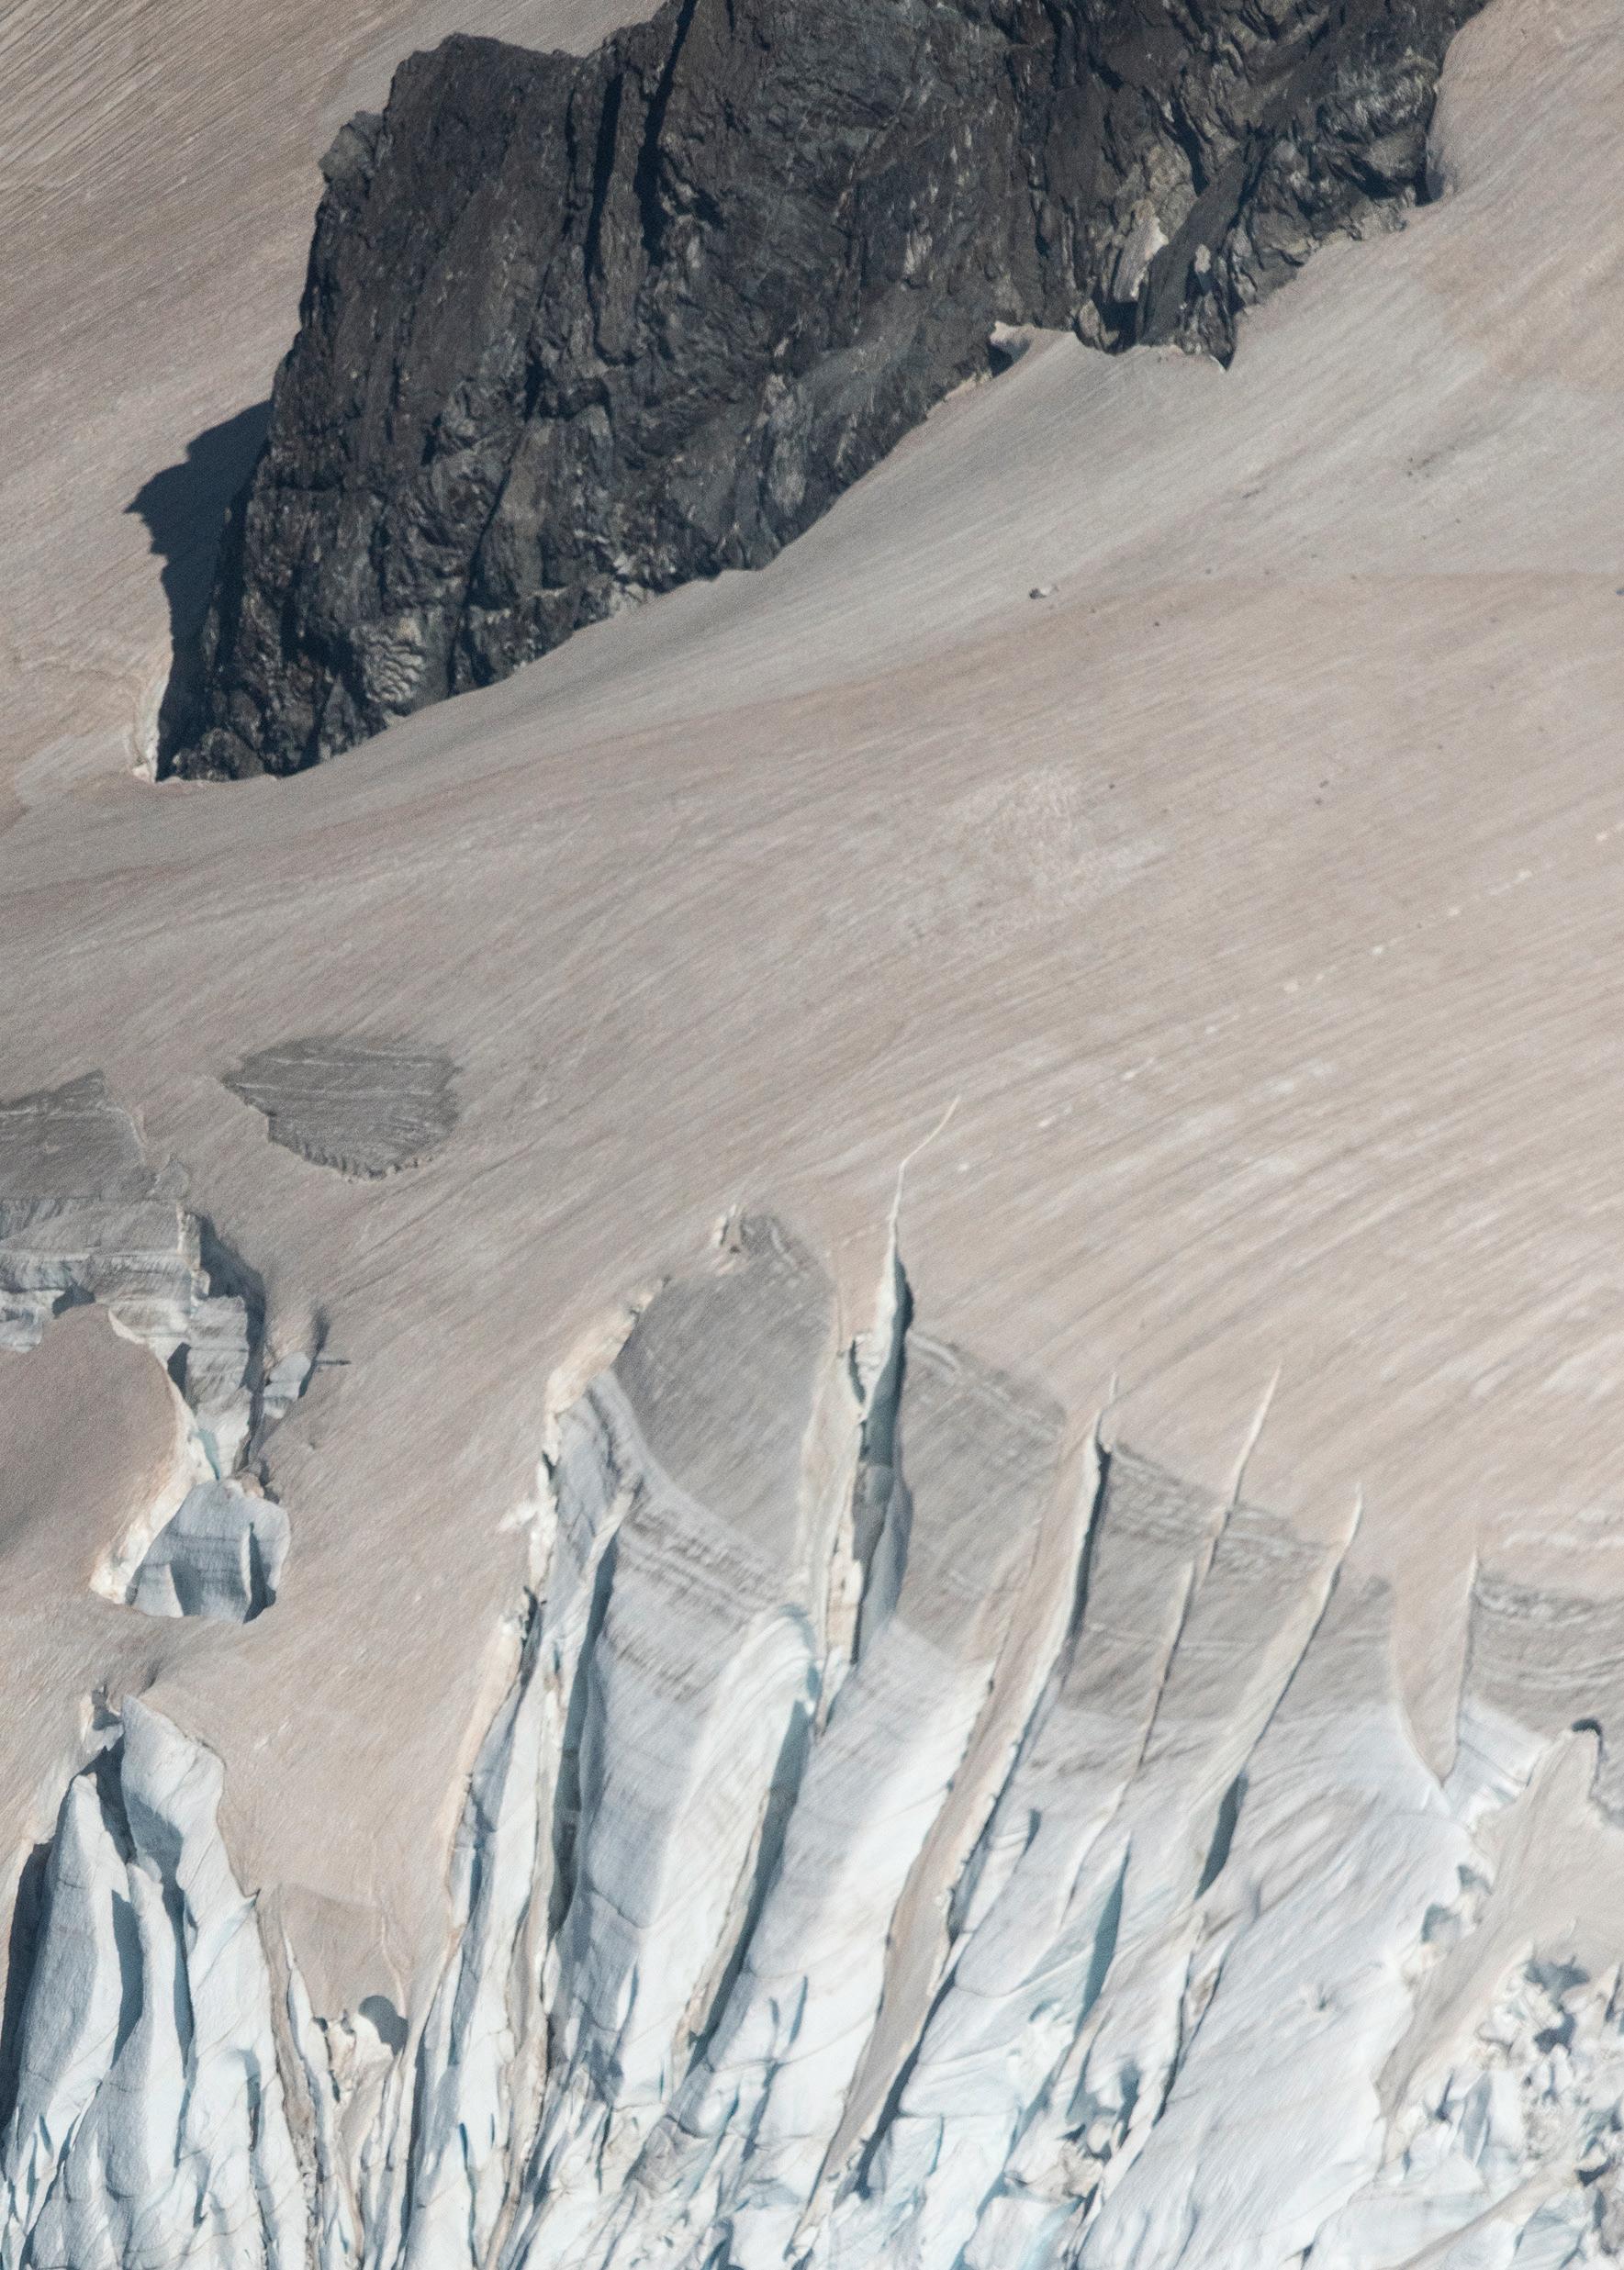 (Rebekah Parsons-King)
“We’d never seen anything like it before. While we were witnessing these increases and decreases in certain chemicals, we were unable to replicate what we were seeing in any models, meaning we didn’t know the processes behind them. The reactions taking place in the stratosphere with these smoke aerosols are an enigma,” says Smale.
The finding reveals an important gap in our understanding of ozone chemistry, and he says more work on the interactions between wildfires and the ozone layer is clearly needed.
Global warming means that wildfires are likely to become more frequent and intense. It is estimated that climate change has boosted Australia’s bushfire risk by at least 30%, with its bushfire season lengthening by almost a month over the past 40 years.
Predictions that make finding out what’s happening in the skies above, all the more important.
“Anything that messes with the chlorine family of gases – like HCL – has the potential to harm the ozone”Dan Smale Fanned by westerly winds and suspended up to 20km above in the stratosphere, ash from Australia's 2020 fires travels out across the South Pacific. (NIWA)

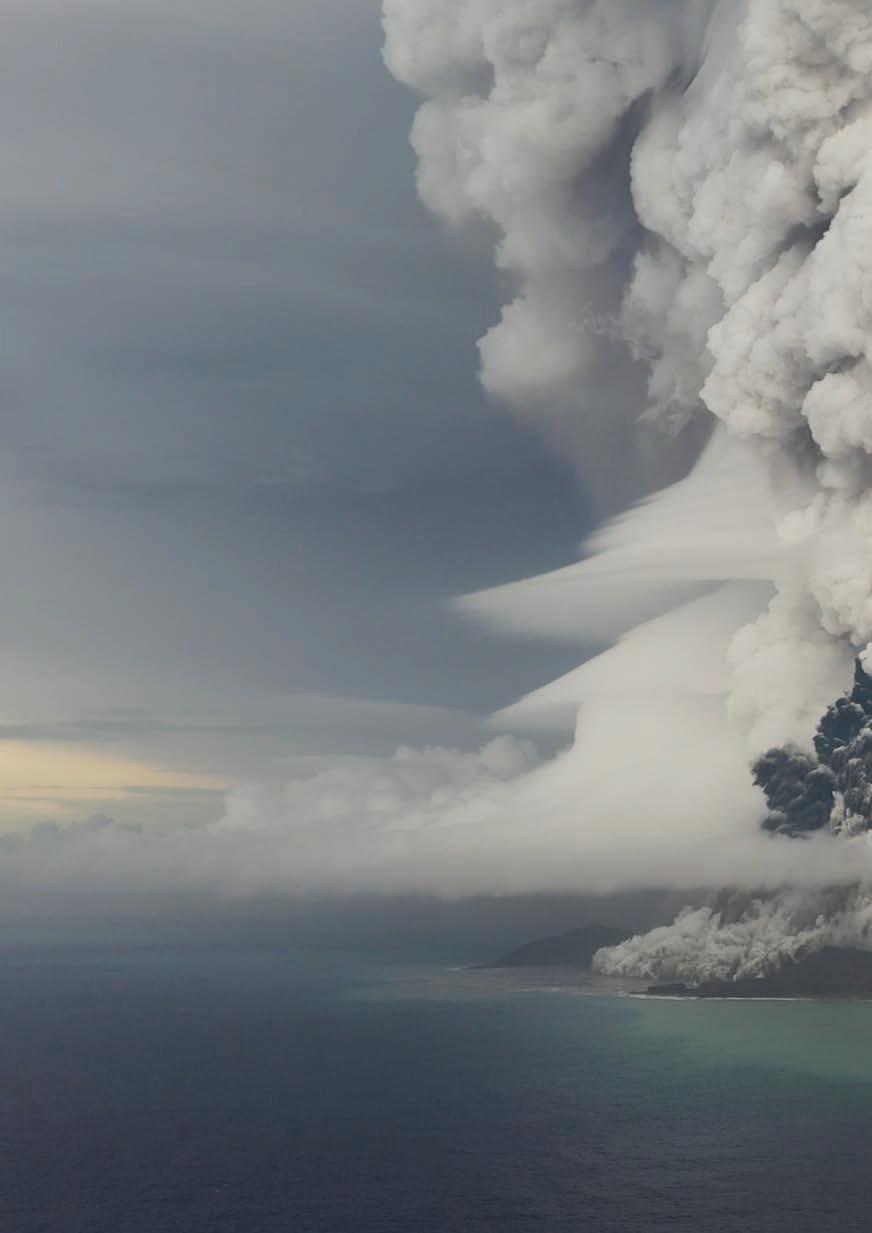
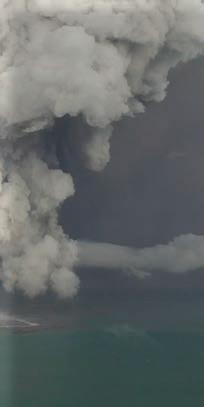
Prior to 15 January, Hunga Tonga-Hunga Ha'apai was a littleknown undersea South Pacific volcano with a long name.
Within 24 hours, it was a global phenomenon – the site of the largest atmospheric explosion in almost 150 years.
Jessica Rowley looks at why a remote Tongan volcano took the world by storm.

bout half an hour into its most violent sequence, the Hunga Tonga-Hunga Ha’apai (HT-HH) submarine volcano erupted in the biggest atmospheric explosion ever recorded by modern instrumentation. The sonic boom was heard as far away as Canada.
The sheer power of the blast drove a column of rock, ash, water vapour and debris into the top layers of the stratosphere, causing electrical currents in space. Atmospheric shockwaves travelled around the globe three times, lifting cloud formations in the United Kingdom, some 16,500km away.

The force of the explosion lifted an initial wave 90m above the caldera, sending tsunami racing out across the Pacific at up to 1,000km/h. Waves up to 19m high smashed into the western coast of Tonga, with smaller, but still damaging swells, reaching the shores of New Zealand, Japan, Russia and the Americas.
Waves even swept in under the Antarctic ice sheets.
The last volcano to generate this scale of physical impact was the infamous 1883 eruption of Krakatau, west of Java.
As quickly as the power and scale of the cataclysmic blast started to become clear, questions also bubbled to the surface.
What exactly happened o the Tongan coast and why was this blast so powerful? Why did the eruption cloud travel to such heights, yet the volcano itself emit far less toxic ash than expected? And what was behind those powerful waves that swept through both the atmosphere and the ocean – waves of a scale unseen in the modern scientific era?
Perhaps even more importantly, what does HT-HH’s cataclysmic eruption mean, not just for the neighbouring island of Tonga, but for all nations with submarine volcanos nearby?
Amongst all these questions, one thing was certain: HT-HH o ered a unique opportunity to bring modern research techniques to the aftermath of the most powerful volcanic eruption since Krakatau.
Prior to 15 January, HT-HH presented as a classic underwater volcanic cone, rising 2,000m directly out of the Pacific seafloor, 65km northwest of Tongatapu, Tonga’s main island. The 4km wide caldera was about 150m below sea level, with a small island breaking through the ocean surface.
In the days after the eruption, atmospheric scientists used equipment including satellites, lasers and research balloons to analyse the volcano’s colossal plume, while researchers on the ground gathered samples from the dense ash layers blanketing Tongatapu and nearby islands.


But the real answers as to what had happened lay hidden beneath the waves: in the changes to the volcano's underwater structure and the impact on the seabed nearby and the surrounding waters.
Such a global event required a global e ort to unlock its mysteries. Enter NIWA’s ocean science specialists, who in collaboration with the Kingdom of Tonga, Japan’s The Nippon Foundation, and UK robotics company SEA-KIT, launched an international research mission to HT-HH.
The NIWA-Nippon Foundation Tonga Eruption Seabed Mapping Project (TESMaP) was formed,


“The violence of this eruption surprised everybody”
Kevin Mackay
and NIWA’s research flagship RV Tangaroa set sail on a month-long voyage to comprehensively remap the underwater volcano, along with detailed investigations into the surrounding seabed, ocean waters and marine life.
“The violence of this eruption surprised everybody, and it has implications not just for Tonga, but for the whole Pacific Ring of Fire. In fact, it a ects any nation with undersea volcanos nearby – New Zealand, Japan, Indonesia, the Caribbean, anyone,” says expedition leader and marine geologist Kevin Mackay.


The Ring of Fire, which runs 40,000kms around the edges of the Pacific Plate, dips in and out of the ocean as it sweeps north from New Zealand in a wide arc including Indonesia, Japan, Russia, and the North and South American coastlines.

Four of the largest eruptions of the past 10,000 years have occurred along its edges.
Many of its estimated 1,000 volcanos are underwater, and of the 76 undersea volcanos stretching from New Zealand up through the Kermadec Arc towards Tonga, 80% are active.
Drone images taken on 15 January, 24 hours before Hunga Tonga-Hunga Ha'apai's most violent eruption started. The island visible here was blown apart during the final explosion. (Pununu Tukuafu, Tonga Geological Services)
“The evidence was under the sea. We needed to find out what actually happened.”

Complete with marine geologists, biologists, oceanographers and geochemists, the 30-strong team meticulously mapped 22,000km2 of seabed using Tangaroa’s high resolution multibeam echosounder. They recovered thousands of physical samples and environmental readings from throughout the water column and the seafloor hundreds of metres below, while also capturing 32 hours of underwater video and more than 7,000 photographs.


In a stroke of good fortune, HT-HH had been comprehensively mapped in 2016, giving the scientists aboard Tangaroa a detailed picture of the volcano’s pre-eruption structure.
Eruptions of this magnitude, like Mount Pinatubo or Krakatau, typically blow themselves apart, exploding through their own sides or collapsing back down into the caldera.
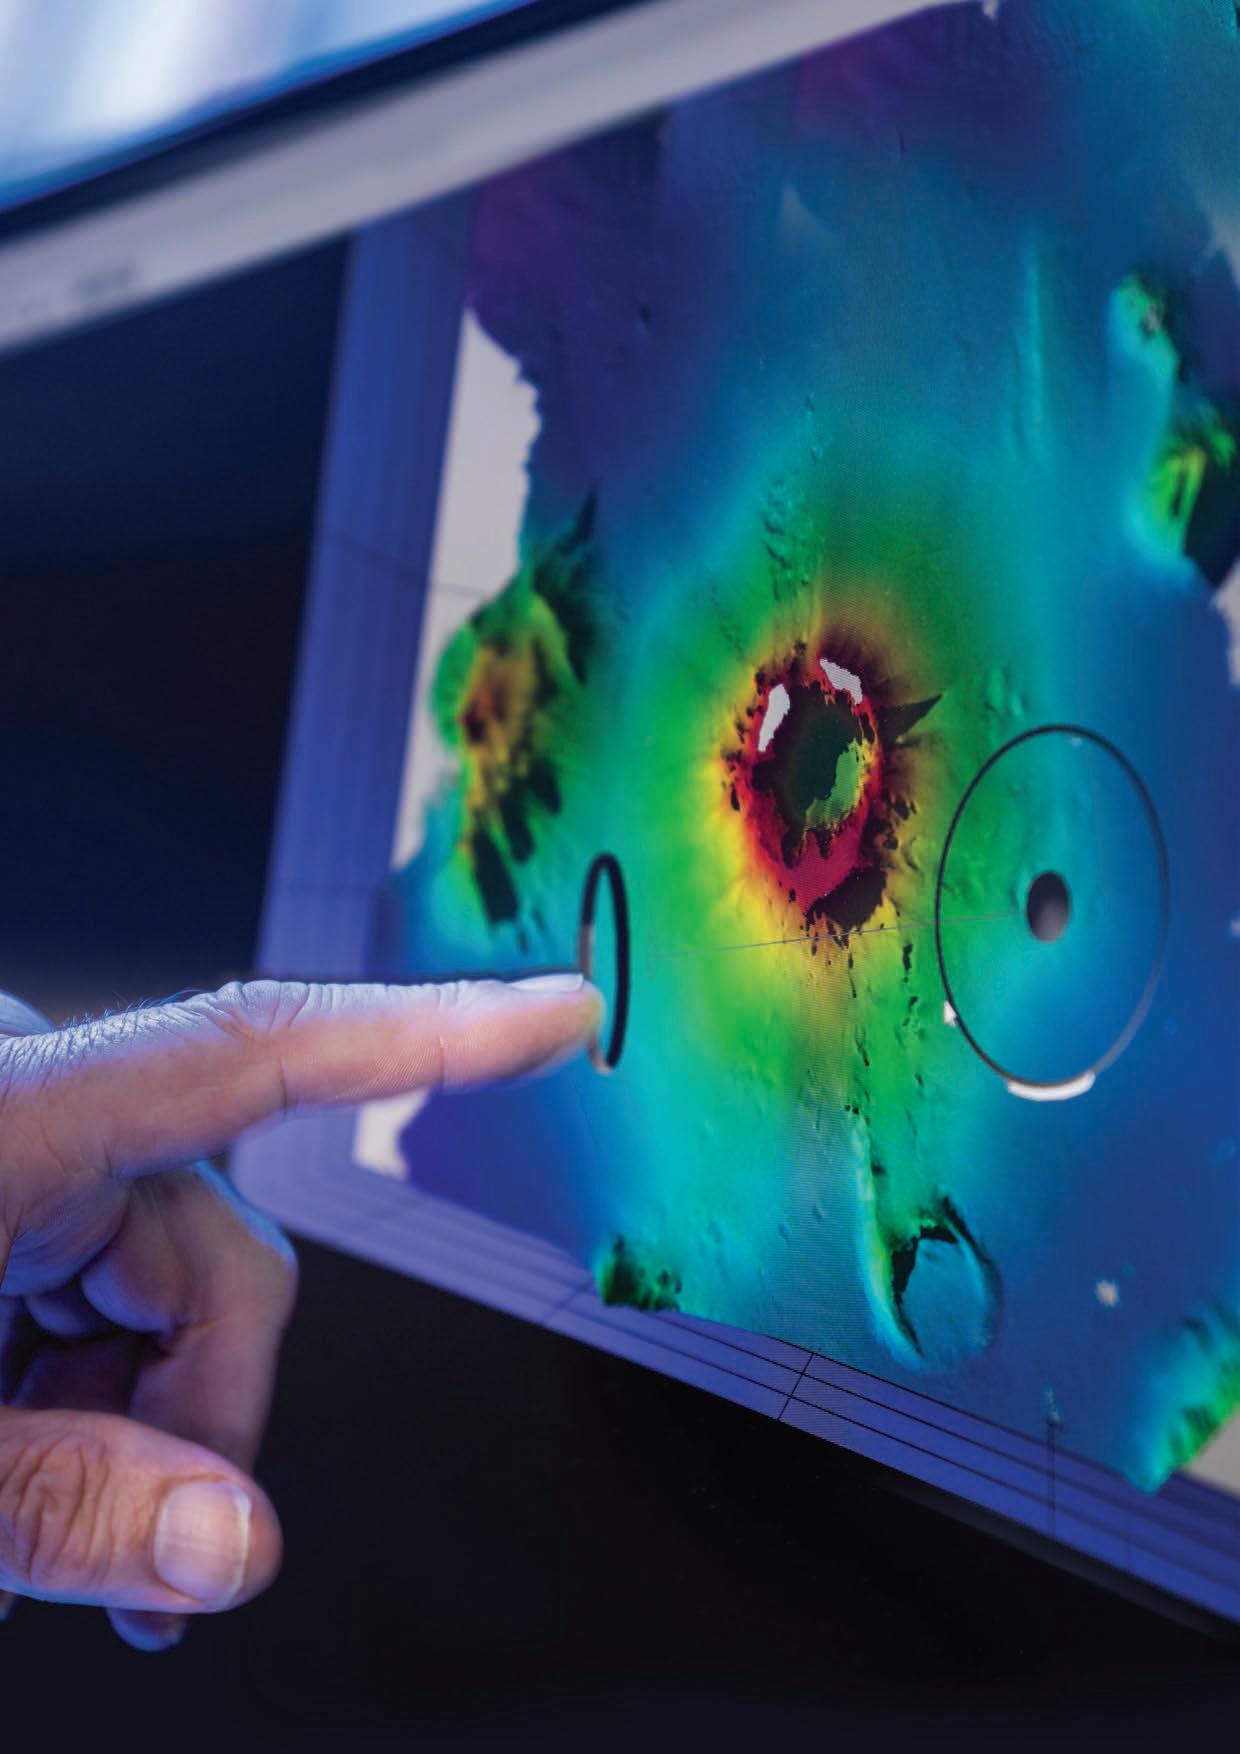
But when the first 3D multibeam images started turning up on Tangaroa’s screens, Mackay says the researchers were stunned.
“With an explosion that violent, you would expect that the whole volcano would have been obliterated. But it wasn’t – the underwater mountain itself was virtually intact. I couldn’t believe it.”
Mackay says the lack of damage to HT-HH’s cone is highly significant. He says it points to an eruption, probably fuelled by the sudden contact of superheated volcanic material with seawater, acting like a massive shotgun blast and shooting straight up and out of the underwater caldera.
The power of that explosive interaction fired tens of millions of tonnes of volcanic debris and water vapour 58km into the atmosphere.
This, he says, helps explain the massive power of HT-HH and the scale of the atmospheric shockwave and sonic boom that were unleashed.
ut HT-HH did not expend all its energy firing into the skies above. As more data and imagery came on board, the team started to gain further insight.
The mapping began to reveal deep scars gouged into the volcano’s underwater flanks as well a complex network of new channels carved into the surrounding seabed.
While lava flows may look compelling, Mackay says the most destructive output from a volcano are the pyroclastic flows. These superheated avalanches of rock, gas and ash poured out of HT-HH’s underwater caldera, scouring down the sides of the cone and rumbling out, in some cases, more than 80kms across the seabed.
“The pyroclastic flow is the most violent material produced by a volcano. These are hugely turbulent flows of rock and ash and steam, all mixed up and jumbled together like a giant tumble dryer.
“Underwater these actually become even more destructive because you get steam mixed into it and this creates these hundreds of tonnes of rumbling rock, just sweeping out and gouging a path through seafloor.”
“We needed to find out what actually happened. The evidence was under the sea”
Mackay
Post-eruption underwater mapping reveals a surprisingly intact volcanic cone rising 2,000m out of the Pacific seafloor. The darkened rim section remains above water.

(NIWA)
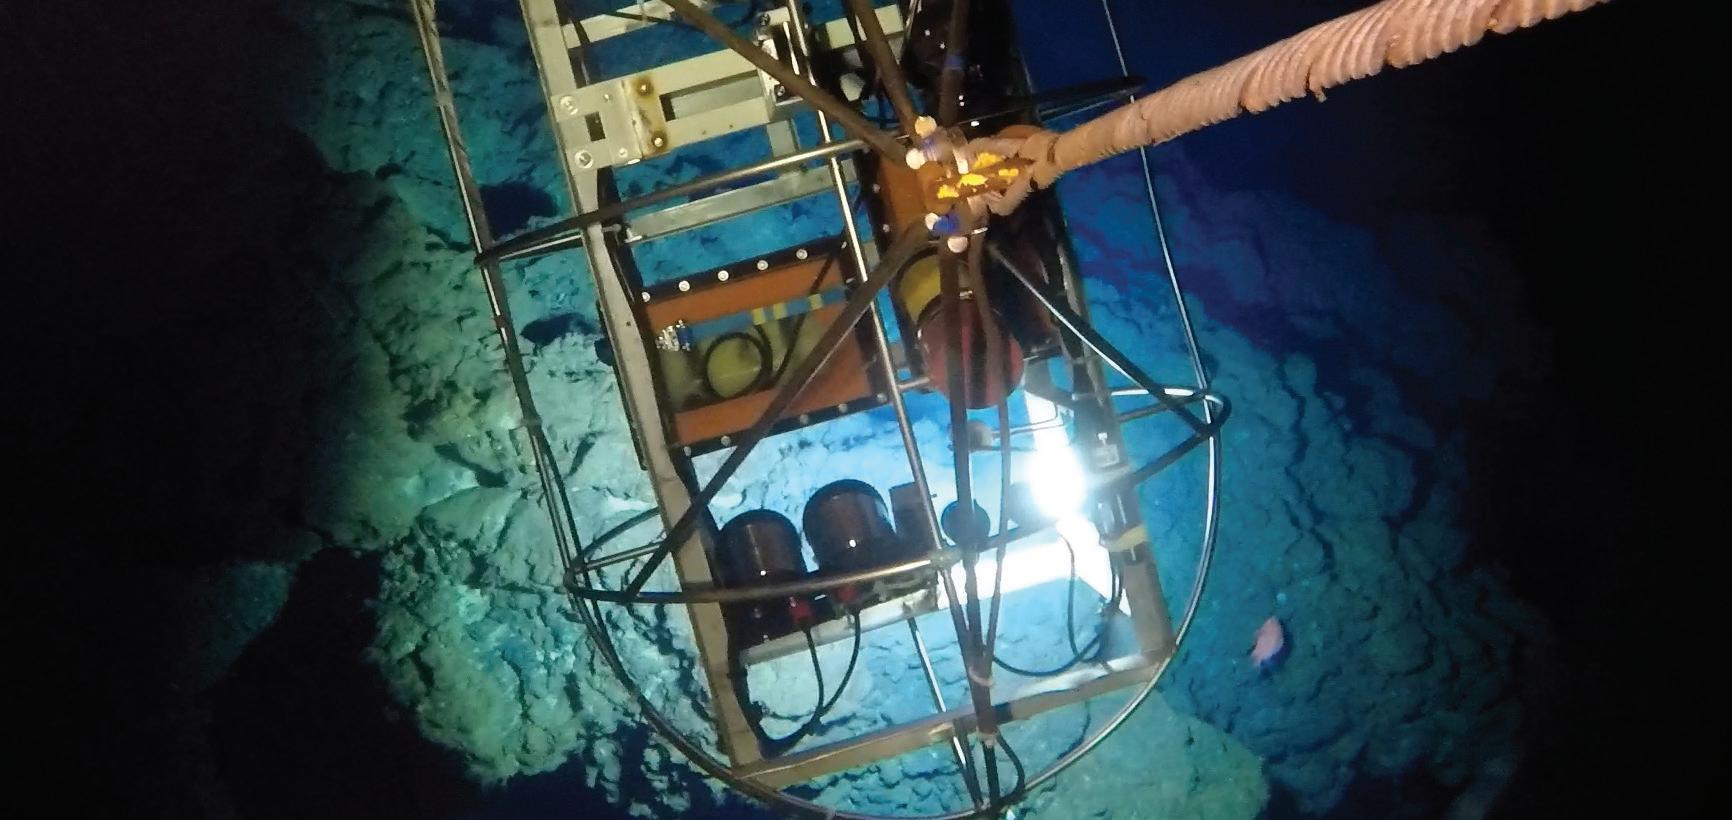
It was these destructive forces that engulfed a section of the undersea communications cable linking Tonga to the outside world. But rather than a clean break, the survey revealed 80kms of cable torn and twisted into a tangled mess, as the devastating flows swept back and forth across the contours of seabed.
Core sampling and video reconnaissance shows that once these violent flows subsided, the ocean floor was left covered, up to 30m deep, in a thick layer of volcanic debris and ash.
“We were expecting to see what we call the typical seafloor life in the deep ocean, lots of animal burrows, lots of tracks, lots of snails and crabs. We just saw desert. I’ve never seen anything quite like it. Mile after mile of this devastation,” says Mackay. Tests also revealed a dense ash layer, metres deep, still present in the upper water column near the volcano and yet to settle on the seafloor.
Biogeochemist Dr Sarah Seabrook says this could have a myriad of impacts on the ecosystem.
In the immediate aftermath of the eruption, nutrients and trace elements from ash helped fertilise an algal bloom. But Seabrook cautions that the unexpected persistence of the ash was coupled with low oxygen readings which could have implications for ocean services, such as food production and carbon sequestration.
Despite the destruction, the team did find some small patches of sea life as close as 15km from HT-HH. Marine biologist Dr Malcolm Clark says it appears
these pockets were sheltered from the volcanic flows, or out of range of the thick ash fall.
“Some surrounding seamounts have pockets of normal biodiversity, such as corals, sponges, starfish, and mussels, indicating the resilience of such marine ecosystems and giving some hope for recovery.”
r Emily Lane is a hydrodynamic scientist at NIWA and has been, in equal parts, intrigued and puzzled by the impact of HT-HH’s explosion. She says tsunami are most commonly associated with earthquakes, which cause sharp movements or landslides on the seafloor, displacing large volumes of water.

Tsunami from volcanic eruptions, however, are rare. Less than a hundred have been recorded in the past two centuries and these have been localised and small.
HT-HH, by contrast, sent a sequence of waves up to 19m high surging towards Tonga’s western coast, riding up beaches and smashing homes and holiday resorts. Waves also swept right around the Pacific, with damage reports coming in from New Zealand, Japan, Russia and the coastlines of North and South America.
Remarkably, due it seems to a combination of sparse population, early warning and the time of the event, only four lives were lost when the huge waves swept into Tonga.
Two people, however, were also killed 10,000kms away in Peru when 2m waves washed ashore.
In a surprising development, small tsunami waves were even detected in the Caribbean and the Mediterranean seas.

“When the volcano erupted, I wasn’t expecting the impact to be nearly as big as it was. It caused one of the few tsunami powerful enough to spread across the globe,” says Lane.
“Usually with a volcanic eruption, several things can displace water, including the force of the blast itself, expulsion of material that lands back in the water and creates waves, or collapse of the volcano’s flank that acts like a landslide,” Lane explains.
While the structure of HT-HH remained intact, Lane thinks the power of the blast and the massive pyroclastic flows played a significant factor in the complex pattern of tsunami generated. This, along with another little-known phenomena, a meteotsunami.
Meteotsunamis are created by fast-moving changes in atmospheric pressure, usually from storms, which push the water ahead of them. They account for just 3% of historical tsunami events only, and up until now have been thought to have only small, local e ects.
“We’ve been o ered a bit of a lifeline here – a once in a lifetime chance to study an event like this and learn from it. We needed to know why it bucked the trend, so we have been working with colleagues from several organisations to combine our data and model di erent scenarios.
“We’re using information from DART buoys, which are real-time tsunami monitoring systems scattered around the world’s oceans, satellite data, and seismometers to pull together the pieces and figure out what happened,” Lane says.
In this case, it was the atmospheric waves created by the massive shotgun blast from the volcano that did the trick, helping to drive waves that were global in their impact.
“We discovered that the atmospheric waves were travelling at the same speed as the tsunami that was generated by the underwater impacts. The atmospheric wave drove energy into the tsunami and essentially supercharged it.
“Additionally, because meteotsunamis are caused by air pressure waves, they don’t stop at the coast. Air waves can leapfrog land masses, so it didn’t matter that America was in the way, they just kept going and regenerated a tsunami on the other side,” says Lane.
“It caused one of the few tsunami powerful enough to spread across the globe”
Dr Emily LaneA sequence of tsunami waves, some up to 19m high, swept onto Tongatapu's remote northwest coast, leaving some isolated resorts in ruins. (Rebekah Parsons-King)
It’s these unique mechanics that meant HT-HH’s waves went further, moved faster, and hit stronger than anyone could have predicted.
“Volcanic meteotsunamis are a game changer. While we knew about this phenomenon in theory, we’ve never actually seen it in real-time.”
Lane says lessons from HT-HH must be factored into future tsunami calculations, particularly for more densely populated countries lying along active tectonic zones such as New Zealand, Japan, the United States or Chile.
“We need to understand how big a tsunami a volcanic eruption can cause and how worried we should be.

“If this eruption had happened near New Zealand or Japan, for example, we’d be looking at very di erent outcomes,” says Lane.
erhaps the last word should go to Kevin Mackay, recalling first seeing the remnants of Hunga TongaTonga Ha’apai, from the bridge of Tangaroa He says it was a sobering sight.
“The sun came up and there were these islands, just ripped apart. They ooze violence, they’re black and charred and sharp and jagged. They just look like devastation.
“You really get a true sense of the violence that happened.
“You have to know that these volcanos can erupt this way, if you are going to prepare for them.”
“If this eruption had happened near New Zealand or Japan we'd be looking at very di erent outcomes”
Dr Emily LaneDr Sarah Seabrook (right) helps colleagues Dr Erica Spain, Dr Malcolm Clark and Diana Macpherson recover underwater core samples. The samples showed violent pyroclastic flows swept out more than 80km across the seafloor. (Rebekah Parsons-King)
Mia Blyth talks to an environmental hazard specialist who feels a very personal connection to his work.
evere tropical cyclone Val slammed into Samoa in December 1991.
The worst cyclone in more than a century, wind gusts of up to 240km/h ripped through the islands, leaving 14 dead and $200 million worth of damage.
As an eight-year-old, Shaun Williams remembers standing in Apia in the midst of the destruction and watching his home being torn down around him.
Three decades later, and now working as a hazard specialist in Christchurch, Dr Shaun Williams says he feels as connected to the climate risks in the Pacific as ever.
Williams manages NIWA’s Environmental Hazards Group. His work encompasses natural hazards and risk across Aotearoa New Zealand and the Southwest Pacific, with a specific focus on geophysical, hydrometeorological and climate hazard science.
Modelling the impact of severe Vaisgano River flooding on Apia, Samoa. Williams works across the Pacific assessing environment and climate risk. (NIWA)

n a nutshell, Williams works to produce information on a wide range of natural events so that the right decisions can be made to protect people and communities from our ever-changing environment.
He is a busy man. From scenario-based modelling in the flood-prone town of Westport, to helping Tongan authorities analyse the impact of the Hunga Tonga-Hunga Ha‘apai volcanic eruption, Williams’s work crosses many physical boundaries. The focus, however, he says, is always on communities.

“Without a doubt we are living in a time when climate change and disaster risk management are very real threats.
“I work to produce usable, high-quality information that can be used to support resilient decision making and adaption planning to ensure the safety of people.
“Ultimately the benchmark is people. The safety of people, the protection of life, the resilience of people.”
His initial aspiration to become a “rock scientist” led Williams to study earth sciences and geography at the University of the South Pacific in Fiji.
His first job was with the Samoa Meteorological Service, where he helped to establish Samoa’s national earthquake seismic network. He sees his growing expertise in risk and hazards analysis as a natural progression.
“A pathway was already laid out and I continued to walk down that pathway.”
Williams moved to New Zealand to complete his PhD and joined NIWA in 2017.
Earlier this year, his work on the hazard software tool, RiskScape, saw Williams and his colleagues on stage in Wellington at the NZ Hi-Tech awards, facing a crowd of 1100 people and shaking hands with the Prime Minister.
RiskScape is a software system developed by NIWA and GNS Science that enables communities to better understand the risks and impacts of natural hazards on people and property.

“It is a very enriching experience actually seeing the tool being used and seeing the outcomes for people.” illiams may be a long way from Apia, but his heart still lies in the Pacific and, as always, his focus remains on people. He acknowledges his background brings a special perspective to his work.
“It is important that we actually have people who are familiar with the cultural context of those regions, who can relate directly to their needs and understand their situation.
“Understanding the etiquette and the way of doing things shows a level of respect for our Pacific partners.”
With climate change, especially the threat of sealevel rise, an ever-growing issue for the Pacific, Williams feels his heritage also brings added responsibility.
“In a small island state like Samoa you grow up with a sense of respect for others and a sense of duty to lead through service to your community. And that includes the lands and environment supporting them,” says Williams.
“This type of work is the sort you do for others, not for yourself.”
“Ultimately the benchmark is people. The safety of people, the protection of life, the resilience of people”
Dr Shaun WilliamsWilliams (left) and fellow hazard analyst Ryan Paulik survey property damage after the Edgecombe floods. (Dave Allen)
Working dogs, Rum and Blue (white tipped tail), take a welcome drink on Whanawhana Station in Hawke's Bay during the 2020 summer drought.
(Caroline Beamish)

Improvements in data and climate science mean forecasters are able to predict patterns much further ahead and in far greater detail. Melissa Bray looks at what this may mean for farmers.

Hawke's Bay farmer Louis Beamish
aikato dairy farmer Andrew Reymer likens a farmer’s response to drought to building a bridge.
It’s all about knowing how long the bridge has to be, he says.
It rained just twice on his property between December and May during the summer drought of 2020.
Reymer, like his neighbours, managed his way through the five-month dry spell.
But he had to juggle a range of decisions around factors such as how many cows to dry o , how many to sell, what type of feed he needed to buy in and when to do it.
He says having a better idea of how long he’d have to wait for the next rain – how long he would need to build that “bridge” – would make decision-making much easier.
“You have to know how long it’s going on for. If you’re confident about the length of the bridge, you can plan for it.”
Locals expect dry summers at Whanawhana in Hawke’s Bay, but sheep and beef farmer Louis Beamish says the summer of 2020 was drier than most with no significant rain from January through to May.

“We had a good team, and we knew what we had to do,” he says.
The level of work increased significantly. It took Beamish and his team half a day, every day to feed all of the animals.
“I only have confidence in maybe a week’s forecast, and even that may change, but every day I was looking at the forecast.”
eather is every farmer’s constant companion, and planning for what the weather may do is becoming increasingly important.
Climate change is exacerbating extreme weather events and NIWA’s long-term climate projections point towards an increasing risk of prolonged dry spells across much of Aotearoa New Zealand in the decades ahead, particularly in northern and eastern regions.
The implications of such projections are significant –both for individual farmers and the country at large.
Treasury figures show that drought has cost New Zealand more than $5 billion in lost agricultural production over the past 15 years.
The Waikato region went 61 days straight without rain during the 2020 drought, and the impact on the region was more than $150 million.
“Every day I was looking at the forecast”
It’s no easy task managing any property through a prolonged dry spell. But what if there was a tool that could help farmers like Reymer and Beamish accurately project how long the “drought bridge” is likely to be?
This is where NIWA’s new drought forecasting project, NIWA35, comes in.
Auckland-based data scientist Neelesh Rampal has been working with his NIWA colleagues, meteorologists Ben Noll and Tristan Meyers. The trio have designed a model that will deliver accurate projections of dryness and drought risk out to 35 days ahead and at much higher resolutions than currently available.

“The model will provide farmers with a reasonable estimation of a best and worst case scenario over the next five weeks so that they can scenario-plan e ectively. It’s one-of-a-kind in New Zealand and is novel on an international scale,” Noll said.
“To continue with the bridge analogy, this new guidance will provide a range of dimensions for farmers, as well as a most likely length.”
NIWA has joined forces with the Ministry of Primary Industries (MPI) to implement a drought forecasting tool and is working with farmers and growers to fine tune the model this summer, with plans to launch rolling 35-day drought forecasts, at 5km high resolution radius, to the public next year.
Original forecast
Input: GEFS (50km)
IWA35 comes with a history. In 1999, NIWA started producing the Seasonal Climate Outlook (SCO). This o ers regional projections for temperature, rainfall, soil moisture and river flows which look out three months into the future. The basis of the SCO is created using historical climate patterns, particularly sea temperatures.
“Predictability on the three-month scale comes from ocean memory, or the persistence of sea temperatures over long periods,” says Noll. “An example of this is the El Niño Southern Oscillation.”
These three-month forecasts and soil moisture reports are necessarily broad scale and heavily qualified. However, they still provide useful detail for landowners. The soil moisture report, for example, is published every week on Federated Farmers' rural news site, FedsNews.
But the meteorological search for more accurate, detailed projections continued and in 2009, NIWA climate scientists began running a model that took global data and provided a 15-day local forecast for New Zealand. It was a significant advancement, and its accuracy has steadily improved. Despite this, accurately projecting weather patterns, at an e ective local scale, in the space between the next two weeks or the broad three-month outlook like the SCO has to-date eluded forecasters.
Original enhanced using artifical intelligence
Input: NIWA35 (5km)
This image featuring Neelesh Rampal shows how NIWA35 uses artificial intelligence to create high resolution forecasting at 5km (right), from a low resolution input forecast at 50km. (NIWA)
“It's one-of-a-kind in New Zealand and novel on an international scale”
Data scientist Neelesh Rampal(Stuart Mackay)
As Noll says: “It is the challenging middle ground –the sub-seasonal space.”
The development of NIWA35 however means that current sub-seasonal void is about to be filled. Recent advances in both atmospheric modelling and artificial intelligence, coupled with the processing power of the latest generation supercomputers, mean that the science of forecasting can be pushed out much further and with a higher degree of both certainty and resolution.
“If the 2009 model is a Ford Model T, the NIWA35 model is a Tesla,” says Noll.
ata collection to create NIWA35 is extensive, and researchers are leveraging o a United States model established by the National Oceanic and Atmospheric Administration (NOAA).
The raw data is pulled down onto NIWA’s highperformance computer from NOAA every day. It is at a 50km resolution and a 31-member ensemble, which means that data is drawn from 31 di erent instances of the model.
This supplies 31 di erent scenarios for the forecast. When these scenarios agree, forecast confidence is generally higher, and when they diverge you’ve got lower confidence.
“Our initial review of model skill during summer 2021–22 showed that it picked up the extreme dryness that developed over New Zealand during January,” says Rampal.
As well as extending out to 35-day forecasts, NIWA35 projects conditions at a much higher resolution. It scales the ‘coarse’, global 50km input grid down to a 5km radius over New Zealand. This resolves the country’s complex topography far more e ectively.
“It’s challenging to make decisions from something coarse and 50km is not representative of the wide diversity of our terrain in New Zealand,” says Rampal.
This is where data science and the power of deep learning really comes into play. Drawing on convolutional neural networks (CNN) to extract information, the model can extract far more complex relationships than principal component analysis.
“It’s di erent from dynamical downscaling because we’re not using physics. We’re trying to learn physics from what’s happened in the past,” says Rampal.
“It enables us to look at what’s happened in the past and fill in the gaps.”
This allows for judgements to be made over a smaller area and forecast down to a 5km radius, with the prospect of getting resolutions as low as a 1km radius.
Downscaling has been done before in the forecasting space, but deep learning adds speed of process.
“We’re talking at least 1,000 times faster,” says Rampal.
In his media release earlier this year announcing MPI was partnering with NIWA to develop better drought forecasting systems, Agriculture Minister Damien O’Connor said the joint project was important to help farmers and growers get their businesses ready for future climate conditions.
“Knowing well in advance when dry conditions are heading your way means you can cut your cloth accordingly at critical times on-farm.
“Improved forecasting will alleviate some of the financial and mental burden that drought puts on farmers and growers.
“It will also make our primary industries more resilient, productive and sustainable.”
ver in Hawke’s Bay, Louis Beamish will welcome anything that helps landowners to be more proactive and manage their risk during those dry summer months.
“Any information on an extended forecast is useful,” he says.
For farmers like Reymer, NIWA35 would bring confidence about the length of the bridge.
“I could completely change my plan – forward contract palm kernel and silage, wean the calves in December, de-stock early, a number of things.”
He says during the summer of 2020, rain seemed to be predicted every week – but it didn’t turn up.
“We could see rain coming out of the tropics, but it kept getting pushed o . We need to know if the weather system is going to hit.”

And five kilometres changes so much. “We’re close to Mount Pirongia. They can get great rain and we still get none.
“Weather is the number one thing on your mind all of the time,” says Reymer.
“If the 2009 model is a Ford Model T, the NIWA35 is a Tesla”
Meteorologist Ben NollBen Noll.
Looking out across the normally green fields of the Waikato during February 2020. The drought cost the region more than $150 million in lost production. (Sarah Fraser)

“Weather is the number one thing on your mind all of the time”
Waikato farmer Andrew Reymer

Fellow monitoring technician Alec Dempster snapped this image during a pre-season maintenance visit to Mount Māhanga in May – and no, Jeremy didn’t drop the tools.


The purple rock crab (Leptograspus variegatus) lives in crags and crevices in upper intertidal zones. A widely distributed scavenging omnivore, it plays an important role in coastal ecosystems, recycling nutrients and as a food source itself for larger predators. (


Don't drop the screwdriver
A steadily building stream snakes its way between the rugged hillsides of Canterbury’s Arrowsmith Range, west of the Ashburton Lakes. (Jochen Bind)


Our coastline is changing as sea levels rise. Lawrence Gullery looks at a five-year research programme designed to help communities with tough decisions ahead.

Another payload of pipes and poles is deployed among the mangroves in the Athenree estuary.
Drilling up to 3m into the mangrove mud, researchers concrete in the poles which will hold the sensitive RSET sea-level rise measuring device.
helicopter sweeps into view over a mangrove forest in the Bay of Plenty carrying equipment vital to tracking the long-term health of our coastal wetlands.

It is the first of three payloads carefully dropped at 100m intervals into the Athenree Estuary near Waihi Beach.
Three more are deployed into the estuary’s saltmarsh flats, about 1km away.
While the helicopter works above, researchers and technicians from NIWA and the Bay of Plenty Regional Council, battle knee-deep mud as they start assembling the first of six Rod Surface Elevation Table, or RSET, instruments.
These are sensitive measuring devices that can accurately monitor surface elevation changes in our coastal wetlands.
The information the RSETs gather will be crucial for assessing the future health of Athenree’s mangrove forests and saltmarsh habitats.
The substrate that mangroves and saltmarsh plants grow in must keep pace with sea-level rise. If the sea rises too quickly and the buildup of the substrate below fails to keep pace, they will die.

And the survival of this sensitive estuarine habitat, and its counterparts around New Zealand, is critical.
It functions as a long-term sink for stormwater contaminants, supports biodiversity and provides nurseries for estuarine and coastal fish species.
Mangroves also mitigate coastal erosion and flooding by absorbing the impact of storm waves, extreme tides and tsunami.
People living nearby need to understand how these important habitats are changing and what can be done to ensure the longevity of our estuaries.
he field team secures the RSET receiver unit into the muddy estuary floor.
In a couple of months, when the site has settled, the researchers will return to attach the sensitive measuring device to the receiver.
It’s a portable horizontal arm with a series of nine vertical pins which can measure minute changes in surface elevation. The device can swing around on the receiver to take measurements at the north, south, east and west positions.
In the following days, six more RSET monitoring sites are installed at Ōhiwa Harbour in the Eastern Bay of Plenty.
Both projects are led by NIWA Coastal and Estuarine Physical Processes scientist, Dr Andrew Swales, who was involved in installing New Zealand’s first RSETs in mangroves in the Firth of Thames.


NIWA has been contracted by the Bay of Plenty Regional Council to install these latest instruments and the council will use the equipment to track the health of saltmarsh wetlands and shape their response to changing environmental conditions.
“This is an important opportunity to work with the regional council here in Athenree,” Swales says.
“The RSETs will give the council baseline information to manage these systems, understand the pressures on them around sea-level rise as well as what’s coming in from the catchment in terms of sediment.”
ata from the monitoring stations will also inform wider coastal wetland research in the NIWA-led Future Coasts Aotearoa research programme.
Swales is one of the research leaders involved in the five-year study which aims to provide tools and guidance to help rural communities around the country living in coastal lowland, adapt and prosper despite unavoidable sea-level rise.
“It’s about the whole balance between nature and society. Can we as a country adapt to sea-level rise in a way that balances the values and the needs of nature, as well as the needs and values of communities and society, and in a way that isn’t at the expense of one or the other?”
Swales says records going back a century prove sea levels are rising (see box on page 37).
“What’s still up for debate is how we respond to that. And organisations like NIWA are trying to inform that debate in a constructive way, by providing the information needed by decision makers.”
Dr Christo Rautenbach is a specialist in coastal and estuarine modelling at NIWA. He leads the Future Coasts Aotearoa study, in partnership with his colleague, environmental social scientist Jordan Luttrell.

"Sea-level rise varies depending on the location. It’s not uniform, but it is inevitable that the sea will continue to rise," Rautenbach says.
“Will sea levels rise faster than first anticipated? That’s the big question, and we can’t say for sure just yet.”
Future Coasts Aotearoa is the first sea-level research programme to focus on New Zealand’s rural, lowland landscapes.
“Other research typically focuses on the built environment, without much consideration for farms, rural infrastructure and ecosystems.
“Current strategies, in lowland regions, are likely to fail because we don’t understand how sea-level rise will impact on natural habitat, and what the impact will be on productive land.”
uture Coasts Aotearoa involves 50 researchers, some from international agencies, and 11 stakeholder groups, along with local and central government, Waka Kotahi and the Department of Conservation.
It addresses the physical science behind sea-level rise as well as the social and economic impact that issues such as inundation and rising salinity levels will have on lowland coastal communities.
Case studies are being explored in Northland, the lower Waikato, Bay of Plenty and Canterbury where
“It's about the whole balance between nature and society”
Dr Andrew SwalesDr Christo Rautenbach. (Lana Young)
early engagement has begun with Māori and councils. These study areas each face unique challenges posed by sea-level rise. Working with individual communities will help researchers determine the opportunities for adaptation across the country.
Data gathered will suggest what changes are likely in groundwater levels, salinity levels and wetlands.
The information will improve our understanding of where and when the country will reach an “adaption threshold point”.
That’s the point when coastal communities will have to decide between managed realignment or managed retreat.
Realignment involves removing coastal protection and allowing an area to become flooded, creating a new wetland or salt marsh habitat.
Rather than relying on hard structures for defence, managed realignment depends on natural defences to absorb or dissipate the force of waves.
uture Coasts Aotearoa aims to show how these changes can be made while ensuring coastal communities can remain prosperous.
That’s the solution many councils are looking for, and some have already begun to plan for changes prompted by sea-level rise.
Bay of Plenty Regional Council is studying the rate and the e ects of saltwater intrusion into floodplains used for farming. The results will determine when it will no longer be economically feasible to farm, and what the land could be used for instead.
The council also has a community-led funding initiative which supports three coastal hapū with their first steps of adaptation planning.

“Will sea levels rise faster than first anticipated? That's the big question”
Dr Christo RautenbachThe Future Coasts Aotearoa programme will help the Bay of Plenty Regional Council manage these vulnerable Athenree Estuary mangrove forests in the face of rising seas. (Lana Young)
Thames-Coromandel District Council has 400km of coastline and is finalising its Shoreline Management Plan. It’s the result of three years of consultation and research to manage coastal hazards, coastal erosion and inundation.

Further south, Hawke’s Bay Regional Council is developing its Kotahi Plan to replace its Regional Policy Statement, Resource Management Plan and Coastal Environment Plan.
It has 350km of shoreline and Kotahi will have a focus on managing the coastal environment, human impacts on coastal and marine habitats as well as climate change, sea-level rise and inundation.
Rautenbach says Future Coasts Aotearoa research will provide the science needed by councils responsible for writing coastal management plans.
It will also give guidance to the Ministry for the Environment and will feed into ongoing national policy revision on sea-level rise and coastal adaptation.
“We are hopeful this will build resilience in New Zealand communities as we brace ourselves for the inevitable changes to come.”
Tide-gauge records show New Zealand mean sea levels have risen about 0.2m from 1900 to 2020. The rate of rise has doubled since 1960.
Projections for a low greenhouse gas emissions future indicate sea levels may rise between 0.4m and 0.8m by 2120, and up to 1.5m under a high greenhouse gas emissions scenario.
The latest research shows impacts around New Zealand’s coast will vary significantly because land is going up in some places and down in others.
You can find out more at: https://environment.govt.nz/publications/interim-guidance-onthe-use-of-new-sea-level-rise-projections/
“This will build resilience in New Zealand's communities as we brace ourselves for the inevitable changes to come”
Dr Christo RautenbachBeachfront properties at Haumoana in Hawke's Bay. Homeowners face an uncertain future as higher seas combine with more frequent storm surges. (Rebekah Parsons-King)
Native algae filter excess nitrogen and phosphorus from farm runo .
(Stuart Mackay)
Can native freshwater algae help restore the mauri of local waterways? Lawrence Gullery investigates.
stream flows through the heart of a rural Waikato property where a novel research project centred on native freshwater algae is underway.
Te Paeahu Trust farms 420 cows across two dairy units on the 94-hectare property, near Morrinsville.
The Piakoiti Stream flows through one of those dairy units, and the stream is one of two field sites for an innovative experiment. This will test whether native algae can both treat agricultural drainage and enhance the kaitiakitanga of the land’s Māori owners.
Te Paeahu Trust Chairwoman Endine Dixon-Harris says by aiming to restore the mauri of the waterway, the project aligns with the trust’s kaitiaki and mātauranga values.

“The trust’s kaitiaki role is paramount when it comes to environmental responsibility for the whenua and its tributaries.”
About 25km further north, a similar trial is underway on a property owned by Tainui Group Holdings (TGH). This site is also next to a small stream which flows through the 200ha, 620-cow dairy farm.
TGH Taiao Manager, Taroi Rawiri, says the sustainability of waterways and taonga species depends on new ideas to help reduce the negative impacts of nutrient runo .
“As kaitiaki of this whenua, it is vital Tainui demonstrate leadership in improving farming operations to promote positive steps towards restoring the health and wellbeing of our waterways.”
he Filamentous Algae Nutrient Scrubbers (FANS) trials are testing the capability of native algae to filter contaminants such as nitrogen and phosphorus from farm runo .

The project centres on gently sloping floways, or channels, which convey drainage water from the surrounding paddocks through dense stands of native algae.
The Oedogonium, Spirogyra, Rhyzoclonium and Cladophora algae used in the trials all come from nearby streams.
As the drainage water flows down the channel, the algae convert dissolved nitrogen and phosphorus into biomass which is harvested periodically.
Dixon-Harris
“The Trust's kaitiaki role is paramount when it comes to environmental responsibility for the whenua and its tributaries”
Endine
The harvested algae can be used as natural fertiliser or animal fodder. Other uses are also being explored by the research team and iwi partners.
Water samples are taken at the channel inflow and outflow points every week to assess the nutrient concentrations before and after treatment.
NIWA Water Quality Scientist Dr Jason Park, who is leading the project, says monitoring indicates the FANS systems can produce more than 16 tonnes of algal biomass in four months.

This points to removal of about 370kg of nitrogen and 75kg of phosphorus from the waterway per hectare, per year.
“We expect the biomass production and nutrient removal will more than double in the upcoming summer.”
Data collected from the trials will help determine the level of nutrients FANS systems can remove over a range of conditions.
It can then be compared with other nutrient pollution mitigation systems such as wetlands, woodchip bioreactors and riparian management.
“We know already a FANS system can be established in a few weeks and be operational soon after, much
more cost e ectively than a constructed wetland, for example,” Park says.
“But it requires more maintenance than a wetland, to regularly harvest the algal biomass. We are investigating whether a full-scale model could be harvested every month, quarter, or even just once a year.”
The five-year research project is now into its third year, and data to date suggests that FANS systems could be used across a range of land types and nutrient loads.
Larger trial sites will be established and tested over the coming year.
The MBIE Endeavour Fund research project has been co-developed with Māori and industry partners.
With a major focus on linking mātauranga Māori with international science, the trial is guided by a Māori Advisory Panel with involvement of NIWA’s Te Kūwaha Environmental Research team.
The project also supports research by two Māori masters students who are investigating how mātauranga values can be applied to managing agricultural drainage and protecting mahinga kai.
Back cover photo: This jagged 150m rock is the very tip of the 2,000m high volcanic cone of Hunga Tonga-Hunga Ha'apai rising from the seabed below.
(Rebekah Parsons-King)
“We expect the biomass production and nutrient removal will more than double”Dr Jason Park Water quality scientist Jason Park (right) checks nutrient levels with fellow researchers at the Te Paeahu Trust FANS trial site. (Stuart Mackay)
