NIWA Annual Report 2024/25
NIWA Annual Report 2024/25
The 2024/25 year has been one of significant transition and achievement for NIWA, marked by robust scientific delivery, major capital investments, and the successful completion of our merger into Earth Sciences New Zealand. Despite a challenging economic environment, NIWA has demonstrated resilience and adaptability, maintaining its commitment to scientific excellence.
NIWA achieved full-year revenue of $176.2M, $1.9M above budget, a result considered very pleasing given the lower-than-budgeted revenues secured at the end of the second quarter and the broader economic headwinds. Total expenditure for the year was well controlled, resulting in an operating surplus of $5.2M and a net loss of $(0.2)M, both ahead of budget expectations. These results reflect the organisation’s ongoing focus on productivity, revenue growth, and cost control.
A key highlight of the year was the successful deployment and integration of the Generation IV Supercomputer, Cascade. This system, now central to NIWA’s forecasting infrastructure and scientific innovation, has delivered substantial improvements in computational efficiency and energy use, positioning Earth Sciences NZ at the forefront of environmental computing in the Southern Hemisphere.
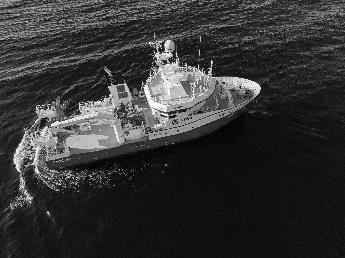
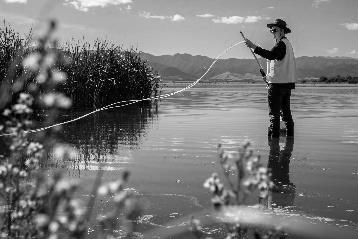
The arrival of our newest research vessel, Kaharoa II was another major feature The 36m vessel is fitted with state-of-the-art equipment and its capabilities have exceeded our expectations. It has become a new international benchmark for research vessels
The commercialisation of haku kingfish at NIWA’s Ruakākā facility has continued to progress, with production levels increasing and products now being exported to Australia, the US and Canada. This initiative, in collaboration with industry and government partners, is supporting New Zealand’s aquaculture sector and contributing to international food security discussions.
The year saw the successful merger of NIWA and GNS Science into Earth Sciences NZ, effective 1 July 2025. This transition involved the disestablishment of the NIWA Board and the establishment of the Earth Sciences NZ Board. The integration process included mapping of capabilities, assets, and services, and the development of a comprehensive workplan to ensure a smooth transition. Significant progress was also made on the integration of MetService, with workstreams established to align operational processes and enhance national weather forecasting capabilities.
Over its 33-year history, NIWA has made a profound impact on New Zealand’s environment, society, and economy – celebrating milestones such as:
• Investment of over $600M in science assets and facilities.
• Completion of more than 45,000 science projects and 130,000 field trips, with a project completion rate of 96–98% on time and within budget.
• Deployment of over 20% of the world’s active Argo ocean monitoring floats, supporting global weather and climate prediction.
• Pioneering research in climate, marine, and freshwater science, including the world’s longest continuous record of greenhouse gas measurements at Baring Head, Wellington.
• Major contributions to marine biosecurity, river management, and the development of national environmental indices.
While the economic landscape remains challenging, NIWA’s strong foundation, innovative mindset, and commitment to collaboration help ensure continued success for Earth Sciences NZ. The Board and management remain focused on delivering value to stakeholders, advancing scientific excellence, and supporting a prosperous and resilient future for New Zealand in the face of environmental and societal challenges.

David Smol

John Morgan Chair Chief Executive
28
August 2025
To support the wellbeing of Aotearoa New Zealand’s people and business through
• effectiveresponses to climate change
• improved management ofthe environment
• sustainableuseof natural resources
To deliver the science that will enable Aotearoa New Zealand to meet its environmental challenges and thrive in a rapidly changing world
We will innovate, generate new knowledge, and apply our science to
• provide industry opportunities
• transition to a low carbon economy
• adapt to a changing climate
• improve the health of our waterways and oceans
• care for our unique biodiversity
Will support the realisation of these national outcomes by applying innovative technology across multidisciplinary teams
New Zealand’s pre-eminent provider of atmospheric and climate science
• Climate change and variability
• High-precision weather forecasting
• Weather-related hazard forecasting
• Adaptation and mitigation
230 Science staff
New Zealand’s largest team of climate scientists
$42M Annual investment
In weather and climate research
6,500 Climate stations
The National ClimateDatabase with information from 6,500 climate stations covering New Zealand, South-West Pacific and Antarctica
$18M Supercomputer
Enabling precise, highly localised forecasts
Supporting the sustainable management of our freshwater resources
• Freshwater quality and quantity
• Biodiversity and biosecurity
• Sustainable use
• Flood forecasting
240 Science staff
New Zealand’s largest team of freshwater scientists
$40M Annual investment
Increasing knowledge of water quantity and quality
A national flood forecasting service
Providing river flow forecasts for 50,000 catchments nationwide
500 Hydrological monitoring stations
A nationwide network of water and soil moisture monitoring stations
To achieve these advancements
• we will partner with Māori
• embrace new technologies
• support major science infrastructure
• collaborate with other science organisations and the sectors that apply our science products and services
Understanding, managing and maximising the benefits of our marine estate
• New Zealand’s marine estate
• Fisheries stock assessment
• Sustainable use of marine resources
• Biodiversity and biosecurity
• High-value finfish aquaculture
260 Science staff
New Zealand’s largest team of ocean scientists
$67M Annual investment
In coast and ocean, fisheries and aquaculture science
Northland Aquaculture Centre
New Zealand’s leading science facility for aquaculture R&D with an experimental Recirculating Aquaculture System to demonstrate the viability of commercialscale productionof high-value species on land
State-of-the-art research vessels
Supporting the New Zealand science community
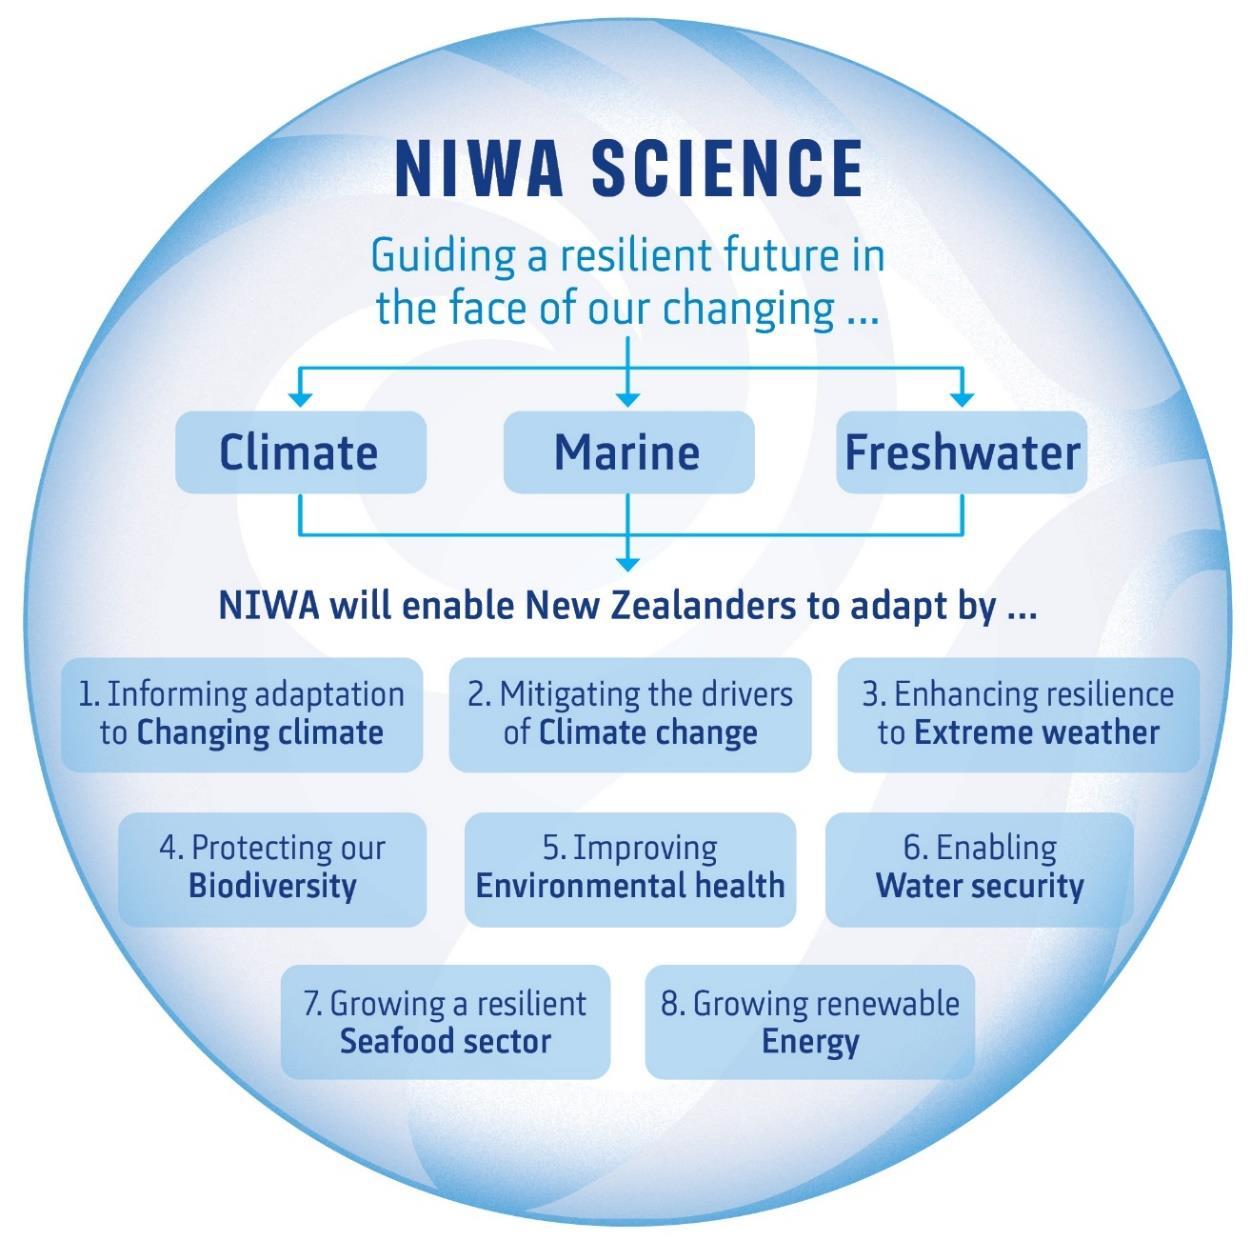
We will innovate, generate new knowledge, and apply our science to address eight key areas of Government priority. These National Outcomes are:
1. Informingadaptation to changingclimate
2. Mitigatingthe drivers ofclimate change
3. Enhancingresilience to extreme weather
4. Protectingour biodiversity
5. Improving environmental health
6. Enablingwater security
7. Growingaresilientseafoodsector
8. Growingrenewable energy
The information in this section of the Annual Report demonstrates how NIWA is delivering on its expected outcomes.
Our purpose, set out in our Statement of Core Purpose, is to:
• enhance the economic valueand sustainable management of Aotearoa NewZealand’s aquatic resources and environments
• provide understandingof climate andthe atmosphere
• increase resilience to weather andclimate hazards to improve the safetyand wellbeingof NewZealanders
We are expected to fulfil our purpose through the provision of research and transfer of technology and knowledge in partnership with key stakeholders and partners, including industry, government and Māori, to achieve six key outcomes:
1. Increase economic growth through the sustainable management anduse of aquatic resources
2. Growrenewable energy production throughdevelopinga greater understandingofrenewable aquatic and atmospheric energy resources
3. Increase the resilienceof NewZealandandSouth-West Pacific islandsto tsunamiand weatherand climate hazards, includingdrought,floodsand sea-level change
4. Enable NewZealand toadapt to the impactsand exploit the opportunities ofclimate variabilityand changeandmitigate changes in atmospheric composition from greenhouse gases and air pollutants
5. Enhance the stewardshipof NewZealand’s freshwater and marine ecosystems and biodiversity
6. Increase understandingof the AntarcticandSouthern Ocean climate, cryosphere, oceans and ecosystems and their longer-term impact on NewZealand
Haku kingfish commercialisation
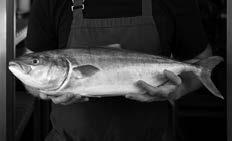
NIWA’s experimental commercial-scale Recirculating Aquaculture System (RAS) based at Ruakākā continues to increase production and 4,000kg of Hakukingfish are now being harvested per week.
The fish aregaining recognition inboth domestic and international markets through ongoing testing and evaluation. At present, fish are processed in Whangārei and distributed through five seafood distributors to restaurants throughout New Zealand.
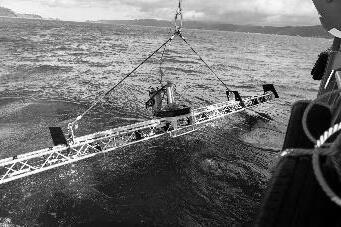
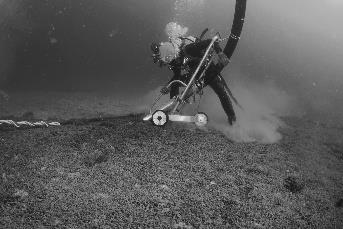
NIWA researchers have developed SwathCam, a nine-metre metal frame with video cameras and lights to provide crystal-clear visibility of the country’s underwater environment.
The camera system was designed for understanding seafloor habitats, and it can also be used for estimating fish species’ abundance and sizes.
NIWA’s research vessels Kaharoa and Kaharoa II worked alongside each other this year to intercalibrate fisheries survey results for ongoing comparability of trawl survey results.
Surveys are carried out by NIWA to inform stock assessments and help fisheries managers to understand current fish stocks and describe the effects of different management decisions.
Production could ramp up much higher in the hands of an independent operator, conducting business from part of NIWA’s current site and reaching upwards of 3,000 tonnes.
The long-term vision is to see RAS established elsewhere in New Zealand, boosting the regions who recognise the lucrative, yet environmentally sustainable, farming methods.
The system was first employed during a survey of underwater habitats in the Hauraki Gulf Marine Park last year with almost 300 sites surveyed, delivering incredible imagery and a rich set of data.
The system is less invasive than other methods of estimating fish abundance, such as trawling, and is more able to distinguish between species, compared to other technologies such as acoustics
The intercalibration was vital to ensure continuity of the valuable time series built up by Kaharoa over the past four decades – which are crucial to New Zealand’s marine resource management.
From 2026 and beyond, Kaharoa II will monitor the abundance and distribution of New Zealand inshore fish species, monitoring such as tor a range of important species, such as snapper, tarakihi, red gurnard and John dory.
Operational nowcasting for wind and solar power in New Zealand

Our nowcasting system, called NZNOW, provides access to accurate forecasts to help integrate wind and solar generation into the grid.
NZNOW rapidly updates to meet the demand of the energy market, generating predictions of solar and wind power at 30-minute increments out to 24 hours, and updating every 30 minutes.
The tool is a hybrid machine-learning physics modelling system, that takes inobservations from EarthScience New Zealand’s large observation network and satellite data, and blends them with high-resolution weather modelling in real time to provide accurate forecasting at a select number of sites across New Zealand.
Scaling up solar and wind power is essential for New Zealand to become carbon neutral by 2050. However, wind and solar power can be highly variable. Having confidence in the predictability of supply is therefore critical to the uptake of intermittent generation sources of wind and solar power.
Understanding snowmelt for more accurate hydroelectric inflow forecasts
Ensemble forecast-based modelling to help balance hydroelectric generation and capacity

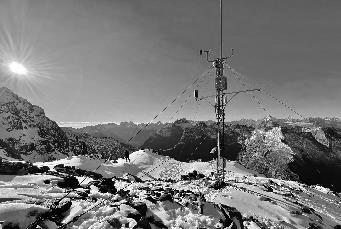
A new approach to predicting snow storage and melt aims to support the hydroelectricity industry by improving lake inflow forecasting.
Robust river flow and lake inflow forecasts rely on accurate estimates of runoff into river catchments – and an important part of this runoff is due to snowmelt. The project relies on hydrometeorological and snow data from NIWA’s high-elevation weather stations.
This research aims to improve generation efficiency and increase security of supply for the hydroelectric sector. In turn, this will help support the government target of 50% of New Zealand’s total energy coming from renewable sources by 2035.
A project in Contact Energy’s Clutha hydroelectric catchment on new ‘ensemble forecasts’ is combining weather forecasts from several different models to calculate the most likely future river flows.
Outputs show expected flows six days ahead as well as highest probability flows (between 25% and 75%) and the full range of possibilities.
Rainfall measured at our weather stations and river flows recorded upstream feed into the forecasting, meaning it is continually updated to take account of near real-time conditions.
The research aims to improve rainfall and hydro forecasting for the catchment, to better predict flow rates through key hydroelectric infrastructure.
The probability-based forecasts help Contact Energy balance generation and capacity across different sites – leading to better decisions for the overall scheme and the company’s wider assets.
Increase the resilience of New Zealand and South-West Pacific islands to tsunami and weather and climate hazards, including drought, floods and sea-level change
What if Cyclone Gabrielle veered toward Auckland? In 2023,Cyclone Gabrielle devastated Tairāwhiti and Hawke’s Bay. What if it had tracked toward Auckland instead? For Auckland Council, national grid operator Transpower New Zealand and energy company Vector Limited, NIWA simulated five different cyclone paths to see what the impact could be.

Tuvalu training supports climate resilience
First-of-its-kind tool reveals shallow groundwater elevations
The modelling showed that strong winds could have seen many fallen trees, while high storm surge could have resulted in erosion and damage, particularly along Auckland’s eastern coast.
NIWA technical assistance is valued by Pacific partners and embedded in numerous Pacific climate resilience initiatives. One of these is the Enhancing Climate Information and Services for 5 Pacific Island Atolls project supported by the Green Climate Fund, which focuses on strengthening climate early warning systems and resilience across Tuvalu, Marshall Islands, Cook Islands, Niue, and Palau. NIWA’s responsibilities include installing automatic weather stations,providing maintenance training, and delivering climate services training.
Climate change means severe weather events are becoming more frequent and more intense. This modelling helped Transpower and Vector find out where critical energy infrastructure might be impacted so they canbetter prepare and build resilience.
EarthSciences NZ is now working on how this approach canbe used in other locations and sectors across New Zealand.
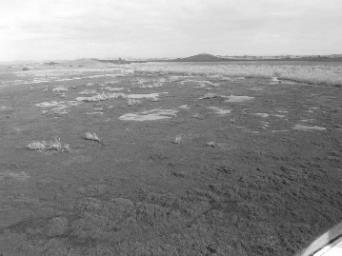
A new online tool identifies areas at risk from water table rises, showing areas that could be exposed to shallow groundwater hazards, right now, based on existing groundwater measurements.
High shallow groundwater can cause flooding and waterlogging that damage infrastructure and reduce agricultural productivity, while also leading to salinisation that degrades soil and water quality.
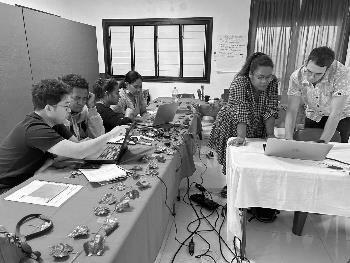
In December 2024, NIWA conducted a four-day climate data and services training course in Tuvalu with government stakeholders involved in climate early warning. The training introduced the Tuvalu Met Service to monitoring tools and climate data dashboards developed by NIWA, and explored ways to improve and operationalise them.
The training received excellent feedback and led to an online follow-up in February 2025. Similar training has been provided in Tonga, Fiji, and Kiribati, with upcoming support planned for the Cook Islands under the Australian and New Zealand-funded Climate and Oceans Support Program in thePacific.
The Shallow Groundwater Screening Tool, which identifies areas at threat, will help hazard and landuse decision-makers understand the scale of the problem and which areas are likely to be the most vulnerable.
Further updates from the NIWA-led Future Coasts Aotearoa research programme, which includes NIWA, Kōmanawa Solutions, GNS Science and the University of Canterbury, are indevelopment. These will include forecasts of rising water tables due to sea-level rise, as well as assessments of groundwater salinity risks from seawater intrusion.
New Zealand to adapt to the impacts and exploit the opportunities of climate variability and change and mitigate changes in atmospheric composition from greenhouse gases and air pollutants
MethaneSAT programme suggests global emissions differences

The MethaneSAT satellite captured 97 measurements over a range of different agricultural areas worldwide, including 11 over New Zealand, in thepast year. In addition, more than 200 agricultural targets across North America were studied using MethaneAIR – a sister instrument flownon aircraft – with more flights scheduled. Two ground-based validation campaigns were also carried out in the past year – in Waikato and Canterbury – contributing critical data to the project.
Unfortunately, contact with the satellite was lost in early July – but this will not hinder completionof the research programme.
Preliminary results from MethaneAIR suggest important differences between emissions from intensive farming systems such as those in North America and New Zealand’s pasture-based systems, which may not be fully reflected in current emissions reporting.
Further measurements and analysis of data already collected are expected to contribute crucial information to support reductions in methane emissions globally.
Differentiating methane from farm animals and adjacent wetlands
Native forests sink more carbon than expected

A new method to verify whether methane emissions on farms have come from agricultural practices or adjacent wetlands is enabling correct source attribution. A large field campaign in the Wairarapa used mobile platforms (instruments mounted on drones and vehicles) to find methaneplumes and collect air samples for isotope analysis. The technology is based on the different isotopes – or molecular signatures – of methane.
Beyond agriculture, the team is also testing to what degree isotope techniques can pinpoint the relative contributions of different emitters within single wastewater facilities, to provide more granular information to the operators.
Results from CarbonWatch NZ, a five-year Endeavour Programme that ended late last year, revealed that our native forests are absorbing more carbon dioxide (CO2) than previously thought. Using advanced modelling and NIWA’s supercomputer, researchers examined 10 years of data and found native forests absorb around 171 million tonnes of CO2 per year. Earlier estimates ranged from a net 24 to 118 million tonnes per year.
The research follows a 2017 pilot study, which also suggested native trees in Fiordland absorbed more CO2 than expected. The new study shows the carbon sink is more widespread than thought, particularly across the South Island, withgreater uptake of CO2 extending up the West Coast.
The research is critical to ensure farmers won’t bear the carbon cost of misattributed emissions. Correct attribution of methane emissions can help farmers better manage emissions on their land and recognise the value of wetlands as carbon stocks.
The aim is to give New Zealand’s farmers and waste operators a clear view of what’s happening, and a verifiable way to make meaningful improvements.
Forests – both native and exotic – play a key role in absorbing carbon dioxide through photosynthesis. But previous studies may have underestimated the amount of CO2 our native forests take up – implying they were roughly carbon neutral.
Further research is needed to better understand why environments with native trees are taking up more CO2 than thought, and what this could mean for our efforts to reduce greenhouse gas emissions and achieve domestic and international targets.
Suction dredging to remove Caulerpa incursion on Kawau Island
Fish passage is ramping up
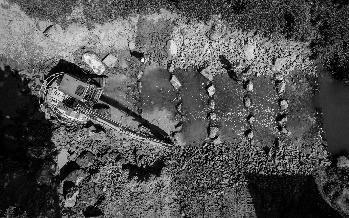
NIWA, working with Ngāti Manuhiri, Biosecurity New Zealand, Auckland Council, and Bay Underwater, trialled suction dredging to control the invasive seaweed Caulerpa incursion at Kawau Island in the Hauraki Gulf. NIWA dive and Remote-Operated-Vehicle (ROV) surveys found the fast-growing green alga had spread beyond the 1.27-hectare treated area. Results showed that the suction dredging method was effective at removing the weed; however, small fragments remained and indicate follow-up treatment is required for eradication.
During the summer of 2025 NIWA, with the support of Australasian Fish Passage Services, constructed five innovative rock ramp fishways at critical instream barriers in Northland, Hawke’s Bay and Taranaki.
First found in New Zealand in2021, the exotic seaweed Caulerpa poses a serious threat to marine ecosystems, as well as recreational, cultural, and commercial activities. NIWA is part of a multi-agency response to the incursion, providing scientific expertise to Biosecurity New Zealand, with the NIWA study delivering critical advice on the costs, efficacy, and efficiency of the ongoing treatment and management of smothering weed, which has now invaded other islands of the Hauraki Gulf.
First trialled in New Zealand on the West Coast in 2023, these robust rock ramps have proven effective at helping inanga and other native fish navigate instream barriers, while also providing flood protection and stream grade control.
Their nature-inspired design, featuring large ridge rocks embedded for stability, has attracted wide stakeholder interest, with further ramps planned for installation during the summer of 2026.
The success of these ramp systems,particularly in high-energy rivers prone to flash flooding, demonstrates the effectiveness of good engineering combined with expert knowledge of fish ecology.
Stopping the gold clam: it's now or never
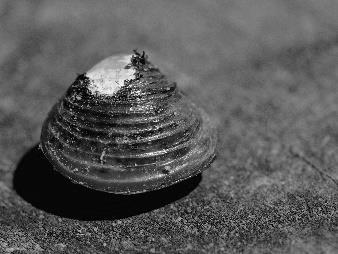
The spread of the invasive freshwater gold clam (Corbicula fluminea) poses a serious threat to native biodiversity, infrastructure, and recreational waters in New Zealand.
A five-year Endeavour-funded programme led by NIWA was launched in 2024 to develop effective and culturally-attuned management strategies.
The programme aims to establish control methods, assess the clam's ecological, social, cultural, and economic impacts, and predict its spread to enable early detection and intervention.
Initial research has concentrated ondeveloping a comprehensive understanding of gold clam ecology and their direct effects. For example, field studies in Lakes Karāpiro and Maraetai have examined the abundance and depthdistribution of the clam and native kākahi (freshwater mussels, Echyridella menziesii) and lab research has focused on the impacts highdensities of clams may have on native aquatic plants.
Research also focused on the urgent need to inform management protocols, including the Corbicula Check Clean Dry initiative for MPI. These studies are crucial for protecting New Zealand’s aquatic environments by preventing further spread of this invasive pest.
Increase understanding of the Antarctic and Southern Ocean climate, cryosphere, oceans and ecosystems and their longer-term impact on New Zealand
Massive hidden floods beneath the ice contributing to melting of Antarctic ice shelves
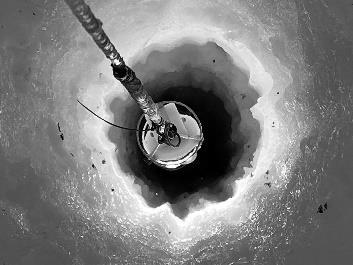
For the first time water has been directly observed flowing out from beneath the West Antarctic Ice Sheet, revealing how massive, hidden floods beneath the ice are contributing to the melting of the continent’s largest ice shelves.
The team completed the first close-up observation of these watercourses meeting the ocean in cavities under the ice shelf. Using hot water drilling, a 500-metre-deep borehole was made through the Kamb Ice Stream using a range of NIWA’s specialist ocean equipment.
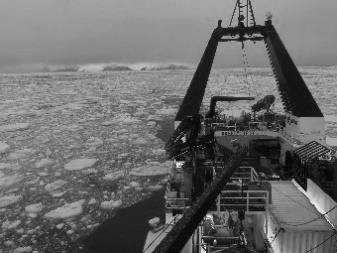
goes furtherest south yet The RV Tangaroa ventured further south than ever before this summer on its 16th voyage to Antarctica to help understand the impacts of climate change on the Ross Sea, and the impacts on the rest of theglobe.
Working through low sea-ice conditions, about 250 stations were sampled and more than 2,500 biological specimens were collected to help study how the changing ocean is impacting marine life.
Argo gets an upgrade Over 100 robotic floats were deployed this year as far as Chileby Kaharoa II to capture data throughout the world's oceans as part of the International Argo programme, which provides researchers around the world with vital data on ocean currents and climate systems.
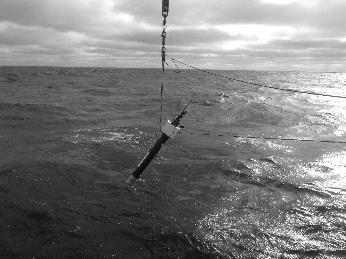
Two new biogeochemical Argo floats with extra sensors were also deployed during this year’s Antarctic voyage, allowing us to understand this critical environment.
Understanding these hidden systems is crucial to improving climate models and predicting sea-level rise more accurately. The Ross Ice Shelf and others like it play a critical role in slowing the flow of inland glaciers to the sea. Their decline will significantly accelerate global sea-level rise.
The New Zealand-led team was a collaboration of NIWA, GNS, Victoria University, and the University of Otago, as well as researchers in the UK and the US, including Cornell University.
Each voyage contributes to our growing understanding of the region across many areas of science, and this year the vessel went right up to the Ross Ice Shelf to study a critical heat and salt corridor key to melt in the region.
The Natural History Museum in London has compared samples taken from this voyage with historic voyages like Shackleton’s Endurance voyage to study the impact of the climate crisisshowing concerning signs of ocean acidification
The latest round of deployments continues NIWA’s 20-year contribution to the programme, alongside the Scripps Institution of Oceanography, the University of Washington, and CSIRO.
Since the early 2000s, our scientists havebeen part of theprogramme and recent data shows that full-depth ocean warming has occurred southof the Chatham Islands at around five times the global rate.
NIWA is committed to environmental sustainability, by working with others to deliver solutions that impact on, influence or contribute to the sustainable management of natural resources. We aim to operate with the lowest possible environmental footprint and are committed to the continuous improvement of our systems and processes to support this.
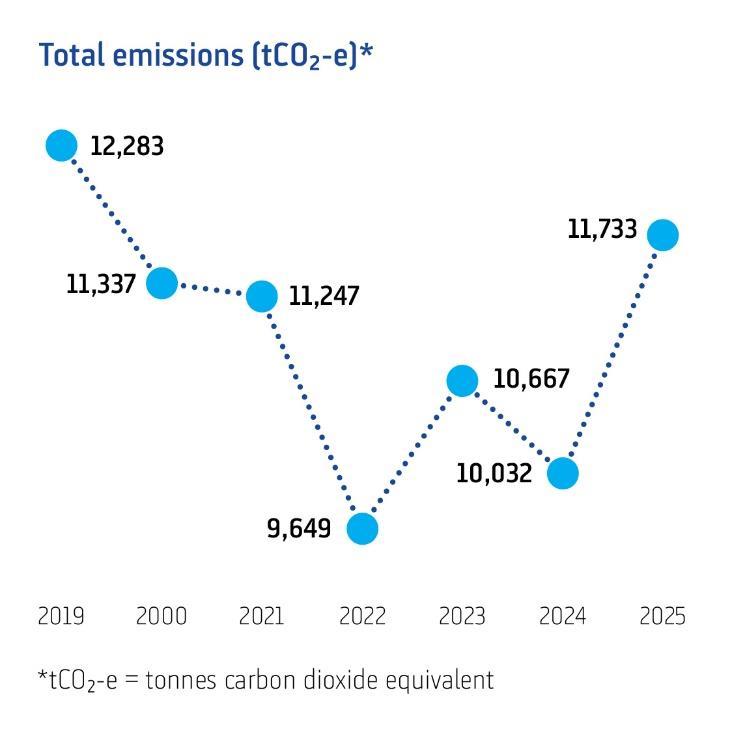
NIWA has been certified Toitū carbonreduce to ISO14064-1 since 2022. The programme provides a platform to both accurately collate and report on our greenhouse gas emissions, and to identify targets and projects to reduce emissions. We now have a baseline year and six years of verified emissions inventories, allowing us to understand and manage our emissions more thoroughly.

In years prior to the 2018–19 (FY19) baseline, sustainability initiatives were successfully operationalised to reduce emissions at both national and site levels. These included reducing energy consumption by 50% in the High Performance Computing Facility and renewable energy consumption and solar panels at regional sites, as well as significant investment in virtual machine technology, file sharing platforms and conferencing systems which allow all staff to work collaboratively without travelling to other NIWA sites.
We actively follow reduction, recycling and diversion processes at our sites for the various resources we consume and waste materials we produce. Vessel fuel consumption, and therefore emissions, have long been reduced by a reduction in vessel speed while maintaining safe operations and meeting survey requirements, along with fitting new, efficient engines. Reporting accuracy, constrained air travel, and our vehicle fleet replacement strategy, amongst other reduction activities continue, while two of our main regions are now in Green Star 5 properties as part of our Future Property Programme.
Operational emissions intensity (tCO2-e/$Mrevenue) has been verified to have decreased 7%against the base year. Our carbon emissions were reduced through COVID-19, but then rebounded, in part with areturn offieldworkand travel activity. Some such emissions are unavoidable through NIWA carryingoutscientific researchand providingservices, advice and solutions for the benefitof NewZealand. Last year, there was an overall increase inscience activities, includingincreased production at our Northland AquacultureCentre’s RecirculatingAquaculture System (RAS).The RASis designed to establish the commercial viabilityof on-landaquaculture, which offerssuperior environmental performance such asreduced water requirements and environmentalfootprint. We also had increasedfield work,full utilisation of the enhancedHamilton laboratorysuite, andincreasedvessel use with three oceangoingvesselsoperatingduringthe year as well as a highly successful voyage toAntarctica. Oneocean-goingvessel has nowbeenretiredfrom the fleet.
We remain committed to reducing our carbon footprint, and are focused on ensuring we are innovative in building lower emissions into planning and delivering excellent science.
NIWA will measure its performance against the outcomes and operating principles in its Statement of Core Purpose using the following set of indicators.
*Ministry of Business, Innovation & Employment generic indicators
*The ‘adjusted return on average equity’ uses a valuation basis comparable to that used by other Crown Research Institutes. This valuation basis arose from the transition to New Zealand Equivalents to International Financial Reporting Standards in 2006/07 and reverses the effect of the revaluation of certain land and buildings.
The 2024/25 financial year presented significant challenges, driven primarily by the reduction in revenue following the conclusion of the National Science Challenges. This was further compounded by continuing inflationary pressures, making it a particularly demanding year. However, the measures implemented by the Board and management at the end of 2023/24, including a comprehensive restructuring programme and tighter cost management proved critical in navigating these pressures. While operating in a difficult environment, these initiatives enabled the Company to stabilise its financial position and exceed its key financial objectives for the year.
Revenue and other gains
NIWA achieved revenue and other gains of $176.2 million for the year. While this outcome was $22.6 million lower than the prior year, it was $1.9 million higher than the budget set out in NIWA’s Statement of Corporate Intent.
NIWA’s MBIE-funded research revenue was $17.9 million lower than the prior year, reflecting the conclusion of the National Science Challenges. Commercial revenue, sourced both domestically and overseas, fell $3.0 million, while the change in fair value of biological assets was $1.6m lower than the prior year (due to the prior year being the first year of production in the Recirculating Aquaculture System).
The share of NIWA’s revenue arising from research funding sourced from the Ministry of Business, Innovation and Employment was 49%, comprising $50.6 million SSIF funding and $34.9 million contestable and other contracts. This share was down 4% compared wit h the prior year. Applied science services accounted for the remaining 51% of NIWA’s revenue, up 4% on the prior year.
Year-on year, operating expenses decreased by $23.9 million Of that reduction, $8.2 million related to employee benefits expense, reflecting the impact of business restructuring actions. Research collaboration expenses fell by $18.2 million largely due to lower subcontractor activity following the conclusion of the National Science Challenges.
Operating expenses (including depreciation and amortisation) were below budget by $1.6 million.
NIWA delivered profit before tax of $0.1 million and profit after tax of $(0.2) million during 2024/25. Compared with the previous year, these results reflect a reduction of $0.7 million and an increase of $5.6 million respectively. (The after -tax loss in the prior year reflected a one-time non-cash deferred tax expense of $(6.2) million as a consequence of changes to the tax treatment of depreciation on buildings.) The result exceeded budget objectives by $3.1 million before tax and $2.1 million after tax.
N et pr ofit aft er tax
($ in thousands)
$20,000
$15,000
$10,000
$5,000
-$5,000 $0
-$10,000
NIWA also closely monitors its Earnings before Interest, Tax, Depreciation and Amortisation (EBITDA), as this measure assists in understanding the Company’s capacity to fund future investments and carry debt. NIWA achieved EBITDA of $26.3M for the year aga inst a budget of $22.8 million.
EBIT DA
($ in thousands)
NIWA’s fundamental financial performance metric is adjusted return on equity, which enables comparison between CRIs on an equivalent basis. The Company delivered an adjusted ROE of (0.1)% this year, ahead of the budget target of (1.7)% and the (4.3)% achieved in the previous year. This improvement reflects actions undertaken to ensure the Company’s continuing financial sustainability.
Cash flows
The following table summarises NIWA’s cash flows this year and last year:
Net incr ease/(decrease)
Net cash flows from operating activities
Net cash inflows from operating activities increased by $8.1 million to $12.1 million in 2024/25. This year-on-year change was due both to improved cash profit and to movements in working capital items.
Net cash flows from investing activities
Net cash outflows from investing activities were $6.5 million lower than the prior year at $34.8 million. This year-on-year change reflects costs incurred for the new research vessel RV Kaharoa II in 2023/24, partially offset by costs associated with the purchase of the new High-Performance Computer in 2024/25.
Net cash flows from financing activities
Net cash inflow from financing activities fell from $34.7 million in 2023/24 to $18.9 million in 2024/25, reflecting the completion of major capital investments funded by prior debt drawdowns. The Company paid no dividend during the year as was signalled i n the previous year’s Statement of Corporate Intent. This reflects the need for ongoing material capital investments designed to ensure that our science facilities remain fit for purpose for the coming decades.
The following table summarises NIWA’s capital expenditure this year and last year:
Total capital expenditure was $34.4 million during the year, down from $52.5 million during the prior year. In 2022/23, a further $12.5m was recorded as a prepayment but could be considered in substance as equivalent to capital spending. This related to initial payments in relation to the construction of NIWA’s ocean-going research vessel RV Kaharoa II and was reflected as an investing activity in the cash flow statement. Adjusting for this, by adding the $12.5 million back to 2022/23 and removing it from 2 023/24, the actual capital spending reduced by $5.6 million year -on-year.
Capital ex pen ditu re ($ in thousands)
$60,000
$50,000
$40,000
$30,000
$20,000
$10,000
$0
20212022202320242025
Capital structure and liquidity
Shareholders’ equity at 30 June 2025 was $153.3 million (2024: $153.5 million) which was $1.7 million below the level forecast in the SCI budget. Total assets at year-end were $288.2 million (2024: $286.9 million). As at 30 June 2025, the Company’s net deb t was $52.8 million (2024: $29.6 million).
NIWA’s liquidity is primarily supported by operating cash flows. Additionally, the Company has access to financing facilities of $70.5 million (2024: $50.5 million) provided by its bank. As of 30 June 2025, $55.5 million had been drawn from these facilities (2024: $36 million).
As foreshadowed in the Company’s Statement of Corporate Intent, the Directors of NIWA have once again decided not to declare a dividend in respect of the 2025 year. This is in the light of a series of significant capital investments which have been made in recent years and will continue to be required to maintain and build the Company’s capability and financial sustainability for the future. These investments include renovating or replacing the physical infrastructure and facilities at three of the Company’s main sites.
Other comprehensive (loss)/income
The accompanying ‘Notes to the
The accompanying ‘Notes to the financial statements’ are an integral part of, and should be read in conjunction with, these financial statements.
Share capital
The Group has authorised issued and fully paid capital of 24,798,700 ordinary shares (2024: 24,798,700 ordinary shares). All shares carry equal voting and distribution rights and have no par value.
The accompanying ‘Notes to the financial statements’ are an integral part of, and should be read in conjunction with, these financial statements. SCI Budget information is unaudited.
For and on behalf of the Board:

David Smol

Mary-Anne Macleod Chair Deputy Chair
Authorised for issue on 28 August 2025
YEAR ENDED 30 JUNE
The accounting policies associated with the Group’s operating revenues are as follows:
Revenue from contracts with customers is recognised in accordance with the five-step model set out in NZ IFRS 15:
1. Identify the contract with a customer
2. Identify the performance obligations in the contract
3. Determine the transaction price
4. Allocate the transaction price to the performance obligations in the contract
5. Recognise revenue as or when a performance obligation is satisfied.
Key estimates and assumptions
Satisfaction of a performance obligation generally occurs as or when control of the outputs of the obligation is passed to the customer. Judgement is required to identify whether a performance obligation is satisfied over time or at a point in time, as well in applying methods for measuring progress towards the satisfaction of performance obligations. These judgements represent key assumptions concerning the future that have a significant risk of resulting in a material adjustment to the carrying amounts of assets and liabilities within the next financial year.
Generally, control for services is transferred, and revenue recognised, over time as the service is provided. The Group uses the ‘percentageof-completion method’ to determine the appropriate amount of revenue to recognise in a given period. The stage of completion is measured by reference to the labour and non-labour costs incurred up to the end of the year as a percentage of total estimated costs for each contract. Contract duration is typically 1-5 years and revenue is recognised over time as service is rendered. The customer pays a fixed amount over the contract term in accordance with the payment frequency specified in the contract.
The Group recognises revenue from the sale of goods when control of the goods has passed to the customer, the associated costs and possible return of goods can be estimated reliably, there is no continuing management involvement with the goods, and there is a high probability that a significant reversal in the revenue recognised will not occur. Revenue from the sale of goods is measured at the fair value of the consideration received or receivable, net of returns and allowances. The timing of the transfer of control varies depending on the individual terms of the sales agreement.
The Group does not expect to have any significant contracts where the period between the transfer of the promised goods or services to the customer and payment by the customer exceeds one year. As a consequence, the Group does not adjust any of the transaction prices for the time value of money as this is considered to not have a material impact.
Government grants
Government grants are recognised under NZ IAS 20 when there is a reasonable assurance that the Group will comply with the conditions attached to the grant, and that the grant will be received.
Government grants related to costs are deferred and recognised in profit or loss over the period in which the Group incurs the costs for which the grant is intended to compensate.
Government grants relating to the purchase of property, plant and equipment are included in non-current liabilities as revenue in advance and they are credited to profit or loss on a straight-line basis over the expected lives of the related assets.
A government grant that becomes receivable as compensation for expenses or losses already incurred, or for the purpose of giving immediate financial support to the Group with no future related costs, is recognised in profit or loss in the period in which the grant becomes receivable.
Strategic funding
NIWA and the Crown are parties to a Strategic Science Investment Fund –Programmes Investment Contract (SSIF Contract) under which the Crown contracts NIWA to perform research activities that support NIWA’s Statement of Core Purpose (SCP). Specific SCP outcomes, and their associated delivery programmes, are agreed annually with Shareholding Ministers and documented in NIWA’s Statement of Corporate Intent.
For financial reporting purposes this Strategic Funding is treated as a Government Grant in terms of NZ IAS 20. Strategic Funding received and recognised during the year was $50.552 million exclusive of GST (2024: $50.552 million). All Strategic Funded projects were completed during the year.
Contract balances
Contract assets
A contract asset is the right to consideration in exchange for goods or services transferred to the customer, conditional on something other than the passage of time. If the Group performs under a contract by transferring goods or services to a customer before the customer pays consideration or before payment is due, a contract asset is recognised for the earned consideration that is conditional.
Contract assets are classified as ‘Uninvoiced receivables’ in the Statement of Financial Position.
Contract liabilities
A contract liability is the obligation to transfer goods or services to a customer for which the Group has received consideration (or an amount of consideration is due) from the customer. If a customer pays consideration before the Group transfers goods or services, a contract liability is recognised. Contract liabilities are recognised as revenue when the Group performs under the contract.
Contract liabilities are classified as ‘Revenue in advance’ in the Statement of Financial Position.
YEAR ENDED 30 JUNE
$000 2025 2024
Revenue recognised that was included in the contract liability balance at the beginning of the year
Rendering of services 13,016 30,985
YEAR ENDED 30 JUNE
$000
YEAR ENDED 30 JUNE
YEAR ENDED 30 JUNE
$000
Auditor’s remuneration comprises:
Fees to PWC for audit of the financial statements (Group)
Fees to Hall Chadwick for audit of the financial statements (Subsidiary)
41 Fees to PWC for audit related services
Liabilities for wages and salaries, including non-monetary benefits and annual leave, long service leave, retirement leave, and training leave are recognised when it is probable that settlement will be required, and they are capable of being measured reliably. Provisions, in respect of employee benefits, are measured using the remuneration rate expected to apply at settlement. Employee benefits are separated into current and non-current liabilities. Current liabilities are those benefits that are expected to be settled within 12 months from balance date.
Provisions made in respect of employee benefits which are not expected to be settled within 12 months are measured at the present value of the estimated future cash outflows to be made by the Group in respect of services provided by employees up to the reporting date.
The provisions for long service leave, retirement leave, and training leave are dependent upon several factors that are determined by the expected employment period of employees, current remuneration, and the timing of employees’ use of the benefits. Any changes in these assumptions will impact on the carrying amount of the liability. The employment period used to determine the appropriate long service leave liability is based upon historical average length of service. The training leave liability is based upon typical historical usage of the benefit.
Property, plant and equipment is stated at cost less accumulated depreciation to date, less any impairment losses.
Expenditure incurred on property, plant and equipment is capitalised where such expenditure will increase or enhance the future economic benefits provided by an asset’s existing service potential. Expenditure incurred to maintain future economic benefits is classified as repairs and maintenance. The gain or loss arising on the disposal or retirement of an item of property, plant and equipment is determined as the difference between the sale proceeds and the carrying amount of the asset and is recognised in the statement of profit or loss and other comprehensive income
The useful lives of items of property, plant and equipment are key assumptions concerning the future that have a significant risk of resulting in a material adjustment to the carrying amounts of assets and liabilities within the next financial year.
Property, plant and equipment items, except for freehold land and work in progress, are depreciated on a straight-line basis at rates estimated to write off their cost over their estimated useful lives. Determining the appropriate useful life of property, plant and equipment requires management judgement over factors including the expected period during which an item is expected to be capable of service performance, the likelihood of technical obsolescence, future utilisation plans, and the effect of the regulatory environment.
The estimated useful lives of the Group’s property, plant and equipment assets are as follows:
The Group reviews the estimated useful lives of property, plant and equipment items, and assesses those assets for indicators of impairment, during each annual reporting period.
YEAR ENDED 30 JUNE 2025
*The Work in Progress balance as at 30 June 2025 primarily comprises the cost of the Group’s new supercomputer together with the cost of design work so far undertaken in respect of the proposed redevelopment of NIWA’s research centres in Christchurch and Wellington. The supercomputer is close to completion and is expected to be available for service shortly after the balance date. The property redevelopments are now being considered in the context of the amalgamation of NIWA with GNS (refer note 18). The continued recognition of the previous expenditure as part of property, plant and equipment is based on the expectation that the proposed redevelopments will proceed and will be similar to the design work completed to date.
Changes to the plans for redevelopments may result in write-off of any past expenditure that does not contribute to the eventual redevelopments.
The Group’s leases relate to buildings and land. These leases are recognised as a right-of-use asset and a corresponding liability. Each lease payment is allocated between the lease liability and finance cost. The finance cost is charged to profit or loss over the lease period so as to produce a constant periodic rate of interest on the remaining balance of the liability for each period. The right-of-use asset is depreciated over the shorter of the asset’s useful life and the lease term on a straight-line basis.
Assets and liabilities arising from a lease are initially measured on a presentvalue basis. Lease liabilities include the net present value of fixed payments.
The lease payments are discounted using the interest rate implicit in the lease. If that rate cannot be determined, the Group’s incremental borrowing rate is used, being the rate that the Group would have to pay to borrow the funds necessary to obtain an asset of similar value in a similar economic environment, with similar terms and conditions.
Right-of-use assets are measured at cost, comprising the amount of the initial measurement of lease liability. These assets are subsequently depreciated using the straight-line method from the commencement date to the end of the lease term.
Payments associated with short-term leases and leases of low-value assets are recognised on a straight-line basis as an expense in profit or loss. Shortterm leases are leases with a lease term of 12 months or less. Low-value assets comprise small storage spaces.
YEAR ENDED 30 JUNE
Reconciliation of lease liabilities
(7) 1
* The total finance expense of $5,316k shown in the statement of profit or loss and other comprehensive income for 2025 comprises the lease interest of $2,377k shown in the table above, together with loan interest payments of $2,939k.
Lease-related expenses included in the statement of profit or loss and other comprehensive income
NIWA has one collection and three databases that have been defined as heritage assets. Heritage collection assets are those assets held for the duration of their physical lives because of their unique scientific importance, and heritage databases are maintained as an incidental part of existing business operations.
The nature of these heritage assets, and their significance to the science NIWA undertakes, makes it necessary to disclose them. In the directors’ view, the cost of these heritage assets cannot be assessed with any reliability, and accordingly these assets have not been recognised for financial reporting purposes.
NIWA has the following heritage assets:
Type
Marine Benthic Biology Collection
National Climate Database
Water Resources Archive Database
New Zealand Freshwater Fish Database
Description
A national reference collection of marine invertebrates.
A national electronic database of high-quality climate information, including temperatures, rainfall, wind, and other climate elements.
A national electronic database of river and lake locations throughout New Zealand, including levels, quality, and flows.
A national electronic database of the occurrence of fish in the fresh waters of New Zealand, including major offshore islands.
Purchased identifiable intangible assets, comprising copyrights and software, are stated at cost less accumulated depreciation to date, less any impairment losses
Internally generated identifiable intangible assets, which arise from development costs that meet the recognition criteria, are recognised as an asset in the statement of financial position. Capitalisation is limited to the amount which, taken together with any further related costs, is likely to be recovered from future economic benefits. Any excess is recognised as an expense.
All other development and research costs are expensed as incurred.
Subsequent to initial recognition, internally generated intangible assets are stated at cost less accumulated amortisation to date, less any impairment losses, on the same basis as purchased identifiable intangible assets.
Key estimates and assumptions
The useful lives of identifiable intangible assets are key assumptions concerning the future that have a significant risk of resulting in a material adjustment to the carrying amounts of assets and liabilities within the next financial year.
Identifiable intangible assets are amortised on a straight-line basis at rates estimated to write off their cost over their estimated useful lives.
Determining the appropriate useful life of identifiable intangible assets requires management judgement over factors including the expected period during which an item is expected to be capable of service performance, the likelihood of technical obsolescence, and future utilisation plans.
The estimated useful lives of the Group’s identifiable intangible assets are as follows: Category
Copyrights
Development
The Group reviews the estimated useful lives of identifiable intangible assets, and assesses those assets for indicators of impairment, during each annual reporting period.
Receivables are stated at amortised cost using the effective interest rate, less an allowance for expected losses.
A loss allowance provision is established when the assessment under NZ IFRS 9 deems a provision is required. Changes in the carrying amount of the provision are recognised in the statement of profit or loss and other comprehensive income. Debts which are known to be uncollectable are written off against the provision, once approved by the Board of Directors.
Included in the Group’s trade receivables balance at the end of the year is one Crown debtor’s balance which equates to 12% of the Group’s total receivables balance (2024: 24%). 98% of that debtor’s balance is less than 60 days overdue and is deemed to be low credit risk (2024: 100%).
The Group considers that a large proportion of its customers have a low credit risk associated with them. Before providing any service or goods to a new customer on credit terms, a check is undertaken when deemed appropriate to verify the creditworthiness of the customer. The Group reserves the right to charge interest at a rate of 2% per month, calculated daily, on all invoices remaining unpaid at the due date.
Included in the Group’s trade receivable balance are debtors with a carrying amount of $794k (2024: $392k) which are more than 60 days past due at the reporting date. The Group has not created a provision for this balance because the amounts are still considered recoverable. The Group does not hold any collateral over past due or impaired balances.
The Group has applied the simplified approach to providing for expected credit losses, which requires the recognition of a lifetime expected loss provision for trade receivables. To measure the expected credit losses, trade receivables have been grouped based on days past due. The expected loss rates are based on the payment profiles of customers on a lifetime basis and the
corresponding historical credit losses over a period of five years, adjusted for any significant known amounts that are not receivable. The total expected credit loss allowance provision has been determined as nil (2024: nil) for the Group.
AS AT 30 JUNE 2025 $000
Past due 1 – 30
Past
Deferred tax assets and liabilities are measured at the tax rates that are expected to apply to the period when the asset and liability giving rise to them are realised or settled, based on the tax laws that have been enacted or substantively enacted at balance date.
Current and deferred tax is recognised in profit or loss, except when it relates to items recognised in other comprehensive income or directly in equity, in which case the deferred or current tax is also recognised in other comprehensive income or directly in equity, or where it arises from the initial accounting for a business combination. YEAR ENDED 30 JUNE 2025
Inventory is stated at the lower of cost and net realisable value. The basis on which cost is calculated is first in first out (FIFO) for consumables, finished goods and work in progress; and weighted average for raw materials.
AS AT 30 JUNE
The income tax expense for the year is the tax payable on the current year’s taxable income, based on the income tax rate for each jurisdiction. This is then adjusted by changes in deferred tax assets and liabilities attributable to temporary differences between the tax bases of assets and liabilities and their carrying amounts in the financial statements, and changes in unused tax losses. The
tax expense is determined as follows:
Reconciliation of income tax expense
to taxation:
(Non-
Deferred tax is accounted for using the balance sheet liability method in respect of temporary differences arising from the carrying amount of assets and liabilities in the financial statements and the corresponding tax base of those items. Deferred tax liabilities are generally recognised for all taxable temporary differences. Deferred tax assets are generally recognised for all deductible temporary differences to the extent that it is probable that sufficient taxable amounts will be available against which those deductible temporary differences can be utilised.
In accordance with the Income Tax Act 2007 the Group is not required to establish or maintain an imputation credit account by virtue of its classification as a Crown Research Institute.
12a Cash and cash equivalents and other short-term investments
Cash and cash equivalents includes cash on hand, deposits held at call with financial institutions, and other short-term, highly liquid investments with original maturities of three months or less that are readily convertible to known amounts of cash and which are subject to an insignificant risk of changes in value.
Other short-term investments consists of deposits with financial institutions with maturities over three months which are presented as a separate line item in the statement of financial position.
12b Reconciliation of the profit for the year to net cash from operating activities
YEAR ENDED 30 JUNE
$000 2025 2024
Profit for the year (190) (5,787)
Add/(less) non-cash items
Net (gain)/loss on disposal of property, plant and equipment 82 (994) Depreciation and impairment
Amortisation of identifiable intangibles
Net foreign currency (gain)/loss (47) 20
Change in fair value of biological assets (234) (1,895)
Increase/(decrease) in deferred tax (416) 6,149
Add/(less) movements in working capital
Increase/(decrease) in payables and accruals and revenue in advance (12,960) (14,226)
Increase/(decrease) in employee entitlements (4,619) 3,983
Decrease/(increase) in receivables and prepayments 8,502 (7,550)
Decrease/(increase) in inventory and uninvoiced receivables (49) 5,522
Increase/(decrease) in taxation payable and receivable 886 (1,469)
Increase/(decrease) in forward exchange derivatives –
Biological assets consist of pre-harvest fish stock in tanks associated with the Company’s experimental commercial-scale Recirculating Aquaculture System at its Northland Aquaculture Research Centre in Ruakākā. This stock is measured at fair value less estimated costs to sell, with any gain or loss resulting from the fair value measurement recognised in profit or loss.
The target live weight of the harvestable fish is 2.5kg. Once fish have reached this mass of 2.5kg, they are considered saleable and are transferred from the immature to mature biological assets accounts.
YEAR ENDED 30 JUNE 2025
YEAR ENDED 30 JUNE 2024
as at 1 July 2023
The pre-harvest fish stock has been valued with reference to its stage of development, the length of the growth cycle, the number in the water, total biomass in the water, and the fair value per kg at the point of harvest. The fair value per kg at the point of harvest is determined with reference to market prices achieved during the three months preceding balance date. This method of valuation falls into Level 2 on the fair value hierarchy.
YEAR ENDED 30 JUNE 2025 TONNES Immature fish Mature fish Total Opening balance as at 1 July 2024 90 42 132
YEAR ENDED 30 JUNE 2024
Opening balance as at 1 July 2023
The Group financial statements incorporate the financial statements of the Company and entities (including special purpose entities) controlled by the Company. Control is achieved where the Company has the power (including the ability to use the power) to govern the financial and operating policies of an entity so as to obtain benefits from its activities.
All intra-group transactions, balances, income, and expenses are eliminated in full on consolidation.
The subsidiaries of the Group and their activities are listed below:
Aquaculture Solutions Ltd New Zealand Experimental commercialscale production of high value finfish
All subsidiaries have a balance date of 30 June.
During the year the Company did not acquire or dispose of a stake in any subsidiary.
The Government of New Zealand (the Crown) is the ultimate shareholder of the NIWA Group. No transactions with other New Zealand Government-owned entities are considered related party transactions in terms of NZ IAS 24. No related party debts have been written off or forgiven during the year. Any business the NIWA Group has transacted in which a director or an employee has an interest has been carried out on a commercial basis. Any potential conflict is recorded in the minutes of Board meetings for directors and a separate interest register for employees. The interests register containing all relevant interests is updated on a regular and timely basis.
YEAR ENDED 30 JUNE
The table above includes the remuneration of the Chief Executive, Executive Team and the Board of Directors.
The classification of financial assets and liabilities depends on the purpose for which the financial assets and liabilities were incurred. Management
determines the classification of the Group’s financial assets and liabilities at initial recognition.
Classification
The Group classifies its financial assets in the following measurement categories: those to be measured at amortised costs, and those to be measured subsequently at fair value (either through other comprehensive income, or through profit or loss). The classification depends on the Group’s business model for managing the financial assets and the contractual terms of the cash flow.
For assets measured at fair value, gains and losses will be recorded in either profit or loss, or other comprehensive income. For investments in debt instruments, this will depend on the business model in which the investment is held. For investments in equity instruments, this will depend on whether the Group has made an irrevocable election at the time of initial recognition to account for the equity investment at fair value through other comprehensive income.
The Group reclassifies debt investments when, and only when, its business model for managing those assets changes.
Measurement
At initial recognition, the Group measures a financial asset at its fair value plus, in the case of a financial asset not at fair value through profit or loss (FVPL), transaction costs that are directly attributable to the acquisition of the financial asset. Transaction costs of financial assets carried at FVPL are expensed in profit or loss.
Financial assets and liabilities at fair value through profit or loss – Derivative financial instruments
This category has two sub-categories: financial assets held for trading, and those designated at fair value through profit or loss at inception. A financial asset is classified in this category if acquired principally for the purpose of selling in the short term, or if so designated by management.
Derivatives are also categorised as held for trading, unless they are designated as hedges. Assets in this category are classified as current assets if they are either held for trading or are expected to be realised within 12 months of the balance sheet date. After initial recognition, they are measured at their fair values. Gains or losses on re-measurement are recognised in the statement of profit or loss and other comprehensive income
Financial Assets at Amortised Cost
The Group classifies its financial assets at amortised cost only if both of the following criteria are met:
- Theasset is heldto collect the contractual cash flows,and
- Thecontractual terms giverisetocash flows that are solely payments of principal and interest.
Impairment of financial assets
The Group assesses, on a forward-looking basis, the expected credit losses associated with its assets carried at amortised cost and fair value through other comprehensive income. The impairment methodology applied depends on whether there has been a significant increase in credit risk. Note 8 details how the Group determines whether there has been a significant increase in credit risk.
For trade receivables only, the Group applies the simplified approach permitted by NZ IFRS 9, which requires expected lifetime losses to be recognised from initial recognition of the receivables.
The Group has the following requirements imposed upon it under the Crown Research Institutes Act 1992:
- tooperatein a financially responsiblemanner sothat sufficient operating funds are generatedto maintain financial viability;
- toprovidean adequate rate of return on shareholders’ funds;and
- tooperateas a going concern.
The Group’s policy is to maintain a strong capital base to maintain shareholder and creditor confidence and to sustain future development of the business.
The Group’s policies in respect of capital management and allocation are reviewed regularly by the Board of Directors.
The overdraft and flexible credit facilities available from ANZ Bank (refer note 16 subsection ‘Financing facilities’) are not subject to financial covenants.
Capital refers to the equity and borrowings of the Group.
There have been no material changes in the Group’s management of capital during the year.
The carrying value of all financial instruments is considered to approximate fair value.
All the Group’s forward exchange derivatives are classified as being within level 2 of the fair value hierarchy as defined by NZ IFRS 13 Fair Value Measurement (2024: the same). Their fair value is determined with reference to quoted rates for identical instruments on active markets.
Credit risk is the risk that a third party will default on its obligations to NIWA and the Group, causing a loss.
In the normal course of business, the Group incurs credit risk from trade receivables, uninvoiced receivables, and transactions with financial institutions (cash and short-term deposits and derivatives).
The Group has a credit policy that is used to manage this risk. As part of this policy, limits are placed on the amounts of credit extended to third parties, and care is taken to ensure the creditworthiness of third parties dealt with. All credit risk exposures are monitored regularly.
The Group does not require any collateral or security to support financial instruments, because of the quality of financial institutions and counterparties it deals with. There are no significant concentrations of credit risk, other than with the New Zealand Government, which the Group does not consider represents a material credit risk.
The exposure to the Group to credit risk as at 30 June 2025 was $22,029k (total exposure to credit risk, comprising cash and cash equivalents $2,662k, uninvoiced receivables $5,227k, and receivables net of provisions $14,140k) (2024: $24,465).
Further analysis on the receivables balance can be found in note 8
The Group has not renegotiated the terms of any financial assets which would result in the carrying amount no longer being past due or avoid a possible past due status.
The Group’s maximum exposure to credit risk by geographic region is as follows:
AS AT 30 JUNE
Interest rate risk
Interest rate risk is the risk that cashflows will fluctuate because of changes in market interest rates. This could affect the return on investments as well as the cost of debt.
The interest rates on the Group’s investments and debt facilities are as follows:
ENDED 30 JUNE
The directors do not consider there is any significant exposure to interest rate risk.
The Group undertakes transactions in foreign currencies from time to time, and, resulting from these activities, exposures in foreign currency arise. It is the Group’s policy to hedge foreign currency trading transaction risks economically as they arise. To manage these exposures, the Group may use financial instruments such as forward foreign exchange contracts.
The Group’s exposure to foreign currency-denominated non-derivative financial instruments was as follows, based on notional amounts:
AS AT 30 JUNE 2025
$000
AS AT 30 JUNE 2024
$000
–
(158) (53) (57) – (1) (1)
(49) 206 71 171 6 109
NIWA has a regularly reviewed treasury management policy in place which ensures the appropriate management of currency risk.
Liquidity risk represents the Group’s ability to meet its contractual obligations. The Group evaluates its liquidity requirements on an ongoing basis. In general, the Group generates sufficient cash flows from its operating activities to meet its obligations arising from its financial liabilities and has credit lines in place to cover potential shortfalls.
Payables and accruals of $3.63million (2024: $9.94 million) have a contractual maturity of less than one year. This is based upon the earliest date on which the Group can be required to pay.
Financing facilities
The Group has access to financing facilities made available by ANZ Bank with a total value of $70 5 million (2024: $50.5 million). This was drawn down by $55.5 million at 30 June 2025 (2024: $36.0 million). The total facility of $70.5 million relates to an overdraft facility of $0.5 million (on-call) and a flexible credit facility of $70.0 million. In addition, the Group has access to financial and performance guarantee facilities with limits of $0.2 million and $0.6m respectively.
The facility is unsecured and there are no financial covenants.
AS AT 30 JUNE
$000
Commitments for future capital expenditure
Contracted, but not provided for 716 502
On 1 July 2025, National Institute of Water and Atmospheric Research Limited (‘NIWA’) amalgamated with Institute of Geological and Nuclear Sciences Limited (‘GNS’) by way of a short-form amalgamation in accordance with the Companies Act 1993. The amalgamation occurred after the reporting date and is therefore identified as a non-adjusting subsequent event.
The amalgamation is part of the reform of New Zealand’s science, innovation and technology system, as announced by the Prime Minister on 23 January 2025.
This amalgamation resulted in NIWA, under its new name of New Zealand Institute for Earth Science Limited (‘Earth Sciences NZ’), continuing as the legal entity, and assuming all assets, liabilities, rights, and obligations of the amalgamating companies The amalgamation is accounted for as a common control transaction and will not result in any gain or loss. The carrying values of the transferred balances were recognised by Earth Sciences NZ on 1 July 2025.
This event does not affect the recognition or measurement of assets and liabilities as at 30 June 2025.
National Institute of Water and Atmospheric Research Limited (‘NIWA’ or ‘the Company’) and its subsidiaries form the consolidated Group (‘the NIWA Group’ or ‘the Group’). NIWA is a profit-oriented company registered in New Zealand under the Companies Act 1993. The financial statements for the NIWA Group are presented in accordance with the requirements of the Crown Research Institutes Act 1992, the Crown Entities Act 2004, the Public Finance Act 1989, the Companies Act 1993, and the Financial Reporting Act 2013.
The NIWA Group conducts research and applied science in water and atmospheric sciences in New Zealand and internationally.
The measurement basis adopted in the preparation of these financial statements is historical cost, except for biological assets and financial instruments as identified in specific accounting policies above.
The presentation currency of the Group and functional currency used in the preparation of these financial statements is New Zealand dollars.
All amounts disclosed in the financial statements and notes have been rounded to the nearest thousand New Zealand dollars unless otherwise stated.
Accounting policies are selected and applied in a manner that ensures that the resulting financial information meets the concepts of relevance and reliability, ensuring that the substance of the underlying transaction or event is reported.
The accounting policies have been applied in preparing the financial statements for the year ended 30 June 2025 and the comparative information for the year ended 30 June 2024
The 2024 Statement of Corporate Intent (SCI) Budget that is used for comparative information is not audited.
The financial statements have been prepared in accordance with New Zealand generally accepted accounting practice (NZ GAAP). They comply with New Zealand Equivalents to International Financial Reporting Standards (NZ IFRS) and other applicable financial reporting standards appropriate for profitoriented entities.
The financial statements comply with International Financial Reporting Standards Accounting Standards (IFRS Accounting Standards).
The financial statements are prepared on a GST-exclusive basis, except for receivables and payables, which are stated GST-inclusive.
Transactions
Transactions in foreign currencies are converted to the functional currency of the Group, being New Zealand dollars, by applying the spot exchange rate between the functional currency and the foreign currency at the date of the transaction. At the end of each year, monetary assets and liabilities are translated to New Zealand dollars using the closing rate of exchange at balance date, and any exchange gains or losses are recognised in the statement of profit or loss and other comprehensive income
Translation of foreign operations
On consolidation, revenues and expenses of foreign operations are translated to New Zealand dollars at the average exchange rates for the year. Assets and liabilities are converted to New Zealand dollars at the rates of exchange ruling at balance date. Exchange rate differences arising from the translation of the foreign operations are recognised in other comprehensive income and accumulated as a separate component of equity in the Group’s foreign currency translation reserve. Such exchange differences are reclassified from equity to profit or loss (as a reclassification adjustment) when the foreign operation is disposed of.
There are no standards that are not yet effective and that would be expected to have a material impact on the Group.
To the readers of National Institute of Water and Atmospheric Research Limited's Group Financial Statements For The Year Ended 30 June 2025
The Auditor-General is the auditor of National Instituteof Water and Atmospheric Research Limited Group (the Group). The Auditor-General has appointed me, Troy Florence, using the staff and resources of PricewaterhouseCoopers, to carry out the audit of the financial statements of the Group on his behalf.
Opinion
We have audited the financial statements of the Group on pages 2 to 20 that comprise the statement of financial position as at 30 June 2025, the statement of profit or loss and other comprehensive income, statement of changes in equity and statement of cash flows for the year ended on that date and the notes to the financial statements that include material accounting policies and other explanatory information.
In our opinion, the financial statements of the Group
• present fairly, in all material respects
‒ its financial position as at 30 June 2025; and
‒ its financial performance and cash flows for the year then ended; and
• comply with generally accepted accountingpracticeinNew Zealand in accordancewith New Zealand equivalents to International FinancialReportingStandards (NZIFS)and International Financial ReportingStandards AccountingStandards (FRS AccountingStandards).
Our audit was completed on 28 August 2025. This is the date at which our opinion is expressed
The basis for our opinion is explained below. In addition, we outline the responsibilities of the Board of Directors and our responsibilities relating to the financial statements, we comment on other information, and we explain our independence.
Basis forour opinion
We carried out our audit in accordance with the Auditor-General's Auditing Standards, which incorporate the Professional and Ethical Standards and the International Standards on Auditing (New Zealand) issued by the New Zealand Auditing and Assurance Standards Board. Our responsibilities under those standards are further described in the Responsibilities of the auditor section of our report.
We have fulfilled our responsibilities in accordance with the Auditor-General's Auditing Standards.
We believe that the audit evidence we haveobtained is sufficient and appropriate to provide a basis for our audit opinion.
Responsibilities of the Board of Directors for the financial statements
The Board of Directors is responsible on behalf of the Group for preparing financial statements that are fairly presented and that comply with generally accepted accounting practice in New Zealand.
The Board of Directors is responsible for such internal control as it determines is necessary to enable it to prepare financial statements that are free from material misstatement, whether due to fraud or error.
In preparing the financial statements, the Board of Directors is responsible on behalf of the Group for assessing the Group's ability to continue as a going concern. The Board of Directors is also responsible for disclosing, as applicable, matters related to going concern and using the going concern basis of accounting, unless the Board of Directors has to cease operations, or has no realistic alternative but to do so.
The Board of Directors' responsibilities arise from the Crown Research Institutes Act 1992.
Responsibilities of the auditorfor the audit of the financial statements
Our objectives are to obtain reasonable assurance about whether the financial statements, as a whole, are free from material misstatement, whether due to fraud or error, and to issue an auditor's report that includes our opinion.
Reasonable assurance is a high level of assurance, but it is not a guarantee that an audit carried out in accordance with the Auditor-General's Auditing Standards will always detect a material misstatement when it exists. Misstatements are differences or omissions of amounts or disclosures and can arise from fraud or error. Misstatements are considered material if, individually or in the aggregate, they could reasonably be expected to influence thedecisions of readers taken on the basis of these financial statements.
For the budget information reported in the financial statements,our procedures were limited to checking that the information agreed to the Group's statement of corporate intent.
We did not evaluate the security and controls over the electronic publication of the financial statements.
As part of an audit in accordance with the Auditor-General's Auditing Standards, we exercise professional judgement and maintain professional scepticism throughout the audit. Also:
• We identify and assess the risks of material misstatement of the financial statements, whether due to fraud or error, design and perform audit procedures responsive to those risks, and obtain audit evidence that is sufficient and appropriate to provide a basis for our opinion. The risk of not detecting a material misstatement resulting from fraud is higher than for one resulting from error, as fraud may involve collusion, forgery, intentional omissions, misrepresentations, or the override of internal control.
• Weobtain anunderstandingofinternal control relevant to theaudit inordertodesign audit procedures that areappropriatein thecircumstances butnot forthepurposeofexpressing an opiniononthe effectivenessoftheGroup'sinternal control.
• Weevaluatetheappropriatenessofaccountingpolicies used and the reasonableness of accounting estimates and relateddisclosures madeby theBoardofDirectors.
• Weconcludeon theappropriateness oftheuseofthe goingconcern basis ofaccountingby the Board ofDirectors and,based ontheaudit evidenceobtained,whetheramaterial uncertainty exists related to events orconditions that may cast significantdoubt ontheGroup's ability to continueas a goingconcern.Ifweconcludethat amaterial uncertainty exists,wearerequired todrawattention in

ourauditor's report to therelateddisclosures in the financial statementsor,ifsuch disclosures are inadequate,to modifyouropinion.Our conclusions arebased ontheaudit evidenceobtained up to thedateofourauditor's report.However, futureeventsorconditions may causetheGroup to cease tocontinueas a goingconcern.
• Weevaluatetheoverall presentation,structureand content ofthefinancial statements,includingthe disclosures and whetherthefinancialstatements represent theunderlyingtransactions andevents in amannerthat achieves fairpresentation.
• Weplan andperformthe Group's audit to obtainsufficient appropriateaudit evidenceregardingthe financial informationoftheentities orbusiness units within theGroup as abasis forforming an opiniononthefinancial statements.Weareresponsibleforthedirection,supervision and reviewof theaudit workperformed forthepurposes oftheGroupaudit.We remainsolely responsibleforour auditopinion.
• WecommunicatewiththeBoard of Directors regarding,amongother matters,theplannedscope andtimingoftheaudit and significant audit findings,includinganysignificantdeficiencies in internal control that weidentify duringouraudit.
Our responsibilities arise from the Public Audit Act 2001.
Other Information
The Board of Directors is responsible for the other information. The other information comprises the information included in the Annual Report, but does not include the financial statements and our auditor's report thereon. The other information we obtained prior to the date of this auditor's report comprised the Financial Summary and Actual performance versus Statement of Corporate Intent (SCI), the Preparation and Corporate governance disclosures, the Statement of Responsibility and the Directory. The remaining other information in the Annual Report is expected to be made available to us after that date.
Our opinion on the financial statements does not cover the other information and we do not express any form of audit opinion or assurance conclusion thereon.
In connection with our audit of the financial statements, our responsibility is to read the other information and, in doing so, consider whether the other information is materially inconsistent with the financial statements or our knowledge obtained in the audit, or otherwise appears to be materially misstated
If, based on the work we have performed on the other information that we obtained prior to the date of this auditor's report, we conclude that there is a material misstatement of this other information, we are required to report that fact. We have nothing to report in this regard.
When we read the other information not yet received, if we conclude that there is a material misstatement therein, we are required to communicate the matter to the Directors and use our professional judgement to determine the appropriate action to take.
Independence
We are independent of the Group in accordance with the independence requirements of the AuditorGeneral's Auditing Standards, which incorporate the independence requirements of Professional and Ethical Standard 1: International Code of Ethics for Assurance Practitioners (including International Independence Standards) (New Zealand) (PES 1) issued by the New Zealand Auditing and Assurance Standards Board.
In addition to the audit we carried out an engagement in the area of agreed-upon procedures regarding payments received in accordance with a research agreement, which is compatible with those independence requirements. Other than the audit and this engagement, we have no relationship with, or interests in, the Group.

Troy Florence - PricewaterhouseCoopers
On behalf of the Auditor-General
Auckland, New Zealand
28 August 2025
The table below shows director attendance at these Board meetings and committee member attendance at committee meetings. In addition, any director may attend any committee meeting.
The NIWA Group has insured its directors and employees against any costs or liabilities of the type referred to in s162(5) of the Companies Act 1993.
In accordance with Section 21(1) of the Crown Research Institutes Act 1992, the Group’s auditor is the Auditor-General. The Auditor-General has appointed Troy Florence of PricewaterhouseCoopers to conduct the audit on his behalf. The audit remuneration and fees paid for other services are detailed in note 2.
The following are transaction types recorded in the interests register for the year.
1
2 Only attendances by Committee members and the Board Chairman (who attends in an ex officio capacity) are recorded
The total remuneration received or receivable by directors of NIWA during the year was:
YEAR ENDED 30 JUNE
$000
Barry
Janice
The following people held office as directors of NIWA’s subsidiary companies at 30 June 2025:
Subsidiary Company Directors
NIWA Vessel Management Ltd B Harris, T Batten, J Fredric, M Hyland, M-A Macleod, D Moana, L Esterhazy, P L-Lane
Unidata Pty Ltd W Johnston1, P Baker1, M Saunders2
NIWA Aquaculture Solutions Ltd J Morgan1, P Baker1
1 Employee of the Group’s parent company
2 Employee of Unidata Pty Ltd
No fees were paid in respect of membership of subsidiary boards.
Interested transactions
Any business the NIWA Group has transacted in which a director has an interest has been carried out on a commercial basis. Any potential conflict is recorded in the minutes of Board meetings. A register containing all relevant interests is updated on a monthly basis.
Directors’ remuneration
Details of the directors’ remuneration are provided in the ‘Directors’ remuneration’ section above.
Use of company information by directors
Pursuant to section 145 of the Companies Act 1993 there were no recorded notices from directors requesting to use company information received in their capacity as directors that would not otherwise have been available to them.
Share dealings
During the year no director purchased, disposed of, or had recorded dealings of any equity securities of the NIWA Group.
Directors’ loans
No loans by the NIWA Group to any director were made or were outstanding during the year.
No specific disclosures were made by directors pursuant to s140(1) of the Companies Act 1993. General disclosures of interest made by directors during the year pursuant to section 140(2) are as follows:
Director and Entity Position
Barry Harris
McFall Fuel Ltd Chair
Rural Fuels Ltd Chair
New Zealand Food Innovation (Waikato) Ltd Chair
Waikato Regional Airport Ltd Chair
WEL Networks Ltd Chair
Titanium Park Ltd Chair
New Power Ltd Chair
Mary-Anne Macleod
University of Waikato Council Member
AgResearch Director
Araneacattus Family Trust Trustee
MacMacleod Limited Director/Shareholder
DairyNZ Limited Director
Environmental Protection Authority Director
Various Regional Councils Occasional Consultancy
Fire and Emergency New Zealand Director
NZTA Director (appointed 1 November 2024)
Janice Fredric
Mainpower Ltd Director
Lincoln University Council Member
Civil Aviation Authority Chair (until 24 July 2024)
Aviation Security Service Chair (until 24 July 2024)
NZ Shipwreck Welfare Trust Trustee
Tregynon Charitable Trust Trustee
Timaru District Council – Audit & Risk Committee Independent Member
Aurora Energy Director
NZ Growth Capital Partners Ltd Director (until 10 September 2024)
Aspire NZ Seed Fund Ltd Director (until 10 September 2024)
Elevate NZ Venture Fund GP Ltd Director (until 10 September 2024)
Green Power New Zealand Ltd Director (appointed 21 August 2024)
Mt Cass Wind Farm Ltd Director (appointed 21 August 2024)
Dean Moana
Whangaokena ki Onepoto Takutai Trust Trustee
NZ Food & Beverage Group Ltd Director & Shareholder
Nga Hapu o Nga Rohe o Ngati Porou Takutai Trusts Trustee Chair
The New Zealand Institute for Plant & Food Research Ltd Director
Nati Growth Ltd, Nati Properties Ltd Deputy Chair
Iwi Collective Partnership (ICP) Director
Ngati Porou Seafoods Ltd Director
Ngati Porou Fisheries Ltd Director
Real Fresh Ltd Has changed name to Nati Properties Ltd Director
ICP General Partner Ltd, Port Nicholson GP Ltd, Koura Inc GP Ltd Director
Port Nicholson GP Ltd Director
Koura Inc GP Ltd Director
Ahi Mokopuna GP Ltd Director
Akaroa Salmon NZ Ltd Director
AsureQuality Ltd Director
BV-AQ (Singapore) Holdings Pte Ltd Director
Te Ohu Kai Moana Trustee Ltd Director
Aotearoa Fisheries Ltd Director
BV-AQ Aust Pty Ltd Director
Margaret Hyland
Scion Science Advisory Board Advisor
Cirrus Materials Science Director
Te Herenga Waka-University of Wellington Vice-Provost (Research) Research Trust of Victoria University of Wellington Chair
Wellington UniVentures Deputy Chair
Karori Sanctuary Trust (trading as Zealandia
Te Māra a Tāne) Trustee
Livia Esterhazy GNS Director
HortNZ – A Lighter Touch Programme Director
The Thrive Collective Director
Nelson City Council Husband, Nigel Philpott, is CEO
Peter Landon-Lane
Chair (until 28 February 2025)
The number of employees (not including directors) whose remuneration exceeded $100,000 during the year, stated in brackets of $10,000, was:
The remuneration reflected in the above table comprises base salary only. This excludes payments in respect of superannuation or in respect of the cessation of employment of employees.
In 2025, the Group made payments of $3,610k for compensation or other benefits in respect of the cessation of employment of employees (2024: $178k).
Executive Remuneration
Remuneration Components
The Group’s Executive Team (ET), including the Chief Executive, receive fixed remuneration only. This consists of base salary and benefits, including KiwiSaver and insurance.
Chief Executive’s remuneration
The Chief Executive’s remuneration package that applied for 2025, together with the comparative information for the prior year, is as follows:
YEAR ENDED 30 JUNE $000
*Benefits include KiwiSaver, insurance, vehicle fuel expenses and, in 2025, cash-out of annual leave entitlement.
The Chief Executive is a member of KiwiSaver. As a member of this scheme, all Group staff, including the Chief Executive, are eligible to contribute and receive a matching company contribution up to a maximum of 5% of gross taxable earnings. In 2025, the Group’s contribution was $37,310.11 (2024: $37,304).
A summary of the Chief Executive’s total remuneration during the past five years is as follows:
YEAR ENDED 30 JUNE
Executive Team remuneration
In addition to the Chief Executive, NIWA’s Executive Team consists of nine members. The remuneration package for all Executive Team members combined (excluding the Chief Executive) that applied for 2025, together with the comparative information for the prior year, is as follows:
YEAR ENDED 30 JUNE
*Benefits include employer contributions to superannuation schemes (KiwiSaver or legacy government superannuation schemes, as applicable), insurance and wellness allowances.
Donations in the amount of $1,000 were made during the year (2024: nil).
The following statement is made in accordance with section 155 of the Crown Entities Act 2004.
1. TheBoardof theCompany is responsiblefor the preparation of these financial statements andthe judgements usedtherein.
2. TheBoardof theCompany is responsiblefor establishing and maintaininga system of internal controls designedto provide reasonableassuranceas tothe integrityandreliability of financial reporting.
3. In the opinion oftheBoard,these financial statements reflect a true andfair view of thefinancial positionandoperations of theGroupfor theyear ended 30 June 2025
David Smol
Mary-Anne Macleod Chair Deputy Chair
28 August 2025
During the year ended 30 June 2025:
Barry Harris Chair
Janice Fredric Deputy Chair
Prof Margaret Hyland (until 20 December 2024)
Mary-Anne Macleod
Dean Moana
Livia Esterhazy
Peter Landon-Lane
John Morgan, Chief Executive
Dr Rob Murdoch, Deputy Chief Executive
Patrick Baker, Chief Financial Officer
Geoff Baird, General Manager, Communications & Marketing
From 1 July 2025:
David Smol Chair
Mary-Anne Macleod Deputy Chair
Prof Chris Bumby
Paul Connell
Peter Landon-Lane
Paul White
Dr Mary-Anne Dehar, General Manager, People &Capability (until December 2024)
Megan Scott, General Manager, People & Capability
Warrick Johnston, General Manager, Technology & Innovation
Dr Helen Neil, General Manager, Operations
Marino Tahi, General Manager, Māori & Pacific Partnerships
Dr Alex Thompson, General Manager, Science
REGISTERED OFFICE AND ADDRESS FOR SERVICE
82 Wyndham Street
Auckland Central 1010
New Zealand
Private Bag 99940
Newmarket
Auckland 1149
New Zealand
AUDITOR
Troy Florence with the assistance of PricewaterhouseCoopers on behalf of the Auditor-General
BANKERS
ANZ Bank New Zealand Ltd
ASB Bank Limited
Westpac Institutional Bank
SOLICITORS
Meredith Connell
INSURANCE BROKER
Marsh Ltd
WEBSITE
www.niwa.co.nz