Presented to the House of Representatives pursuant to section 44 of the Public Finance Act 1989.
The NIWA Annual Report for 2024 is presented in two parts – the Year in Review and the Annual Report (Financial Statements). Collectively, these two documents fulfil our annual reporting responsibilities under the Crown Research Institutes Act 1992.
The Year in Review is an illustrated document containing the Chairman and Chief Executive’s report, descriptions of our research capabilities and performance, including our partnerships with Māori, work with collaborators and stakeholders, and an overview of our people.
Both reports are available digitally at: www.niwa.co.nz/about/annual-reports
2023/24
Science for a prosperous and resilient future
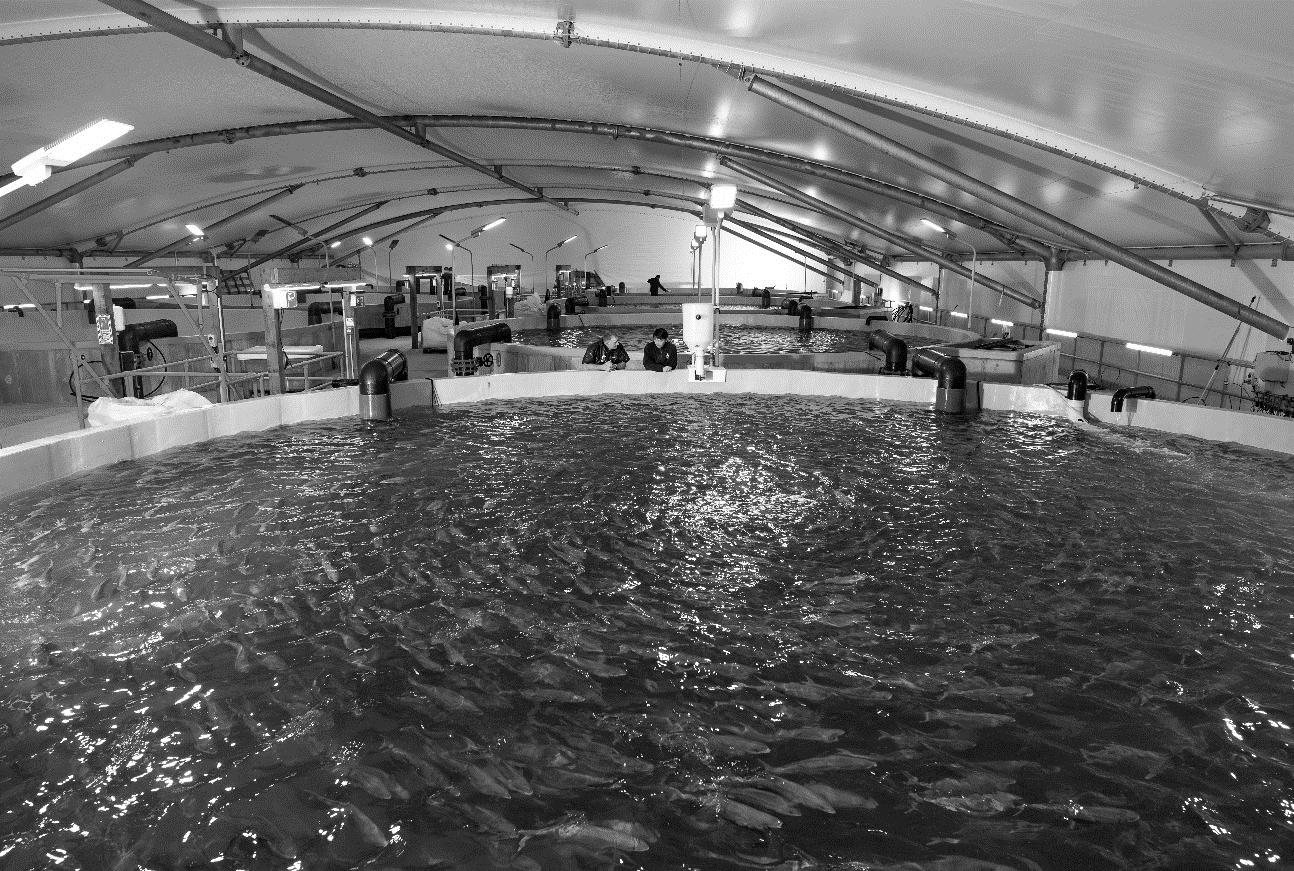
The experimental, commercial-scale recirculating aquaculture system at NIWA’s Northland Aquaculture Centre is now operational. The eight 350,000 litre tanks will produce more than 600 tonnes of kingfish annually. [Stuart Mackay]
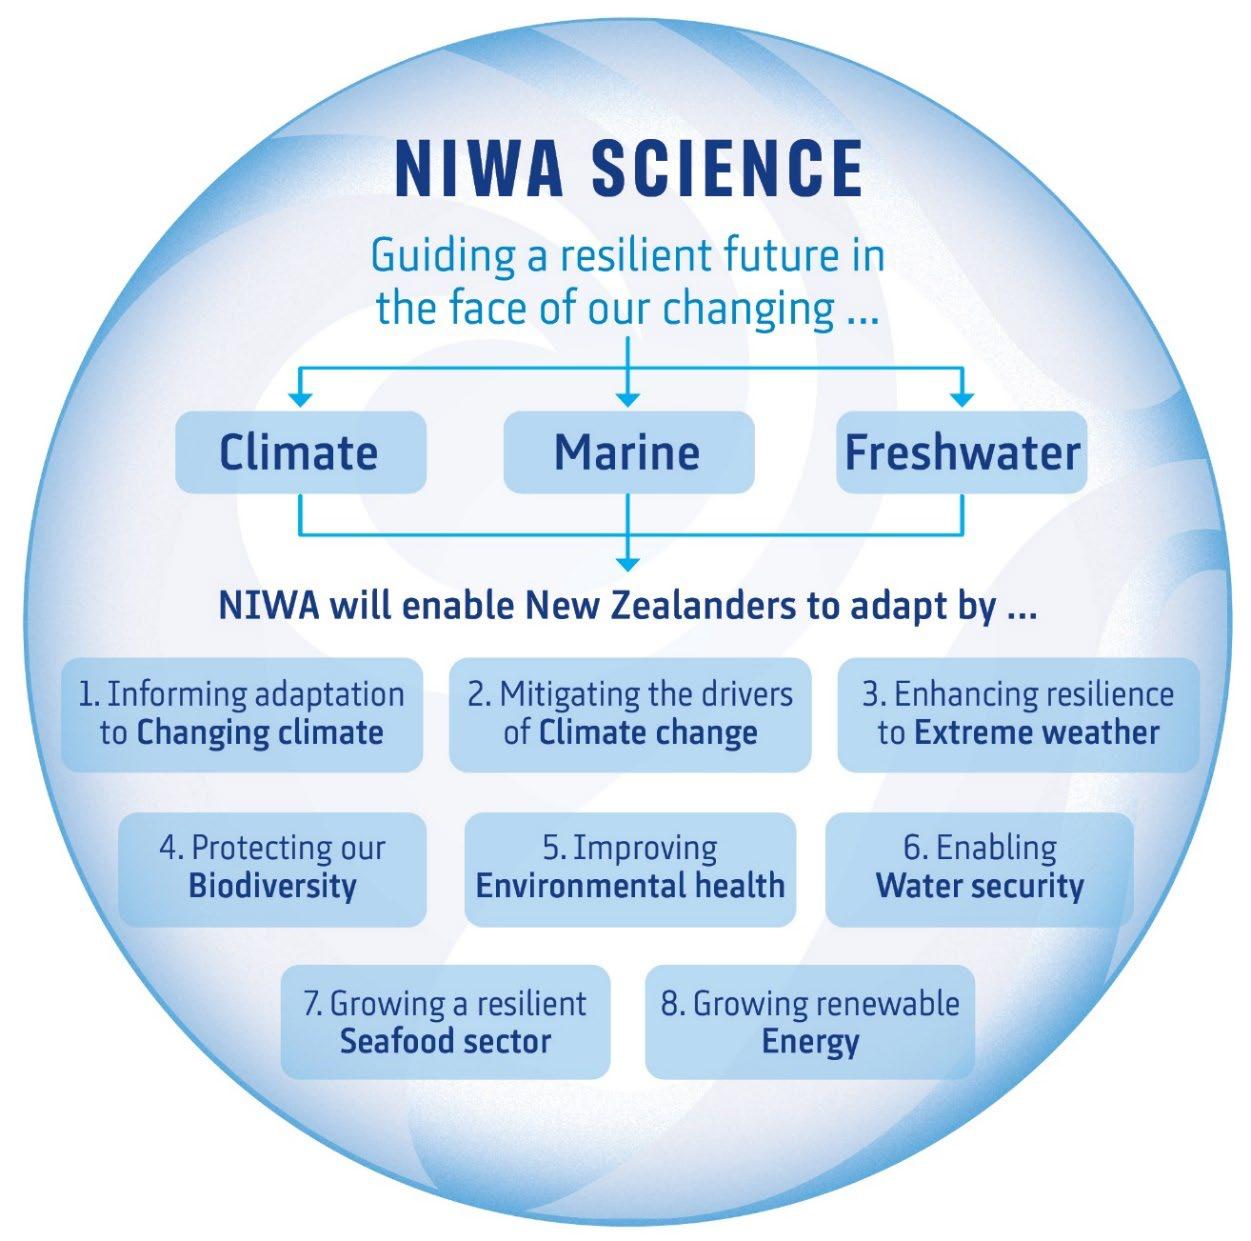
NIWA SCIENCE
OUR MISSION
To support the wellbeing of Aotearoa New Zealand’s people and business through
• effective responses to climate change
• improved management of the environment
• sustainable use of natural resources
OUR AIM
To deliver the science that will enable Aotearoa New Zealand to meet its environmental challenges and thrive in a rapidly changing world
We will innovate, generate new knowledge, and apply our science to
• provide industry opportunities
• transition to a low carbon economy
• adapt to a changing climate
• improve the health of our waterways and oceans
• care for our unique biodiversity
OUR SCIENCE
Will support the realisation of these national outcomes by applying innovative technology across multidisciplinary teams
CLIMATE
New Zealand’s pre-eminent provider of atmospheric and climate science
• Climate change and variability
• High-precision weather forecasting
• Weather-related hazard forecasting
• Adaptation and mitigation
230 Science staff
New Zealand’s largest team of climate scientists
$42M Annual investment
In weather and climate research
6,500 Climate stations
The National Climate Database with information from 6,500 climate stations covering New Zealand, South-West Pacific and Antarctica
$18M Supercomputer
Enabling precise, highly localised forecasts
FRESHWATER
Supporting the sustainable management of our freshwater resources
• Freshwater quality and quantity
• Biodiversity and biosecurity
• Sustainable use
• Flood forecasting
240 Science staff
New Zealand’s largest team of freshwater scientists
$40M Annual investment
Increasing knowledge of water quantity and quality
A national flood forecasting service
Providing river flow forecasts for 50,000 catchments nationwide
500 Hydrological monitoring stations
A nationwide network of water and soil moisture monitoring stations
OUR AIM
To achieve these advancements
• we will partner with Māori
• embrace new technologies
• support major science infrastructure
• collaborate with other science organisations and the sectors that apply our science products and services
MARINE
Understanding, managing and maximising the benefits of our marine estate
• New Zealand’s marine estate
• Fisheries stock assessment
• Sustainable use of marine resources
• Biodiversity and biosecurity
• High-value finfish aquaculture
260 Science staff
New Zealand’s largest team of ocean scientists
$67M Annual investment
In coast and ocean, fisheries and aquaculture science
Northland Aquaculture Centre
New Zealand’s leading science facility for aquaculture R&D with an experimental Recirculating Aquaculture System to demonstrate the viability of commercial-scale production of highvalue species on land
State-of-the-art research vessels
Supporting the New Zealand science community
NATIONAL OUTCOMES
We will innovate, generate new knowledge, and apply our science to address eight key areas of Government priority. These National Outcomes are:
1. Informing adaptation to changing climate
2. Mitigating the drivers of climate change
3. Enhancing resilience to extreme weather
4. Protecting our biodiversity
5. Improving environmental health
6. Enabling water security
7. Growing a resilient seafood sector
8. Growing renewable energy
NIWA’S SCIENCE STRATEGY
STATEMENT OF CORE PURPOSE OUTCOMES
The information in this section of the Annual Report demonstrates how NIWA is delivering on its expected outcomes.
Our purpose, set out in our Statement of Core Purpose, is to:
• enhance the economic value and sustainable management of Aotearoa New Zealand’s aquatic resources and environments
• provide understanding of climate and the atmosphere
• increase resilience to weather and climate hazards to improve the safety and wellbeing of New Zealanders
We are expected to fulfil our purpose through the provision of research and transfer of technology and knowledge in partnership with key stakeholders and partners, including industry, government and Māori, to achieve six key outcomes:
1. Increase economic growth through the sustainable management and use of aquatic resources
2. Grow renewable energy production through developing a greater understanding of renewable aquatic and atmospheric energy resources
3. Increase the resilience of New Zealand and South-West Pacific islands to tsunami and weather and climate hazards, including drought, floods and sea-level change
4. Enable New Zealand to adapt to the impacts and exploit the opportunities of climate variability and change and mitigate changes in atmospheric composition from greenhouse gases and air pollutants
5. Enhance the stewardship of New Zealand’s freshwater and marine ecosystems and biodiversity
6. Increase understanding of the Antarctic and Southern Ocean climate, cryosphere, oceans and ecosystems and their longer-term impact on New Zealand
Increase economic growth through the sustainable management and use of aquatic resources
PROJECT
Hakukingfishharvest andmarketing
Informingsnapperquotas
KEY ACHIEVEMENTS
NIWA’s premium kingfish – Haku is now being sold in restaurants throughout New Zealand and exported to Canada and the United States of America.
The commercial-scale recirculating aquaculture system (RAS) at the Northland Aquaculture Centre in Ruakākā has enabled industry partners to debut the kingfish to select national and international markets.
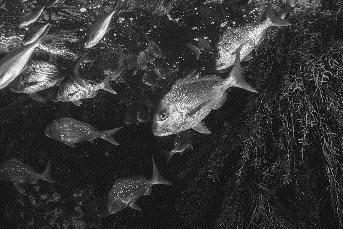
Recent NIWA assessment of the Hauraki Gulf snapper stock has shown the abundance of adult snapper in the area has increased from approximately 40,000 tonnes in the early 1990s, to a current estimate of approximately 140,000 tonnes.
The biomass increase is due to recent strong recruitment (the number of young fish entering the population) and a reduction in commercial fishing pressure. Increasing recruitment since 2010 may be due to warmer water temperatures.
SECTOR IMPACT
The RAS is the mechanism to deliver the attributes the market is looking for, what the producer values, and what the community wants.
A joint venture with the Northland Regional Council, it puts Northland on the map in terms of forward-thinking, environmentally-friendly farming.
Increasing snapper abundance is good news for recreational and commercial fishers as Hauraki Gulf snapper are now easier and less costly to catch.
A changing climate and warming temperatures may be increasing the productivity of the Hauraki Gulf stock.
Elverrecruitmentprogramme
NIWA researchers, with the support of multiple partnerships, have completed the annual elver (juvenile eel) catch update for the 2023–24 migration season, and an analysis of long-term elver catches in New Zealand. This work is part of the Fisheries New Zealand (FNZ) elver recruitment programme.
Catch data were collected from several sites throughout the country, adding to the longterm data series of 27 years.
Data over this time suggest that shortfin and longfin recruitment is variable within and between sites but has remained stable with a large degree of interannual variability.
FNZ is responsible for managing the commercial fishery of freshwater eels in New Zealand. Monitoring juvenile population dynamics and abundance allows managers to ensure that there is enough juvenile stock to maintain the adult population and forecast future changes in adult abundance.
Capturing elvers at instream barriers, such as hydroelectric dams, is a cost-effective means for maintaining a long-term data series on the relative abundance of both longfin and shortfin eels.
Grow renewable energy production through developing a greater understanding of renewable aquatic and atmospheric energy resources
NIWA worked with the Fiji Meteorological Service to install two monitoring stations in the Namosi River catchment in Fiji, as part of a feasibility study looking at additional hydropower generation capacity within the network. A further site is planned to be installed once land access is secured.
SECTOR IMPACT
The work was commissioned by Fiji’s national electricity producer, Energy Fiji Limited, and is part of an Australian Department of Foreign Affairs and Trade project, helping to investigate additional generation capacity, to reduce the reliance of fossil fuel, as well as contributing to improving the reliability of the country’s energy supply.
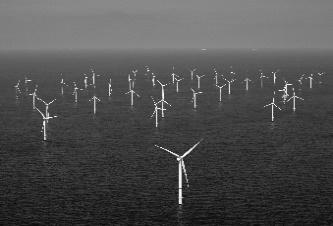
Offshorewindenergyresources
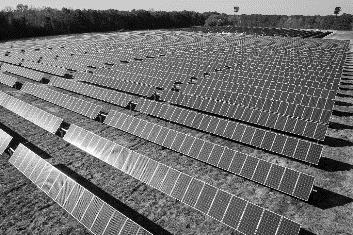
Lodestone Energy has engaged NIWA to develop systems to provide independent system performance monitoring at several of its new solar farms. NIWA technicians are installing weather stations that include albedometer sensors to measure incoming and reflected solar radiation – one fixed, the other attached to a solar array that tracks the sun.
In addition, following a successful trial, Lodestone Energy is engaging NIWA to provide daily wind, solar radiation, rainfall, lightning and hail forecasts to inform their solar farm operations.
New Zealand is being looked at as a significant opportunity for international renewable energy companies given it has one of, if not the best, wind resources in the world.
In advance of MBIE’s Offshore Renewable Energy permitting regime, scheduled to be in place in 2025, NIWA has been providing advice to regulators and developers.
Lodestone Energy is leading New Zealand’s largest solar project, involving more than half a million solar panels to deliver 400 GWh renewable energy to the New Zealand market.
This supports the Government’s goal of doubling renewable electricity production by 2050.
Key areas identified in initial studies include the environmental impacts that offshore windfarms could have on seabirds, fish, benthic communities and marine mammals, as well as taonga species, primary productivity and incursions of invasive species.
NIWA is committed to supporting this emerging industry and ensuring that the best scientific advice is available to undertake robust environmental impact assessments.
Tom Buysse
Increase the resilience of New Zealand and South-West Pacific islands to tsunami and weather and climate hazards, including drought, floods and sea-level change
PROJECT
KEY ACHIEVEMENTS
CycloneGabriellefloodinganalysis After Cyclone Gabrielle in 2023, Hawke’s Bay Regional Council commissioned research from NIWA analysing flood flows at 20 river gauge sites across the region.
At 13 of the 20 sites, it was deemed the largest flood on record. Prior to the cyclone, the probability of a flood this size occurring in a given year was as high as a one in 1,000-year event at one river site, but this reduced to one in 550 after the event – meaning the cyclone changed the standard forever.
NIWA researchers used LiDAR and aerial imagery collected before and after Cyclone Gabrielle to investigate relationships between riparian vegetation cover and riverbank erosion during the cyclone.
Erosion was closely related to the removal, or retention of riparian vegetation, indicating that planting can improve the anchoring strength of banks. However, variability in the data show that further work is needed to relate bank erosion to the species of riparian vegetation cover (i.e. rooting and anchoring strength) to provide practical guidance on riparian vegetation planting.
NIWA and the Ministry for the Environment released updated national climate projections for Aotearoa New Zealand in July 2024.
The high-resolution (5km) projections are based on downscaling of six global climate models utilised in the IPCC’s recent 6th Assessment Report. The downscaling takes into account detailed information about New Zealand’s unique landscape and climate conditions alongside the global data.
SECTOR IMPACT
Understanding the magnitude and frequency of floods is vital in managing flood risk. NIWA’s modelling provides critical information about river flows that occurred during the cyclone and means that the council and other agencies in the region are better placed to judge areas at risk from future flooding. The information will help them to better predict water depths and river flow velocities if flooding occurs again in the future.
Riparian planting has been advocated as a mitigation strategy for both enhancing river water quality and controlling bank erosion.
This research provides important information on the relationships between riparian vegetation cover and bank erosion during large flood events – an area where existing research was previously scarce. The results have been shared with iwi, central government and councils in Hawke’s Bay and Tairāwhiti.
These projections are supporting New Zealand’s transition to a climate-resilient, lowemissions economy.
NIWA is using the projections to help stakeholders such as iwi, councils and industry to better understand their climate-related risks to improve decision-making for climate adaptation and to support resilience to extreme weather events.
Enable New Zealand to adapt to the impacts and exploit the opportunities of climate variability and change and mitigate changes in atmospheric composition from greenhouse gases and air pollutants
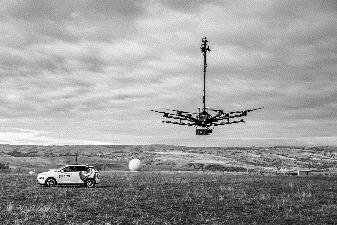
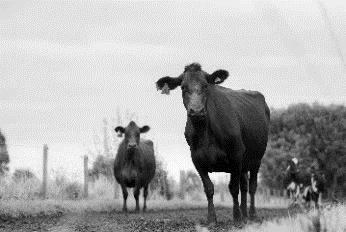
NIWA researchers are developing standardised techniques to quantify methane emissions from real-world sources – farms, landfills and wastewater plants.
The team is using a range of capabilities to measure methane and non-methane tracer gases from airborne, mobile and temporarily deployed platforms.
In 2024, NIWA began producing quarterly methane inventory reports for the Ministry for Primary Industries (MPI). The reports provide summaries and details of methane emissions for each of the North and South Islands as a whole, as well as Canterbury, Otago and Southland.
Driven by inverse modelling, high-resolution weather forecasting and measurements made across the country, NIWA provides independent emissions estimates which are compared to values from MPI and Statistics New Zealand.
As CarbonWatch NZ moves into its final stages, modelling results for the expanded network of sites across New Zealand show agreement between atmospheric measurements of greenhouse gases with bottom-up estimates of where those gases have come from for both pastures and planted forests.
However, results are still showing higher than expected uptake of carbon dioxide by indigenous forests – and not just for Fiordland as previously seen, but in many other regions too.
SECTOR IMPACT
The work will provide New Zealand with much-needed, standardised capability to quantify methane emission fluxes from a range of sources and sectors under fully operational conditions.
Ultimately, this will help improve accuracy of our greenhouse gas accounting.
The reports provide a timely and independent update on emissions – this is important because typical reporting is several months or years behind the reporting period. We expect to see improvements in precision over time, driven by refinements to methodology, additional data input and feedback from MPI and other stakeholders.
The reports will help refine methane estimates for New Zealand and improve our national greenhouse gas accounting.
The new CarbonWatch Urban MBIE Endeavour programme, led by GNS Science with involvement by the NIWA team, is now underway. In time, this programme will provide information about urban emissions and uptake for every city and town across New Zealand, building on the outcomes of CarbonWatch NZ work in Auckland over the past five years.
In addition, findings from CarbonWatch NZ are being harnessed to support two other countries – China and the Czech Republic – to develop their own country capabilities in atmospheric monitoring and modelling of greenhouse gases.
Enhance the stewardship of New Zealand’s freshwater and marine ecosystems and biodiversity
PROJECT
AIdetectionofCaulerpa
UpdatingAotearoaNewZealand’s marinebiota
Identificationofbenthic invertebratematerial
KEY ACHIEVEMENTS
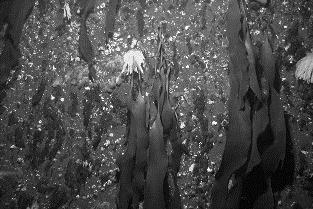
NIWA researchers have developed an AIdetection system to monitor the incursion of exotic Caulerpa, two invasive seaweed species first discovered in New Zealand in 2021.
The detection system takes on the function of a diver, with a Remotely Operated Vehicle as the diver’s eyes and a small NVIDIA supercomputer with AI architecture the diver’s brain. The detector ‘looks’ at each video frame on the fly and if it predicts that the target is present within a particular frame, it records it and can map it in an application such as ArcGIS.
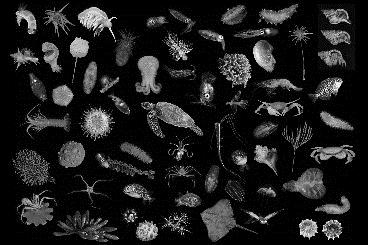
Aotearoa New Zealand’s marine biodiversity checklist has been updated in the latest NIWA biodiversity memoir, with an increase of 3,630 known living species since the turn of the century.
The total number of known living species in this update is 18,494 – a 24 percent increase since the last update
SECTOR IMPACT
NIWA is part of a multi-agency biosecurity response led by Biosecurity New Zealand, the biosecurity arm of the Ministry for Primary Industries.
Caulerpa species can form large monoculture mats, with the potential to outcompete native seaweeds and seagrasses, smothering shellfish beds and reducing the diversity of fauna. This presents a risk to recreational, cultural and commercial marine activities.
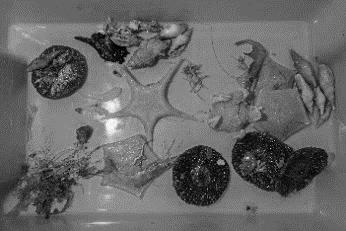
A NIWA report identified and counted the number of non-protected benthic invertebrate bycatch to Fisheries New Zealand (FNZ) with samples identified from as far back as 1985.
A total of 1,398 benthic invertebrate samples were identified and updated in FNZ catch databases. The samples covered 570 unique taxa across all major invertebrate groups and identified at least 32 undescribed species and two possible undescribed genera.
This work helps evaluate the progress made in discovering and documenting our marine flora and fauna, while contributing to policy initiatives
Without validated names, no biological science would be possible. It is important to validate the identity and status of important organisms and those having cultural and economic significance in agriculture, forestry and fisheries.
Ongoing identification of non-coral invertebrate bycatch collected by observers on commercial fishing vessels and fisheries research staff during research trawl surveys improves our knowledge of our marine biodiversity research and informs accurate ecological risk assessments of fishing impacts on benthic habitats.
The continued discovery of undescribed species underscores both the ability of the shipboard staff to identify unusual organisms, and the value of this material for ongoing biodiscovery research of the New Zealand deepsea fauna.
Increase understanding of the Antarctic and Southern Ocean climate, cryosphere, oceans and ecosystems and their longer-term impact on New Zealand
PROJECT
Antarcticalikelyacarbonstorage powerhouse
Measuringchangeinthe RossSea
Argonetworkdoublesinthe SouthernOcean
KEY ACHIEVEMENTS
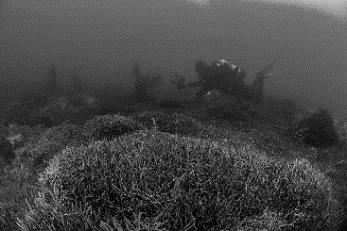
NIWA research suggests that Antarctic seaweed plays a much larger role in CO2 uptake than once thought.
Two surveys were conducted using the RV Tangaroa in the Ross Sea region in 2021 and 2023, where vast amounts of seaweed that may ‘lock up’ carbon in the seafloor were discovered
SECTOR IMPACT
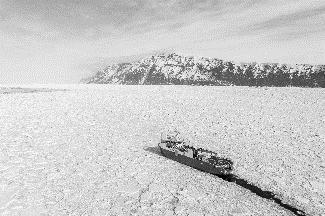
Coastal surveys in the Ross Sea region are extremely rare, making NIWA’s voyages some of the most comprehensive shallow surveys ever done in the region.
Sea ice coverage is changing dramatically around the Antarctic continent, and this has huge implications for carbon fixation by phytoplankton and macroalgae, so understanding and protecting these environments becomes more imperative than ever.
NIWA led a New Zealand team on a joint ItalyAntarctic Science Platform voyage on the Italian icebreaker RV Laura Bassi in January –March with the aim to track changes in the ocean around Antarctica.
The expedition sailed a two-month counterclockwise loop of the continental shelf in the Ross Sea. The sea ice encountered came in a variety of thicknesses, patch sizes and snow cover.
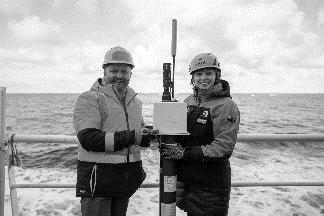
The RV Laura Bassi voyage significantly expanded the Polar Argo Network, an ocean monitoring initiative deploying remote sensing floats to measure temperature and salinity throughout the world’s oceans.
Eleven new, under-ice Argo floats were deployed from two different countries, as well as two redeployments, which doubles the profilers on the Ross Sea continental shelf.
As the largest ice shelf on the planet shows signs of change, the information gathered will help shape future climate policy.
The voyage research group represented the benefits of international cooperation, including 25 Italians, one Australian and 12 New Zealanders across numerous institutions, underpinned by wider support from the Ministry of Business, Innovation & Employment and the New Zealand Ministry of Foreign Affairs and Trade.
Because Argo data is immediately open access to researchers, the whole community benefits and can use the data right away.
A portion of the floats help us understand the Antarctic slope current, a circulation feature that rings the Antarctic continental shelf and regulates the flow of water toward the Antarctic coastline.
NIWA SUSTAINABILITY
Taking environmental responsibility
NIWA is committed to environmental sustainability, by working with others to deliver solutions that impact on, influence or contribute to the sustainable management of natural resources. We aim to operate with the lowest possible environmental footprint and are committed to the continuous improvement of our systems and processes to support this.
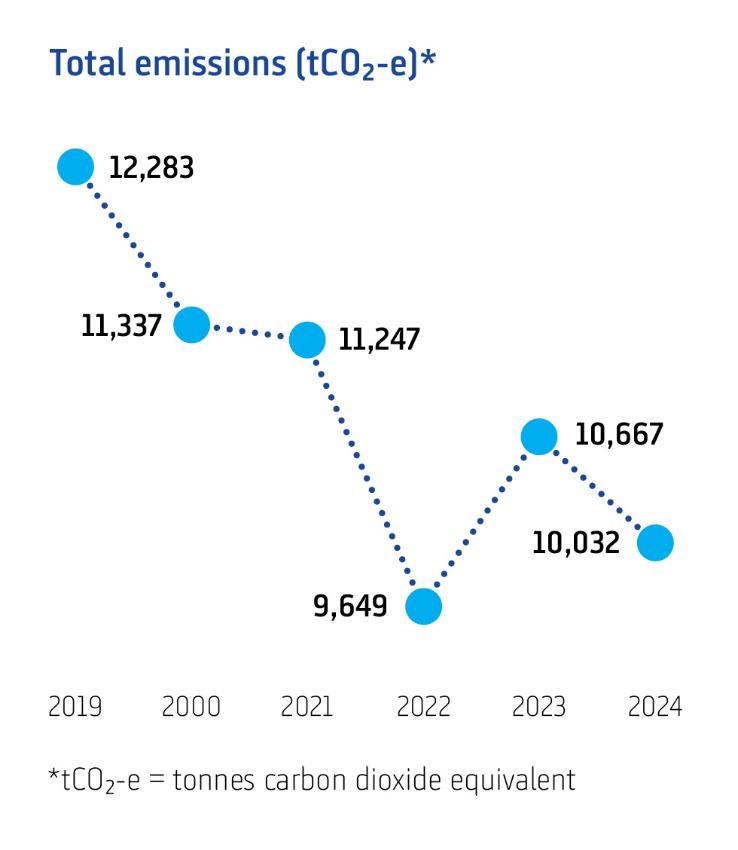
NIWA has been certified Toitū carbonreduce to ISO14064-1 since 2022. The programme provides a platform to both accurately collate and report on our greenhouse gas emissions, and to identify targets and projects to reduce emissions. We now have a baseline year and five years of verified emissions inventories, allowing us to understand and manage our emissions more thoroughly.
In years before the 2018–19 (FY19) baseline, sustainability initiatives were successfully operationalised to reduce emissions at both national and site levels. These included reducing energy consumption by 50% in the High Performance Computing Facility and renewable energy consumption and solar panels at regional sites, as well as significant investment in virtual machine technology, file sharing platforms and conferencing systems which allow all staff to work collaboratively without travelling to other NIWA sites.
We actively follow reduction, recycling and diversion processes at our sites for the various resources we consume and waste materials we produce. Vessel fuel consumption, and therefore emissions, have long been reduced by a reduction in vessel speed while maintaining safe operations and meeting survey requirements, along with fitting new, efficient engines.
Operational emissions decreased from the FY19 baseline year through to increased reporting accuracy, constrained air travel, and our vehicle fleet replacement strategy, among other reduction activities. Our carbon emissions were reduced through COVID-19, but then rebounded, in part with a return of fieldwork and travel activity. Some such emissions are unavoidable because NIWA carries out scientific research and provides services, advice and solutions for the benefit of New Zealand. Last year, fuel use decreased because of reduced vehicle and vessel activity, while two of our main regions are now in Green Star 5 properties as part of our Future Property Programme.
We remain committed to reducing our carbon footprint, and are focused on ensuring we are innovative in building lower emissions into planning and delivering excellent science.
PERFORMANCE TARGETS 2023/24
NIWA will measure its performance against the outcomes and operating principles in its Statement of Core Purpose using the following set of indicators.
Financial Indicators
*The NIWA Statement of Corporate Intent for 2023/24 published figures of 16.1% for operating margin, 0.75 for quick
18.9% for profit volatility and 2.6% for forecasting risk. These figures were incorrect.
Organisational Performance Indicators – 2023/24 at a glance
5.0 for
*Ministry of Business, Innovation & Employment generic indicators
FINANCIAL SUMMARY
NIWA Group Financial Summary
For the year ended 30 June 2024
*The ‘adjusted return on average equity’ uses a valuation basis comparable to that used by other Crown Research Institutes. This valuation basis arose from the transition to New Zealand Equivalents to International Financial Reporting Standards in 2006/07 and reverses the effect of the revaluation of certain land and buildings.
Group actual performance versus Statement of Corporate Intent (SCI) For the year ended 30 June 2024
*The NIWA SCI for 2023/24 published a figure of 63.2% for proprietorship (compared to the Annual Report 2023/24 proprietorship figure of 58%) due to a difference in calculation method The SCI calculation is based on average assets, while the Annual Report calculation is based on total assets.
OVERVIEW OF GROUP FINANCIAL PERFORMANCE
During the financial year 2023/24, the company encountered significant challenges largely due to inflationary pressures. Looking ahead, a likely material reduction in revenue was also identified, primarily in connection both with the termination of the National Science Challenges and with increased competition for research funds. In response, the Board and management implemented measures to ensure that the organisation will remain financially sustainable in 2024/25 and beyond. These measures included a restructuring programme in relation to which a $3.7 million expense was recognised in the year.
Revenue and other gains
NIWA achieved revenue and other gains of $198.8 million for the year. This outcome was $12.7 million higher than the prior year, although $1.0 million lower than the budget set out in NIWA’s Statement of Corporate Intent.
NIWA’s MBIE-funded research revenue was $2.3 million higher than the prior year, largely due to the now-ended National Science Challenges. Commercial revenue, sourced both domestically and overseas, was $8.5 million more than the prior year. In addition, a $1.9 million change in fair value of biological assets was recognised relating to growth of fish in the Company’s new experimental recirculating aquaculture facility.
Operating revenue and other gains ($ in thousands)
The share of NIWA’s revenue arising from research funding sourced from the Ministry of Business, Innovation and Employment was 53%, comprising $50.6 million SSIF funding and $52.8 million contestable and other contracts. This share was down 2% compared with the prior year. Applied science services accounted for the remaining 47% of NIWA’s revenue, up 2% on the prior year.
Revenue by source
Expenditure
Year-on-year, operating expenses increased by $16.3 million, of that, $9.0 million related to employee benefits expense, including $3.7 million for 2024 termination benefits due to business restructuring. Research collaboration expenses rose by $3.1 million due to increased subcontractor activity, and materials and supplies costs increased by $4.2 million due to inflation and activities related to the Recirculating Aquaculture System.
Operating expenses (including depreciation and amortisation) were above budget by $5.8 million.
Profitability
NIWA delivered profit before tax of $0.8 million and profit after tax of $(5.8) million during 2023/24. The after-tax loss reflects a one-time non-cash charge to deferred tax expense of $(6.2) million as a consequence of recent changes to the tax treatment of depreciation on buildings. Compared with the previous year, these results reflect a reduction of $6.9 million and $11.7 million respectively. Compared with budget, the result was $7.6 million lower before tax and $10.6 million lower after tax.
Net profit after tax ($ in thousands)
NIWA also closely monitors its Earnings before Interest, Tax, Depreciation and Amortisation (EBITDA), as this measure assists in understanding the Company’s capacity to fund future investments and carry debt. NIWA achieved EBITDA of $23.4M for the year against a
budget of $32.4 million. This metric is expected to recover in the 2024/25 year due to the financial sustainability measures noted above.
EBITDA ($ in thousands)
NIWA’s fundamental financial performance metric is adjusted return on equity, which enables comparison between CRIs on an equivalent basis. The Company delivered an adjusted ROE of (4.3)% this year, falling short of the budget target of 3.5% and the 4.4% achieved in the previous year. This shortfall was primarily due to the inflationary pressures and other cost challenges outlined above, together with the cost of the restructuring actions undertaken to ensure the company’s continuing financial sustainability. Additionally, the net after-tax loss reflects a one-time non-cash charge to deferred tax expense of $(6.2) million, resulting from recent changes to the tax treatment of depreciation on buildings.
Capital management and cash
Cash flows
The following table summarises NIWA’s cash flows this year and last year:
The above presentation is consistent with New Zealand Equivalents to International Financial Reporting Standards and therefore treats cash flows relating to short term deposits with maturities greater than three months as investing activities. In order to provide more
useful and relevant information concerning the Company’s cash flows, the table below restates the summary of cash flows, treating all short-term investments as equivalent to cash: ($ in millions)
Net cash flows from operating activities
Net cash inflows from operating activities decreased by $12.4 million to $4.0 million in 2023/24. This year-on-year change reflected a material reduction in the balance of revenue received in advance of being earned, relating to the end of the National Science Challenges.
Net cash flows from investing activities
Net cash outflows from investing activities (excluding the impact of cash flows associated with term deposits with maturities in excess of three months) decreased by $15.9 million to $41.3 million. This year-on-year variance was related to the costs associated with the new Hamilton property in 2022/23.
Net cash flows from financing activities
A net cash outflow from financing activities in 2022/23 of $2.2 million was replaced by a net cash inflow of $34.7 million in 2023/24. This was due to the Company drawing down on its available debt financing facilities during 2023/24 in order to support its capital investment plans. The Company paid no dividend during the year as was signalled in the previous year’s Statement of Corporate Intent (SCI). This reflects the need for ongoing material capital investments designed to ensure that our science facilities remain fit for purpose for the coming decades.
Capital spending
The following table summarises NIWA’s capital expenditure this year and last year:
Total capital expenditure was $52.5 million during the year, up from $45.3 million during the prior year. In 2022/23, a further $12.5 million was recorded as a prepayment but could be considered in substance as equivalent to capital spending. This related to initial payments in relation to the construction of NIWA’s ocean-going research vessel Kaharoa II and was reflected as an investing activity in the cash flow statement. Adjusting for this, by adding the $12.5 million back to 2022/23 and removing it from 2023/24, the actual capital spending has decreased by $17.7 million year-on-year.
Shareholders’ equity at 30 June 2024 was $153.5 million (2023: $160.4 million) which was $11.2 million below the level forecast in the SCI budget. Total assets at yearend were $286.9 million (2023: $242.7 million). As at 30 June 2024, the Company’s net debt was $29.6 million (2023: net cash of $9.0 million).
NIWA’s liquidity is primarily supported by operating cash flows. Additionally, the Company has access to financing facilities of $50.5 million (2023: $20.5 million) provided by its bank. As of 30 June 2023, $36 million had been drawn from these facilities (2023: undrawn).
Dividends
As foreshadowed in the Company’s Statement of Corporate Intent, the Directors of NIWA have once again decided not to declare a dividend in respect of the 2024 year. This is in the light of a series of significant capital investments which have been made in recent years and will continue to be required to maintain and build the Company’s capability and financial sustainability for the future. These investments include renovating or replacing the physical infrastructure and facilities at three of the Company’s main sites.
In March 2024, the MethaneSAT satellite was launched. MethaneSAT is a global initiative that will measure methane emissions with unprecedented precision. NIWA is leading the New Zealand-based agricultural emissions science programme, looking at the nation’s livestock emissions and more generally how the satellite’s data can be used to better understand methane emissions from the agricultural sector. [Stuart Mackay]
FINANCIAL STATEMENTS
NIWA GROUP
STATEMENT OF COMPREHENSIVE INCOME
For the year ended 30 June 2024
The accompanying ‘Notes to the financial statements’ are an integral part of, and should be read in conjunction with, these financial statements. SCI Budget information is unaudited.
NIWA GROUP
STATEMENT OF CHANGES IN EQUITY
For the year ended 30 June 2024
The accompanying ‘Notes to the financial statements’ are an integral part of, and should be read in conjunction with, these financial statements.
Share capital
The Group has authorised issued and fully paid capital of 24,798,700 ordinary shares (2023: 24,798,700 ordinary shares). All shares carry equal voting and distribution rights and have no par value.
NIWA GROUP STATEMENT OF FINANCIAL POSITION
As at 30 June 2024
The accompanying ‘Notes to the financial statements’ are an integral part of, and should be read in conjunction with, these financial statements. SCI Budget information is unaudited.
For and on behalf of the Board:
Barry Harris
Janice Fredric Chair Deputy Chair
Authorised for issue on 30 August 2024
NIWA GROUP STATEMENT OF CASH FLOWS
For the year ended 30 June 2024
The accompanying ‘Notes to the financial statements’ are an integral part of, and should be read in conjunction with, these financial statements. SCI Budget information is unaudited.
NOTES TO THE FINANCIAL STATEMENTS
For the year ended 30 June 2024
1. Revenue and other gains
In
The accounting policies associated with the Group’s operating revenues are as follows:
Contracts with customers
Revenue from contracts with customers is recognised in accordance with the five-step model set out in NZ IFRS 15:
1. Identify the contract with a customer
2. Identify the performance obligations in the contract
3. Determine the transaction price
4. Allocate the transaction price to the performance obligations in the contract
5. Recognise revenue as or when a performance obligation is satisfied.
Key estimates and assumptions
Satisfaction of a performance obligation generally occurs as or when control of the outputs of the obligation is passed to the customer. Judgement is required to identify whether a performance obligation is satisfied over time or at a point in time, as well in applying methods for measuring progress towards the satisfaction of performance obligations. These judgements represent key assumptions concerning the future that have a significant risk of resulting in a material adjustment to the carrying amounts of assets and liabilities within the next financial year.
Generally, control for services is transferred, and revenue recognised, over time as the service is provided. The Group uses the ‘percentageof-completion method’ to determine the appropriate amount of revenue to recognise in a given period. The stage of completion is measured by reference to the labour and non-labour costs incurred up to the end of the year as a percentage of total estimated costs for each contract. Contract duration is typically 1-5 years and revenue is recognised over time as service is rendered. The customer pays a fixed amount over the contract term in accordance with the payment frequency specified in the contract.
The Group recognises revenue from the sale of goods when control of the goods has passed to the customer, the associated costs and possible return of goods can be estimated reliably, there is no continuing management involvement with the goods, and there is a high probability that a significant reversal in the revenue recognised will not occur. Revenue from the sale of goods is measured at the fair value of the consideration received or receivable, net of returns and allowances. The timing of the transfer of control varies depending on the individual terms of the sales agreement.
The Group does not expect to have any significant contracts where the period between the transfer of the promised goods or services to the customer and payment by the customer exceeds one year. As a consequence, the Group does not adjust any of the transaction prices for the time value of money as this is considered to not have a material impact.
Government grants
Government grants are recognised under NZ IAS 20 when there is a reasonable assurance that the Group will comply with the conditions attached to the grant, and that the grant will be received.
Government grants related to costs are deferred and recognised in profit or loss over the period in which the Group incurs the costs for which the grant is intended to compensate.
Government grants relating to the purchase of property, plant and equipment are included in non-current liabilities as revenue in advance and they are credited to profit or loss on a straight-line basis over the expected lives of the related assets.
A government grant that becomes receivable as compensation for expenses or losses already incurred, or for the purpose of giving immediate financial support to the Group with no future related costs, is recognised in profit or loss in the period in which the grant becomes receivable.
Strategic funding
NIWA and the Crown are parties to a Strategic Science Investment Fund –Programmes Investment Contract (SSIF Contract) under which the Crown contracts NIWA to perform research activities that support NIWA’s Statement of Core Purpose (SCP). Specific SCP outcomes, and their associated delivery programmes, are agreed annually with Shareholding Ministers and documented in NIWA’s Statement of Corporate Intent.
For financial reporting purposes this Strategic Funding is treated as a Government Grant in terms of NZ IAS 20. Strategic Funding received and recognised during the year was $50.552 million exclusive of GST (2023: $50.552 million). All Strategic Funded projects were completed during the year.
Contract balances
Contract assets
A contract asset is the right to consideration in exchange for goods or services transferred to the customer, conditional on something other than the passage of time. If the Group performs under a contract by transferring goods or services to a customer before the customer pays consideration or before payment is due, a contract asset is recognised for the earned consideration that is conditional.
Contract assets are classified as ‘Uninvoiced receivables’ in the Statement of Financial Position.
Contract liabilities
A contract liability is the obligation to transfer goods or services to a customer for which the Group has received consideration (or an amount of consideration is due) from the customer. If a customer pays consideration before the Group transfers goods or services, a contract liability is recognised. Contract liabilities are recognised as revenue when the Group performs under the contract.
Contract liabilities are classified as ‘Revenue in advance’ in the Statement of Financial Position.
In thousands of New Zealand dollars 2024 2023 Revenue recognised that was included in the contract liability balance at the beginning of the year
Rendering of services 30,985 25,699
2. Operating expenses
Employee benefits
In thousands of New Zealand dollars
Defined
Defined
The 2024 termination benefits expense relates to business restructuring actions that are expected to result in the employment of 58 members of staff being terminated. Termination benefits were paid out before balance date in respect of five employees. The remaining provision relates to expected termination expenses from restructuring proposals that had been communicated to potentially affected employees prior to balance date. The provision is expected to be fully utilised within the next 12 months.
Other expenses
In thousands of New Zealand dollars
Remuneration of directors
Foreign
Movement
Change
Auditor’s remuneration
3. Employee entitlements
Liabilities for wages and salaries, including non-monetary benefits and annual leave, long service leave, retirement leave, and training leave are recognised when it is probable that settlement will be required, and they are capable of being measured reliably. Provisions, in respect of employee benefits, are measured using the remuneration rate expected to apply at settlement. Employee benefits are separated into current and non-current liabilities. Current liabilities are those benefits that are expected to be settled within 12 months from balance date.
Provisions made in respect of employee benefits which are not expected to be settled within 12 months are measured at the present value of the estimated future cash outflows to be made by the Group in respect of services provided by employees up to the reporting date.
The provisions for long service leave, retirement leave, and training leave are dependent upon several factors that are determined by the expected employment period of employees, current remuneration, and the timing of employees’ use of the benefits. Any changes in these assumptions will impact on the carrying amount of the liability. The employment period used to determine the appropriate long service leave liability is based upon historical average length of service. The training leave liability is based upon typical historical usage of the benefit.
Remuneration
4. Property, plant and equipment
Property, plant and equipment is stated at cost less accumulated depreciation to date, less any impairment losses.
Expenditure incurred on property, plant and equipment is capitalised where such expenditure will increase or enhance the future economic benefits provided by an asset’s existing service potential. Expenditure incurred to maintain future economic benefits is classified as repairs and maintenance.
The gain or loss arising on the disposal or retirement of an item of property, plant and equipment is determined as the difference between the sale proceeds and the carrying amount of the asset and is recognised in the statement of profit or loss and other comprehensive income.
Key estimates and assumptions
The useful lives of items of property, plant and equipment are key assumptions concerning the future that have a significant risk of resulting in a material adjustment to the carrying amounts of assets and liabilities within the next financial year.
Property, plant and equipment items, except for freehold land and work in progress, are depreciated on a straight-line basis at rates estimated to write off their cost over their estimated useful lives. Determining the appropriate useful life of property, plant and equipment requires management judgement over factors including the expected period during which an item is expected to be capable of service performance, the likelihood of technical obsolescence, future utilisation plans, and the effect of the regulatory environment.
The estimated useful lives of the Group’s property, plant and equipment assets are as follows:
The Group reviews the estimated useful lives of property, plant and equipment items, and assesses those assets for indicators of impairment, during each annual reporting period.
*The Work in Progress balance as at 30 June 2024 primarily comprises the cost of design work so far undertaken in respect of the proposed redevelopment of NIWA’s research centres in Christchurch and Wellington. It is anticipated that a business case for the approval of these developments will be prepared for the consideration of NIWA’s Board of Directors and shareholding Ministers during the 2025 financial year. The continued recognition of this previous expenditure as part of property, plant and equipment is based on the expectation that the proposed redevelopments will proceed and will be similar to the design work completed to date. Changes to the plans for redevelopments may result in write-off of any past expenditure that does not contribute to the eventual redevelopments.
5. Right-of-use asset and lease liability
The Group’s leases relate to buildings and land. These leases are recognised as a right-of-use asset and a corresponding liability. Each lease payment is allocated between the lease liability and finance cost. The finance cost is charged to profit or loss over the lease period so as to produce a constant periodic rate of interest on the remaining balance of the liability for each period. The right-of-use asset is depreciated over the shorter of the asset’s useful life and the lease term on a straight-line basis.
Assets and liabilities arising from a lease are initially measured on a present-value basis. Lease liabilities include the net present value of fixed payments.
The lease payments are discounted using the interest rate implicit in the lease. If that rate cannot be determined, the Group’s incremental borrowing rate is used, being the rate that the Group would have to pay to borrow the funds necessary to obtain an asset of similar value in a similar economic environment, with similar terms and conditions.
Right-of-use assets are measured at cost, comprising the amount of the initial measurement of lease liability. These assets are subsequently depreciated using the straight-line method from the commencement date to the end of the lease term.
Payments associated with short-term leases and leases of low-value assets are recognised on a straight-line basis as an expense in profit or loss. Shortterm leases are leases with a lease term of 12 months or less. Low-value assets comprise small storage spaces.
Reconciliation of right-of-use asset balance
In thousands of New Zealand dollars 2024 2023
Lease liabilities maturity analysis
Reconciliation of lease liabilities
In
(1,839)
6. Heritage assets
NIWA has one collection and three databases that have been defined as heritage assets. Heritage collection assets are those assets held for the duration of their physical lives because of their unique scientific importance, and heritage databases are maintained as an incidental part of existing business operations.
The nature of these heritage assets, and their significance to the science NIWA undertakes, makes it necessary to disclose them. In the directors’ view, the cost of these heritage assets cannot be assessed with any reliability, and accordingly these assets have not been recognised for financial reporting purposes.
NIWA has the following heritage assets:
Marine Benthic Biology Collection A national reference collection of marine invertebrates.
National Climate Database A national electronic database of highquality climate information, including temperatures, rainfall, wind, and other climate elements.
Water Resources Archive Database A national electronic database of river and lake locations throughout New Zealand, including levels, quality, and flows.
New Zealand Freshwater Fish Database A national electronic database of the occurrence of fish in the fresh waters of New Zealand, including major offshore islands.
7. Identifiable intangibles
Purchased identifiable intangible assets, comprising copyrights and software, are stated at cost less accumulated depreciation to date, less any impairment losses.
Internally generated identifiable intangible assets, which arise from development costs that meet the recognition criteria, are recognised as an asset in the statement of financial position. Capitalisation is limited to the amount which, taken together with any further related costs, is likely to be recovered from future economic benefits. Any excess is recognised as an expense.
All other development and research costs are expensed as incurred.
Subsequent to initial recognition, internally generated intangible assets are stated at cost less accumulated amortisation to date, less any impairment losses, on the same basis as purchased identifiable intangible assets.
Key estimates and assumptions
The useful lives of identifiable intangible assets are key assumptions concerning the future that have a significant risk of resulting in a material adjustment to the carrying amounts of assets and liabilities within the next financial year.
Identifiable intangible assets are amortised on a straight-line basis at rates estimated to write off their cost over their estimated useful lives.
Determining the appropriate useful life of identifiable intangible assets requires management judgement over factors including the expected period during which an item is expected to be capable of service performance, the likelihood of technical obsolescence, and future utilisation plans.
The estimated useful lives of the Group’s identifiable intangible assets are as follows: Category
amortisation and impairment losses
The Group reviews the estimated useful lives of identifiable intangible assets, and assesses those assets for indicators of impairment, during each annual reporting period.
8. Assets held for sale
Assets held for sale are stated at the lower of their carrying amount and fair value less costs to sell. No assets were reclassified as held for sale in 2024 (2023: Nil).
9. Receivables
Receivables are stated at amortised cost using the effective interest rate, less an allowance for expected losses.
A loss allowance provision is established when the assessment under NZ IFRS 9 deems a provision is required. Changes in the carrying amount of the provision are recognised in the statement of profit or loss and other comprehensive income. Debts which are known to be uncollectable are written off against the provision, once approved by the Board of Directors.
In thousands of New Zealand dollars 2024
Included in the Group’s trade receivables balance at the end of the year is one Crown debtor’s balance which equates to 24% of the Group’s total receivables balance (2023: 32%). 100% of that debtor’s balance is less than 60 days overdue and is deemed to be low credit risk (2023: 98%).
The Group considers that a large proportion of its customers have a low credit risk associated with them. Before providing any service or goods to a new customer on credit terms, a check is undertaken when deemed appropriate to verify the creditworthiness of the customer. The Group reserves the right to charge interest at a rate of 2% per month, calculated daily, on all invoices remaining unpaid at the due date.
Included in the Group’s trade receivable balance are debtors with a carrying amount of $392k (2023: $378k) which are more than 60 days past due at the reporting date. The Group has not created a provision for this balance because the amounts are still considered recoverable. The Group does not hold any collateral over past due or impaired balances.
The Group has applied the simplified approach to providing for expected credit losses, which requires the recognition of a lifetime expected loss provision for trade receivables. To measure the expected credit losses, trade receivables have been grouped based on days past due. The expected loss rates are based on the payment profiles of customers on a lifetime basis and the corresponding historical credit losses over a period of five years, adjusted for any significant known amounts that are not receivable. The total expected credit loss allowance provision has been determined as nil (2023: nil) for the Group.
In
Past due 31 – 60 days
Past due 61 – 90 days 0.0%
Past due >90 days 0.0% 329
10. Inventory
Inventory is stated at the lower of cost and net realisable value. The basis on which cost is calculated is first in first out (FIFO) for consumables, finished goods and work in progress; and weighted average for raw materials.
12. Deferred tax liability and assets
Deferred tax is accounted for using the balance sheet liability method in respect of temporary differences arising from the carrying amount of assets and liabilities in the financial statements and the corresponding tax base of those items. Deferred tax liabilities are generally recognised for all taxable temporary differences. Deferred tax assets are generally recognised for all deductible temporary differences to the extent that it is probable that sufficient taxable amount will be available against which those deductible temporary differences can be utilised.
Deferred tax assets and liabilities are measured at the tax rates that are expected to apply to the period when the asset and liability giving rise to them are realised or settled, based on the tax laws that have been enacted or substantively enacted at balance date.
Current and deferred tax is recognised in profit or loss, except when it relates to items recognised in other comprehensive income or directly in equity, in which case the deferred or current tax is also recognised in other comprehensive income or directly in equity, or where it arises from the initial accounting for a business combination.
In thousands of New Zealand dollars Opening balance as
11. Income tax
The income tax expense for the year is the tax payable on the current year’s taxable income, based on the income tax rate for each jurisdiction. This is then adjusted by changes in deferred tax assets and liabilities attributable to temporary differences between the tax bases of assets and liabilities and their carrying amounts in the financial statements, and changes in unused tax losses.
The income tax expense is determined as follows:
In thousands of New Zealand dollars 2024 2023
tax
Adjustments to taxation:
*During the year the Government announced, and subsequently enacted, legislation to remove the tax depreciation deduction on buildings with expected lives of 50 years or more. This change increased the Group’s deferred tax liability.
In accordance with the Income Tax Act 2007 the Group is not required to establish or maintain an imputation credit account by virtue of its
13a Cash and cash equivalents and other short-term investments
Cash and cash equivalents includes cash on hand, deposits held at call with financial institutions, and other short-term, highly liquid investments with original maturities of three months or less that are readily convertible to known amounts of cash and which are subject to an insignificant risk of changes in value.
Other short-term investments consist of deposits with financial institutions with maturities over three months which are presented as a separate line item in the statement of financial position.
13b Reconciliation of the profit for the year to net cash from operating activities
In thousands of New Zealand dollars 2024 2023
Profit for the year (5,787) 5,938
Add/(less) non-cash items
Net (gain)/loss on disposal of property, plant and equipment (994) (347)
Depreciation and impairment 18,814 18,514
Amortisation of identifiable intangibles 763 996
Net foreign currency (gain)/loss 20 (47)
Change in fair value of biological assets (1,895)
Increase/(decrease) in deferred tax 6,149 (319)
Add/(less) movements in working capital
Increase/(decrease) in payables and accruals and revenue in advance (14,226) (4,370)
Increase/(decrease) in employee entitlements 3,983 1,445
Decrease/(increase) in receivables and prepayments (7,550) 653
Decrease/(increase) in inventory and uninvoiced receivables 5,522 (5,585)
Increase/(decrease) in taxation payable and receivable (1,469) (401)
Increase/(decrease) in forward exchange derivatives 653 (80)
Net cash flows from operating activities 3,983 16,397
14. Biological Assets
Biological assets consist of pre-harvest fish stock in tanks associated with the Company’s experimental commercial-scale Recirculating Aquaculture System at its Northland Aquaculture Research Centre in Ruakākā. This stock is measured at fair value less estimated costs to sell, with any gain or loss resulting from the fair value measurement recognised in profit or loss.
The target live weight of the harvestable fish is 2.5kg. Once fish have reached this mass of 2.5kg, they are considered saleable and are transferred from the immature to mature biological assets accounts.
In thousands of New Zealand dollars Immature fish Mature fish Total
Opening balance as at 1 July 2023
Changes due to biological transformation and movement in fair value less estimated costs to sell
Decrease due to harvest – (529) (529) Closing balance as at 30 June
Determining fair value
The pre-harvest fish stock has been valued with reference to its stage of development, the length of the growth cycle, the number in the water, total biomass in the water, and the fair value per kg at the point of harvest. The fair value per kg at the point of harvest is determined with reference to market prices achieved during the six months preceding balance date. This method of valuation falls into Level 2 on the fair value hierarchy.
Non-financial measures
In thousands of New Zealand dollars Immature fish Mature fish Total Opening balance as at 1 July 2023 – – –
Change due to growth of biological assets 169 – 169
Reclassification from immature to mature (79)
15. Subsidiaries
The Group financial statements incorporate the financial statements of the Company and entities (including special purpose entities) controlled by the Company. Control is achieved where the Company has the power (including the ability to use the power) to govern the financial and operating policies of an entity so as to obtain benefits from its activities.
All intra-group transactions, balances, income, and expenses are eliminated in full on consolidation.
The subsidiaries of the Group and their activities are listed below:
All subsidiaries have a balance date of 30 June.
During the year, the Company purchased the 20% stake in Unidata Pty Ltd that it did not already own. No stake in any other subsidiary was acquired or disposed of.
16. Related party transactions
The Government of New Zealand (the Crown) is the ultimate shareholder of the NIWA Group. No transactions with other New Zealand Governmentowned entities are considered related party transactions in terms of NZ IAS 24. No related party debts have been written off or forgiven during the year. Any business the NIWA Group has transacted in which a director or an employee has an interest has been carried out on a commercial basis. Any potential conflict is recorded in the minutes of Board meetings for directors and a separate interest register for employees. The interests register containing all relevant interests is updated on a regular and timely basis.
Key management personnel compensation
In thousands of New Zealand dollars 2024 2023
The table above includes the remuneration of the Chief Executive, Executive Team and the Board of Directors.
17. Financial Instruments and Risk Management
The classification of financial assets and liabilities depends on the purpose for which the financial assets and liabilities were incurred. Management determines the classification of the Group’s financial assets and liabilities at initial recognition.
Financial assets
Classification
The Group classifies its financial assets in the following measurement categories: those to be measured at amortised costs, and those to be measured subsequently at fair value (either through other comprehensive income, or through profit or loss). The classification depends on the Group’s business model for managing the financial assets and the contractual terms of the cash flow.
For assets measured at fair value, gains and losses will be recorded in either profit or loss, or other comprehensive income. For investments in debt instruments, this will depend on the business model in which the investment is held. For investments in equity instruments, this will depend on whether the Group has made an irrevocable election at the time of initial recognition to account for the equity investment at fair value through other comprehensive income.
The Group reclassifies debt investments when, and only when, its business model for managing those assets changes.
Measurement
At initial recognition, the Group measures a financial asset at its fair value plus, in the case of a financial asset not at fair value through profit or loss (FVPL), transaction costs that are directly attributable to the acquisition of the financial asset. Transaction costs of financial assets carried at FVPL are expensed in profit or loss.
Financial assets and liabilities at fair value through profit or loss – Derivative financial instruments
This category has two sub-categories: financial assets held for trading, and those designated at fair value through profit or loss at inception. A financial asset is classified in this category if acquired principally for the purpose of selling in the short term, or if so designated by management.
Derivatives are also categorised as held for trading, unless they are designated as hedges. Assets in this category are classified as current assets if they are either held for trading or are expected to be realised within 12 months of the balance sheet date. After initial recognition, they are measured at their fair values. Gains or losses on re-measurement are recognised in the statement of profit or loss and other comprehensive income.
Financial Assets at Amortised Cost
The Group classifies its financial assets at amortised cost only if both of the following criteria are met:
- The asset is held to collect the contractual cash flows, and - The contractual terms give rise to cash flows that are solely payments of principal and interest.
Impairment of financial assets
The Group assesses, on a forward-looking basis, the expected credit losses associated with its assets carried at amortised cost and fair value through other comprehensive income. The impairment methodology applied depends on whether there has been a significant increase in credit risk. Note 9 details how the Group determines whether there has been a significant increase in credit risk.
For trade receivables only, the Group applies the simplified approach permitted by NZ IFRS 9, which requires expected lifetime losses to be recognised from initial recognition of the receivables.
Capital management
The Group has the following requirements imposed upon it under the Crown Research Institutes Act 1992:
- to operate in a financially responsible manner so that sufficient operating funds are generated to maintain financial viability;
- to provide an adequate rate of return on shareholders’ funds; and
- to operate as a going concern.
The Group’s policy is to maintain a strong capital base to maintain shareholder and creditor confidence and to sustain future development of the business.
The Group’s policies in respect of capital management and allocation are reviewed regularly by the Board of Directors.
The overdraft and flexible credit facilities available from ANZ Bank (refer note 17 subsection financing facilities) are not subject to financial covenants.
Capital refers to the equity and borrowings of the Group.
There have been no material changes in the Group’s management of capital during the year.
Fair value of financial instruments
The carrying value of all financial instruments is considered to approximate fair value.
All the Group’s financial instruments are classified as being within level 1 of the fair value hierarchy as defined by NZ IFRS 13 Fair Value Measurement (2023: the same). Their fair value is determined with reference to quoted rates for identical instruments on active markets.
Credit risk
Credit risk is the risk that a third party will default on its obligations to NIWA and the Group, causing a loss.
In the normal course of business, the Group incurs credit risk from trade receivables, uninvoiced receivables, and transactions with financial institutions (cash and short-term deposits and derivatives).
The Group has a credit policy that is used to manage this risk. As part of this policy, limits are placed on the amounts of credit extended to third parties, and care is taken to ensure the creditworthiness of third parties dealt with. All credit risk exposures are monitored regularly.
The Group does not require any collateral or security to support financial instruments, because of the quality of financial institutions and counterparties it deals with. There are no significant concentrations of credit risk, other than with the New Zealand Government, which the Group does not consider represents a material credit risk.
The exposure to the Group to credit risk as at 30 June 2024 was $40,543k (total exposure to credit risk, comprising cash and cash equivalents $6,448k, uninvoiced receivables $9,629k, and receivables net of provisions $24,465k) (2023: $35,386).
Further analysis on the receivables balance can be found in note 9.
The Group has not renegotiated the terms of any financial assets which would result in the carrying amount no longer being past due or avoid a possible past due status.
The Group’s maximum exposure to credit risk by geographic region is as follows:
In thousands of New Zealand dollars
Interest rate risk
Interest rate risk is the risk that cashflows will fluctuate because of changes in market interest rates. This could affect the return on investments as well as the cost of debt.
The interest rates on the Group’s investments and debt facilities are as follows:
In thousands of New Zealand dollars
The directors do not consider there is any significant exposure to interest rate risk.
Currency risk
The Group undertakes transactions in foreign currencies from time to time, and, resulting from these activities, exposures in foreign currency arise. It is the Group’s policy to hedge foreign currency trading transaction risks economically as they arise. To manage these exposures, the Group may use financial instruments such as forward foreign exchange contracts.
The Group’s exposure to foreign currency-denominated non-derivative financial instruments was as follows, based on notional amounts:
NIWA has a regularly reviewed treasury management policy in place which ensures the appropriate management of currency risk.
Liquidity risks
Liquidity risk represents the Group’s ability to meet its contractual obligations. The Group evaluates its liquidity requirements on an ongoing basis. In general, the Group generates sufficient cash flows from its operating activities to meet its obligations arising from its financial liabilities and has credit lines in place to cover potential shortfalls.
Payables and accruals of $9.94 million (2023: $10.13 million) have a contractual maturity of less than one year. This is based upon the earliest date on which the Group can be required to pay.
Financing facilities
The Group has access to financing facilities made available by ANZ Bank with a total value of $50.5 million (2023: $20.5 million). This was drawn down by $36 million at 30 June 2024 (2023: undrawn). The total facility of $50.5 million relates to an overdraft facility of $0.5 million (on-call) and a flexible credit facility of $50 million. In addition, the Group has access to financial and performance guarantee facilities with limits of $0.2 million and $0.6m respectively.
The facility is unsecured and there are no financial covenants.
At 30 June 2024, the facility was presented as a current liability as the termination date was 30 May 2025. On 5 August 2024 this termination date was extended to 31 August 2025. The Group is assessing its medium term funding requirements and is planning to seek a multi-year facility prior to the new termination date.
18. Capital commitments
In thousands of New Zealand dollars 2024 2023 Commitments for future capital expenditure
Contracted, but not provided for 502 22,204
The majority of the 2023 balance related to contracts that had been awarded for the construction of the RV Kaharoa II
19. Subsequent events
As described in note 17, on 5 August 2024 the Group extended the termination date of its financing facilities to 31 August 2025. No further material events have occurred subsequent to 30 June 2024 that require adjustment or disclosure in the financial statement
PREPARATION DISCLOSURES
Reporting entity
National Institute of Water and Atmospheric Research Limited (‘NIWA’ or ‘the Company’) and its subsidiaries form the consolidated Group (‘the NIWA Group’ or ‘the Group’). NIWA is a profit-oriented company registered in New Zealand under the Companies Act 1993. The financial statements for the NIWA Group are presented in accordance with the requirements of the Crown Research Institutes Act 1992, the Crown Entities Act 2004, the Public Finance Act 1989, the Companies Act 1993, and the Financial Reporting Act 2013.
Nature of activities
The NIWA Group conducts research and commercial science in water and atmospheric sciences in New Zealand and internationally.
Basis of preparation
The measurement basis adopted in the preparation of these financial statements is historical cost, except for biological assets and financial instruments as identified in specific accounting policies above.
The presentation currency of the Group and functional currency used in the preparation of these financial statements is New Zealand dollars.
All amounts disclosed in the financial statements and notes have been rounded to the nearest thousand New Zealand dollars unless otherwise stated.
Accounting policies are selected and applied in a manner that ensures that the resulting financial information meets the concepts of relevance and reliability, ensuring that the substance of the underlying transaction or event is reported. The accounting policies have been applied in preparing the financial statements for the year ended 30 June 2024 and the comparative information for the year ended 30 June 2023.
The 2024 Statement of Corporate Intent (SCI) Budget that is used for comparative information is not audited.
Statement of compliance
The financial statements have been prepared in accordance with New Zealand generally accepted accounting practice (NZ GAAP). They comply with New Zealand Equivalents to International Financial Reporting Standards (NZ IFRS) and other applicable financial reporting standards appropriate for profit-oriented entities.
The financial statements comply with International Financial Reporting Standards Accounting Standards (IFRS Accounting Standards).
Goods and services tax (GST)
The financial statements are prepared on a GST-exclusive basis, except for receivables and payables, which are stated GST-inclusive.
Foreign
currencies
Transactions
Transactions in foreign currencies are converted to the functional currency of the Group, being New Zealand dollars, by applying the spot exchange rate between the functional currency and the foreign currency at the date of the transaction. At the end of each year, monetary assets and liabilities are translated to New Zealand dollars using the closing rate of exchange at balance date, and any exchange gains or losses are recognised in the statement of profit or loss and other comprehensive income.
Translation of foreign operations
On consolidation, revenues and expenses of foreign operations are translated to New Zealand dollars at the average exchange rates for the year. Assets and liabilities are converted to New Zealand dollars at the rates of exchange ruling at balance date. Exchange rate differences arising from the translation of the foreign operations are recognised in other comprehensive income and accumulated as a separate component of equity in the Group’s foreign currency translation reserve. Such exchange differences are reclassified from equity to profit or loss (as a reclassification adjustment) when the foreign operation is disposed of.
Adoption of new and revised standards
There are no standards that are not yet effective and that would be expected to have a material impact on the Group.
AUDITOR’S REPORT
Independent Auditor’s Report
To the readers of National Institute of Water and Atmospheric Research Limited’s Group Financial Statements for the year ended 30 June 2024.
The Auditor-General is the auditor of National Institute of Water and Atmospheric Research Limited Group (the Group). The Auditor-General has appointed me, Troy Florence, using the staff and resources of PricewaterhouseCoopers, to carry out the audit of the financial statements of the Group on his behalf.
Opinion
We have audited the financial statements of the Group on pages 2 to 20 that comprise the statement of financial position as at 30 June 2024, the statement of profit or loss and other comprehensive income, statement of changes in equity and statement of cash flows for the year ended on that date and the notes to the financial statements that include material accounting policies and other explanatory information.
In our opinion, the financial statements of the Group:
• present fairly, in all material respects:
‒ its financial position as at 30 June 2024; and
‒ its financial performance and cash flows for the year then ended; and
• comply with generally accepted accounting practice in New Zealand in accordance with New Zealand Equivalents to International Financial Reporting Standards (NZ IFRS) and International Financial Reporting Standards Accounting Standards (IFRS Accounting Standards).
Our audit was completed on 4 September 2024. This is the date at which our opinion is expressed.
The basis for our opinion is explained below. In addition, we outline the responsibilities of the Board of Directors and our responsibilities relating to the financial statements, we comment on other information, and we explain our independence.
Basis for our opinion
We carried out our audit in accordance with the Auditor-General’s Auditing Standards, which incorporate the Professional and Ethical Standards and the International Standards on Auditing (New Zealand) issued by the New Zealand Auditing and Assurance Standards Board. Our responsibilities under those standards are further described in the Responsibilities of the auditor section of our report.
We have fulfilled our responsibilities in accordance with the Auditor-General’s Auditing Standards.
We believe that the audit evidence we have obtained is sufficient and appropriate to provide a basis for our audit opinion.
Responsibilities of the Board of Directors for the financial statements
The Board of Directors is responsible on behalf of the Group for preparing financial statements that are fairly presented and that comply with generally accepted accounting practice in New Zealand.
The Board of Directors is responsible for such internal control as it determines is necessary to enable it to prepare financial statements that are free from material misstatement, whether due to fraud or error.
In preparing the financial statements, the Board of Directors is responsible on behalf of the Group for assessing the Group’s ability to continue as a going concern. The Board of Directors is also responsible for disclosing, as applicable, matters related to going concern and using the going concern basis of accounting, unless the Board of Directors has to cease operations, or has no realistic alternative but to do so.
The Board of Directors’ responsibilities arise from the Crown Research Institutes Act 1992.
Responsibilities of the auditor for the audit of the financial statements
Our objectives are to obtain reasonable assurance about whether the financial statements, as a whole, are free from material misstatement, whether due to fraud or error, and to issue an auditor’s report that includes our opinion.
Reasonable assurance is a high level of assurance, but it is not a guarantee that an audit carried out in accordance with the Auditor-General’s Auditing Standards will always detect a material misstatement when it exists. Misstatements are differences or omissions of amounts or disclosures and can arise from fraud or error.
Misstatements are considered material if, individually or in the aggregate, they could reasonably be expected to influence the decisions of readers taken on the basis of these financial statements.
For the budget information reported in the financial statements, our procedures were limited to checking that the information agreed to the Group’s statement of corporate intent.
We did not evaluate the security and controls over the electronic publication of the financial statements.
As part of an audit in accordance with the Auditor-General’s Auditing Standards, we exercise professional judgement and maintain professional scepticism throughout the audit. Also:
● We identify and assess the risks of material misstatement of the financial statements, whether due to fraud or error, design and perform audit procedures responsive to those risks, and obtain audit evidence that is sufficient and appropriate to provide a basis for our opinion. The risk of not detecting a material misstatement resulting from fraud is higher than for one resulting from error, as fraud may involve collusion, forgery, intentional omissions, misrepresentations, or the override of internal control.
● We obtain an understanding of internal control relevant to the audit in order to design audit procedures that are appropriate in the circumstances but not for the purpose of expressing an opinion on the effectiveness of the Group’s internal control.
● We evaluate the appropriateness of accounting policies used and the reasonableness of accounting estimates and related disclosures made by the Board of Directors.
● We conclude on the appropriateness of the use of the going concern basis of accounting by the Board of Directors and, based on the audit evidence obtained, whether a material uncertainty exists related to events or conditions that may cast significant doubt on the Group’s ability to continue as a going concern. If we conclude that a material uncertainty exists, we are required to draw attention in our auditor’s report to the related disclosures in the financial statements or, if such disclosures are inadequate, to modify our opinion. Our conclusions are based on the audit evidence obtained up to the date of our auditor’s report. However, future events or conditions may cause the Group to cease to continue as a going concern.
● We evaluate the overall presentation, structure and content of the financial statements, including the disclosures and whether the financial statements represent the underlying transactions and events in a manner that achieves fair presentation.
● We obtain sufficient appropriate audit evidence regarding the financial statements of the entities or business activities within the Group to express an opinion on the consolidated financial statements. We are responsible for the direction, supervision and performance of the Group audit. We remain solely responsible for our audit opinion.
We communicate with the Board of Directors regarding, among other matters, the planned scope and timing of the audit and significant audit findings, including any significant deficiencies in internal control that we identify during our audit.
Our responsibilities arise from the Public Audit Act 2001.
Other Information
The Board of Directors is responsible for the other information. The other information obtained at the date of our report is the Financial Summary and Group actual performance versus Statement of Corporate Intent on page 1, and the Corporate governance and disclosures, Statement of responsibility and Directory on pages 21 to 25, but does not include the financial statements, and our auditor’s report thereon.
Our opinion on the financial statements does not cover the other information and we do not express any form of audit opinion or assurance conclusion thereon.
In connection with our audit of the financial statements, our responsibility is to read the other information. In doing so, we consider whether the other information is materially inconsistent with the financial statements or our knowledge obtained in the audit, or otherwise appears to be materially misstated. If, based on our work we have performed on the other information that we obtained prior to the date of this auditor's report, we conclude that there is a material misstatement of this other information, we are required to report that fact. We have nothing to report in this regard.
Independence
We are independent of the Group in accordance with the independence requirements of the Auditor-General’s Auditing Standards, which incorporate the independence requirements of Professional and Ethical Standard 1: International Code of Ethics for Assurance Practitioners
(including International Independence Standards) (New Zealand) (PES 1) issued by the New Zealand Auditing and Assurance Standards Board.
In addition to the audit we carried out an engagement in the area of agreed-upon procedures regarding payments received in accordance with a research agreement, which is compatible with those independence requirements. Other than the audit and this engagement, we have no relationship with or interests in the Group.
Troy Florence – PricewaterhouseCoopers
On behalf of the Auditor-General Auckland, New Zealand
4 September 2024
CORPORATE GOVERNANCE AND DISCLOSURES
Board and committee meeting attendance
The table below shows director attendance at these Board meetings and committee member attendance at committee meetings. In addition, any director may attend any committee meeting.
1. Audit, Legislative Compliance, and Risk Committee
2. Only attendances by Committee members and the Board Chairman (who attends in an ex officio capacity) are recorded.
Directors’ remuneration
The total remuneration received or receivable by directors of NIWA during the year was:
Barry
Janice
Subsidiary company directors
The following people held office as directors of NIWA’s subsidiary companies at 30 June 2024:
Subsidiary Company Directors
NIWA Vessel Management Ltd B Harris, N Main, T Batten, J Fredric, M Hyland, M-A Macleod, D Moana, L Esterhazy
Unidata Pty Ltd W Johnston1, P Baker1, M Saunders2
NIWA Aquaculture Solutions Ltd J Morgan1, P Baker1
1 Employee of the Group’s parent company
2. Employee of Unidata Pty Ltd
No fees were paid in respect of membership of subsidiary boards.
Insurance for directors and employees
The NIWA Group has insured its directors and employees against any costs or liabilities of the type referred to in s162(5) of the Companies Act 1993.
Auditors
In accordance with Section 21(1) of the Crown Research Institutes Act 1992, the Group’s auditor is the Auditor-General. The Auditor-General has appointed Troy Florence of PricewaterhouseCoopers to conduct the audit on his behalf. The audit remuneration and fees paid for other services are detailed in note 2.
Interests register
The following are transaction types recorded in the interests register for the year.
Interested transactions
Any business the NIWA Group has transacted in which a director has an interest has been carried out on a commercial basis. Any potential conflict is recorded in the minutes of Board meetings. A register containing all relevant interests is updated on a monthly basis.
Directors’ remuneration
Details of the directors’ remuneration are provided in the ‘Directors’ remuneration’ section above.
Use of company information by directors
Pursuant to section 145 of the Companies Act 1993 there were no recorded notices from directors requesting to use company information received in their capacity as directors that would not otherwise have been available to them.
Share dealings
During the year no director purchased, disposed of, or had recorded dealings of any equity securities of the NIWA Group.
Directors’ loans
No loans by the NIWA Group to any director were made or were outstanding during the year.
Disclosure of directors’ interests
No specific disclosures were made by directors pursuant to s140(1) of the Companies Act 1993. General disclosures of interest made by directors during the year pursuant to section 140(2) are as follows:
Director and Entity Position
Barry Harris
McFall Fuel Ltd
Rural Fuels Ltd
OSPRI New Zealand Limited
TB Free Ltd
National Animal Identification and Tracing (NAIT) Ltd
New Zealand Food Innovation (Waikato) Ltd
Chair
Chair
Chair (until February 2024)
Chair (until February 2024)
Chair (until February 2024)
Chair
Waikato Regional Airport Ltd Chair
WEL Networks Ltd Chair
Melody Dairies
Director (until October 2023)
Titanium Park Ltd Chair (appointed July 2023)
New Power Ltd
Tracey Batten
Chair (appointed April 2024)
EBOS Group Ltd Director
Medibank Private Limited (Australia) Director
Accident Compensation Corporation Chair
Nanosonics Limited (ASX listed)
Mary-Anne Macleod
Director (appointed 26 September 2023)
University of Waikato Council Member
AgResearch Director
Araneacattus Family Trust Trustee
MacMacleod Limited Director/Shareholder
DairyNZ Limited Director
Environmental Protection Authority Director
Ministry for the Environment Strategic Advice
Various Regional Councils Occasional Consultancy
Fire and Emergency New Zealand Director
Wellington Science City Programme Oversight Group Member (until December 2023)
Janice Fredric
Mainpower Ltd Director
Lincoln University Council Member
Civil Aviation Authority Chair
Aviation Security Service Chair
NZ Shipwreck Welfare Trust Trustee
Tregynon Charitable Trust Trustee
Timaru District Council – Audit & Risk Committee Independent Member
Aurora Energy Director
NZ Growth Capital Partners Ltd Director
Aspire NZ Seed Fund Ltd Director
Elevate NZ Venture Fund GP Ltd Director
Dean Moana
Whangaokena ki Onepoto Takutai Trust Trustee
NZ Food & Beverage Group Ltd Director & Shareholder
Nga Hapu o Nga Rohe o Ngati Porou Takutai Trusts Trustee Chair
Te Runanganui o Ngati Porou
Director & Shareholder (until November 2023)
The New Zealand Institute for Plant & Food Research Ltd Director
Nati Growth Ltd, Nati Properties Ltd Deputy Chair
Tohetaka Ltd Director/Chair (until November 2023)
Iwi Collective Partnership (ICP) Director
Ngati Porou Manuka Ltd Director (until November 2023)
Ngati Porou Seafoods Ltd, NP Fisheries Ltd, Real Fresh Ltd Director
ICP General Partner Ltd, Port Nicholson GP Ltd, Koura Inc GP Ltd Director
Ahi Mokopuna GP Ltd Director
Akaroa Salmon NZ Ltd Director
AsureQuality Ltd Director
BV-AQ (Singapore) Holdings Pte Ltd Director
Te Ohu Kai Moana Trustee Ltd Director (appointed 30 November 2023)
Aotearoa Fisheries Ltd Director (appointed 1 December 2023)
BV-AQ Aust Pty Ltd Director (appointed 21 June 2024)
Margaret Hyland
Scion Science Advisory Board Advisor
Cirrus Materials Science Director
Te Herenga Waka-University of
Wellington Vice-Provost (Research)
Research Trust of Victoria
University of Wellington Chair
Wellington UniVentures Deputy Chair
Karori Sanctuary Trust (trading as Zealandia Te Māra a Tāne) Trustee
Livia Esterhazy GNS Science Director
HortNZ – A Lighter Touch Programme Director
The Thrive Collective Director
Nelson City Council Husband, Nigel Philpott, is CEO
Employees’ remuneration
The number of employees (not including directors) whose remuneration exceeded $100,000 during the year, stated in brackets of $10,000, was:
The remuneration reflected in the above table comprises base salary only. This excludes payments in respect of superannuation or in respect of the cessation of employment of employees.
In 2024, the Group made payments of $178k for compensation or other benefits in respect of the cessation of employment of employees (2023: $179k).
Executive Remuneration
Remuneration Components
The Group’s Executive Team (ET), including the Chief Executive, receive fixed remuneration only. This consists of base salary and benefits, including KiwiSaver and insurance.
Chief Executive’s remuneration
The Chief Executive’s remuneration package that applied for 2024, together with the comparative information for the prior year, is as follows:
In
*Benefits include KiwiSaver, insurance, vehicle fuel expenses and, in 2024, cashout of annual leave entitlement.
The Chief Executive is a member of KiwiSaver. As a member of this scheme, all Group staff, including the Chief Executive, are eligible to contribute and receive a matching company contribution up to a maximum of 5% of gross taxable earnings. In 2024, the Group’s contribution was $37,304 (2023: $35,194).
A summary of the Chief Executive’s total remuneration during the past five years is as follows:
In thousands of New Zealand dollars
Executive Team remuneration
In addition to the Chief Executive, NIWA’s Executive Team consists of eight members. The remuneration package for all Executive Team members combined (excluding the Chief Executive) that applied for 2024, together with the comparative information for the prior year, is as follows:
In thousands of New Zealand dollars
*Benefits include employer contributions to superannuation schemes (KiwiSaver or legacy government superannuation schemes, as applicable), insurance and wellness allowances.
Donations
No donations were made during the year (2023: $2,000).
STATEMENT OF RESPONSIBILITY
The following statement is made in accordance with section 155 of the Crown Entities Act 2004.
1. The Board of the Company is responsible for the preparation of these financial statements and the judgements used therein.
2. The Board of the Company is responsible for establishing and maintaining a system of internal controls designed to provide reasonable assurance as to the integrity and reliability of financial reporting.
3. In the opinion of the Board, these financial statements reflect a true and fair view of the financial position and operations of the Group for the year ended 30 June 2024.
Barry Harris
Janice Fredric Chair Deputy Chair
30 August 2024
DIRECTORY
DIRECTORS
Barry Harris, Chair
Janice Fredric, Deputy Chair
Dr Tracey Batten (until 30 June 2024)
Prof Margaret Hyland
Mary-Anne Macleod
Dean Moana
Livia Esterhazy
EXECUTIVE TEAM
John Morgan, Chief Executive
Dr Rob Murdoch, Deputy Chief Executive
Geoff Baird, General Manager, Communications & Marketing
Patrick Baker, Chief Financial Officer
Dr Mary-Anne Dehar, General Manager, People & Capability
Warrick Johnston, General Manager, Technology & Innovation
Dr Helen Neil, General Manager, Operations
Marino Tahi, General Manager, Māori & Pacific Partnerships
Dr Alex Thompson, General Manager, Science
REGISTERED OFFICE AND ADDRESS FOR SERVICE
82 Wyndham Street
Auckland Central 1010
New Zealand
Private Bag 99940
Newmarket, Auckland 1149
New Zealand
Tel +64 9 375 2050
Fax +64 9 375 2051
AUDITOR
Troy Florence with the assistance of PricewaterhouseCoopers on behalf of the Auditor-General
BANKERS
ANZ Bank New Zealand Ltd
SOLICITORS
Meredith Connell
INSURANCE BROKER
Marsh Ltd
WEBSITE AND SOCIAL MEDIA www.niwa.co.nz weather.niwa.co.nz facebook.com/nzniwa x.com/niwa_nz x.com/niwaweather instagram.com/niwa_science linkedin.com/company/niwa youtube.com/nzniwa