Q2 2023 Market Report
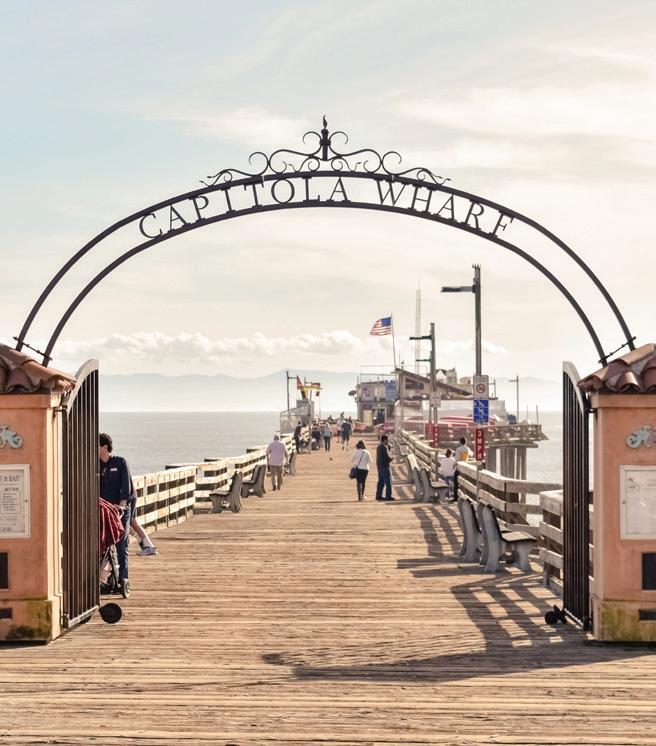
Aptos

• Capitola • Santa Cruz • Scotts Valley • Soquel
Aptos
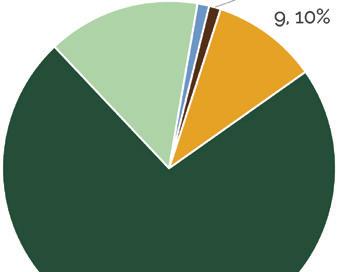
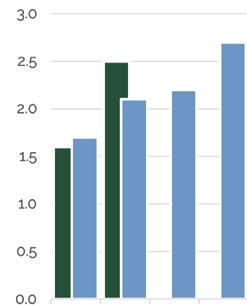
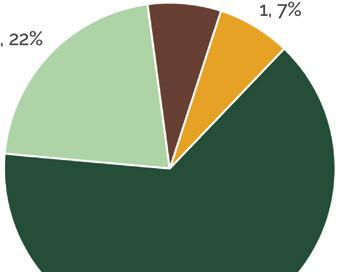
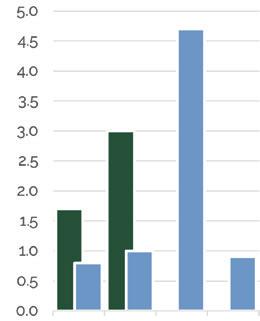
Aptos has continued to see a restricted number of sales due to limited inventory, which is a continuous theme you will notice throughout the markets. While activity has increased from Q1, most numbers have fallen dramatically from Q2 2022 when the market shi ed. Lower average sale price numbers are due to a lack of sales in the higher price ranges, with 73% of the market now selling in the $1-2M range, and only 2 sales above $3M. DOM remain relatively low due to limited inventory and a composition of sales in the lower price range. MOI remained tight at 2.2 months but has increased slightly from Q1 and year over year.

AVERAGE SELLING PRICE
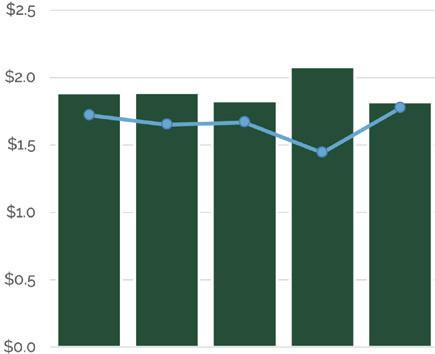
$1,643,310
1.8% 19.9% versus Q1 2023 versus Q2 2022
DAYS ON MARKET
25
50% 56.3% versus Q1 2023 versus Q2 2022
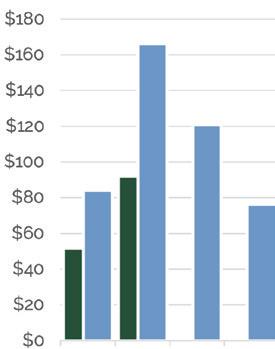
SALES VOLUME
$92,025,371
78.2% 44.6% versus Q1 2023 versus Q2 2022
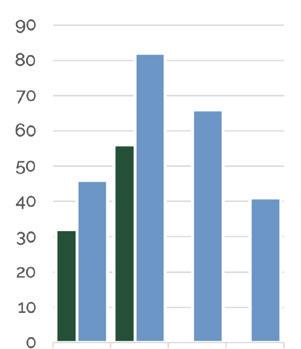
UNITS SOLD
56 75% 31.7% versus Q1 2023 versus Q2 2022


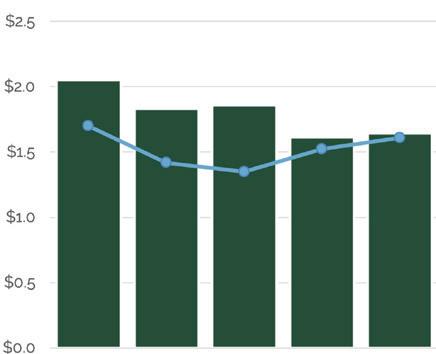
Capitola has remained relatively steady year over year in the face of the pullback, with sales and average price only dropping slightly compared to other markets. A larger move was seen in the average price from Q1, due to a few larger sales boosting rst quarter numbers. With MOI rising to 3 months at the end of the quarter, we have seen DOM remain higher than usual at 37 days.
AVERAGE SELLING PRICE
$1,820,188
12.4% 3.5% versus Q1 2023 versus Q2 2022
DAYS ON MARKET
37
38.3% 5.1% versus Q1 2023 versus Q2 2022
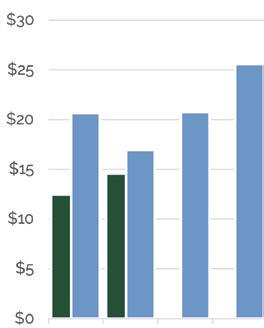
SALES VOLUME
$14,561,500
16.8% 14.2% versus Q1 2023 versus Q2 2022
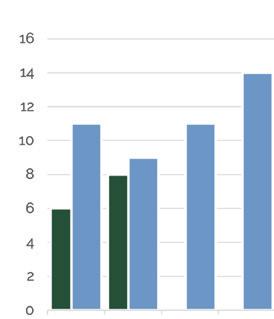
UNITS SOLD
8
33% 11% versus Q1 2023 versus Q2 2022

We have seen many of the same moves in the Santa Cruz market, with limited inventory continuing to a ect the market. Units sold are down 36% year over year to just 89 sales for what is normally the best quarter for the largest market in the county. In contrast to some of the other markets, the average sale price rebounded due to a sales composition weighted heavily on the higher end. A major drop from Q1 in DOM to 26 days shows the limited inventory continues to keep competition relatively high. is has kept MOI low at 2.6 months, though it continues to build slowly.

AVERAGE SELLING PRICE
$1,845,430 23.5% 3.9% versus Q1 2023 versus Q2 2022
DAYS ON MARKET
26
39.5% 100% versus Q1 2023 versus Q2 2022
SALES VOLUME
$164,243,250
71.8% 33.9% versus Q1 2023 versus Q2 2022
UNITS SOLD
89
39.1% 36.4% versus Q1 2023 versus Q2 2022


e spring selling season picked up the Sco s Valley market, showing positive improvement in all categories from Q1, but is still lagging year over year numbers. Limited inventory continues to hamper the market like many others.
e average sale price, while up from Q1, is down 10% year over year due to a lack of normal sales in the $2-3M range. DOM dropped to 20 days for the quarter showing the expected increase in activity during spring. is was also one of the few markets where MOI dropped due to increased activity, and now sits at just 1.6 months
AVERAGE SELLING PRICE
$1,470,788
10.43% 10.64% versus Q1 2023 versus Q2 2022
DAYS ON MARKET
20
63% 43% versus Q1 2023 versus Q2 2022
SALES VOLUME
$41,181,788
93% 40% versus Q1 2023 versus Q2 2022
UNITS SOLD
28
75% 33% versus Q1 2023 versus Q2 2022


Despite lower average sale prices in Q1 and Q2, Soquel had a very active quarter. e median sale price was higher than the average this quarter due to the composition of sales. is discrepancy, as seen in other markets, is again shown in a lack of sales at the higher price ranges above $2M. e number of units sold doubled that of Q1 to 16 and was just one sale shy of the high since the beginning of 2022. is increased activity caused DOM to drop to 11 days for the quarter and reduced the market to just 2.2 MOI.
AVERAGE SELLING PRICE
$1,383,125
2.3% 13.2% versus Q1 2023 versus Q2 2022
DAYS ON MARKET
11
78% 22% versus Q1 2023 versus Q2 2022
SALES VOLUME
$22,130,000
105% 26% versus Q1 2023 versus Q2 2022
UNITS SOLD
16
100% 45% versus Q1 2023 versus Q2 2022


Monterey Coast Realty represents buyers and sellers of quality properties, from cozy co ages to magni cent mansions throughout the Monterey Peninsula, all the way east to Salinas Valley, through Carmel Valley and south to Big Sur. We are comprised of a handpicked team of Realtors known for their professionalism, ethics and business success. We work together to o er the highest quality of personalized service to our clients.
Monterey Coast Realty is a sister brand of Carmel Realty Company, a 100-yearold real estate rm with a rich history as a family-owned business and a reputation for service, integrity and excellence. e collaborative culture of our professional colleagues contributes to a team approach with our properties and servicing clients. Combined, the rms have an exceptionally knowledgeable network of professionals who work together to o er the highest quality service to our clients. In addition, our unrivaled concierge-style client services team, rst-class marketing and a robust company infrastructure with leading technology resources further reinforce our premier position in the area. We take pride in being actively engaged in the community and conduct both our real estate and volunteer activities with integrity. Together, the rms have accomplished an impressive record of sales and clientele loyalty.