
Maria Finkle 831.277.6728 Maria@MariaFinkle.com Broker Associate | DRE#01981092 Q2 2023 Market Report Carmel-by-the-Sea & Carmel Point • Greater Carmel • Carmel Valley • Pebble Beach • Carmel Highlands, Big Sur & South Coast • Monterey & Del Rey Oaks • Pacific Grove • Seaside • Marina & East Garrison


 09 Pebble Beach
03 Carmel-by-the-Sea & Carmel Point
15 Monterey & Del Rey Oaks
11 Carmel Highlands, Big Sur & South Coast
05 Greater Carmel
17 Seaside
13 Paci c Grove
07 Carmel Valley
09 Pebble Beach
03 Carmel-by-the-Sea & Carmel Point
15 Monterey & Del Rey Oaks
11 Carmel Highlands, Big Sur & South Coast
05 Greater Carmel
17 Seaside
13 Paci c Grove
07 Carmel Valley
Get in-depth market updates for key areas across the Monterey Peninsula.
19 Marina & East Garrison
02
Q2 2023 Market Report

Market Reports Q2 2023 01 Market Overview 03 Carmel-by-the-Sea & Carmel Point 05 Greater Carmel 07 Carmel Valley 09 Pebble Beach 11 Carmel Highlands, Big Sur & South Coast 13 Pacific Grove 15 Monterey & Del Rey Oaks 17 Seaside 19 Marina & East Garrison
Significant Sales in Q2 2023


MONTEREY COAST REALTY’S
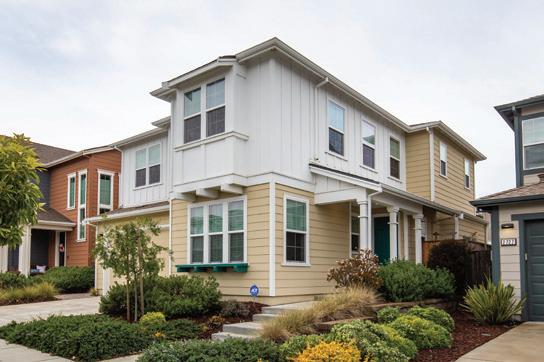
Charming Co age in Carmel Park-like Se ing in Seaside Highlands 0
1st St. •
•
Buyer
•
•
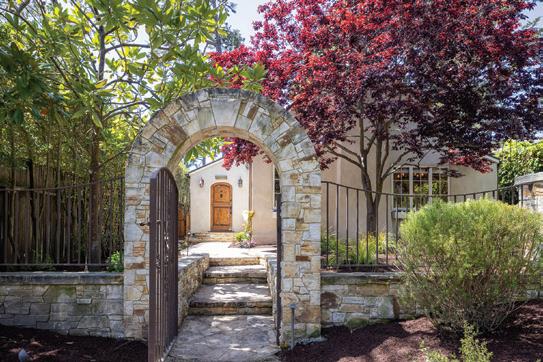
Mission 2NW of
$2,675,000
Represented
4488 Sea Cliff Court
$1,345,000
Represented Seller
Sea
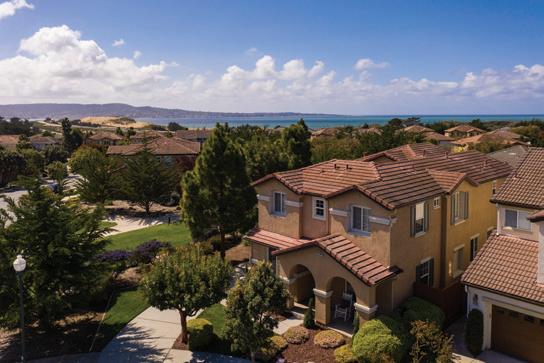
Marina Prime
e
Picturesque
Haven Community in
Loca on in
Dunes, Marina
•
•
•
to Asilomar State Beach
Grove Single-level Living in East Garrison
•
•
14526
•
•
01 Market Reports Q2 2023
3012 Arido Way
• $1,264,000
Represented Buyer 2725 Parkview Way
$1,235,000
Represented Seller Blocks
in Paci c
242 Grove Acre Avenue
$1,198,000
Rep. Buyer & Seller
Lee Avenue
$1,145,000
Represented Seller
Q2 2023 Market Overview
The Monterey Peninsula experienced a strong rebound in the second quarter of 2023 after almost nine months of slow activity. Beginning in Q4 of last year, transaction and dollar volumes in most markets across the Peninsula were down over 50% year over year. However, in this second quarter of 2023 we saw the amount of sales increase by 25.7% and the total sales volume was up 29.3% in comparison to the first quarter of this year. While volume levels are still down year over year, we are beginning to experience a much healthier market. This market is beginning to perform like it did in 2019 prior to the Covid initiated spikes. The fear over the banking crisis and other macro-economic concerns appears to be tapering. The impact our market experienced from months of heavy rain and inclement weather is behind us and the demand for living on the Monterey Peninsula remains high.

As you might expect the gradual rebound from a slow market varies by area. This quarter, Carmel-by-the-Sea experienced an increase of 58% in units sold and 71% in total dollar volume over the last quarter. Carmel-by-the-Sea is now only down 15% year over year in total dollar volume, while the greater Carmel area is down 72% and Pacific Grove is down 26% year over year. Pebble Beach also remains down 35% year over year, however, our company alone has experienced a meaningful improvement in homes going into escrow in June and we expect a much healthier Q3.

We expect the momentum to continue through summer and hopefully into next year. Many of the conditions are in line for a healthy market, however, inventory is still down 50% from pre-Covid periods. While this negatively impacts the number of transactions it is good for retaining home values. In our key markets we only experienced high single digit decreases in home values in the last year, and that is after those same markets experienced 30-40% increased between 2020-2022.
The current market conditions are improving but remain very dynamic. It is essential to have a strong command for exactly what is happening in each market and price point. Our inhouse analytics team tracks dozens of variables in real time and reviews them regularly with our team of professional agents. There has never been a more important time to ensure you are being represented by the very best. We hope you will reach out to our team with real estate activity you, your friends or family may be considering.
The following report breaks out the nine markets we track with additional performance detail. We hope you will find this report informative.
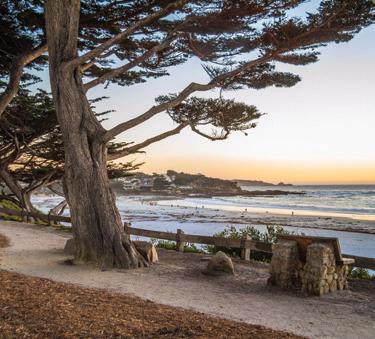
Carmel-by-the-Sea & Carmel Point
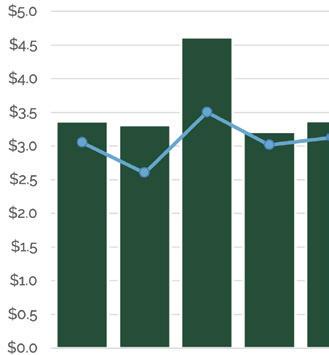
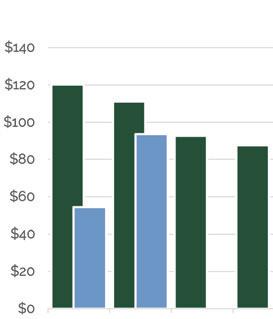
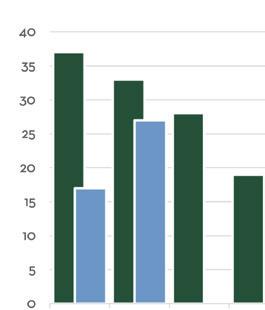
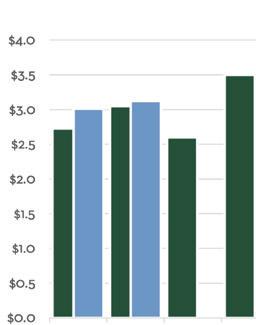
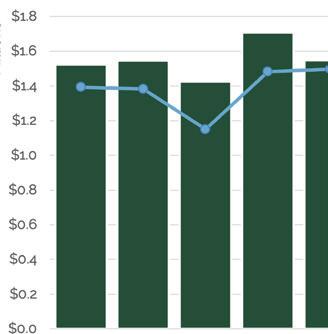
Carmel-by-the-Sea rebounded in Q2 after an extremely slow first quarter of the year. The total number of sales crept back to 27, up from 17 and 19 in the two previous quarters, but still well below the typical average in the mid-30s to low 40s. Average sale price was strong in Q2 2023 at $3.47M. Th is marks the second highest out of the last six quarters. Five sales over $5M was back to the typical level of high-end sales after we saw just one such sale in Q1 2023.


AVERAGE SELLING PRICE
$3,468,153
8.1% 3.1% versus Q1 2023 versus Q2 2022
DAYS ON MARKET

37
23.3% 362.5% versus Q1 2023 versus Q2 2022
SALES VOLUME
$93,640,131

71.7% 15.7% versus Q1 2023 versus Q2 2022
UNITS SOLD
27
58.8% 18.2% versus Q1 2023 versus Q2 2022
MARKET UPDATE
03
Q2 2023 AT A GLANCE
Market Breakdown


DID YOU KNOW?
Carmel-by-the-Sea’s one-square mile village is as unique in charm as it is in fun facts. No high heels law, no street addresses, Clint Eastwood was once mayor, and Doris Day helped make Carmel dog heaven on Earth.
2023
Q2
Market Reports Q2 2023 < $1m $1m–$2m $2m–$3m $5m+ Q2 2022 Q3 2022 Q4 2022 Q1 2023 Q2 2023
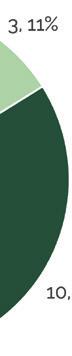
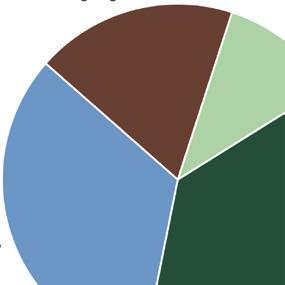
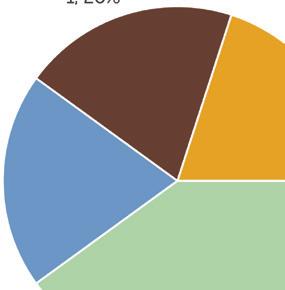
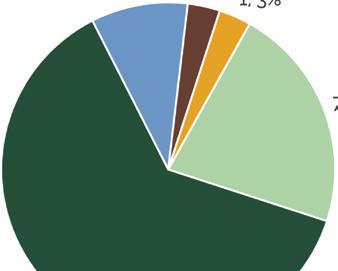
CLOSED SALES VOLUME BY QUARTER in millions Q1 Q2 Q3 Q4 NUMBER OF CLOSED SALES BY QUARTER 19% 5 homes 3 homes 10 homes 9 homes 11% 37% 33% Q1 Q2 Q3 Q4 Q1 Q2 Q3 Q4 Median Average AVERAGE VS. MEDIAN SALES PRICE in millions $3m–$5m 2022 2023 2022 2023 2022 2023 MEDIAN SALES PRICE in millions
SALES BY SEGMENT
“Monterey County Fun Facts”, Monterey County Conven on & Visitors Bureau, 2020
Greater Carmel
e areas outside of Carmel-by-the-Sea & Carmel Point
The greater Carmel area experienced yet another tough quarter, tallying just 13 sales. Th is marks four consecutive quarters below typical sales levels. Eleven of the 13 sales fell in the $1M-2M range with just one sale above $3M for the quarter. With $44.4M in total sales volume thus far in 2023, the greater Carmel area is on track for its lowest level in this category since 2012.
AVERAGE SELLING PRICE
$1,692,258
9.4% 44.3% versus Q1 2023 versus Q2 2022
DAYS ON MARKET
31
42.6% 24% versus Q1 2023 versus Q2 2022
SALES VOLUME
$21,999,355
1.8% 72.1% versus Q1 2023 versus Q2 2022
UNITS SOLD
13
8.3% 50% versus Q1 2023 versus Q2 2022
MARKET UPDATE
05
Q2 2023 AT A GLANCE
Market Breakdown


DID YOU KNOW?
Point Lobos State Reserve near Carmel hosts a geologic wonder: rocks of four “ages” can be found there, including the unusual Carmel formation dating back to the Paleocene age (over 60 million years old).
Q2 2023
Market Reports Q2 2023
< $1m $1m–$2m $2m–$3m $5m+ Q2 2022 Q3 2022 Q4 2022 Q1 2023 Q2 2023 SALES BY SEGMENT CLOSED SALES VOLUME BY QUARTER in millions Q1 Q2 Q3 Q4 NUMBER OF CLOSED SALES BY QUARTER 11 homes 84% Q1 Q2 Q3 Q4 Q1 Q2 Q3 Q4 Median Average AVERAGE VS. MEDIAN SALES PRICE in millions $3m–$5m MEDIAN SALES PRICE in millions “Monterey County Fun Facts”, Monterey County Conven on & Visitors Bureau, 2020 1 home 8% 1 home 8% 2022 2023 2022 2023 2022 2023
Carmel Valley
After six months of slow sales, Q2 bounced back to healthy levels in Carmel Valley. Fift y-three total sales mark the most since Q2 of 2022, up from 39 and 34 in the two previous quarters. While average sale price ($1.785M for the quarter) was down 8.2% year over year, it was up 29.6% from Q1 2023. After zero home sales over $3M in Q1, we saw ten such sales in Q2, showing high priced buyers are coming back to the area.

AVERAGE SELLING PRICE
$1,785,639 29.6% 8.2% versus Q1 2023 versus Q2 2022
DAYS ON MARKET
49
7.5% 63.3% versus Q1 2023 versus Q2 2022
SALES VOLUME
$94,638,850
76.1% 21.5% versus Q1 2023 versus Q2 2022
UNITS SOLD
53
35.9% 14.5% versus Q1 2023 versus Q2 2022
MARKET UPDATE
Q2 2023 AT A GLANCE
07
Market Breakdown

DID YOU KNOW?
Monterey County is the largest grower of Chardonnay in the United States and the largest grower of Pinot Noir in California. Monterey County has 349 vineyards, 82 bonded wineries and 65 tasting rooms.

Q2 2023
Market Reports Q2 2023
< $1m $1m–$2m $2m–$3m $5m+ Q2 2022 Q3 2022 Q4 2022 Q1 2023 Q2 2023
BY SEGMENT CLOSED SALES VOLUME BY QUARTER in millions Q1 Q2 Q3 Q4 NUMBER OF CLOSED SALES BY QUARTER 22 homes 16 homes 5 homes 42% 30% 9% Q1 Q2 Q3 Q4 Q1 Q2 Q3 Q4 Median Average AVERAGE VS. MEDIAN SALES PRICE in millions $3m–$5m MEDIAN SALES PRICE in millions “Monterey County Fun Facts”, Monterey County Conven on & Visitors Bureau, 2020 8 homes 2 homes 4% 15% 2022 2023 2022 2023 2022 2023
SALES
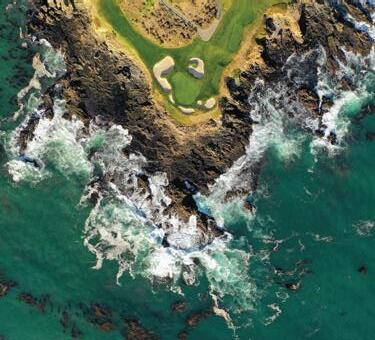
Pebble Beach

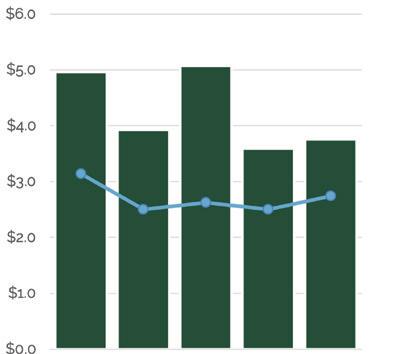
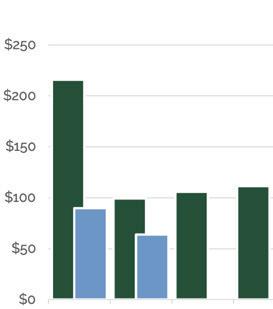
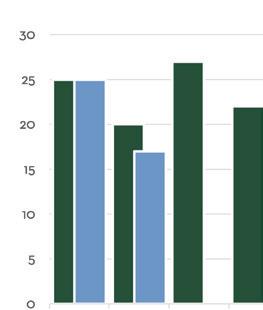
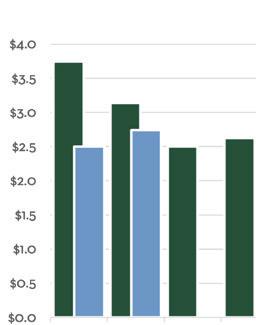
High-priced sales remained hard to come by in Pebble Beach during Q2 2023. Just one sale over $10M occurred in Q2, closing on the last day of the quarter. MCR’s sister-brokerage, Carmel Realty Company, represented both seller and buyer on this sale. Just 17 sales and $63.8M in total sales volume closed in the quarter, each result being the lowest in the area over the last three years. Th irty homes remain on the market heading into Q3, the most over the last nine months. Th is includes 15 homes over $5M, four of which are over $10M. There are a few healthy sales currently in escrow and expected to close in Q3, indicating a much stronger quarter ahead in Pebble Beach.
AVERAGE SELLING PRICE
$3,751,294
4.4% 24.3% versus Q1 2023 versus Q2 2022
DAYS ON MARKET
48
41.2% 17.1% versus Q1 2023 versus Q2 2022
SALES VOLUME
$63,772,000
29% 35.7% versus Q1 2023 versus Q2 2022
UNITS SOLD
17
32% 15% versus Q1 2023 versus Q2 2022
MARKET UPDATE
Q2 2023 AT A GLANCE
09
Market Breakdown
DID YOU KNOW?
The Lone Cypress tree, located on 17-Mile Drive in Pebble Beach, is a scenic landmark for the Peninsula and is nearly 300 years old. Monterey Cypress trees are a species native only to this region and can live up to 4,000 years.
2023
Q2
Market Reports Q2 2023
< $1m $1m–$2m $2m–$3m $5m+ Q2 2022 Q3 2022 Q4 2022 Q1 2023 Q2 2023
SEGMENT CLOSED SALES VOLUME BY QUARTER in millions Q1 Q2 Q3 Q4 NUMBER OF CLOSED SALES BY QUARTER 5 homes 2 homes 7 homes 2 homes 29% 12% 41% 12% Q1 Q2 Q3 Q4 Q1 Q2 Q3 Q4 Median Average AVERAGE VS. MEDIAN SALES PRICE in millions $3m–$5m MEDIAN SALES PRICE in millions
SALES BY
1 home 6% 2022 2023 2022 2023 2022 2023
“Monterey County Fun Facts”, Monterey County Conven on & Visitors Bureau, 2020
AVERAGE SELLING PRICE
Carmel Highlands, Big Sur & South Coast
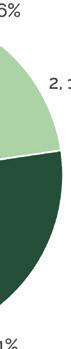
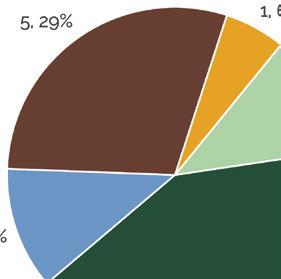
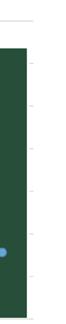
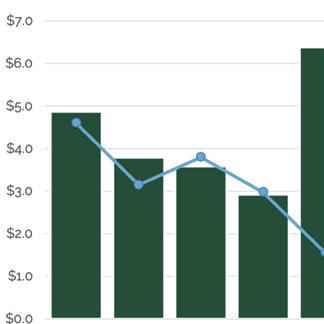
Five closed sales during Q2 matched the previous quarter and was down from eight in Q2 2022. $24.5M of the $31.9M in total sales volume for the quarter came from a single sale in Big Sur. With the remaining four sales making up just $7.4M, the median sale price dropped to $1.55M for the quarter. Eleven of the 15 active listings on the market are above $3M in list price.

$6,380,000
118.5% 30.9% versus Q1 2023 versus Q2 2022
DAYS ON MARKET
78
27.1% 8.2% versus Q1 2023 versus Q2 2022
SALES VOLUME
$31,900,000
118.5% versus Q1 2023 versus Q1 2023
18.2% versus Q2 2022
UNITS SOLD
5 no change 37.5% versus Q2 2022
MARKET UPDATE
11
Q2 2023 AT A GLANCE
Market Breakdown
DID YOU KNOW?
The Bixby Bridge in Big Sur was built by prisoners eager to earn “good time” off their prison sentences. It is one of the world’s highest single-span bridges at 714 feet long by 260 feet high.
2023
Q2
Market Reports Q2 2023
< $1m $1m–$2m $2m–$3m $5m+ Q2 2022 Q3 2022 Q4 2022 Q1 2023 Q2 2023 SALES BY SEGMENT CLOSED SALES VOLUME BY QUARTER in millions Q1 Q2 Q3 Q4 NUMBER OF CLOSED SALES BY QUARTER 2 homes 1 home 1 home 1 home 40% 20% 20% 20% Q1 Q2 Q3 Q4 Q1 Q2 Q3 Q4 Median Average AVERAGE VS. MEDIAN SALES PRICE in millions $3m–$5m MEDIAN SALES PRICE in millions
2022 2023 2022 2023 2022 2023
“Monterey County Fun Facts”, Monterey County Conven on & Visitors Bureau, 2020
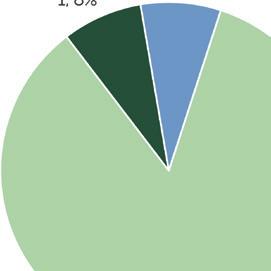
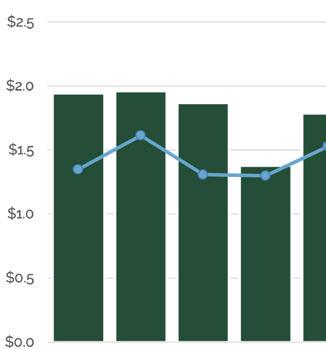
Pacific Grove
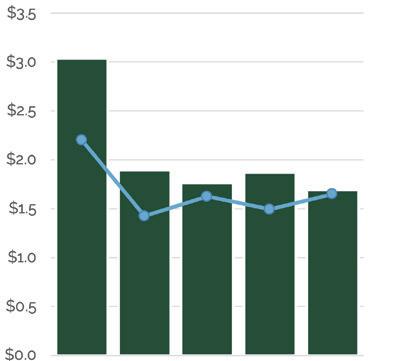
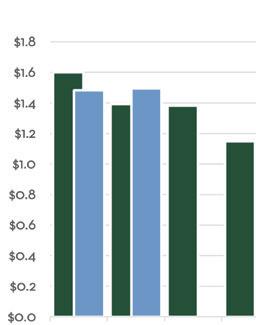
Quarter 2 in Pacific Grove was consistent with its previous two quarters. The number of sales (32) was just two above the slow quarters of Q4 2022 and Q1 2023. Average sale price ($1.55M), while down 9.4% versus Q1, was up 1.6% compared to Q2 2022. Th is strong average sale price paired with average days on the market coming in at 30 days, shows a strong demand when new homes come on the market. One of the main drivers in the Pacific Grove market continues to be low inventory, with just 18 active listings moving into Q3.

AVERAGE SELLING PRICE
$1,547,380 9.4% 1.6% versus Q1 2023 versus Q2 2022
DAYS ON MARKET
30
44.4% 233.3% versus Q1 2023 versus Q2 2022
SALES VOLUME
$49,516,155
3.4% 26.1% versus Q1 2023 versus Q2 2022
UNITS SOLD
32
6.7% 27.3% versus Q1 2023 versus Q2 2022
13
Q2 2023 AT A GLANCE MARKET UPDATE
Market Breakdown
DID YOU KNOW?
The Monarch Butterfly Sanctuary in Pacific Grove is one of the largest monarch overwintering sites in America. The monarchs arrive in October after a 2,000-mile migration and overwinter until February.
2023
Q2
Market Reports Q2 2023
Q2 2022 Q3 2022 Q4 2022 Q1 2023 Q2 2023 SALES BY SEGMENT CLOSED SALES VOLUME BY QUARTER in millions Q1 Q2 Q3 Q4 NUMBER OF CLOSED SALES BY QUARTER 7 homes 3 homes 20 homes 22% 9% 63% Q1 Q2 Q3 Q4 Q1 Q2 Q3 Q4 Median Average AVERAGE VS. MEDIAN SALES PRICE in millions MEDIAN SALES PRICE in millions
1 home 1 home 3% 3% < $800k $800k–$1.2m $1.2m–$2m $3m+ $2m–$3m 2022 2023 2022 2023 2022 2023
“Monterey County Fun Facts”, Monterey County Conven on & Visitors Bureau, 2020
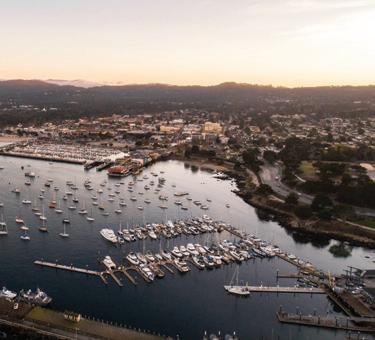
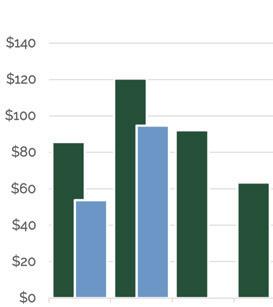
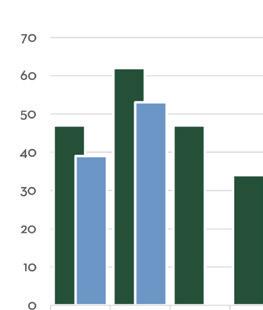
Monterey & Del Rey Oaks
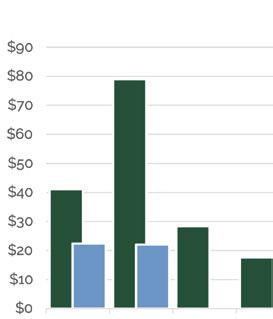
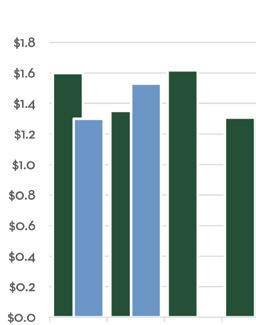
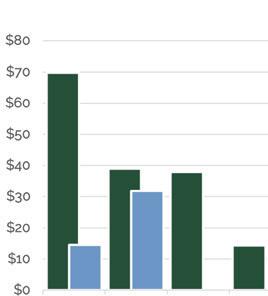
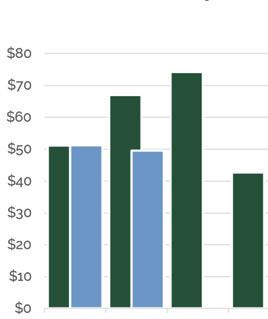
Monterey experienced 66 total sales during Q2, the most since Q2 2022. Zero sales over $3M, limited the average sale price to $1.13M, down 13.6% year over year, and 9.5% quarter over quarter. Median sale price also dipped to $918K, the lowest since Q1 of 2021. Forty active listings at the end of the quarter are the most since last October, showing promise for a high number of sales in the quarter ahead.
AVERAGE SELLING PRICE
$1,134,770 9.5% 13.6% versus Q1 2023 versus Q2 2022
DAYS ON MARKET
25
4.2% 10.7% versus Q1 2023 versus Q2 2022
SALES VOLUME
$74,894,816
42.2% 18.6% versus Q1 2023 versus Q2 2022
UNITS SOLD
66
57.1% 5.7% versus Q1 2023 versus Q2 2022
15
Q2 2023 AT A GLANCE MARKET UPDATE
Market Breakdown


DID YOU KNOW?
The Monterey Bay National Marine Sanctuary covers 5,312 square miles. This is one and a half times the size of the largest national park in the continental U.S. At its center is a submarine canyon twice as deep as the Grand Canyon.
Q2 2023
Market Reports Q2 2023
< $800k $800k–$1.2m $1.2m–$2m $3m+ Q2 2022 Q3 2022 Q4 2022 Q1 2023 Q2 2023 SALES BY SEGMENT CLOSED SALES VOLUME BY QUARTER in millions Q1 Q2 Q3 Q4 NUMBER OF CLOSED SALES BY QUARTER 21 homes 20 homes 8 homes 32% 30% 12% Q1 Q2 Q3 Q4 Q1 Q2 Q3 Q4 Median Average AVERAGE VS. MEDIAN SALES PRICE in millions $2m–$3m MEDIAN SALES PRICE in millions
17 homes 26% 2022 2023 2022 2023 2022 2023
“Monterey County Fun Facts”, Monterey County Conven on & Visitors Bureau, 2020
MARKET UPDATE
Seaside
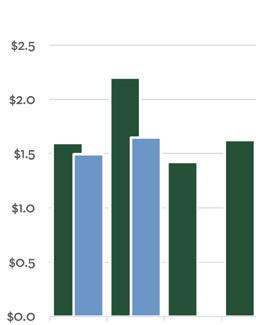
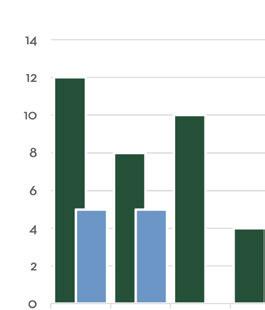
Quarter 2 in Seaside slightly edged the previous quarter in number of sales (30), average sale price ($854k), and total sales volume ($25.6M). The number of closed sales in Seaside remains below what we have seen over the last two years, and even below prepandemic levels. The lack of inventory and increased interest rates are holding this market back from sales levels experienced over the last several years. Low supply and consistent demand have kept the average sale price high, reaching a near record high of $854k during Q2.

AVERAGE SELLING PRICE
$854,404 16.6% 1.4% versus Q1 2023 versus Q2 2022
DAYS ON MARKET
35
9.4% 150% versus Q1 2023 versus Q2 2022
SALES VOLUME
$25,632,109
45.7% 44.2% versus Q1 2023 versus Q2 2022
UNITS SOLD
30
25% 43.4% versus Q1 2023 versus Q2 2022
17 Q2 2023 AT A GLANCE
Market Breakdown


DID YOU KNOW?
The widely acclaimed Monterey Jazz Festival has occurred since 1958, and is the longest continuously running jazz festival in the world. Past jazz greats who have performed include Miles Davis, Stan Getz and Dizzie Gillespie.

Q2 2023
Market Reports Q2 2023
Q2 2022 Q3 2022 Q4 2022 Q1 2023 Q2 2023 SALES BY SEGMENT CLOSED SALES VOLUME BY QUARTER in millions Q1 Q2 Q3 Q4 NUMBER OF CLOSED SALES BY QUARTER 17 homes 5 homes 4 homes 57% 17% 13% Q1 Q2 Q3 Q4 Q1 Q2 Q3 Q4 Median Average AVERAGE VS. MEDIAN SALES PRICE in millions MEDIAN SALES PRICE
County Fun Facts”, Monterey County Conven on & Visitors Bureau, 2020 4 homes 13% $900k $800k $700k $600k $500k $400k $300k $200k $100k $0 < $400k $400k–$600k $600k–$800k $800k–$1m $1m+ 2022 2023 2022 2023 2022 2023 $1m $900k $800k $700k $600k $500k $400k $300k $200k $100k 0
“Monterey
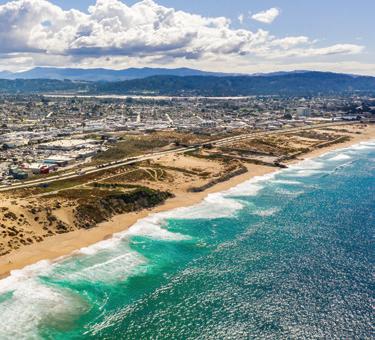
Marina & East Garrison
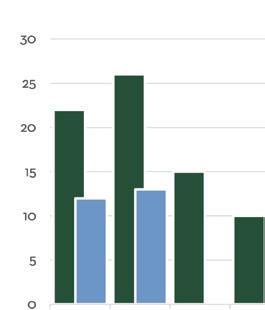
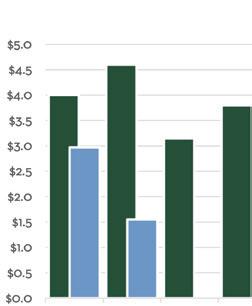
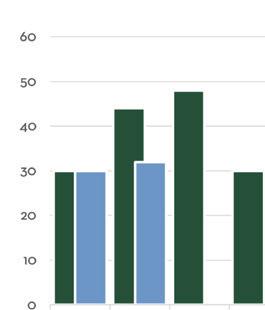
Marina and East Garrison saw another record high in average sale price during the quarter, coming in at $973K. Th irty-six sales during the quarter was a 24% increase from Q1’s three-year low, but still below the typical 40-plus sale quarters we have seen over recent years. Home sales over $1M have continued to increase in this area, with 42% of sales coming in over this mark in Q2. Th is doubles the 2022 full-year percentage of 21% of sales over $1M. Monterey Coast Realty represented a side on four sales over $1M during the quarter.

AVERAGE SELLING PRICE
$972,886
12.8% 11.3% versus Q1 2023 versus Q2 2022
DAYS ON MARKET
30
50.8% 66.7% versus Q1 2023 versus Q2 2022
SALES VOLUME
$35,023,910
40% 8.9% versus Q1 2023 versus Q2 2022
UNITS SOLD
36
24.1% 18.2% versus Q1 2023 versus Q2 2022
19
Q2 2023 AT A GLANCE MARKET UPDATE
Market Breakdown


DID YOU KNOW?
As the number one agricultural region in the United States, Salinas Valley earned its nickname “Salad Bowl of the World” due to the wide variety of fruits and vegetables grown here.
Q2 2023
Market Reports Q2 2023
< $600k $600k–$800k $800k–$1M $1M–$1.2M $1.2M–$2M Q2 2022 Q3 2022 Q4 2022 Q1 2023 Q2 2023 SALES BY SEGMENT CLOSED SALES VOLUME BY QUARTER in millions Q1 Q2 Q3 Q4 NUMBER OF CLOSED SALES BY QUARTER 7 homes 6 homes 9 homes 19% 17% 25% Q1 Q2 Q3 Q4 Q1 Q2 Q3 Q4 Median Average AVERAGE VS. MEDIAN SALES PRICE in millions MEDIAN SALES PRICE
14 homes 39% 2022 2023 2022 2023 2022 2023 $1m $950k $900k $850k $800k $750k $900k $800k $700k $600k $500k $400k $300k $200k $100k $0
“Monterey County Fun Facts”, Monterey County Conven on & Visitors Bureau, 2020


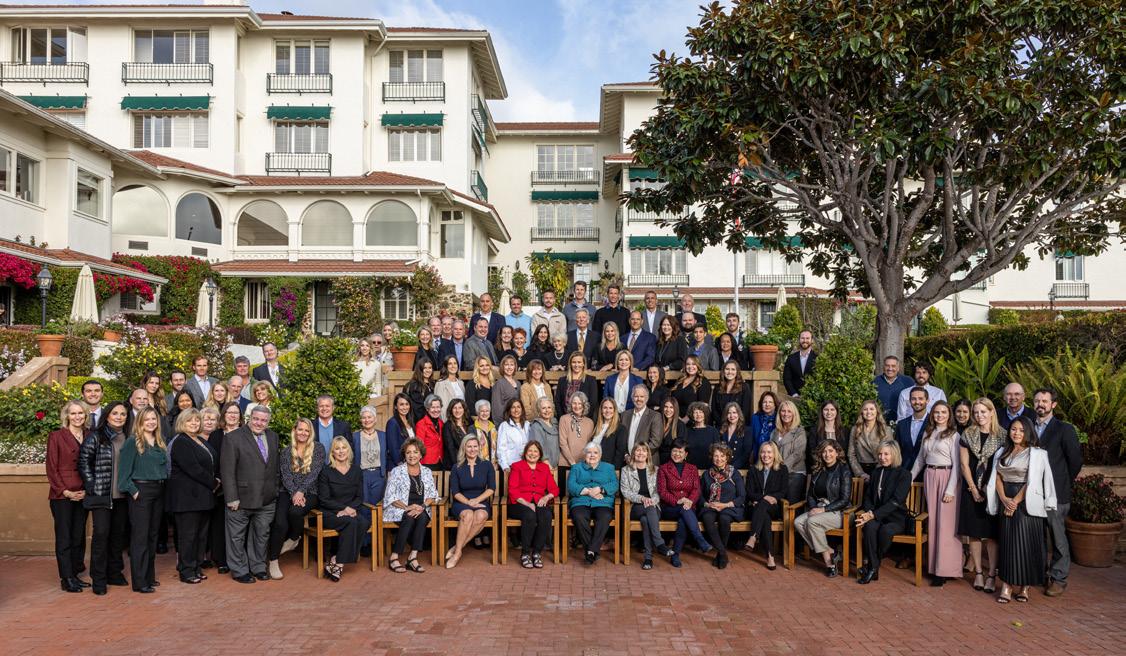
MONTEREY COAST REALTY
of Carmel’s Most Charming Neighborhoods Cozy & Bright Carmel-by-the-Sea Co age
Haven Neighborhood in Marina Overlook the Untouched Ventana Wilderness
Spectacular Salinas Valley Views in East Garrison Rare Corner Unit Condo in Montsalas, Monterey
21 Market Reports Q2 2023
Our Featured Listings One
9 Sonoma Lane • 3 beds, 2.5 baths • $3,300,000 Dolores 4 SE of 2nd • 2 beds, 2 baths • $2,100,000
Sea
2965 Rainer Way • 3 beds, 2.5 baths •
$1,425,000 Pfeiffer Ridge Road • 5 acre lot • $1,550,000
13521 Warren Avenue • 5 beds, 4 baths • $1,250,000 17 Montsalas Drive • 3 beds, 2.5 baths • $849,000
Monterey Coast Realty represents buyers and sellers of quality properties, from cozy cottages to magnificent mansions throughout the Monterey Peninsula, all the way east to Salinas Valley, through Carmel Valley and south to Big Sur. We are comprised of a handpicked team of Realtors known for their professionalism, ethics and business success. We work together to offer the highest quality of personalized service to our clients.
Monterey Coast Realty is a sister brand of Carmel Realty Company, a 100-year-old real estate firm with a rich history as a family-owned business and a reputation for service, integrity and excellence. The collaborative culture of our professional colleagues contributes to a team approach with our properties and servicing clients. Combined, the firms have an exceptionally knowledgeable network of professionals who work together to offer the highest quality service to our clients. In addition, our unrivaled concierge-style client services team, first-class marketing and a robust company infrastructure with leading technology resources further reinforce our premier position in the area. We take pride in being actively engaged in the community and conduct both our real estate and volunteer activities with integrity. Together, the firms have accomplished an impressive record of sales and clientele loyalty.


831-624-2300 • info@MontereyCoastRealty.com


Dolores Street between 7th & 8th, Carmel-by-the-Sea Monterey Coast Realty DRE#01871677


Scan the Code to Learn More About Our Agents & Team Members MontereyCoastRealty.com • 831.624.2300 • DRE #01871677 The quality of life on the Monterey Peninsula is unmatched. Let us help make it your reality. Monterey Coast Realty represents buyers and sellers of quality properties from cozy cottages to magnificent estates throughout the Monterey Peninsula all the way east to Salinas Valley, through Carmel Valley and south to Big Sur. Locally Owned. Globally Connected. Results Driven Experts Representing Buyers & Sellers of Quality Properties Across the Monterey Peninsula