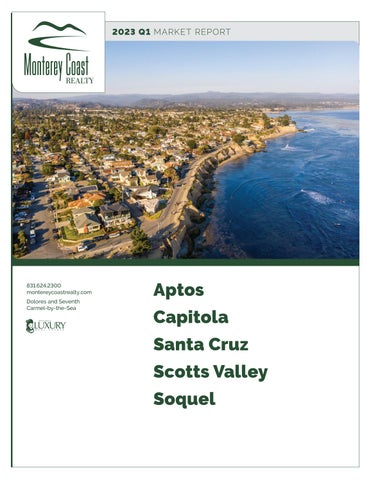
2023 Q1 MARKET REPORT Aptos Capitola Santa Cruz Scotts Valley Soquel 831.624.2300 montereycoastrealty.com Dolores and Seventh Carmel-by-the-Sea
831.624.2300
montereycoastrealty.com
Dolores and Seventh Carmel-by-the-Sea
APTOS MARKET UPDATE
Aptos has seen the Average Sale Price drop 13% from Q4 of 2022, while the Median Sale Price rose 13% to $1,522,944. This is due to most of the market selling in the $1-2 million range, along with diminished sales numbers in the $3+ million range. Units Sold continued in fall another 22% from Q4, while being down 30.4% from Q1 of 2022. Days on Market (DOM) rose for the third straight quarter to 50, up 13.6% from Q4 2022 and 178% from Q1 2022. Despite the market continuing to cool, Months of Available Inventory (MOI) hit the lowest point since Q4 of 2021, which shows demand is still outpacing the limited amount of inventory coming to market.
$1,614,241
AVERAGE SELLING PRICE
13.1% vs Q4 2022
13.8% vs Q1 2022
SALES VOLUME $51.7M
32.2% vs Q4 2022
38.7% vs Q1 2022
32
UNITS SOLD
22% vs Q4 2022
30.4% vs Q1 2022
50 DAYS ON MARKET
13.6% vs Q4 2022
178% vs Q1 2022
2
16% <$1M
3% 19% 63%
| 5 $1M-2M | 20 $2M-3M | 6 $3M-5M | 1 $5M+ | 0
SALES BY SEGMENT


3 2023 Q1 MARKET REPORT Closed Sales by Quarter 18 36 54 72 90 Q1 Q2 Q3 Q4 2022 2023 Average vs Median Sales $1.53M $1.82M $2.1M Q1 2022 Q2 2022 Q3 2022 Q4 2022 Q1 2023 Average Median Days on Market 10 20 30 40 50 Q1 2022 Q2 2022 Q3 2022 Q4 2022 Q1 2023 Months of Available Inventory 0.75 1.5 2.25 3 Q1 Q2 Q3 Q4 2022 2023 Closed Sales Volume by Quarter $45M $90M $135M $180M Q1 Q2 Q3 Q4 2022 2023
Aptos
831.624.2300
montereycoastrealty.com
Dolores and Seventh Carmel-by-the-Sea
CAPITOLA MARKET UPDATE
InCapitola, the Average Sale Price rose 13.8% from Q4 while the Median Sale Price fell 13.5% to $1,442,500. This large discrepancy comes from the only $5+ million sale in the last two years taking place this quarter at a time where sales are extremely constrained. There were only 6 sales for the quarter, down 57.1% from Q4 and 45.5% from Q1 2022. DOM hit 60 days for the quarter, however, if you exclude some outlier sales this number would be just 7 days. MOI remained low at 1.7 months, and shows that despite slowing trends in many statistics, inventory was unable to build substantially during the quarter against continued demand.
$2,078,333
AVERAGE SELLING PRICE
13.8% vs Q4 2022
10.7% vs Q1 2022
51.2% vs
39.6% vs Q1 2022
4
SALES VOLUME $12.5M
Q4
2022
57.1% vs Q4 2022 45.5% vs Q1 2022 UNITS SOLD 6 131% vs Q4 2022 566% vs Q1 2022 60 DAYS
MARKET SALES BY SEGMENT 2% 19% 79% <$1M | 1 $1M-2M | 4 $2M-3M | 0 $3M-5M | 0 $5M+ | 1
ON


5 2023 Q1 MARKET REPORT
Closed Sales by Quarter 5 10 15 Q1 Q2 Q3 Q4 2022 2023 Days on Market 15 30 45 60 Q1 2022 Q2 2022 Q3 2022 Q4 2022 Q1 2023 Months of Available Inventory 1 2 3 4 Q1 Q2 Q3 Q4 2022 2023 Closed Sales Volume by Quarter $7M $13M $20M $26M Q1 Q2 Q3 Q4 2022 2023 Average vs Median Sales $1.53M $1.82M $2.1M Q1 2022 Q2 2022 Q3 2022 Q4 2022 Q1 2023 Average Median
Capitola
831.624.2300
montereycoastrealty.com
Dolores and Seventh Carmel-by-the-Sea

SANTA CRUZ MARKET UPDATE
Average and Median Sale Prices dropped for the third straight quarter, down 9.7% and 7% from Q4 2022, respectively. The sub-$1 million range composed most of this market prior to the pandemic and now make up 13% of the market as these affordable options rebound. Units Sold were just 64 for the largest market in the county, which is down 31.2 % from Q4 and 34.7% from Q1 2022. DOM rose another 26.5% to 43 days for the quarter. In contrast to other markets shown with similar price and activity movements, Santa Cruz continued to build MOI for the quarter to 2.4 months. This is the highest seen in this market since Q3 2019. 2%
$1,493,927
AVERAGE SELLING PRICE
9.7% vs Q4 2022
21.9% vs Q1 2022
SALES VOLUME $95.6M
37.9% vs Q4 2022
49% vs Q1 2022
64
UNITS SOLD
31.2% vs Q4 2022
34.7% vs Q1 2022
17% 69% 13% <$1M | 8 $1M-2M | 44 $2M-3M | 11 $3M-5M | 1 $5M+ | 0
43 DAYS ON MARKET
26.5% vs Q4 2022
95.5% vs Q1 2022
6
SALES BY SEGMENT
Santa Cruz


7 2023 Q1 MARKET REPORT Closed Sales by Quarter 47 93 140 Q1 Q2 Q3 Q4 2022 2023 Average vs Median Sales $1.13M $1.57M $2M Q1 2022 Q2 2022 Q3 2022 Q4 2022 Q1 2023 Average Median Days on Market 10 20 30 40 50 Q1 2022 Q2 2022 Q3 2022 Q4 2022 Q1 2023 Months of Available Inventory 0.5 1 1.5 2 2.5 Q1 Q2 Q3 Q4 2022 2023 Closed Sales Volume by Quarter $65M $130M $195M $260M Q1 Q2 Q3 Q4 2022 2023
831.624.2300
montereycoastrealty.com
Dolores and Seventh Carmel-by-the-Sea
SCOTTS VALLEY MARKET UPDATE

After a brief hold in Q4 2022, Scotts Valley saw Average Sale Price drop 7.5% from Q4 and 22.3% from Q1 2022. The Median Sale Price also fell 7% from Q4 to $1,257,750. Though Units Sold fell 5.9% from Q4 2022 to 16, Q1 is normally slower in this market and held consistent year over year. DOM continued to increase as well, reaching 54 in Q1. This is up 29% from Q4 and 391% from Q1 2022, which shows just how changed one of the outlying area markets has been since the heat of the pandemic market has evaporated. MOI dropped drastically from nearly 5 months in Q4 to 2.5 months at the end of Q1. With low sales for the quarter, it is evident that the amount of new inventory coming to market is limited.
$1,331,903
AVERAGE SELLING PRICE
7.5% vs Q4 2022
22.3% vs Q1 2022
$21.3M
SALES VOLUME
12.9% vs Q4 2022
22.3% vs Q1 2022
16
UNITS SOLD
5.9% vs Q4 2022
no change vs Q1 2022
19%
81%
<$1M | 3 $1M-2M | 13 $2M-3M | 0 $3M-5M | 0 $5M+ | 0
54 DAYS ON MARKET
29% vs Q4 2022
391% vs Q1 2022
8
SALES BY SEGMENT
Scotts Valley


9 2023 Q1 MARKET REPORT Closed Sales by Quarter 10 20 30 40 50 Q1 Q2 Q3 Q4 2022 2023 Average vs Median Sales $1.07M $1.43M $1.8M Q1 2022 Q2 2022 Q3 2022 Q4 2022 Q1 2023 Average Median Days on Market 12 24 36 48 60 Q1 2022 Q2 2022 Q3 2022 Q4 2022 Q1 2023 Months of Available Inventory 1.3 2.5 3.8 5.0 Q1 Q2 Q3 Q4 2022 2023 Closed Sales Volume by Quarter $18M $35M $53M $70M Q1 Q2 Q3 Q4 2022 2023
831.624.2300
montereycoastrealty.com
Dolores and Seventh Carmel-by-the-Sea
SOQUEL MARKET UPDATE

oquel saw the Average Sale Price drop 21.8% from Q4 and 22.9% from Q1 2022, while the Median Sale Price dropped just 1.8% from Q4 to $1,275,000. With a wide variety of price ranges held within this market, and relatively few sales, we tend to see some drastic variation in these numbers. Units Sold for the quarter were also low at just 8, down 11.1% from Q4 and 38.5% from Q1 2022. DOM reached a high for the past couple of years at 49, a rise of 81.5% from Q4 2022. MOI fell slightly from Q4 to 3.3 and represents one of the most stable inventory statistics of any market covered.
S
21.8% vs Q4 2022
22.9% vs Q1 2022
8
UNITS SOLD
AVERAGE SELLING PRICE 11.1% vs Q4 2022
49 DAYS ON MARKET
10
30.5%
Q4 2022 25.5% vs Q1 2022 38.5% vs Q1 2022
SALES
BY SEGMENT 13% 75% 13% <$1M | 1 $1M-2M | 6 $2M-3M | 1 $3M-5M | 0 $5M+ | 0 SALES VOLUME $10.8M
vs
$1,352,688 81.5% vs Q4 2022 48.5% vs Q1 2022