Q3 2022 Market Overview
You have heard it said that we live in a bubble here on the Monterey Peninsula. That bubble has protected us and softened many of the global and national disruptions that have so adversely affected other areas. This phenomenon is holding true as it relates to the real estate market as well.
Concern over the housing market across the US has been aggressively reported in all the daily news. The downturn in the number of sales, dollar volume, and home prices is significant in most markets across the country. With an exceptional quality of life here, the desire to live on The Peninsula remains very high. We have limited inventory of homes for sale, and many of our markets are less impacted by rising interest rates. While our market is also normalizing and performing behind some of the record numbers we delivered in 2021, so far we are not realizing the dramatic reduction in real estate results seen in other markets. Of the 9 markets we track across the Peninsula, the number of sales in Q3, 2022 is down 31% and total volume in dollars is down 27% from the same quarter of last year. While this is less of a decline than many markets across the US, the bigger news here on The Peninsula is that price is holding strong. Five of our 9 markets have seen an increase this year over Q3 2021 while 4 have seen a mild decrease. Overall, the average sales price in Q3 2022 is higher than it was in Q3 2021 and just 5% down from the second quarter of this year.
As always, our company analytics team is tracking dozens of macro and micro variables affecting sales and pricing in our local real estate market. For example, we know that of the 315 sales that took place in Q3 across our 9 markets, 162 of them sold below asking price. This is 51% of total sales which was up from only 31% of total sales selling below asking in Q2 of this year. The average price reduction was 5.5% below asking price for these 162 sales in Q3 of this year. At the same time, 31% of homes in Q3 sold for over asking price while 17% went at asking price.
These analytics tell us that our market is experiencing slightly less of a downturn in the total number of sales and sales volume and significantly less of a downturn in average sale price when compared with most markets across the US. We are continuing to see volatility from month to month and are tracking every possible variable to provide intelligence to our clients that allow for informed buying and selling decisions. It has never been more important to work with a realtor who has access to factual data and a focused analytics team in place to analyze and logically present the implications of this data. The following report breaks out all 9 of the markets we track with additional performance detail. We hope you will find this report informative. As always, please be sure to contact us if there is anything we can do to help you, or your friends and family, with real estate plans in our marketplace.
831.624.2300 montereycoastrealty.com Dolores and Seventh Carmel-by-the-Sea 4
5 Q3 2022 MARKET REPORT Carmel-by-the-Sea & Carmel Point �������������������������������� 6 Greater Carmel ��������������������������������������������������������������� ��� 8 The areas outside of Carmel-by-the Sea & Carmel Point Carmel Valley ��������������������������������������������������������������� ��� 10 Including The Santa Lucia Preserve Pebble Beach ��������������������������������������������������������������� ���� 12 Carmel Highlands, Big Sur & South Coast ������������������� 14 Monterey & Del Rey Oaks ������������������������������������������������ 16 Pacific Grove ��������������������������������������������������������������� ����� 18 Seaside ��������������������������������������������������������������� �������������� 20 Marina & East Garrison �������������������������������������������������� 22 Table of Contents
uarter 3 of 2022 in Carmel-by-the-Sea saw sales prices remain high, down less than 2% from Q2. Uncertainty in the market led to just 28 sales throughout the quarter, the lowest since Q2 of 2020. Homes are also beginning to remain on the market longer with the average days on market moving up to 34, the highest of any quarter this year. Through three quarters of 2022, total sales volume (dollars) is easily on track to surpass 2019 and all years prior, but is tracking well short of both Q3 2020 and Q3 2021.


831.624.2300 montereycoastrealty.com Dolores and Seventh Carmel-by-the-Sea 6 CARMEL-BY-THE-SEA MARKET UPDATE Q
SALES BY SEGMENT 18% 29% 25% 29% <$1M | 0 $1M-$2M | 8 $2M-$3M | 7 $3M-$5M | 8 $5M+ | 5 SALES VOLUME AVERAGE SELLING PRICE UNITS SOLD DAYS ON MARKET $3,311,434 1.6% vs Q2 2022 3.7% vs Q3 2021 34 325% vs Q2 2022 88.9% vs Q3 2021 28 15.2% vs Q2 2022 24.3% vs Q3 2021 $92.7M 16.5% vs Q2 2022 21.5% vs Q3 2021
7 Q3 2022 MARKET REPORT Closed Sales by Quarter 0 10 20 30 40 50 Q1 Q2 Q3 Q4 2021 2022 Average vs Median Sales Price $2M $2.5M $3M $3.5M $4M Q3 2021 Q4 2021 Q1 2022 Q2 2022 Q3 2022 Average Median Days on Market 0 10 20 30 40 Q3 2021 Q4 2021 Q1 2022 Q2 2022 Q3 2022 Average vs Median Sales Price by Quarter $2M $2.5M $3M $3.5M $4M Q1 Q2 Q3 Q4 2021 Average 2021 Median 2022 Average 2022 Median Closed Sales Volume by Quarter $70M $100M $130M $160M $190M Q1 Q2 Q3 Q4 2021 2022 Carmel-by-the-Sea & Carmel Point
a huge Q2 2022 that saw two sales over $10M and a median sales price over $2.2M, Q3 in the Greater Carmel area came back to normal levels. The average sales price of $1.89M is right on par with that of both Q1 2022 and the last two quarters of 2021. The number of sales (15) fell to its lowest point since Q2 of 2020, in the heart of the COVID pandemic. Both average days on market and number of actives stayed low showing demand remains even with limited inventory.


831.624.2300 montereycoastrealty.com Dolores and Seventh Carmel-by-the-Sea 8 GREATER CARMEL MARKET UPDATE After
SALES BY SEGMENT 7% 7% 13% 67% 7% <$1M | 1 $1M-$2M | 10 $2M-$3M | 2 $3M-$5M | 1 $5M+ | 1 SALES VOLUME AVERAGE SELLING PRICE UNITS SOLD DAYS ON MARKET $1,891,133 37.7% vs Q2 2022 4.8% vs Q3 2021 21 16% vs Q2 2022 52.3% vs Q3 2021 15 42.3% vs Q2 2022 31.8% vs Q3 2021 $28.4M 64.1% vs Q2 2022 28.5% vs Q3 2021
9 Q3 2022 MARKET REPORT Closed Sales by Quarter 10 15 20 25 30 Q1 Q2 Q3 Q4 2021 2022 Average vs Median Sales Price $800K $1.41M $2.03M $2.64M $3.25M Q3 2021 Q4 2021 Q1 2022 Q2 2022 Q3 2022 Average Median Days on Market 0 15 30 45 60 Q3 2021 Q4 2021 Q1 2022 Q2 2022 Q3 2022 Average vs Median Sales Price by Quarter $1.25M $1.75M $2.25M $2.75M $3.25M Q1 Q2 Q3 Q4 2021 Average 2021 Median 2022 Average 2022 Median Closed Sales Volume by Quarter $20M $35M $50M $65M $80M Q1 Q2 Q3 Q4 2021 2022 Greater Carmel The areas outside of Carmel-by-the Sea & Carmel Point
verage sales prices remained high in Carmel Valley, with Q3 sporting the second highest amount on record ($1.96M). With prices continuing to climb the number of sales in the area has slowed down to just 47 for the quarter. Carmel Valley is seeing fewer and fewer homes sell for under $1M (15%), with 51% selling between $1M-2M and the remaining 33% over $2M. With 47 homes on the market to end the quarter and demand remaining relatively high, there are signs that Carmel Valley should continue to perform as a strong market moving forward.

831.624.2300 montereycoastrealty.com Dolores and Seventh Carmel-by-the-Sea 10 CARMEL VALLEY MARKET UPDATE A
SALES BY SEGMENT 4% 9% 21% 51% 15% <$1M | 7 $1M-$2M | 24 $2M-$3M | 10 $3M-$5M | 4 $5M+ | 2 SALES VOLUME AVERAGE SELLING PRICE UNITS SOLD DAYS ON MARKET $1,959,064 .8% vs Q2 2022 3.7% vs Q3 2021 38 26.7% vs Q2 2022 18.8% vs Q3 2021 47 24.2% vs Q2 2022 29.9% vs Q3 2021 $92.1M 23.6% vs Q2 2022 32.4% vs Q3 2021
11 Q3 2022 MARKET REPORT Closed Sales by Quarter 40 50 60 70 80 90 Q1 Q2 Q3 Q4 2021 2022 Average vs Median Sales Price $1.25M $1.5M $1.75M $2M $2.25M Q3 2021 Q4 2021 Q1 2022 Q2 2022 Q3 2022 Average Median Days on Market 20 25 30 35 40 Q3 2021 Q4 2021 Q1 2022 Q2 2022 Q3 2022 Average vs Median Sales Price by Quarter $1.25M $1.5M $1.75M $2M $2.25M Q1 Q2 Q3 Q4 2021 Average 2021 Median 2022 Average 2022 Median Closed Sales Volume by Quarter $50M $80M $110M $140M $170M Q1 Q2 Q3 Q4 2021 2022 Carmel Valley Including The Santa Lucia Preserve
Pebble Beach had an interesting Q3 that differed from recent quarters. The number of sales went up compared to Q2 and Q1 of 2022. Average sales price in contrast, decreased, as we saw an uptick of $1M-2M properties sell this quarter. In fact, 11 of the 27 sales came in under $2M (41%), while for all of 2022 only 24% come in under this amount. This brought the average sales price under $4M for just the second time over the past seven quarters. While inventory has been tight over the last few quarters it seems to be a bit stronger now. Demand remains strong indicating a strong Q4 for Pebble Beach.


831.624.2300 montereycoastrealty.com Dolores and Seventh Carmel-by-the-Sea 12 PEBBLE BEACH MARKET UPDATE
SALES BY SEGMENT 33% 11% 15% 30% 11% <$1M | 3 $1M-$2M | 8 $2M-$3M | 4 $3M-$5M | 3 $5M+ | 9 SALES VOLUME AVERAGE SELLING PRICE UNITS SOLD DAYS ON MARKET $3,921,808 20.9% vs Q2 2022 11.5% vs Q3 2021 26 36.6% vs Q2 2022 13.3% vs Q3 2021 27 35% vs Q2 2022 no change vs Q3 2021 $105.9M 6.8% vs Q2 2022 11.5% vs Q3 2021
13 Q3 2022 MARKET REPORT Closed Sales by Quarter 10 20 30 40 50 Q1 Q2 Q3 Q4 2021 2022 Average vs Median Sales Price $2M $3.75M $5.5M $7.25M $9M Q3 2021 Q4 2021 Q1 2022 Q2 2022 Q3 2022 Average Median Days on Market 20 30 40 50 Q3 2021 Q4 2021 Q1 2022 Q2 2022 Q3 2022 Average vs Median Sales Price by Quarter $2M $3.75M $5.5M $7.25M $9M Q1 Q2 Q3 Q4 2021 Average 2021 Median 2022 Average 2022 Median Closed Sales Volume by Quarter $75M $125M $175M $225M Q1 Q2 Q3 Q4 2021 2022 Pebble Beach
10 sales during the quarter in the Carmel Highlands and Big Sur area came divided on both the low end and high end of the pricing spectrum. Of the 10 sales, 2 were under $350K and 6 came in above $3M. While the average days on market was high at 82 days, this was primarily due to 2 sales that remained on market for 187 and 291 days before selling, which is not atypical for this region. With a strong Q4 2022, this area could reach 2020 and possibly 2021 in total sales volume.

831.624.2300 montereycoastrealty.com Dolores and Seventh Carmel-by-the-Sea 14 CARMEL HIGHLANDS MARKET UPDATE The
SALES BY SEGMENT 20% 40% 20% 20% <$1M | 2 $1M-$2M | 2 $2M-$3M | 0 $3M-$5M | 4 $5M+ | 2 SALES VOLUME AVERAGE SELLING PRICE UNITS SOLD DAYS ON MARKET $3,792,050 22.2% vs Q2 2022 7% vs Q3 2021 82 3.5% vs Q2 2022 19.6% vs Q3 2021 10 25% vs Q2 2022 23.1% vs Q3 2021 $37.9M 2.8% vs Q2 2022 28.4% vs Q3 2021
15 Q3 2022 MARKET REPORT Closed Sales by Quarter 0 4 8 12 16 20 Q1 Q2 Q3 Q4 2021 2022 Average vs Median Sales Price $1.5M $3M $4.5M $6M Q3 2021 Q4 2021 Q1 2022 Q2 2022 Q3 2022 Average Median Days on Market 0 35 70 105 140 Q3 2021 Q4 2021 Q1 2022 Q2 2022 Q3 2022 Average vs Median Sales Price by Quarter $1.5M $3M $4.5M $6M Q1 Q2 Q3 Q4 2021 Average 2021 Median 2022 Average 2022 Median Closed Sales Volume by Quarter $20M $30M $40M $50M $60M $70M Q1 Q2 Q3 Q4 2021 2022 Carmel Highlands, Big Sur & South Coast
Monterey area saw a huge decrease in number of sales, landing at 55 compared with 70, 92, and 109 sales the three prior quarters. Even with fewer sales due to strong demand, average prices remain high at $1,288,004 down just 2% from Q2 2022. Total sales volume (dollars) is on pace to match 2020 and fall about 25% below the record year of 2021. This market, like most in our area, proves that while transactions and total sales dollars can decrease over 20% each, pricing remains strong.
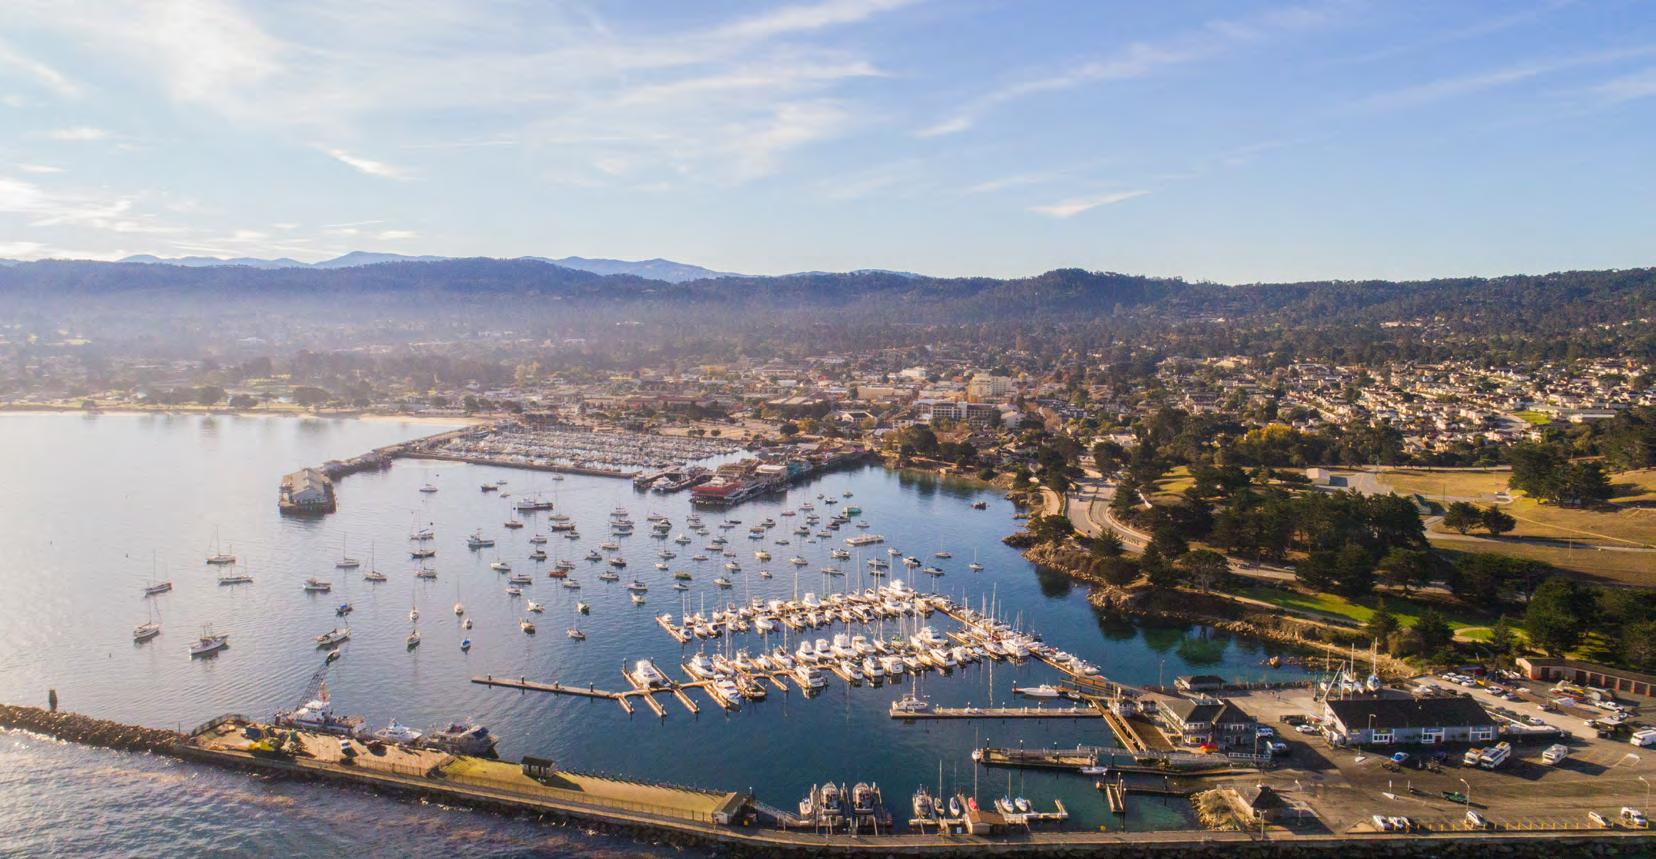
831.624.2300 montereycoastrealty.com Dolores and Seventh Carmel-by-the-Sea 16 5% 9% 29% 29% 27% <$800K | 15 $800K-$1.2M | 16 $1.2M-$2M | 16 $2M-$3M | 5 $3M+ | 3 MONTEREY MARKET UPDATE The
SALES BY SEGMENT SALES VOLUME AVERAGE SELLING PRICE UNITS SOLD DAYS ON MARKET $1,288,004 2% vs Q2 2022 11.1% vs Q3 2021 29 3.6% vs Q2 2022 31.8% vs Q3 2021 55 21.4% vs Q2 2022 49.1% vs Q3 2021 $70.8M 23% vs Q2 2022 43.4% vs Q3 2021
17 Q3 2022 MARKET REPORT Closed Sales by Quarter 50 65 80 95 110 Q1 Q2 Q3 Q4 2021 2022 Average vs Median Sales Price $800K $1M $1.2M $1.4M Q3 2021 Q4 2021 Q1 2022 Q2 2022 Q3 2022 Average Median Days on Market 15 20 25 30 35 Q3 2021 Q4 2021 Q1 2022 Q2 2022 Q3 2022 Average vs Median Sales Price by Quarter $850K $975K $1.1M $1.22M $1.35M Q1 Q2 Q3 Q4 2021 Average 2021 Median 2022 Average 2022 Median Closed Sales Volume by Quarter $60M $85M $110M $135M Q1 Q2 Q3 Q4 2021 2022 Monterey & Del Rey Oaks
Pacific Grove had a strong quarter compared to most other areas. The area was up in average sales price, units sold, and total volume versus last quarter. The price top in PG seems to have been met in Q1 of 2022, with the average sales price now floating just over $1.5M, up 1.6% from last quarter and up 3% from Q3 2021. 48 sales are the most we have seen in the area since Q3 of last year. With 25 active listings moving into Q4, Pacific Grove has a chance to replicate its strong Q3 next quarter. Given all of the volatile dynamics in real estate overall, this market is in a nice balance at this time.

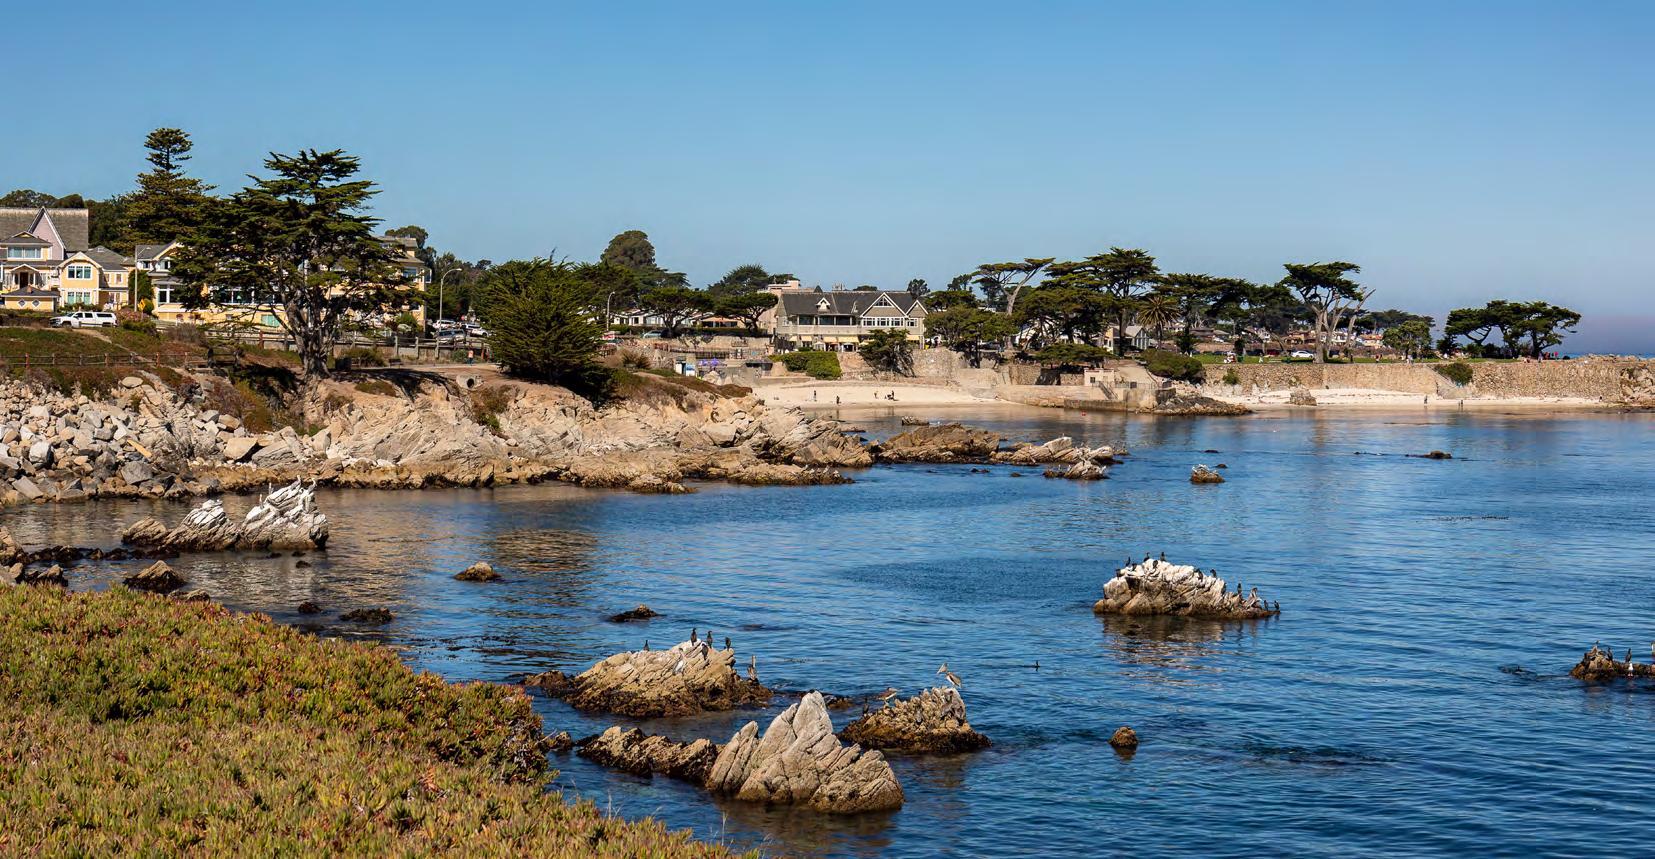
831.624.2300 montereycoastrealty.com Dolores and Seventh Carmel-by-the-Sea 18 PACIFIC GROVE MARKET UPDATE
SALES BY SEGMENT 4% 6% 52% 29% 8% <$800K | 4 $800K-$1.2M | 14 $1.2M-$2M | 25 $2M-$3M | 3 $3M+ | 2 SALES VOLUME AVERAGE SELLING PRICE UNITS SOLD DAYS ON MARKET $1,546,537 1.6% vs Q2 2022 2.9% vs Q3 2021 23 155.6% vs Q2 2022 8% vs Q3 2021 48 9.1% vs Q2 2022 25% vs Q3 2021 $74.2M 10.8% vs Q2 2022 22.8% vs Q3 2021
19 Q3 2022 MARKET REPORT Closed Sales by Quarter 20 30 40 50 60 70 Q1 Q2 Q3 Q4 2021 2022 Average vs Median Sales Price $1M $1.25M $1.5M $1.75M Q3 2021 Q4 2021 Q1 2022 Q2 2022 Q3 2022 Average Median Days on Market 0 10 20 30 40 Q3 2021 Q4 2021 Q1 2022 Q2 2022 Q3 2022 Average vs Median Sales Price by Quarter $1M $1.25M $1.5M $1.75M Q1 Q2 Q3 Q4 2021 Average 2021 Median 2022 Average 2022 Median Closed Sales Volume by Quarter $25M $50M $75M $100M Q1 Q2 Q3 Q4 2021 2022 Pacific Grove
a very strong Q2, Seaside slowed down in Q3. With interest rates on the rise and a fear of what may be to come, this lower priced market saw a pull back in both number of sales and average sales price. 42 sales are the lowest in the area over the past six quarters. Average sales price dropped 11% from Q2. In addition, average days on market jumped from 14 days up to over a month (36 days). Seaside has also seen inventory drop, showing sellers (in addition to buyers) may be turning more conservative in the lower priced areas.
831.624.2300 montereycoastrealty.com Dolores and Seventh Carmel-by-the-Sea 20 SEASIDE MARKET UPDATE After
SALES BY SEGMENT 7% 26% 50% 17% < $400K | 0 $400K-$600K | 7 $600K-$800K | 21 $800K-$1M | 11 $1M+ | 3 SALES VOLUME AVERAGE SELLING PRICE UNITS SOLD DAYS ON MARKET $768,941 11.3% vs Q2 2022 5.2% vs Q3 2021 36 157.1% vs Q2 2022 140% vs Q3 2021 42 20.8% vs Q2 2022 30% vs Q3 2021 $32.3M 29.7% vs Q2 2022 33.6% vs Q3 2021
21 Q3 2022 MARKET REPORT Closed Sales by Quarter 0 18 35 53 70 Q1 Q2 Q3 Q4 2021 2022 Average vs Median Sales Price $700K $750K $800K $850K $900K Q3 2021 Q4 2021 Q1 2022 Q2 2022 Q3 2022 Average Median Days on Market 0 10 20 30 40 Q3 2021 Q4 2021 Q1 2022 Q2 2022 Q3 2022 Average vs Median Sales Price by Quarter $600K $675K $750K $825K $900K Q1 Q2 Q3 Q4 2021 Average 2021 Median 2022 Average 2022 Median Closed Sales Volume by Quarter $20M $30M $40M $50M Q1 Q2 Q3 Q4 2021 2022 Seaside
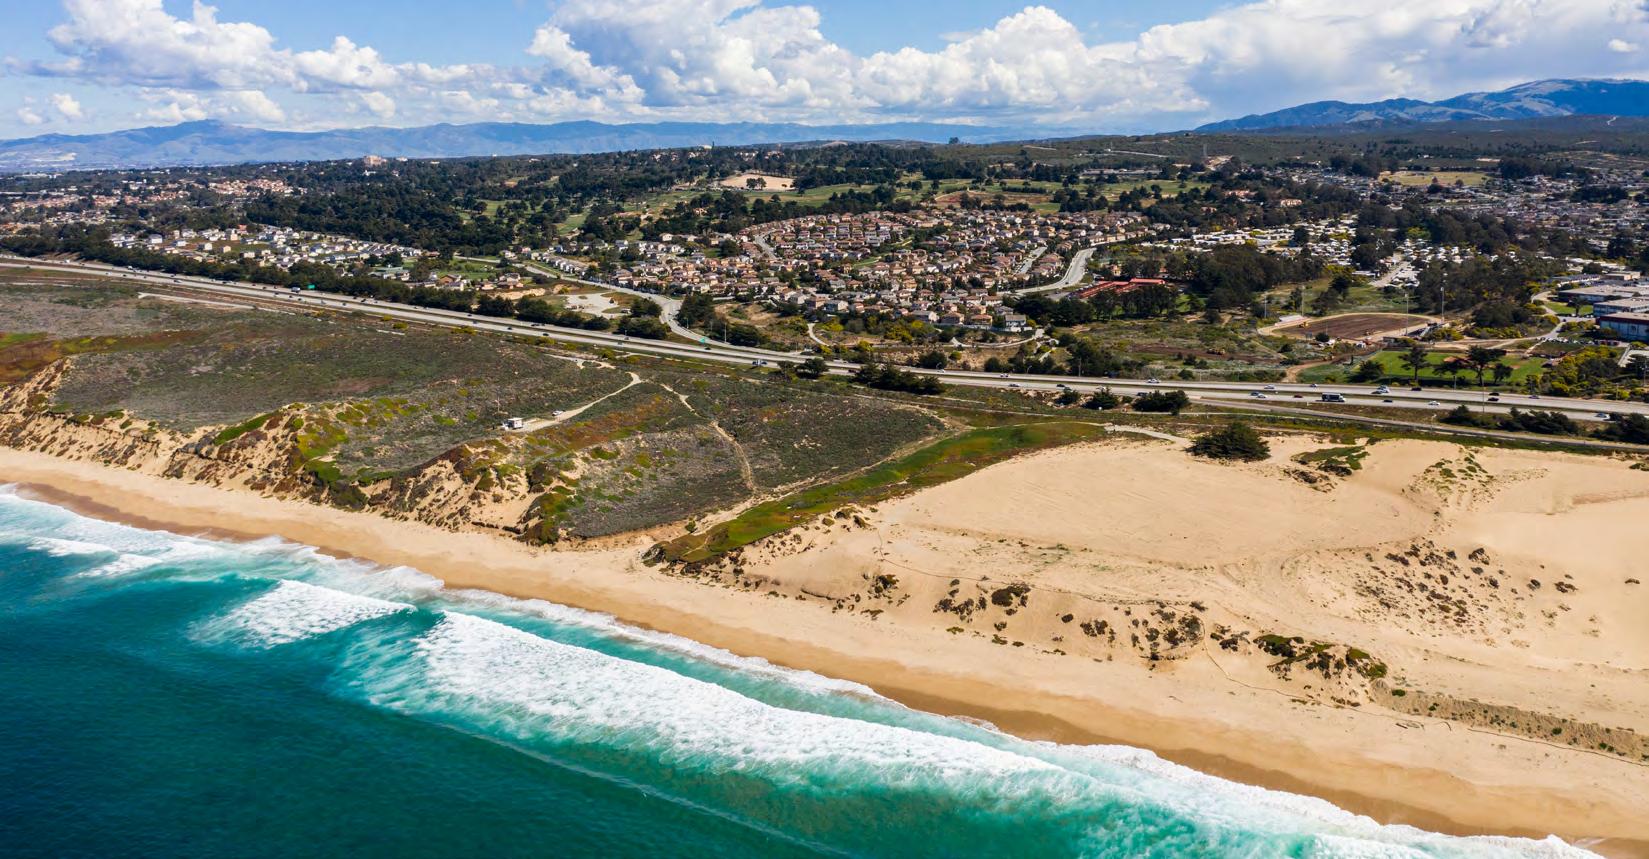
The Marina and East Garrison market saw a solid Q3, very similar to its numbers from last quarter. Average sales price ($874K) and median sales price ($849K) remained at the same level quarter over quarter. While 42 sales during the quarter was just 2 less than Q2, it was up from 34 in Q1. There remain 33 homes on the market at the end of the quarter. This is consistent with the end of Q2, and significantly up from most of 2021 when the number of active listings was regularly in the teens.

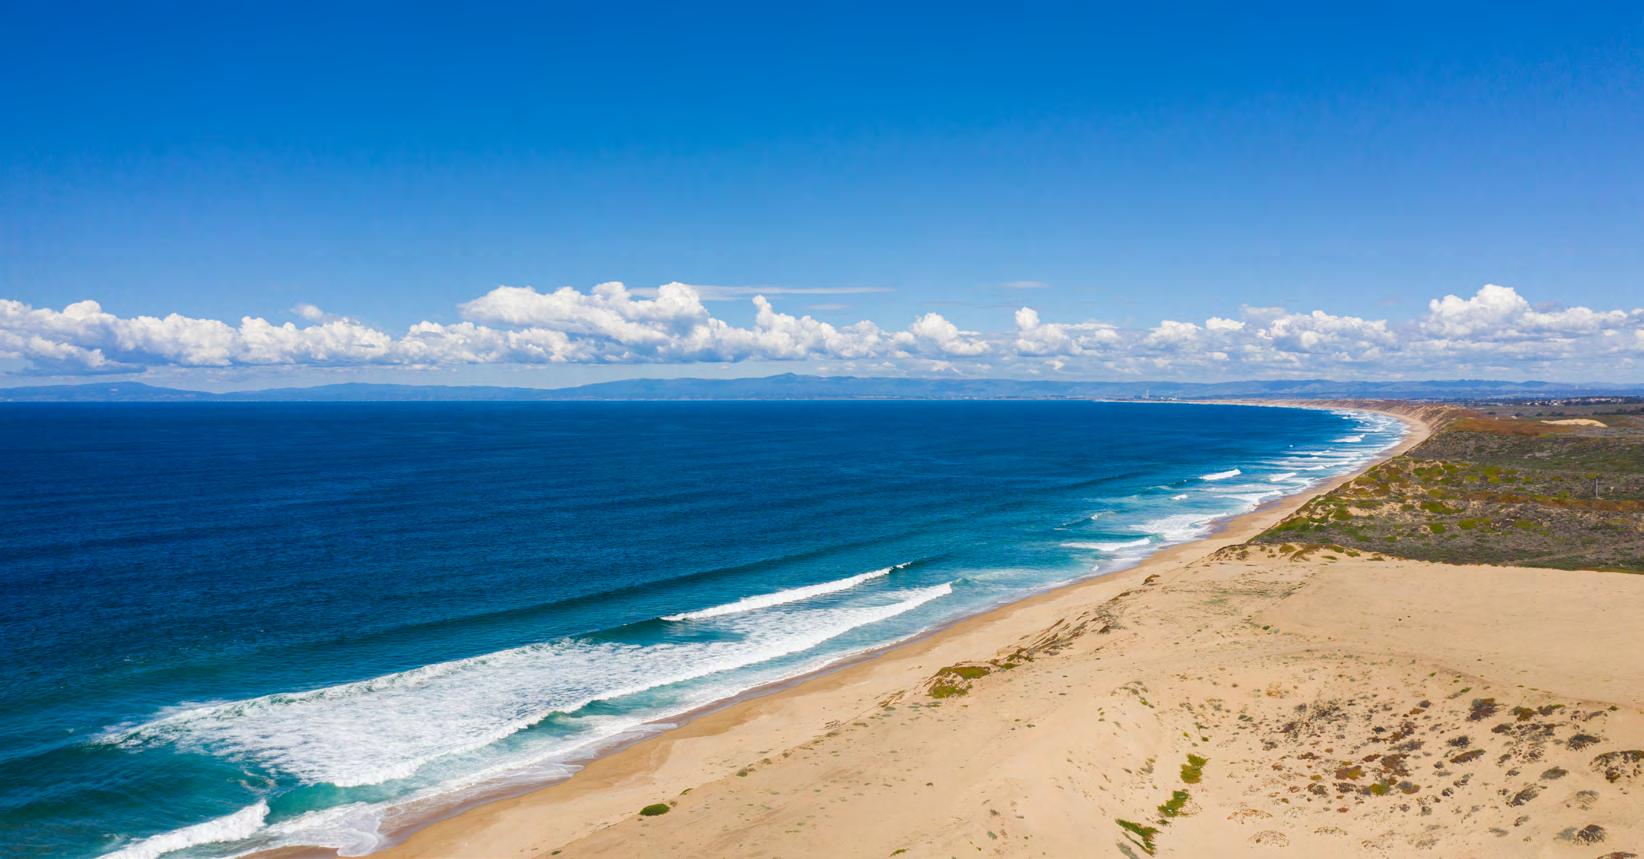
831.624.2300 montereycoastrealty.com Dolores and Seventh Carmel-by-the-Sea 22 MARINA MARKET UPDATE
SALES BY SEGMENT 5% 19% 45% 19% 12% <$600K | 5 $600K-$800K | 8 $800K-$1M | 19 $1M-$1.2M | 8 $1.2M+ | 2 SALES VOLUME AVERAGE SELLING PRICE UNITS SOLD DAYS ON MARKET $874,643 .1% vs Q2 2022 5.7% vs Q3 2021 32 77.8% vs Q2 2022 190.9% vs Q3 2021 42 4.5% vs Q2 2022 26.3% vs Q3 2021 $36.7M 4.5% vs Q2 2022 22.1% vs Q3 2021
23 Q3 2022 MARKET REPORT Closed Sales by Quarter 20 30 40 50 60 Q1 Q2 Q3 Q4 2021 2022 Average vs Median Sales Price $750K $800K $850K $900K Q3 2021 Q4 2021 Q1 2022 Q2 2022 Q3 2022 Average Median Days on Market 0 5 10 15 20 25 Q3 2021 Q4 2021 Q1 2022 Q2 2022 Q3 2022 Average vs Median Sales Price by Quarter $700K $750K $800K $850K $900K Q1 Q2 Q3 Q4 2021 Average 2021 Median 2022 Average 2022 Median Closed Sales Volume by Quarter $20M $30M $40M $50M Q1 Q2 Q3 Q4 2021 2022 Marina & East Garrison
Scherer