$1.25
your homegrown newspaper November 12, 2025
Vol. 22, No. 10
Take extra care driving twisty roads around lakes, mountains We mapped five years of Montana highway crashes. Here’s what jumped out at us. by Jacob Olness, Montana Free Press
Election results pg. 5
Theatre pg. 6
PEO donation pg. 7
I
n wide-open Montana, long drives on the highway are a way of life and, often, a source of danger. The state is ranked fifth for the number of fatal accidents per resident, with 90% of those fatalities happening on roads outside of city limits. Like many Montanans, MTFP’s staff puts in plenty of miles as we work to cover the state. On those drives, we sometimes wonder which stretches of the state’s vast highway network are the most prone to crashes. We analyzed public crash data from the Montana Department of Transportation to answer that question for the state and federal roads that connect Montana’s cities and towns. Statewide, the average crash rate on routes where MDT publishes traffic data is about 134 accidents per 100 million vehicle miles traveled. For drivers who put in 15,000 miles a year, that’s about one crash every 50 years. Among the takeaways is that interstates are generally less
FILE PHOTO
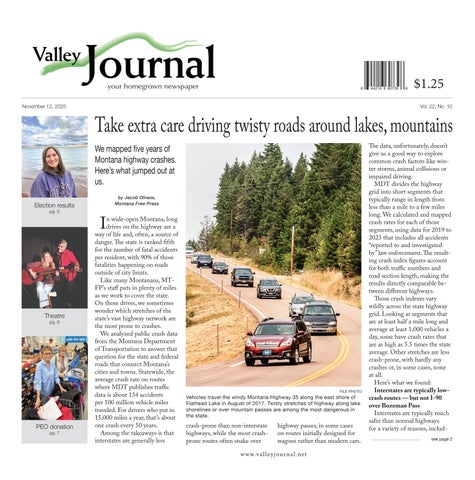
Vehicles travel the windy Montana Highway 35 along the east shore of Flathead Lake in August of 2017. Twisty stretches of highway along lake shorelines or over mountain passes are among the most dangerous in the state.
crash-prone than non-interstate highways, while the most crashprone routes often snake over
highway passes, in some cases on routes initially designed for wagons rather than modern cars.
w w w.va l le yj our na l.net
The data, unfortunately, doesn’t give us a good way to explore common crash factors like winter storms, animal collisions or impaired driving. MDT divides the highway grid into short segments that typically range in length from less than a mile to a few miles long. We calculated and mapped crash rates for each of those segments, using data for 2019 to 2023 that includes all accidents “reported to and investigated by” law enforcement. The resulting crash index figures account for both traffic numbers and road section length, making the results directly comparable between different highways. Those crash indexes vary wildly across the state highway grid. Looking at segments that are at least half a mile long and average at least 1,000 vehicles a day, some have crash rates that are as high as 5.5 times the state average. Other stretches are less crash-prone, with hardly any crashes or, in some cases, none at all. Here’s what we found: Interstates are typically lowcrash routes — but not I-90 over Bozeman Pass Interstates are typically much safer than normal highways for a variety of reasons, includ-
see page 2