$66.26B IN DEALS CLOSED
25,477 TRANSACTIONS 1,000+ AGENTS & EMPLOYEES


CONTRIBUTORS EXECUTIVES

PUBLICATIONS


$66.26B IN DEALS CLOSED
25,477 TRANSACTIONS 1,000+ AGENTS & EMPLOYEES
KEY FACTS AND FIGURES TO HELP INVESTORS NAVIGATE THE NEXT 12-MONTHS


MONTHLY JOB GAINS STILL POSITIVE BUT SLOWING SHARPLY
Source: BLS WAGES RISING FASTER THAN INFLATION
Source: BLS
UNEMPLOYMENT RATE RISING FROM RECENT LOW
Source: BLS
Source: BEA


RENT GROWTH BY PROPERTY TYPE
Source: CoStar Group Inc.; Forecast for 2024 and 2025

ESTIMATED HOUSING SHORTAGES VARIES GREATLY IN MAGNITUDE, BUT IS SIGNIFICANT
Source: NAHB, NAR, Zillow, Freddie Mac
SHORTAGE (UNITS)
5,000,000
4,000,000
3,000,000
2,000,000
THE HOUSING SHORTAGE HAS BEEN WIDENING SINCE 2016
Source: U.S. Census
Housing Inventory Households
DEMOGRAPHICS HIGHLIGHT FAVORABLE MULTIFAMILY CONDITIONS
Source: U.S. Census
SPREAD
Source:

BY SPENCER MASON

During the COVID-19 pandemic, lockdowns and restrictions meant that consumers spent significantly more time at home, leading to a surge in the reliance on e-commerce to obtain goods. As a result, e-commerce saw unprecedented growth, with global online sales increasing by 27% in 2020 alone, marking one of the sharpest yearly upticks in history. This growth spurred distributors to rethink their sales strategies, with as many as 84% of them projecting a shift to selling 100% of their product online in the future to align with changing consumer behaviors.
To keep up with this demand, distributors embarked on an aggressive expansion of industrial facilities, including warehouses, fulfillment centers, and distribution hubs, aimed at faster last-mile delivery

and reduced supply chain lag. Since 2020, over 1.8 billion square feet of industrial construction was added across the U.S., a record-breaking figure that doubled the average industrial space delivered in the years preceding the pandemic.
However, post-pandemic demand dynamics shifted, and the intense growth in e-commerce moderated as consumers returned to in-person shopping and supply chain issues began to stabilize. This deceleration in demand led to a cooling of industrial real estate activity, resulting in an uptick in vacancy rates. The industrial sector now faces the challenge of filling these vacant spaces that were catalyzed by the pandemic-driven e-commerce boom.
Source: U.S. Census Bureau

The surge in new industrial facilities built during the pandemic caused an oversupply, outpacing demand and keeping vacancy rates high. By year-end 2024, the national industrial vacancy rate reached 6.9%. This metric rose for nine consecutive quarters, with a 30-basis-point average increase month-over-month.
Tampa noted one of the highest vacancy rates nationally as it reached 5.6% at the end of Q3 2024—a level not seen in the market in over eight
years. The significant influx of new supply in Tampa outstripped absorption, with a notable -1.2 million square feet in absorption recorded during Q2 2024 alone.
Across the country, San Diego was also heavily impacted by the supply flood. At the end of Q3 2024, the market’s industrial segment noted a 10-year high vacancy rate of 7.6%, driven by a significant uptick in speculative construction and sublet space. Around 2 million square feet remains up for lease due to the new supply additions. Leasing activity for industrial facilities here is not expected to pick back up until the second half of 2025.


To balance the absorption rate of new industrial properties and adjust for softer demand postpandemic, construction starts have decreased significantly across the U.S. From 2022 to 2023, construction starts fell by more than 40%, with 341.9 million square feet breaking ground in 2023. At the end of Q3 2024, industrial square footage underway fell 43% from 2023. Only 90 million square feet of industrial space was delivered during Q3 2024, the lowest level of deliveries since Q2 2020, when completions totaled 86.9 million square feet.
Increased construction costs were a contributing factor to the decrease in industrial developments as well. As of March 2024, construction pricing grew 2.6% on a year-over-year basis; at the same

time, building costs jumped by 3.8%. The pricing for smaller-sized projects increased the most across the country, growing by 17% over 2023 costs and now averaging $142 per square foot.
The Denver market was strongly affected by the increase in construction costs. It currently stands as one of the most expensive cities to fund mediumand large-sized industrial developments. This pricing pressure, along with the abundance of new supply over the past decade, contributed to Denver’s vacancy rate of 7.6% at the end of Q3 2024, which is among the highest industrial vacancy rates nationally. Together with economic uncertainties, these factors contributed to a significant slowdown of new developments, allowing vacancy rates to normalize in the quarters ahead. With that said, smaller properties here have seen the highest level of absorption, with around half of new leases signed over the past year involving properties under 100,000 square feet.
U.S. CONSTRUCTION PIPELINE DOWN 37% FROM MID-2022 PEAK
Source: CoStar Group
Source: AZBigMedia | Q3 2024
Other West Coast markets have been instrumental in sustaining transaction velocity—particularly in California, which noted increased sales compared to other regions in the country. Los Angeles, specifically, ranked third nationally for sales volume as the market noted more than $2 billion in transactions over the past 12 months. Logisticsfocused properties—including warehouse and distribution, plus flex buildings—have been pivotal, with these properties trading at $330 and $400 per square foot, respectively. Following this trend, the largest sale for Los Angeles in 2024 was a warehouse facility that sold for $86 million, or $426 per square foot.
Although developments across the U.S. decelerated compared to the pandemic peak, construction activity is still high compared to historical standards. By the end of 2024, about 195.8 million square feet will be delivered, aligning with the pre-pandemic construction levels seen in 2019.
Phoenix is a market that stands out nationally for its active industrial development pipeline. Since 2021, around 90 million square feet of industrial space has been added to the metro, and an additional 36.8 million square feet is currently under construction. The new additions make Phoenix the most active market for industrial activity across the country. Many of the projects cater to larger properties that are greater than 100,000 square feet, contributing to the vacancy rate for industrial facilities in this category reaching 14.8% by Q3 2024.
E-commerce demand is on the rise again, with $288.8 billion in online sales occurring in Q3 2024, a 2.2% uptick from Q2 2024. This marks the seventh consecutive quarter of increased activity, translating to a sustained need for additional square footage for warehousing, distribution centers, and last-mile delivery facilities. The increase in sales activity for e-commerce will contribute to absorption metrics moving forward.
Similar to Amazon’s pandemic-era expansion, where the company secured large industrial spaces to meet growing demand, Amazon has recently leased over 1 million square feet across California and Arizona, pushing absorption levels up more than 30% compared to 2023. In line with this growth, Amazon has increased its warehousing and storage workforce, adding 10,700 employees in July 2024. This hiring boost parallels the spike in employment seen when Amazon expanded its footprint during the pandemic, signaling that the e-commerce resurgence is driving both square footage demand and employment in the industrial sector.
Beyond e-commerce, data center demand is also aiding industrial absorption, driven by the growth in artificial intelligence (AI). For example, in June 2024, OpenAI announced that it would rent out a space in Abilene, Texas that would be capable of delivering up to one gigawatt of power by 2026.
Phoenix is set to benefit from similar data center growth, with data centers comprising 18% of the existing industrial market inventory. Stream Data Centers is developing four new facilities in Goodyear, adding 403,000 square feet by August 2025. This expansion is anticipated to boost absorption rates, reducing vacancy in the Phoenix industrial market and strengthening its position as a key data center hub.
Another Texas market that has seen increased industrial absorption is Dallas-Fort Worth. Since 2020, big bomber industrial properties made their way into the metro, and now make up 118 facilities. These sites are over 500,000 square feet, and
are favorable because of their long-term leasing capabilities. Google is one tenant that was enticed by these spaces in the metro. Over the last six months, the firm took up more than 2 million square feet in two leases.
Apart from recent trends boosting leasing demand for industrial spaces, construction activity is expected to taper by mid-2025, which should begin to balance leasing activity with the supply wave left over from recent years. New addition activity nationally was noted at 147 million square feet during the second half of 2023 and has continued to fall since then. By the end of 2025, industrial construction is expected to note a 10-year low.
RETAILERS LEADING
E-COMMERCE ACTIVITY IN 2024
Source: Statista
SPENCER MASON spencer.mason@matthews.com (303) 418-8668


– Providing CRE professionals with the competitive edge they need to grow their businesses.
GlobeSt.com — the premier online destination for original and timely commercial real estate content. We deliver trusted, relevant real-estate news and insights along with visionary thought leadership, effectively providing our audience with a 360-degree view of the industry.
Our trusted team of industry experts is dedicated to delivering the key insights, in-depth analysis, and proven best practices essential for commercial real estate owners, investors, developers, brokers, and finance professionals. We’re here to celebrate innovation and success, providing our readers with digestible, actionable information that transforms complex trends into real-world applications—ensuring you stay ahead of the curve.

GlobeSt.’s vibrant event portfolio features a mix of local and national forums tailored to tackle the most pressing challenges across sectors like Healthcare, Multifamily, Net Lease, and Women of Influence. Connect, network, and learn from industry leaders in an inspiring environment designed to drive your business forward. Don’t miss out on your chance to navigate the future of commercial real estate with confidence!
Reaching more than 300,000 CRE professionals across all markets, sectors and business disciplines, GlobeSt.’s unique integrated business model allows us to deeply understand the dynamic real estate industry and the evolving needs of our audience. Join our community today!
BY
ANDREW MARCUS • GREGORY K. KAVOKLIS • CURTIS KAUFMAN
DAVID TREADWELL • CLARK FINNEY

Lenders and investors are entering 2025 after navigating a tumultuous and uncertain environment shaped by various economic and political factors. The recent presidential election introduced significant shifts in expected government policy, coinciding with the Federal Reserve beginning an interest rate-cutting cycle. In 2024, the market was dominated by extend-and-pretend practices, allowing investors to retain assets without facing the strain of refinancing at elevated interest rates. However, the New York Fed has expressed concerns that banks and lenders may not sustain this approach much longer without assuming substantial risk.
Despite these challenges, bank balance sheets and reserve holdings have improved significantly since the Silicon Valley Bank and First Republic Bank collapses. Federal Reserve officials are confident the industry could weather a recession without major disruptions or failures. While banks are positioned to handle loan extensions into 2025, this strategy constrains economic growth and limits lenders’ capacity to expand operations. Extending terms on struggling office assets in major cities perpetuates a mismatch between tenant demand and the financial system’s investment focus. Rising property delinquencies, particularly in the office and multifamily sectors, suggest that lenders may soon redirect capital toward new opportunities rather than continuing to extend existing agreements.
Although much of the media discussion around commercial real estate loans focuses on banks, investors should diversify their capital sources to maximize value. Bank lending accounted for just 31% of the 2024 lender pool, down from 44% in 2022, reflecting a long-term trend. The number of U.S. commercial banks decreased by 70% since 1984, dropping from 14,400 to 4,375 by 2020. Heightened scrutiny of risk management at large and midsized banks has led many top players to scale back CRE lending, making non-bank financing increasingly beneficial for investors to stay aware of.
This reduction in bank lending has created opportunities for alternative capital sources. Life insurance firms have captured the largest share of annual growth, while other alternative lenders expanded significantly, providing crucial liquidity for investors in a shifting market.

Credit unions offer several advantages for CRE investors, providing competitive rates and more flexible loan terms than many other lenders. They often work closely with investors to establish repayment periods and down payment requirements that suit both parties. Credit unions are particularly beneficial for private investors building their portfolios, as they prioritize direct relationships, offering guidance on risk, costs, and general investment principles.
Regional credit unions typically focus on smaller deals in secondary and tertiary markets, often under $10 million, though the largest credit unions can support larger transactions. This makes them ideal partners for investors targeting single-tenant retail properties, though they also fund a variety of asset types. However, as smaller firms with less overall capital compared to national or international banks, credit unions often require higher loan-to-value ratios from borrowers.
Unlike larger banks, credit unions tend to operate within specific metros or states, which can shield them from exposure to underperforming office assets in major cities like New York and Chicago. This localized approach reduces the risk of failure tied to distressed assets, making many credit unions a reliable choice for investors.
Heading into 2025, credit unions are in a strong financial position. As of Q2 2024, total U.S. credit union assets rose 3.5% year-over-year, positioning these lenders to increase activity after a cautious approach in 2023 and 2024. U.S. CRE LENDING
Source: Matthews Real Estate Investment Services™, Real Capital Analytics

Once again, Life Insurance Companies have increased their CRE lending market share to account for the pullback in bank lending in 2024, growing from 9% in 2020 to over 14% in 2024. These firms are looking for stable income streams for their accumulated capital and, for this reason, often offer very competitive interest rates for investors. While traditionally lenders for well-located and institutionalgrade deals, the general slowdown in market activity has resulted in these lenders expanding the scope of deals they provide capital for. Beyond long term fixed loans, this once again includes construction, bridge, and joint venture developments.
Life-insurance firms have been operating with near-record levels of net investment capital and revenue since 2022, with many of the major players recording substantial growth in 2024. These companies need to find a productive use for their capital, and increasingly, are choosing to lend on CRE assets. While the major players (think Insurance Companies advertising at PGA events) are taking down larger class “A” transactions, smaller correspondent Life Insurance Companies are lending Billions in the one million dollar to twenty million dollar transaction space. Matthews is proud to be an active correspondent and loan servicing partner with several of these active lenders across the product type spectrum.
2025 is projected to be another strong year for the insurance industry, both large and small. Having limited exposure to CRE relative to their overall investment totals, these lenders are of low risk of facing a credit pinch due to the scheduled debt maturities in 2025. With banks continuing to face scrutiny, and uncertainty about the future of bank regulations in the United States, insurance lenders will continue to fill the void left in the market just as they did during the financial crisis and other historical times of uncertainty.
Government Agencies supply CRE loans to foster investment and smooth the wheels in the housing market. The most active government lenders are Fannie Mae and Freddie Mac, but the Department of Housing and Urban Development and Small Business Administration also have programs for CRE lending. These programs often offer some of the most competitive interest rates available to investors, but also come with government oversight and more stringent lender requirements and maximums. Greencertified and affordable housing buildings are also eligible for additional cost relief.
Agencies have pulled back significantly from lending levels in 2021 and 2022, while maintaining a roughly even share of total CRE lending. The result is a build-up of available capital earmarked for CRE entering 2025. This capital is likely to target primarily multifamily deals, but also sub-categories of housing, like seniors and student housing. Once interest rates fall to a sufficient level to spark deal flow, agency capital will aid deal flow greatly over the next 12 months.
With dry powder targeting CRE near record levels, government agency debt could play a massive role in growing the transactions market next year. The buildup in available debt, in tandem with large investment firms getting ready to move off the sidelines, suggests capital may rush into the multifamily market once interest rates are sufficiently low and deals begin to pencil. If Fannie Mae and Freddie Mac are privatized or deregulated, as Trump’s team has suggested may occur, it will likely spur even more available capital to enter the market, providing upward pressure on deal volume and prices for CRE assets, however, privatization could also lead to higher lending costs.
In 3Q 2024, agency lending to multifamily CRE rose 40% quarter-over-quarter, highlighting how quickly agency capital could rush into transaction markets in 2025.
With the Federal Reserve beginning rate cuts in September 2024, investors should closely monitor Fed statements and expectations throughout 2025. The forward-looking SOFR curve has fluctuated, with December 2025 rate projections ranging from 2.5% to 4.5%. The Fed’s trajectory will largely depend on economic data over the year. If inflation continues its retreat toward the 2% target and unemployment rises, the Fed is likely to accelerate its rate-cutting cycle. However, the terminal rate at the end of this cycle is expected to remain significantly higher than the near-zero levels seen during the 2010s. While the “free money” era has ended, even modest rate cuts from current levels could unlock more opportunities for both buyers and sellers.
Despite consecutive Fed rate cuts, long-term Treasury yields spiked following the 2024 election, raising questions about the relationship between the two rates. While the Federal Overnight Rate influences the yield on 5- and 10-year Treasuries, other factors, such as economic conditions and investor sentiment, also impact Treasury yields and, by extension, CRE borrowing costs. Most CRE loans are tied to the 10-year Treasury, with lenders adding a premium to account for risk. Although the spread between Treasury yields and CRE interest rates has narrowed as lender confidence improves, rising
MARCUS andrew.marcus@matthews.com (646) 298-3027
Treasury yields have kept borrowing costs elevated despite falling spreads.
The increase in Treasury rates reflects renewed optimism about U.S. economic growth following the election. Investors view Trump’s victory as a catalyst for expansion, prompting capital to flow away from safe assets like Treasuries into growth-oriented investments, such as stocks and real estate. This shift has driven long-term yields higher. If the economy shows robust growth early in 2025, lending rates will remain elevated. Conversely, a softer growth trajectory with modest job gains could help keep rates lower. Either way, borrowing costs for CRE are likely to decrease as interest rates decline, though the timing of sustained downward pressure remains uncertain.
Several factors are aligning in 2025 to support a strong year for CRE lending and activity. On the lending side, the Federal Reserve’s rate-cutting cycle and narrowing lender spreads from the over-200basis-point levels seen in 2023 and early 2024 are reducing borrowing costs. These trends are making more deals financially viable for investors. Unless an unexpected economic disruption occurs, CRE markets are positioned for increased deal volume, rising prices, and compressing cap rates throughout 2025. This outlook is supported by The Mortgage Bankers Association, which forecasts a sharp rise in CRE lending over each of the next two years.
curtis.kaufman@matthews.com (916) 798-9048


For Kyle Matthews, life as a CEO, founder, and devoted father of four—ages 3 to 14—is a masterclass in dedication, discipline, and heart. Kyle’s success is rooted in his early career, where he frontloaded countless hours of hard work and perseverance to build a solid foundation. As the CEO and Founder of Matthews Real Estate Investment Services™, Kyle’s journey is one of building not just a company but a legacy, all while fostering a vibrant and loving family life.


With over 1,000 employees spanning 30 offices nationwide, Kyle’s leadership is as dynamic as his personal life. From the boardroom to the sidelines of his kids’ sports games, he shows that success isn’t about choosing between career and family—it’s about giving your all to both. Whether he’s coaching his kids’ teams, attending their events, or leading strategy sessions at the office, Kyle exemplifies the power of showing up fully and consistently.
Here’s a sneak peak of a typical day of Kyle Matthews:


4:45 AM
coffee,
he dives into the Wall Street Journal, Financial Times, and Bloomberg, sharpening his mind with market insights and industry trends.
5:45 AM - 6:15 AM

It’s time to wake the kids for school!
6:15 AM - 7:00 AM
family heads out.
Kyle enjoys this moment to connect with his son during the school drop-off, teaching him valuable life lessons about hard work and commitment.
7:30 AM
Unless he’s coaching a sport, Kyle is focused on work during this time, navigating meetings, strategy sessions, and daily operations.
If it’s game day, he leaves the office early, working from his cell in between proving that flexibility and commitment can coexist.
6:30 PM - 9:00 PM
THROUGHOUT THE DAY
The alarm goes off. Kyle arises early with the belief that waking up early positively impacts his physical health, mental well-being, and productivity.
4:45 AM - 5:45 AM
A quick shower and morning routine help Kyle center himself and mentally prepare for the busy day ahead.
6:15 AM
Together with his wife, Kyle gets the kids ready, ensuring they have everything they need for the day.
7:00 AM
After dropping his son off, Kyle arrives at the office, ready to tackle the day.
7:45 AM - 6:00 PM


After coaching, Kyle returns home, almost always in time to enjoy dinner with his family. When dinner is over, Kyle reads a book to his daughters, creating a cozy bedtime routine for them. After tucking them in, he spends same quality time wrestling with his 3-year-old and helping his 14-year-old with homework.
He makes sure to fit in a workout, practicing combat sports like boxing, kickboxing, and jiu-jitsu to stay energized and focused. These combat sports not only keep him physically fit but mentally sharp and resilient.


Atlanta’s multifamily vacancy rate has spiked from 5.5% in Q3 2021 to 12.5% as new Class A supply hits the market. Although demand has rebounded over the past five quarters, the influx of new units has outpaced absorption, leading to elevated vacancy levels and declining rents.
Class A properties have faced steep rental declines, with rents for luxury properties down by 3% yearover-year, notably in hotspots like Buckhead and Midtown. Concessions have become common, with some properties offering up to two months of free rent to remain competitive.
Rising interest rates and oversupply have led to a slowdown in multifamily sales and new construction, with Atlanta seeing nearly 50% fewer groundbreakings over the past year. Nonetheless, major players continue to invest selectively, with national firms increasingly betting on long-term growth in high-demand areas.
Atlanta’s extensive eviction backlog, averaging 10 months in Fulton County, has led to inflated occupancy rates. New measures were enacted in early 2024 to expedite evictions and alleviate delays, yet backlogs in DeKalb and Gwinnett counties persist as challenges for property owners.

Nashville’s multifamily market has seen a surge in new construction, with 13,000 units added in the last year, far exceeding the 10-year annual average of 7,400. While demand remains high, with nearly 12,000 units absorbed, it has struggled to keep up with supply, causing vacancy rates to rise, especially in areas like Downtown Nashville. However, when excluding new units yet to stabilize, the vacancy rate is significantly lower.
As the market absorbs new supply, rent growth has cooled, declining by 0.9% over the past year, a sharp shift from previous years of rapid growth. However, rents have shown signs of stabilization in 2024, with an increase of nearly 2%.
Rising interest rates have slowed down new construction, leading to a dip in 2024 starts, dropping to their lowest level since pre-pandemic years. This slowing pipeline is expected to ease the supply pressures by late 2025, possibly leading to a more balanced market.
Nashville’s robust population growth, up 27% since 2010, and its strong job market, driven by industries like healthcare and technology, continue to attract demand. Major employers, including Oracle and Amazon, are expanding in the area, supporting long-term multifamily investment and tenant demand.
A SLOWDOWN IN CONSTRUCTION STARTS WILL ALLOW FOR DEMAND TO CATCH UP IN NASHVILLE
Source: CoStar Group

Increased Vacancy
Multifamily vacancy rose to 8.1% as Louisville saw record-level deliveries in the first three quarters of 2024, exceeding demand and marking the highest vacancy rate since late 2020.
Stabilizing Rent Growth
Despite recent declines, Louisville’s rent growth remains strong compared to other major U.S. markets, averaging 3% in 2024. Rent growth deceleration is anticipated to stabilize as construction slows in the coming months.
Southern Indiana, encompassing a significant portion of Louisville’s demand with a 42% share of 12-month net absorption, saw rapid inventory expansion, contributing to a higher vacancy rate of 13%.
Due to rising interest rates, construction starts have decreased significantly, which is expected to reduce delivery rates by nearly 50% in 2025, easing vacancy and supporting market stabilization.

While select submarkets of Birmingham boast strong occupancy, the broader market’s vacancy rate currently sits at 10.1%, above the national average of 7.8%. Although demand has been consistently stable, absorption of nearly 875 units over the past year hasn’t kept pace with the 1,092 new units delivered.
Rent growth has slowed but remains positive, with rents rising around 0.5% over the past year. Average rent remains affordable at $1,232 per month, below the national average of $1,710.
New construction starts remain active, with 1,644 units under construction or pre-leasing. The Downtown Birmingham area continues to lead in construction, partly driven by vacant office and industrial spaces being converted to multifamily units.
Sales activity has picked up but is down overall, with a 12-month total of $298 million, approximately half of the 10-year annual average. High interest rates and low rent growth have widened bid-ask spreads, impacting investor pursuit.
THE NUMBERS | 2024
CONSTRUCTION 1,644 units NET ABSORPTION 875 units DELIVERED 1,092 units
PRICE/UNIT $128,448
Kings County (Brooklyn), NY
Indian River County (Vero Beach), FL
Charlotte County, FL
Monterey County, CA
Riverside County, CA
Summit County (Akron), OH
Wayne County (Detroit), MI
Cuyahoga County (Cleveland), OH
Pulaski County (Little Rock), AR
Jefferson County (Birmingham), AL
West

Renter demand was strong in 2024, with nearly 6,200 units absorbed over the year. However, the introduction of 9,325 new units led to an oversupply, pushing the vacancy rate to 13.4%. This trend mirrors national patterns, where record-breaking new deliveries have outpaced steady but insufficient demand. Encouragingly, a weakened new delivery pipeline, strong job growth, and unemployment rates are expected to drive increased absorption and push rent growth over the next year.
Jacksonville’s multifamily rent growth, which peaked at nearly 20% in late 2021, has declined to -2.5% as of late 2024 due to a saturation of new hightier units. However, Jacksonville’s rent growth is expected to rebound by mid-2025, rising to 5.6% by January 2026. This positions Jacksonville as one of the strongest-performing markets in the U.S., with rent growth surpassing the national year-over-year Class A average of 2.4% and competing with top-tier
markets such as Tampa, Las Vegas, and Raleigh, which are projected to see increases between 4.0% and 5.7%.
After five years of rapid expansion, Jacksonville’s multifamily market saw a 50% drop in new construction starts in 2024, signaling the peak of its supply wave. The construction focus remains in highgrowth areas as the market begins to absorb new deliveries. This noticeable construction pause will benefit owners and developers in the North Florida market as supply constraints start to happen in late 2025.
Multifamily investment in Jacksonville has softened, with sales volume declining by over 20% to $734 million as of late 2024. The drop was largely driven by previously high insurance costs and elevated interest rates. Insurance costs have started to decline significantly over the past six to nine months, and interest rates have stabilized, offering some relief to the market. The lack of new deliveries projected in the coming years is warming up investor interest as predictions of supply constraints are on the horizon.
Source: CoStar Group

Since mid-2023, Fort Lauderdale has seen a surge in multifamily demand, with over 3,600 units absorbed in the past year, outpacing the five-year quarterly average.
Submarkets with lower rents like Oakland Park/ Lauderhill and Hollywood/Dania Beach, are seeing impressive rent gains as residents seek affordable alternatives to high-priced central locations. This trend highlights Fort Lauderdale’s growing rent disparity, with a significant mismatch between affordable housing demand and supply. As a result, rents for more affordable units are expected to outpace luxury apartments.
Developers are on track to deliver a major wave of apartments, with Fort Lauderdale’s pipeline among the largest in Florida. Central Fort Lauderdale, Hollywood/Dania Beach, and Pompano Beach/ Deerfield Beach will account for 70% of new inventory, and much of it is concentrated in luxury units.
Investor interest remains strong, but higher cap rates and moderating fundamentals are impacting sales activity, with $1.4 billion in sales over the past year, down from a five-year average of $2.5 billion.
Recent sales include notable high-value transactions, underscoring the premium placed on newer, lowvacancy properties even as older assets trade at discounts.
3,629
Source: CoStar Group

In 2024, Tampa shattered records with 10,500 multifamily units completed by September, far surpassing the previous 8,200-unit record set in 2022. Despite rising renter demand, vacancies hover at 10% as the city faces a significant oversupply. Areas with concentrated new construction, like Pasco County and Southeast Tampa, are seeing vacancy rates as high as 18%–a sign that Tampa’s multifamily supply surge may take a couple of years to stabilize.
Tampa’s average monthly asking rent dipped below $1,800 in 2024 for the first time since mid-2022 (it has since increased), reflecting intense competition for renters. Premium Class A properties have seen a -0.4% reduction in rents as concessions like free rent and waived fees become widespread. This pricing pressure illustrates how Tampa’s market oversupply is reshaping landlord strategies in favor of tenant incentives.
BY THE NUMBERS | 2024
Multifamily investments in Tampa reached $1.8 billion over the past year, with landmark sales like the $144.5 million Lantana and Sage at Cypress Bay acquisition. Premium properties, such as The Pointe on Westshore, saw price tags well above market averages, reflecting investor confidence in centrally located assets despite an oversupplied market. Stabilizing cap rates suggest steady value as the market navigates these historic levels of supply.
Population growth and a resilient economy have bolstered Tampa’s multifamily sector, even as vacancy remains elevated. Hillsborough and Pasco Counties saw significant population inflows, adding around 46,000 residents collectively from 2022 to 2023. With a stable job market and new households settling, demand for housing is likely to increase, offering potential for occupancy and rent recovery as the multifamily supply pipeline stabilizes in coming years.
Source: CoStar Group

Cleveland’s multifamily market is tightening after a challenging period with the highest vacancy rates in two decades. Vacancy reached 8.3% due to weak demand and slow income growth, especially affecting mid- to low-income renters. But 2024 brought a surprising twist–net absorption rose to 950 units in the first half of the year, 26% above pre-pandemic averages, largely driven by high-end units.
Rent growth in Cleveland surged in 2024, reaching 3.2% over the past 12 months, placing Cleveland at the top of U.S. apartment markets for rent growth. Southeast and Northeast submarkets set records, with Class C rents climbing 3.8%, above the prepandemic average, and Southeast rents spiking to 6%. As younger renters re-enter the market, these mid-priced segments support a steady rental upswing despite high vacancy rates in some areas.
Downtown Cleveland is the epicenter of multifamily growth, with 35% of recent deliveries centered here. New projects, like the City Club Apartments and the Silverhills at Thunderbird development, fuel a housing surge that attracted over 500 new residents in the past year. With 1,600 units under construction, Downtown Cleveland is well-positioned to meet demand.
Cleveland’s transaction landscape is shifting as high borrowing costs deter larger investors. Sales volume fell 80% below pre-pandemic levels, leaving a window for private buyers targeting value-add opportunities. As institutional investors hold off, private players are driving the market forward, focusing on affordable multifamily assets in highdemand neighborhoods.
Source: CoStar Group

Unlike many national markets facing high vacancy rates and slowing rental demand, Chicago stands out with a well-balanced multifamily sector–a steady 5.3% vacancy rate, 2.4% year-over-year rent growth, and a low 1.3% of its total inventory under construction. This disciplined growth model keeps rent and occupancy rates stable, particularly in highdemand areas like Downtown and the North Lakefront.
Chicago’s multifamily investment market continues to draw attention, particularly for workforce housing, which has seen gains up to 3.5% year-over-year. The region’s solid occupancy and controlled luxury housing supply are pushing cap rates upward, attracting entities like San Francisco-based FPA Multifamily, which recently acquired nearly 2,000 units.
Fuel Downtown Transformation
Policy shifts and innovative programs like Mayor Brandon Johnson’s “Cut the Tape” are driving Chicago’s downtown transformation, repurposing over 3 million square feet of vacant space in the Central Loop. Despite challenges like the Affordable Requirements Ordinance (ARO) affecting new multifamily builds, strategic redevelopments are revitalizing the urban core. Ongoing projects, such as converting former mall anchors into housing, signal a promising economic and urban resurgence.
Amid National Headwinds
Chicago’s diversified economy is fueling job growth in manufacturing, education, and health services, supported by major firms like Mondelez and Mars. Despite challenges in office-dependent sectors, the city’s top-rated logistics and transport networks maintain its appeal as an investment hub. Recognitions like Site Selection’s top metro area ranking and Fitch’s credit rating upgrade highlight Chicago’s resilience and business potential.
BY THE NUMBERS | 2024
CHICAGO’S HISTORICALLY TIGHT VACANCY AND BUILD RATES SHOULD PRESERVE ITS RENT GROWTH MOMENTUM INTO 2025
Source: CoStar Group

Historic Demand and Shrinking Vacancy Rate
Minneapolis’ vacancy rate dropped from 8.4% to 7.5% in 2024, spurred by record-breaking demand and a stark slowdown in new construction. Despite substantial supply growth over recent years, demand still outpaces supply in some areas.
A Shifting Demand Landscape
Downtown Minneapolis continues to face high vacancy rates, especially in areas outside the North Loop, with safety concerns and structural changes in work patterns affecting demand. Conversely, suburban areas show strong growth, with lower vacancy rates and stable rent growth, driven by demand for spacious, affordable, and walkable living environments.
BY THE NUMBERS | 2024
Despite substantial supply growth, Minneapolis’ annual rent growth has held steady at 0.9%.
Suburban areas, particularly outer-ring submarkets, continue to show resilience with stable rent growth, attracting renters looking for affordability and amenities.
Minneapolis’ multifamily sector is showing signs of stabilization in transaction volumes, with strong demand for suburban properties. However, downtown areas face deeper price cuts amid high vacancies and economic uncertainty, illustrating a bifurcated investment landscape that may persist until core urban rents recover.
MINNEAPOLIS/ST. PAUL ARE IN GROWTH MODE, WITH POPULATION AND HOUSEHOLD INCOMES ABOVE THE NATIONAL AVERAGE
Source: CoStar Group

Apartment Vacancy Surges
Amid Record-Breaking Pipeline
Denver’s multifamily market is grappling with an unprecedented supply pipeline, pushing vacancy rates to a striking 10.79%. The metro Denver area currently has 34,332 units under construction, part of a total pipeline of 91,433 units, which includes pre-development projects. Deliveries for 2024 yearto-date have reached 14,764 units. Despite a slight drop in vacancy compared to the previous quarter, the sheer volume of supply continues to outpace demand, particularly in the City of Denver, where much of the activity is concentrated.
Sector
Oversupply, While Affordable Rents Rise
The luxury apartment segment (Class A), which constitutes 75% of Denver’s development pipeline, has seen vacancies soar to 13%. These properties are under significant pressure to attract tenants, leading to widespread concessions, including up to two months of free rent and cash incentives. Conversely, the affordable housing market faces tight supply, resulting in stable rent growth even as
the overall rental market remains relatively stagnant, with year-over-year growth of just 0.4%, according to Apartment Insights.
Signal Resilience
Despite challenges, there are signs of resilience in the market. Denver posted record net absorption of 5,286 units in Q3, marking the highest quarterly figure ever recorded. Over the past 12 months, the metro has achieved 11,870 units of net absorption, the best performance in 10 quarters. These absorption figures suggest a potential rebound in migration to the area, bolstering optimism among market participants.
The investment landscape is shifting as construction starts slow and transaction volumes remain below historical averages. From Q4 2023 to Q3 2024, sales volumes for properties with 5-150 units totaled $692 million, reflecting a cap rate of 5.75%. The average price per unit was $212,266, with an average price per square foot of $281. Private investors are increasingly targeting smaller, more affordable properties as institutional activity declines, reshaping the profile of Denver’s multifamily buyers.

Phoenix Rental Demand Rebounds
Amid Economic Optimism
A resurgence in consumer confidence and lower inflation have revitalized demand in Phoenix’s rental market, with net absorption reaching 18,000 units over the past year–well above pre-COVID levels. This uptick, particularly benefiting mid-priced properties, signals an ongoing recovery in tenant demand despite an overall vacancy rate of 11.0%.
Supply Surge Overshadows Rent Growth
Over 22,000 new units delivered in the past year have significantly impacted Phoenix’s rent growth, pushing average rents down by 2.4%. The focus on luxury properties has heightened vacancy challenges, while mid-priced and affordable properties remain relatively insulated from oversupply pressures.
Construction Pipeline Remains a Double-Edged Sword
Phoenix’s multifamily market faces a substantial construction pipeline, with 27,000 additional units underway, representing 6.7% of inventory. While this survey meets demand from a growing population, the sheer scale of new development has intensified competition, especially in areas like Downtown Phoenix and Tempe.
Investment Landscape Shifts with Rising Interest Rates
Rising interest rates and softer rent growth have dampened multifamily investment activity in Phoenix, with a marked 75% drop in sales volume. Recent property transactions reveal value declines as high as 30%, reflecting the market’s recalibration amidst higher financing costs and investor caution.
Source: CoStar Group

Despite a rapid influx of new apartments, tenant demand in Northern New Jersey has surged, with nearly 6,000 units absorbed in 2024. The Base Case forecast projects an additional 1,800 units by yearend, marking a new annual record as demographic trends and population growth sustain the region’s multifamily strength.
Northern New Jersey’s multifamily boom is heavily skewed toward luxury units, with Class A properties comprising over 70% of new construction. While upscale apartments continue to grow, vacancy rates in this segment remain elevated, highlighting oversaturation and affordability concerns.
Proximity to mass transit has driven multifamily investments near train hubs, notably in Greater Newark and East Orange. New projects, such as Vermella Broad Street and The Crossings at Brick Church Station, offer convenient access to New York City, reflecting demand for well-connected, transitfriendly housing.
Payrolls in Northern New Jersey are growing at a healthy 2% rate, spurred by demand in logistics and biopharmaceuticals. As wage growth boosts median household income, the region is poised for continued rental growth demand and consumer spending, bolstering long-term multifamily stability despite minor employment challenges.
BY THE NUMBERS | 2024
MULTIFAMILY DEVELOPERS HIT THE BRAKES IN NEW JERSEY
Source: CoStar Group

Despite more than 500,000 residents leaving New York City since 2020, Brooklyn’s vacancy rate remains low at 2.6%, keeping it a top market for renters. Brooklyn has also benefitted from New York City’s job growth, adding over 76,000 jobs in the past year, attracting renters across various income levels. This surge has increased apartment absorption rates, hitting their highest quarterly total since 2022.
Rents in Brooklyn grew by 2% over the past year, surpassing the national average. With fewer buildings offering concessions after a strong spring leasing season, owners have leveraged demand to achieve rental growth.
About 66,000 units are under construction across NYC, with Brooklyn a primary focus due to high renter demand in neighborhoods like Williamsburg. This activity reflects Brooklyn’s continued appeal, though new supply is unlikely to ease vacancy constraints.
The Brooklyn multifamily sector recorded approximately $565 million in sales volume across 91 transactions during the first half of 2024. The second quarter alone contributed $305 million, representing a 15% increase from Q1. While any uptick in volume is encouraging, only three buyer groups completed more than one transaction.
BY
Source: CoStar Group

Demand Outpaces Supply in Manhattan
Manhattan saw 7,000 units absorbed in Q2 2024, its highest since 2022, outpacing supply and underscoring strong renter interest.
Vacancy Rates Reach Historic Lows
At 2.6%, Manhattan’s vacancy rate is among the lowest of major U.S. cities, a striking contrast to rising vacancies elsewhere. Even with slow office conversions and high costs, this rate remains far below its long-term historical average.
Manhattan rents average $3,220/month, the highest in the U.S., fueled by low vacancies and high demand. Limited new supply, combined with an improving job market, is expected to keep rental growth steady.
Selective Investment in Premium Properties
Investment in Manhattan multifamily properties remains robust for newer and higher-quality buildings. Well-capitalized buyers are focusing on risk-averse assets, as seen in recent high-profile purchases like the $265 million Aire Apartments on the Upper West Side. CHANGE
Source: CoStar Group

Historic Demand Meets Rising Vacancy Rates
Demand for Austin apartments reached a record high with 6,700 units absorbed in Q3 2024. However, new deliveries have pushed the vacancy rate to 15.3%, the highest in the nation, underscoring an ongoing supply surplus.
Surplus Impacts Rent Growth
Despite steady demand, a surplus in high-end units has pushed average asking rents down by 5.0% over the past year, the sharpest decline in the country. This trend is expected to continue until mid-2025 when supply and demand are forecast to balance.
The pace of new construction has decreased by 83% from 2023, reducing the risk of further vacancy hikes. This reduction in starts points to an anticipated recovery, with vacant unit numbers projected to decline by Q2 2025 as demand catches up to supply.
Suburban Markets Absorb Demand
The suburbs of Austin, including Georgetown, Leander, and Kyle, are capturing the most rental demand due to lower costs and increasing amenities. With substantial growth over the past year, these areas are experiencing high absorption, but face vacancy challenges due to the rapid influx of new properties.
32,905 units BY THE NUMBERS | 2024
CONSTRUCTION
19,948 units
ABSORPTION
19,680 units
AUSTIN SEES LARGEST DIP IN APARTMENT AVAILABILITY ACROSS TEXAS MARKETS
Source: CoStar Group

Rising Demand Amid Elevated Vacancy
Dallas-Fort Worth’s multifamily market saw strong demand with 15,200 units absorbed in 2024’s first half, outpacing pre-pandemic levels. Yet, a wave of new supply has kept vacancy rates elevated at 11.0%, a 20-year high.
Suburban Submarkets Drive Growth
Fast-growing suburbs like Frisco/Prosper and Allen/ McKinney account for a third of market demand, bolstered by significant population increases in Collin and Denton counties. These areas offer stability amid a supply-heavy environment and have driven notable absorption as families seek affordable housing.
Rent growth remains negative at -1.4%, as high-end properties face intensified competition from new supply, especially in northern areas. Concessions have surged, with some properties offering up to eight weeks of free rent to attract tenants in heavily supplied submarkets.
Construction Slows, Projected Stability on the Horizon
Multifamily construction in DFW has slowed, with 42,000 units underway, down from the 2023 peak of 64,000 units, signaling stabilization. The tapering supply, combined with consistent demand, is expected to support vacancy rate stabilization and positive rent growth by 2025.
40,048 units BY THE NUMBERS | 2024
ABSORPTION 25,603 units
PRICE/UNIT $186,000

Houston’s multifamily demand surged with a quarterly absorption high in Q2 2024, marking the first time since 2021 that absorption exceeds supply. The market absorbed over 20,000 units over the past year, closing the gap with the 24,000 new units delivered in the same period.
Vacancy rates, while still near 20-year highs at 11.1%, are showing signs of stabilization due to consistent demand. Suburban areas like Bear Creek/ Copperfield and Cinco Ranch lead in absorption, though high supply continues to keep vacancy rates elevated.
Rent growth, which stagnated in recent years, has edged up by 0.6% year-over-year as new supply pressures begin to wane. Affordable submarkets, such as Greenspoint and Alief, have seen the largest rent increases, benefitting from low supply and high renter demand.
With only 15,000 units under construction, down from Houston’s five-year average, developers are responding to higher financing and construction costs. A sharper pullback in construction starts hints at a market poised for reacceleration in late 2024 as demand aligns with slower new supply.

Strained Vacancy and Low Supply Amid Modest Demand Recovery
Prior to the wildfires, Los Angeles’ occupancy rate of 95.2% and limited new construction (3,860 units approved in 2024) bolstered by improvements in renter demand. However, the housing shortage has been exacerbated by the wildfire crisis, particularly for those already cost-burdened.
Projected Rent Surge
Following a modest 0.6% rent growth in 2024, the January wildfires in Los Angeles County are expected to significantly accelerate rent increases especially in high-demand urban areas and among displaced populations. The fires destroyed over 10,000 structures, displaced 180,000 residents,
and is expected to drive rent increases of 8%-12% due to heightened demand in an already undersupplied market.
Measured Construction Supports Market Stability
With about 8,100 new units added in the last year, Los Angeles sees limited new supply. Of the limited construction, high-end developments are a focus in areas like Downtown and Koreatown. The current 22,000-unit pipeline is below national averages, aligning with projected demand and supporting future occupancy rates.
Broader Financial Impact
The wildfire disaster is likely to raise insurance premiums statewide as claims overwhelm existing reserves. Multifamily units in high-risk zones face additional exposure, with 765 units identified in the Pacific Palisades alone.
9,189 units

Stable Vacancy Across the Valley
The Valley’s vacancy rate remains impressively low at 3.6%, aligned with its five- and 10-year averages. It is the lowest vacancy rate recorded between California’s markets such as Los Angeles, Orange County, and San Diego. This stability reflects balanced supply and demand, with 1,160 units delivered and 1,631 units absorbed over the past year.
Rental Growth Outpaces Metro Average
Rents in the Valley grew by 1.3% year-over-year, outperforming the Los Angeles metro’s average
growth of 0.6%. Average rents are $2,095/month, making the submarket an attractive, yet affordable, option relative to broader Los Angeles.
Increased Construction Activity Reflects Demand
There are 4,522 units under construction in the market, significantly above the the market’s average.
Rising Sales Volume and Investor Appeal
Multifamily sales in San Fernando Valley reached $2.5 billion over the past year, exceeding the tenyear annual average of $1.6 billion. With pricing at $322,000 per unit and cap rates at 5.3%, the submarket offers appealing returns compared to broader Los Angeles averages.
1,631 units DELIVERED
NET ABSORPTION
1,160 units
PRICE/UNIT $322,000

Steady Demand Drives Vacancy Rate Down Sacramento’s vacancy rate has stabilized at 6.5%, down from a peak of 6.9% in Q4 2023, as positive net absorption trends continue. This improvement reflects increased demand for Class A units, while lower-tier properties face demand challenges due to rising affordability concerns.
Growing Demand for Premium Properties
Demand for Class A properties remains strong, with a 12-month absorption of 3,200 units, while new marketrate and rent-controlled units meet increasing demand for affordable options. Nearly 2,600 rent-controlled units are expected in the coming two years, further supporting affordability-focused renters.
Slowing Construction Bolsters Rent Growth Prospects
With groundbreakings at an eight-year low, construction activity has tapered to 2,600 units under construction, down from a 6,300-unit peak. This decline in supply is easing rent pressures, with rents increasing by 1.5% year-over-year, signaling potential for rent acceleration in 2024 and beyond.
Investment Volumes Decline as Buyers Await Pricing Adjustments
Multifamily sales fell to $509 million over the past year, down from a pre-pandemic annual average of $1.3 billion, as high interest rates and rising cap rates stall transaction volumes. Investors seek discounts amidst upward pressure on cap rates, with private buyers now driving nearly 90% of market activity.
BEYOND 2025, SACRAMENTO’S MULTIFAMILY PROPERTIES HAVE THE MOST LOANS COMING DUE. OVER 70% OF LOAN MATURITIES IN 2026 AND 55% IN 2027 ARE MULTIFAMILY. Source: CoStar Group

Higher Absorption in Premium Segment Boosts Occupancy
Net absorption in the East Bay surged to 3,400 units in the first three quarters of 2024, largely driven by Class A properties, which saw 2,600 units absorbed over the past year. As new luxury properties lease up, vacancy rates for this segment have dropped, with high-end vacancies now at 10.5%, down 240 basis points year-over-year.
Average East Bay rents fell by -0.3% over the past year, reflecting ongoing pressure from elevated new supply. While high-end rents declined by 2.0%, midtier and workforce housing segments managed slight growth, indicating stable demand in more affordable categories.
Slowing Construction Pipeline Points to Future Balance
East Bay’s construction activity has slowed, with only 2,500 units underway—down from a peak of 10,000 in 2020. Total deliveries are projected to fall to 1,200 units by 2025, a slowdown that’s likely to support future rent growth as demand begins to outpace new supply.
Rising Sales Activity Signals Growing Investor Confidence
Multifamily sales in the East Bay reached $1.0 billion over the past year, driven by renewed interest from institutional buyers as cap rates adjusted upward. With average pricing at $300,000 per unit, the East Bay market offers attractive returns as investors respond to moderating interest rates and an easing supply pipeline.

Despite national challenges, Orange County’s apartment market stands strong with a low vacancy rate of 4.2%, contrasting sharply with the national rate of 7.9%. This second-lowest vacancy rate among the top 50 U.S. markets highlights Orange County’s high demand for rental properties. Orange County also has one of the highest asking rents in the nation albeit lower rent growth.
Orange County remains one of the most expensive U.S. rental markets, yet affordability is improving. Currently, annual rent costs are 27.5% of median household income, down from 30% in 2022. With household incomes on the rise, there’s room for continued rent growth into 2025. This improved affordability ratio, coupled with the demand for quality living, positions the market for steady growth.
The Orange County multifamily pipeline is expanding modestly compared to other U.S. markets, with only 2.0% of the apartment inventory under construction, versus a 3.5% national average. Land shortages and complex approval processes restrict new development, keeping supply tight, especially outside Irvine, which remains a hub for new construction. Upcoming projects in Irvine, including redevelopments of malls into residential areas, reflect a novel approach to managing limited land availability.
Orange County’s multifamily investment pipeline remains robust, with over $1 billion in transactions in 2024. Although asset values have cooled slightly due to rising capital costs, cap rates in the market remain competitive, often between 4.5% and 5%. With private and institutional investors attracted by high demand and limited supply, investor interest is expected to remain strong, potentially spurring further sales momentum if interest rates ease.
BY THE NUMBERS | 2024
Source: CoStar Group

Vacancy Remains High in
San Diego’s multifamily market saw demand recover in 2024, with net absorption reaching its highest since 2021. This surge was led primarily by stabilized renewals, which kept vacancy rates lower in Class C properties for the first time in years. However, new developments in areas like Downtown, Mission Valley, and the South I-15 Corridor continue to pressure vacancy rates above historical averages.
Despite San Diego’s appeal, affordability challenges persist, slowing household formation. High costs and economic pressures are prompting some renters to seek roommates, increasing demand for two-bedroom units over one-bedroom. Even as new job growth boosts absorption in areas like Mission Valley, units are sitting on the market for longer compared to two years ago. Vacancy remains highest in Downtown, with additional challenges from homelessness and school quality, driving renters toward more family-friendly neighborhoods.
BY THE NUMBERS | 2024
Rent growth in San Diego has cooled significantly, reaching just 0.6% year-over-year by late 2024, with average rents now $2,495 per month. This taper follows years of rapid rent increases post-pandemic, which have intensified renters’ price sensitivity. Concessions are more common than ever, with about 25% of properties offering incentives like free rent or gift cards to attract tenants. Landlords expect a return to historical rent growth rates only by the end of 2025, provided economic pressures ease and demand stabilizes.
San Diego’s housing crisis, marked by a shortage of 80,000 units, is being addressed through Complete Communities, a visionary urban planning initiative. Launched in 2020 and updated through several amendments, this program emphasizes affordability and sustainability while incentivizing high-density development near transit hubs.
Source: CoStar Group
Transitioning from the peak years of 2021-2022 to a phase of recalibration, institutional capital has been patiently waiting on the sidelines to reassert their dominance in the marketplace. In 2025, institutional capital is poised to reenter, catalyzed by improving market conditions and strategic opportunities.
Retrenchment and Recalibration
The boom years of 2021-2022 were characterized by aggressive institutional investments, particularly in Sunbelt markets where rapid rent growth and low vacancy rates prevailed. However, a surge in multifamily construction—culminating in significant new supply in 2024—led to increased vacancy rates and a softening of rental growth. Concurrently, rising interest rates and a 20% drop in multifamily property valuations sidelined many institutional investors, leaving private investors as the dominant market participants in 2023 and early 2024.
This period of retrenchment allowed institutions to reassess strategies and accumulate dry powder. Blackstone’s $10 billion acquisition of AIR Communities in 2024—adding 27,000 units across major markets like Miami and Los Angeles— highlighted a shift toward high-performing, stable
assets. This recalibration is setting the stage for a robust return of institutional capital in 2025, driven by falling interest rates and stabilized lending conditions.
Interest rates, a key determinant of investment activity, are trending downward following the Federal Reserve’s rate cuts initiated in late 2024. This monetary easing is expected to unlock significant institutional capital in 2025. REITs and private equity firms have amassed substantial reserves earmarked for multifamily acquisitions, positioning them to capitalize on an anticipated surge in deal flow.
Lending conditions are also stabilizing, with alternative lenders like life insurance companies and credit unions stepping in to fill gaps left by traditional banks. Life insurance firms, in particular, have expanded their share of commercial financing, offering competitive rates and longer payback periods that appeal to institutional investors targeting stabilized, core assets. Agency debt from entities like Fannie Mae and Freddie Mac, bolstered by unused capital from previous years, is also set to play a pivotal role in facilitating transactions.
CAPITAL FLOWS (NET ACQUISITIONS, VOLUME, $M)
Source: RCA
The reduced pace of new multifamily construction in 2024—a response to high borrowing costs—is creating favorable supply-demand dynamics. As the pipeline of new units slows, absorption of existing inventory is expected to tighten vacancy rates and reignite rent growth.
Competition for assets is anticipated to intensify, particularly for high-quality properties in prime locations. Additionally, the absence of undercapitalized syndicators, who struggled during the recent downturn, provides wellfunded institutions with an opportunity to dominate transactions and secure attractive entry points.
Source: RCA
Multifamily REITs provided valuable indicators of market sentiment following Q3 2024 earnings. The broader structural housing shortage and consistent demand for rental housing remained strong tailwinds for the sector.
Demand Stability: Despite broader economic pressures, multifamily REITs continued to benefit from constrained housing supply, especially in urban and high-demand metro areas. High mortgage rates kept potential homebuyers in the rental market, while millennials and Gen Z renters bolstered demand.
Geographic Trends: REITs focused on highgrowth markets in the Sunbelt and secondary cities such as Austin, Dallas, Charlotte, and Raleigh performed well, showing strong rent growth and low vacancy rates. Conversely, REITs in higher-cost urban markets like San Francisco and New York faced slower rent growth and rising tenant turnover.
Operational Efficiency: Many REITs enhanced margins through operational efficiency measures, including cost control, renovations, and technology adoption like digital leasing platforms and smart home amenities.
Transaction and Development Activity: Equity
Residential led the industry in acquisitions, while Essex Property Trust dominated disposition activity. MAA spearheaded development efforts with over 2,700 units under construction, while Camden Property Trust paused several projects due to high construction costs and declining rents in specific markets.
The positive sentiment around multifamily REITs, buoyed by stable rents and dividend yields, reinforces the sector’s appeal for institutional investors seeking consistent income. However, affordability concerns and slower rent growth in certain markets underscore the need for cautious investment strategies.
$55M

A $55 million exchange for a family-owned LLC, acquiring 15 net lease assets across 12 states. Triggered by the recent sale of a 700-acre farm, the client sought to reinvest in highgrowth markets, with 85% of the acquisitions sourced off-market. The portfolio included diverse assets such as quick service restaurants, healthcare facilities, and retail sites. According to Keegan Mulcahy and Chad Kurz, the deal’s success was driven by strategic diversification and a deep understanding of market conditions.

Matthews™ represented the seller in the $45.5 million sale of Compo Shopping Center in Westport, CT, a CVS-anchored retail property. Purchased by Regency Centers, a Floridabased REIT, this marked the first transaction since the shopping center opened. Family-owned for three generations, the property spans 76,368 square feet with a 91.65% occupancy rate. Vice President Joanna R. Manfro managed the deal.
$34.99M $31M $45.5M $36.75M

Multi-tenant industrial park located at 900 W 2900-3100 S, Salt Lake City, UT. The property, spanning 279,233 square feet on over 14 acres, attracted multiple competitive off-market offers. The transaction was handled by Associate Eric Roggio, Associate Vice President Brett Davis, and Senior Vice President Alexander Harrold Purchased by STOS Partners, a California-based private investment firm, this deal marked the firm’s first acquisition in Salt Lake City, a growing market for e-commerce, logistics, and manufacturing. Following planned capital improvements, STOS intends to add value and stabilize this generational asset in a core market.

The $36.75 million sale of two recently developed healthcare properties in Charlotte, NC, totaling approximately 86,400 square feet. Anchored by Metrolina Nephrology, Fresenius, and Azura, the portfolio was sold offmarket by Metrolina Nephrology, with some selling physicians reinvesting their proceeds with the buyer, Hammes Partners. Despite challenges such as structural issues and tenant improvement work, the transaction proceeded smoothly, Senior Vice Presidents Rahul Chhajed and Michael Moreno ensured the successful completion of the deal.

The sale of Victory Place Townhomes in Clarksville, TN marked the largest transaction in the area over the past 12 months. The 194-unit townhome complex, developed by Singletary Construction in 2021, features institutional-grade amenities such as a pool, fitness center, and dog parks. Represented by Senior Associate Austin Tomaiko and Vice President Austin Graham, the property sold for $31 million. The buyer, BridgeGaps, a New York-based private equity firm, was completing a 1031 exchange and plans to revitalize the underutilized amenity spaces. This deal allowed the seller to reinvest capital into their construction business while providing the buyer with a prime asset in a rapidly growing market.
$22.78 $22.5M $17.7M

$22.78 million sale of a 41,600-square-foot Class A condo leased to Rush University Medical Center, located at 1411 S. Michigan Avenue in Chicago’s South Loop. Senior Vice Presidents Rahul Chhajed and Michael Moreno sourced the buyer, IRA Capital, a leading purchaser of healthcare real estate. The transaction closed in just over a month, with both parties working collaboratively to meet the tight timeline.

$22.5 million sale of Merced Mall, the first regional mall transaction in California in 2024. The property, with 44 tenants including anchors J.C. Penney and Kohl’s, had a 67% occupancy rate. The mall was sold by Codding Enterprises to Ethan Conrad. First Vice President Matt LoPiccolo led the transaction, navigating challenges such as high vacancy and a limited buyer pool. A structured marketing campaign generated multiple offers, securing a deal with an experienced buyer.

The $17.7 million sale of Mary’s Vineyard shopping center in Visalia, CA was the highestpriced sale in the city in 2024. The center, which spans 151,615 square feet on 16.51 acres and is anchored by grocery and drug stores, also includes national tenants such as McDonald’s. The property, owned by the same family since 1920, was developed in 1989. Associate Carter Hamilton and First Vice President Matt LoPiccolo represented both the seller and the buyer, Argonaut Investments, a Bay Area-based firm.
$13.7M

Matthews™ completed the $13.7 million sale of The Journalist, a 38-unit, 2023-built vacant apartment building located at 96-100 Tuers Ave, Jersey City, NJ. Vice President David Ferber, CPA, represented both the seller and the buyer in the transaction. Situated in the heart of Journal Square, a vibrant residential and business district, The Journalist attracted over 10 offers following a competitive marketing process. The buyer, seeking new construction assets in New Jersey, plans to update the building’s amenities to attract tenants. This sale marks the highest-priced transaction in Journal Square for 2024 so far. Ferber utilized Matthews’ shared database to engage over 15,000 qualified investors, generating strong interest and securing the best price and terms for the seller.
$14.04M

Matthews™ successfully closed the $14.04 million sale of the Amethyst Street Portfolio in Redondo Beach, CA. The multifamily portfolio consists of 32 units across eight low-rise, garden-style fourplexes. Each property features a large owner’s unit in the front and three additional one- and two-bedroom units in the rear. Associate Vice President Nabil Awada represented the buyer, who specializes in value-add multifamily properties in Southern California. The buyer executed an all-cash closing with no financing contingencies, despite the challenging capital markets environment. The sellers, private individuals who had owned the properties for over 40 years, sought to divest their LA multifamily holdings and reinvest in more passive real estate investments outside California.
By Kyle Stonis Shopping Centers Drive CRE Recovery

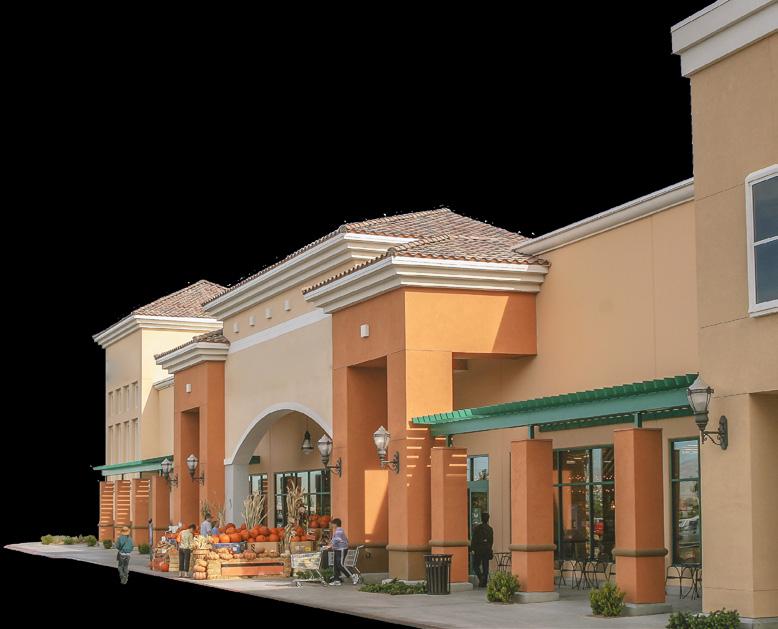
In recent years, construction of new retail centers has slowed considerably, with developers focusing more on industrial, mixed-use projects, and residential developments due to cost impediments and a changing real estate landscape. Rising construction and borrowing costs, especially with high interest rates, have further restrained new retail projects, leading to a constrained supply of shopping centers. This has left many markets with a limited selection of retail spaces, particularly in high-demand areas where population growth has heightened demand for retail services.
Despite the rise in e-commerce, many retailers still see value in maintaining a physical presence— especially in grocery-anchored centers and other high-traffic spaces. These locations are particularly appealing to businesses like healthcare providers, quick service restaurants, and specialty retail shops, all of which benefit from foot traffic generated by nearby essential services. This demand has intensified competition for available spaces, allowing landlords to increase rental rates.
Tenants have also begun to favor smaller spaces, which led to increased demand for strip centers in particular. As of Q4 2024, vacancy for shopping centers across the U.S. reached 6.6%, with -0.5%
SHOPPING CENTER MARKET ASKING RENT PER SF ACROSS THE U.S.
Source: CoStar Group | Last 12 Months
$30 Forecast
$28
inventory absorption, according to CoStar. The low supply of shopping centers, coupled with sustained demand, has also driven rental rates higher. Market asking rent for a shopping center increased to $24.76 per square foot as of Q4 2024, and this trend is likely to continue if retail development doesn’t pick up. As a result, well-positioned retail properties are increasingly valuable, and tenants in competitive markets are likely to face elevated rental costs for the foreseeable future.
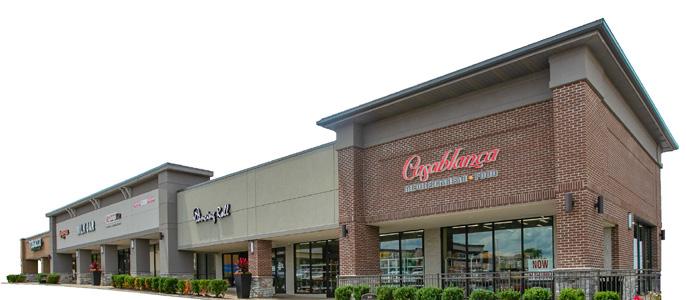
Grocery-anchored properties have continuously demonstrated strong resilience, even through economic downturns and the rise of e-commerce. Their consistency has made them a secure investment in a market where stability is highly valued. Specifically, grocery-anchored centers remain an enticing investment opportunity as they are often priced 100 or more basis points above single-tenant net lease deals.
Grocery-anchored centers proved their strength by recording rent growth of 3.4% for the 12 months ending in July 2024, which is greater than the U.S. retail average. Some grocery tenants leading the way are Aldi and Grocery Outlet Bargain Market. Visits to these grocers have increased by 26.3% and 14.3%, respectively. Aldi, in particular, is one grocer that stands out as a strong anchor tenant, due to its popularity among consumers for its range of affordable products. The grocer boasts over 2,400 stores, and attracted 466 million visits nationally from April to September 2024.
$22
$20
With significant capital on the sidelines, many investors are actively seeking properties that combine resilience with growth potential. Groceryanchored centers often come with long-term leases, providing a stable income stream that appeals to both institutional and private investors looking for reliable returns. Given these factors, groceryanchored centers are likely to remain a cornerstone of the retail real estate market, attracting investors focused on stable, long-term performance in a dynamic economy.
Source: U.S. Bureau of Labor Statistics
Retail property sector investments are healthier than media and mainstream headlines imply. Volume is moving in an upward trajectory, with the amount of capital to invest in shopping centers continuing to pile up. In 2025, the anticipated stabilization of interest rates could further increase demand for retail assets, as financing becomes more feasible.
Operationally, rising costs from prior years have spurred a re-evaluation of tenant mixes, with a focus on essential and experiential tenants that drive consistent traffic and complement traditional retail offerings. The limited development of new shopping centers, combined with strong tenant demand for existing high-quality properties, points to a favorable investment environment for shopping centers and their cap rates over the next few years. With low vacancy rates in desirable centers—particularly those anchored by essential services like grocery stores— net operating incomes (NOI) are expected to remain strong. This stability appeals to investors looking for assets with consistent cash flows, supporting lower cap rates and higher valuations.
Together with retail spending, retail construction is expected to begin increasing during the second half of 2025. Most developments will continue following the population growth occurring in the Sunbelt to keep up with the region’s demand for new space. Atlanta is one specific market investors have begun to target in order to boost shopping center performance.
Regency Centers, a REIT that focuses on operating grocery-anchored centers, is contributing to the continued success of shopping centers in Atlanta. The firm recently expanded into the market with a portfolio that will meet consumer demand by modernizing its current tenants. Specifically, the REIT set its sights on Cambridge Square in the Brookhaven submarket. Regency focused on upgrading the center’s anchor tenant, Publix, to


To attract and retain more consumers, shopping center owners have begun adding experiential tenants to their tenant mix. Adding these kinds of tenants allows for shopping centers to stand out to a diverse demographic of consumers with various needs. Experiential tenants also represent a standout investment, making up half of all new leases over 2024.
One experiential tenant that has grown in recent years is family-friendly Sky Zone. The popular trampoline park provides entertainment for families across the country, and operates 231 locations as of Q4 2024. It leased 25,386 square feet in 2023, and has eight expansions planned for New York and Chicago in 2025.
Overall, Sky Zone locations excel at transforming commercial spaces that are underutilized and difficult to lease by creating a dynamic activity center that renders a different use case than traditional retail.
Omnichannel retail, which integrates online and physical shopping, has become standard for many retailers. It is common to see tenants offer pickup services where customers can shop online for their goods, and then make a stop in person to pick up their products. The implementation of these contactless systems allows for a seamless shopping experience for consumers.
Along with providing online access for customers, the increased use of technology and AI also benefits retailers in transforming their management strategies. Data tracking through AI or other systems allows retailers to view foot traffic, spending patterns, and tenant performance. These insights support optimized space usage, tenant adjustments, and revenue diversification. Having access to this data also shows retailers how they can best ensure customer satisfaction. Overall, retail centers that prioritize adaptability, technology, and strategic tenant choices are best positioned to thrive amid economic and consumer changes.
SKY ZONE OCCUPANCY BY SF ACROSS THE U.S.
Source: CoStar Group | Last 12 Months


Source: Insider Intelligence


Consumers can look forward to a new kind of shopping center to enhance their shopping experience. SITE Centers, a REIT that specializes in shopping centers, has been investing in many properties across the country to mold to a new retail model. Throughout 2024, it closed $1 billion in shopping center sales. To further increase its success, the firm launched its spinoff company,
which increases occupancy. Convenience centers are attractive to investors as about $8 billion of these facilities trade annually, according to Curbline, creating an investment opportunity for these properties that are in top submarkets across the U.S.
Overall, shopping centers are on a stable pace to recovery. Despite the lack of space, shopping center owners can utilize their tenant mix to ensure that their property remains stable. Using technology to analyze consumer trends will also aid retailers

Connect Industrial Midwest
Connect Orange County
Connect Phoenix Multifamily & SFR-BTR
Connect Canada
Connect Los Angeles
Connect Midwest Multifamily
Connect Texas Multifamily
Connect Apartments
Connect Tri-State Multifamily Investment & Finance
Connect Healthcare Real Estate
Connect Retail West
Connect Investment: Public & Private Capital
Connect Southeast Multifamily
Joe’s Live Rosemont, IL
Hyatt Regency Irvine Irvine, CA
Scottsdale, AZ Toronto, ON The Biltmore Los Angeles, CA Chicago, IL Dallas, TX
Indigo Los Angeles, CA
The year 2025 marks a transitional phase for the U.S. economy and multifamily markets. Since 2022, federal interest rate hikes have cooled the investment market, while surging inflation has strained consumer spending and behavior. With clearer signals that interest rates will now trend downward and the 2024 presidential election settled, it’s a valuable time to examine shifts in multifamily market fundamentals and demand drivers during previous periods of economic and political change.
Presidential elections often weigh on consumer sentiment, as heightened polarization and concerns over the potential impacts of the winning party’s policies can create uncertainty for individuals and households. Yet, once election results are in, regardless of which party prevails, consumers generally feel more confident about the economy and their finances. Although this trend may seem counterintuitive, it significantly influences several key demand drivers in commercial real estate and housing, such as consumer spending, household formation, and homebuying.
This uncertainty typically results in more cautious behavior from consumers and investors during election cycles, often leading to slower economic growth compared to postelection years. Although the Federal Reserve operates independently of politics, the convergence of political and economic shifts in late 2024 created conditions similar to previous transition periods, offering investors insight into potential trends over the next year and beyond.
CONSUMER SENTIMENT TYPICALLY RISES AFTER ELECTIONS OCCUR
Source: University of Michigan, BEA
CONSUMER SENTIMENT
GDP GROWTH STRONGER AFTER PRESIDENTIAL ELECTIONS
Source: University of Michigan, BEA


In the early 20th century, apartment living was primarily concentrated in the nation’s largest and most densely populated cities. Following World War II, population migration shifted heavily toward suburban areas. This suburban boom in the late 1940s and 1950s spurred extensive single-family home construction. However, by the 1960s, renewed urban population growth made apartment tower development in major urban centers both necessary and profitable. Multifamily construction soared to record levels in the early 1970s, bolstered by low interest rates and rapid urbanization. During this time, wars in the Middle East, Vietnam, and Korea began impacting the domestic economy.
In 1973, the Organization of Arab Petroleum Exporting Countries (OAPEC), the precursor to OPEC, imposed an oil embargo on the United States, causing a supply shock that led to a significant spike in inflation. Under Federal Reserve Chair Paul Volcker, the Fed responded by raising the overnight rate above 12% to combat inflation. Although this sharp rate increase temporarily controlled inflation, the restrictive policy also constrained economic growth. By the time inflation was reined in, the Iranian Revolution triggered a second oil crisis, leaving the economy facing slow growth and persistent inflation at the decade’s end.
Federal Reserve rate hikes during this period also shifted consumer housing preferences. With mortgage rates sometimes exceeding 10%, homeownership became less attainable, driving increased demand for rental housing. Concurrently, many urban areas launched revitalization initiatives, establishing affordable housing projects and introducing some of the nation’s first luxury apartment towers. High construction rates, combined with the prohibitive cost of homeownership, boosted multifamily demand—a trend similar to the vacancy compression seen amid record development in 2021 and 2022.
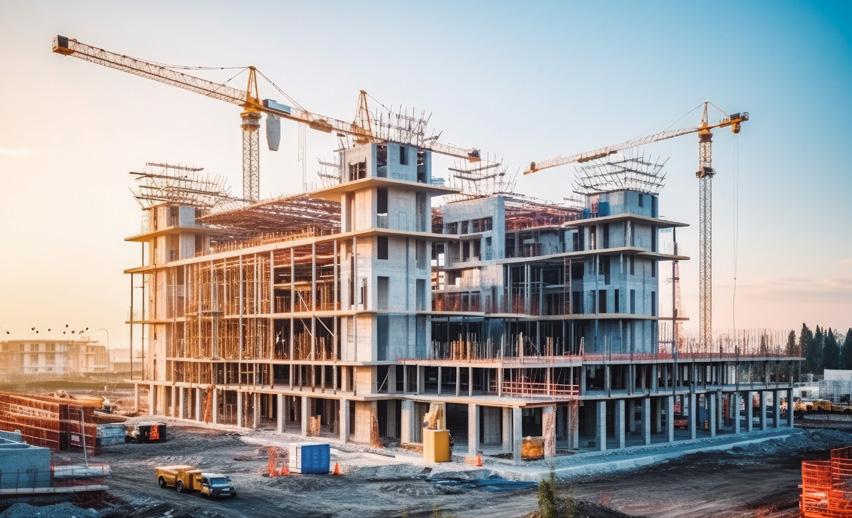

The early 1980s, marked by Ronald Reagan’s election, saw an economic recession that initially softened rents and led to a rise in unemployment. However, by 1983, inflation had cooled, and the Federal Reserve began lowering the overnight rate to between 5% and 8%. This reduction in rates led to declining mortgage rates at the start of the decade, shifting home construction back toward single-family homes in suburban areas.
Limited multifamily construction, paired with urban revival efforts, contributed to a rapid acceleration in rent growth as interest rates declined. As unemployment fell, apartment vacancy rates tightened, and the lack of new development was further restricted by the Tax Reform Act of 1986, which removed tax incentives for real estate developers. This period of falling interest rates and limited new construction significantly benefited existing apartment owners, especially in major cities.
Simultaneously, the 1986 Tax Reform Act triggered the Savings and Loan Crisis, causing a wave of bankruptcies and foreclosures among investors who struggled to secure stable financing without previous tax incentives. This resulted in steadily improving apartment performance as baby boomers reached young adulthood, despite broader economic pressures on the investment side.
Today, similar dynamics are anticipated for the multifamily market in 2025 and 2026. Experts predict a combination of declining interest rates and reduced new construction, alongside a wave of maturing debt that may resemble the conditions of the late 1980s. With millennials and Gen Z forming families and entering the workforce, multifamily demand is expected to strengthen further.

The Savings and Loan Crisis triggered a minor recession in the early 1990s, but by 1995, interest rates and unemployment were once again declining. As the economy rebounded, employment markets underwent a transformation with the rise of the internet, cell phones, and consumer computers. This tech boom drove high apartment demand in tech-centered markets like Seattle, the Bay Area, and Austin. When the Dot Com Bubble burst in the early 2000s, large tech companies absorbed workers from struggling firms, supporting a rapid recovery in even the most tech-exposed metros.
Despite this recovery, the Federal Reserve continued to cut interest rates, reducing them from 6.5% in 2000 to 1.0% by 2003, enhancing borrowing capacity for both consumers and businesses. Simultaneously, banking reforms under President Clinton, coupled with low interest rates, sparked a homebuying surge in the early 2000s. This surge did not lessen demand for apartments in large urban areas, as the influx of new workers sustained robust demand in both single and multifamily housing markets. Western and Sunbelt metros experienced population growth and an increased need for housing, while midwestern and northeastern cities recorded a slowdown in population metrics.
HOMEOWNERSHIP RATE HAS NEVER RETURNED TO MID-2000’S LEVELS
Source: U.S. Census Bureau

In the mid-2000s, persistently low interest rates from 2001 to 2004 fueled a rapid increase in housing prices and encouraged extensive borrowing. As home prices surged, the Federal Reserve grew concerned about a potential housing bubble and began gradually raising interest rates to curb market enthusiasm and slow borrowing. However, these rate hikes proved insufficient to prevent the bubble from bursting, and by 2008, the Great Financial Crisis had begun, leading to a significant economic downturn and a collapse in the housing market.

In response to the largest U.S. recession since the 1920s, the Federal Reserve cut rates to nearly 0% to prevent widespread business closures and promote a swift economic recovery. These rate cuts, along with additional government subsidies, helped stabilize housing markets, but investor and lender caution following the crisis slowed housing investment. Developers completed fewer housing units, while millennials, many of whom delayed homeownership, extended their time in rentals beyond the typical renter age. This reduction in new construction, combined with the aging millennial demographic, contributed to the housing shortage still affecting markets today.
Throughout the 2010s, low interest rates persisted, yet homebuilding remained limited, especially in the first half of the decade. Even as employment markets rebounded, lending rates stayed historically low, creating a supportive environment for real estate investment. By 2014, confidence in the housing market returned, leading to significant growth in multifamily deal flow, surpassing pre-crisis levels. Additionally, lenders’ reduced reliance on variable rate financing during this period helped mitigate distress and delinquency for apartment assets, sustaining stability in the multifamily market across the decade.
Source: Federal Reserve, Real Capital Analytics
The housing market recovery following the Great Financial Crisis was unique compared to typical post-recession trends. Because the crisis was rooted in mortgage lending, investors approached both the apartment and singlefamily markets with heightened caution. In the short term, job losses and economic uncertainty led to rising vacancies and downward pressure on rental rates.
However, in the long term, homeownership became increasingly unaffordable, and millennials delayed family formation, leading to prolonged rental demand. This dynamic ultimately pushed apartment vacancy rates to nearrecord lows by 2019, highlighting a pronounced housing shortage that continues to impact markets today.

COMPLETIONS EXPECTED TO FALL AS DEMAND FOR UNITS RISES
Source: CoStar Group, Inc.
Entering the pandemic, apartment fundamentals and deal flow were exceptionally stable. From 2015 to 2019, deal flow, vacancy rates, and rent growth had all steadied, enabling investors and developers to underwrite deals with confidence. However, in spring 2020, uncertainty triggered household consolidation, temporarily driving vacancies higher. By 2021, work-from-home policies, combined with delayed homebuying by millennials, ignited a surge in apartment demand that lasted through 2022. In response, construction starts hit record highs in 2022 to meet low vacancy rates and strong rent growth. 800,000
Net Absorption Completions
Remote work policies accelerated migration trends, as renters in high-cost coastal cities moved to more affordable Sunbelt areas where housing offered extra space for home offices. As a result, developers and apartment demand shifted to Sunbelt metros like Dallas, Nashville, and Miami, while coastal cities like New York and Los Angeles saw population declines. This outmigration from coastal cities has since slowed, suggesting a stabilization in household movement after the rapid shifts of 2020 and 2021.
When inflation began rising, and the Fed raised interest rates, renters grew less confident in their finances,

In 2025 the U.S. economy and housing market are poised to move beyond the transitory phase that followed the pandemic, entering new cycles that will shape opportunities for investors and tenants through the rest of the decade. Wall Street consensus forecasts the federal funds rate to reach 3.5% by the end of 2025—200 basis points below its 2023-2024 peak. This lower borrowing cost, combined with post-election optimism and a boost in consumer sentiment, makes 2025 an exciting year for apartment investors.
With reduced interest rates expected to reignite economic growth, GDP is predicted to reach its highest level since 2022, driving job creation, expanding household budgets, and accelerating household formation. These factors, along with a development slowdown, should lead to marked improvements in multifamily fundamentals. CoStar projects tightening vacancy rates over the next several years, with rent growth around 4%, mirroring the stable pace from 2014 to 2019.
Interest rate compression is also set to boost buyside interest in current listings, though multifamily listings are expected to stay below the 2022 peak due to anticipated performance improvements. With fewer listings and heightened buyer interest, sales pricing is likely to recover, bringing buyer and seller expectations closer to alignment. Austin and other metros that saw the sharpest spikes in deal volume during the pandemic recovery may take longer
to return to previous peaks. However, historical trends show that rate cuts often trigger a surge in multifamily transactions: a 14% increase in 2001 following rate cuts in 2000, and a doubling of deal flow by 2012 compared to pre-crisis levels after the 2007–2008 cycle. Similarly, when rates fell in 2019 and 2020, the U.S. multifamily market experienced its most active year ever in 2021.
Greater political and economic stability is set to increase apartment demand, while lower borrowing costs will likely enhance valuations and transaction opportunities for current owners. Although 2025 may not match the transaction volume of 20212022, macroeconomic factors suggest a stronger multifamily deal market. With an estimated national housing shortage between 3.5 million and 7 million units, and only 300,000 units started in the past year, housing fundamentals remain solid.
Overall, multifamily investors face an extremely positive outlook in the coming years. Of course, individual property characteristics and performance trends remain crucial to any deal’s potential, and improved rent and vacancy metrics may deter some owners from listing assets. Nonetheless, competition for deals is expected to intensify, with interest from larger institutions like Blackstone already hinting at a robust market ahead. While transitions can be challenging, the multifamily market is well-positioned for a strong recovery in 2025 and beyond.


BY JAKE PAYNE

The self-storage industry, long recognized as a profitable and recession-resistant investment, is navigating a transformative period marked by oversupply and economic uncertainty. Since 2018, steady demand has propelled the sector, with an estimated 14.5 million U.S. households leveraging self-storage solutions, according to the Self Storage Association. Once dominated by private investors, the industry has evolved into an attractive asset class for private equity groups and institutional investors. This evolution has fueled rapid expansion, with 276.9 million square feet of new storage space added in the past five years, including a record-breaking 98.2 million square feet in 2023 alone. However, this surge has led to oversupply challenges, positioning the sector in a “middle market” grappling with reduced housing mobility and slowing demand.
The pandemic initially drove unprecedented demand for self-storage, as shifting migration patterns and work-from-home trends prompted record-high occupancy and rents. Developers responded aggressively, with construction spending peaking at $6.9 billion in 2023, a 24% increase over the prior year. Over the past three years, self-storage inventory grew by 8.9%, with 2.9% added in the trailing 12 months, according to Yardi Matrix.
Between 2019 and 2021, the average construction spending on self-storage facilities was $4.4 billion.
As the sector expands, oversupply concerns have become increasingly prominent. Developers, once eager to capitalize on future housing developments, have been met with supply-chain disruptions and rising interest rates. This has left many newly-built storage facilities without sufficient customers to fill their units.
The number of abandoned storage developments rose by 104.2%, while deferred projects increased by 44.5%
Despite these setbacks, the construction pipeline remains robust, with 3.2% of existing inventory under development as of November 2024. Markets such as Las Vegas, Tampa, Phoenix, and Charlotte continue to see growth in construction, despite already experiencing heavy supply delivery in recent years.
Urban markets like Las Vegas and Atlanta delivered over 10% of their inventory in a three-year period.
The South remains the most popular destination, capturing 40% of movers, while younger demographics aged 25-44 emerge as the most mobile segment, motivated by cost of living, job opportunities, and family needs.
In response to rapid buildout, municipalities across North America, particularly in secondary and tertiary markets, have increasingly imposed restrictions or bans on new self-storage projects, often citing concerns about land use, negative stereotypes, and the desire to attract higher-revenue businesses.
For instance, Denver has banned self-storage within a quarter mile of any light-rail train station, New York City banned self-storage development in its 20 industrial business zones (IBZs), requiring special permits for approval, and markets like Miami and Providence, RI have enacted measures to limit self-storage in mixed-use or residential areas. Some cities, such as Brentwood, CA, have discussed banning self-storage entirely.
A significant factor behind this backlash is the perceived economic contribution of self-storage facilities. Unlike retail or hospitality businesses, storage developments generate limited sales tax revenue and create fewer permanent jobs, leading some cities to demand mixed-use developments that combine storage with more attractive commercial or residential components.
Oversupply has also placed pressure on rental rates and occupancy, an additional stress on new facilities facing lease-up challenges. In Q3 2024, average revenue growth for major self-storage REITs turned negative at -1%, driven by a 60bps decline in occupancy and a 1.1% drop in realized units. Markets with heavy supply, such as Atlanta, Orlando, and Phoenix, reported some of the worst revenue performances. Conversely, markets like Washington D.C., Chicago, and San Francisco, which have experienced limited supply growth and improved migration trends post-pandemic, fared better.
While occupancy struggles, advertised rates have shown year-over-year improvement. Nationally, rates declined 2.4% year-over-year in November 2024, a smaller drop from the 3.1% recorded in October. Non-climate-controlled (NCC) units posted a 2.1% decline, while climate-controlled (CC) units experienced a 2.7% drop, both better than Q3 averages and the previous month.
Washington D.C. emerged as the first metro to report positive year-over-year advertised rent growth (around 1%) for all unit types, aided by reduced new supply and increased demand.
Markets with the largest lease-up inventories, such as Las Vegas and Atlanta, are among the worst performers in rate growth. Interestingly, despite leading in new supply deliveries, Las Vegas has outperformed some other oversupplied metros. Its same-store advertised rates for main unit types decreased 4.4% year-over-year, which, while a decline, reflects resilience compared to steeper drops elsewhere.
On a month-over-month basis, advertised rates are declining as the industry enters its slower winter season. Rates fell by 0.3% in November, a smaller decrease compared to the 1.1% month-over-month drop in November 2023.
Tampa stood out as the only metro with a month-over-month increase, buoyed by disasterrelated demand.
Orlando, despite facing the second most deliveries over the past year (5.5% of stock) saw an improvement in year-over-year rates with declines lessening by 1.8%.
As of November 2024, 61.5 million net rentable square feet of self-storage space remains under construction across the U.S., adding pressure to occupancy and rental growth in oversaturated markets. However, construction activity is expected to taper in 2025 and beyond, potentially helping to rebalance supply and demand. Year-over-year improvements in advertised rates are anticipated to persist as operators benefit from easier comparisons to the aggressive rate drops seen in late 2023. Additionally, secondary markets with lower supply growth and robust demand fundamentals, such as Washington D.C., offer more stable performance prospects amidst these challenges.


The self-storage industry has moved from a market dominated by mom-and-pop operators to one increasingly influenced by larger institutional players. Historically, smaller operators—which prioritize tenant retention with stable rates, personalized service, and basic facilities—often lack advanced technology or polished aesthetics. However, the entry of larger owners with streamlined operations, upgraded facilities, and aggressive marketing budgets has intensified competition, elevating the overall standard of the industry.
These larger operators have introduced dynamic pricing models, adjusting rates weekly or even daily based on availability, to maximize returns. While this approach prioritizes revenue over occupancy, independent operators, who still own about 65% of facilities, often maintain near-full occupancy by keeping rates below market averages. This affordability continues to attract renters and retain existing customers.
For both independent and institutional players, navigating the current market demands a sharp focus on costefficiency, the strategic application of dynamic pricing, and the exploration of underserved markets. The industry’s ability to adapt to these evolving dynamics will be critical in shaping its future success.
Despite recent dips in rental rates, mobility is poised to drive a rebound in self-storage demand in 2025. A survey conducted in late 2024 revealed that 37% of Americans are planning or considering a move within the next 6-12 months—a significant increase from earlier years. With the Federal Reserve signaling potential rate reductions, the same survey noted that 13% of respondents would be more likely to move if borrowing costs decline. If rate cuts materialize and the surge in relocations commences, pent-up demand for housing and storage solutions could counterbalance market concerns about oversupply and softening rental rates.
JAKE PAYNE
jake.payne@matthews.com (659) 204-3357

CAREER OPPORTUNITIES AT MATTHEWS ™

SHARED SERVICES
HOSTED BY KYLE MATTHEWS
PLATFORM


INNOVATIVE AGENT-FIRST TECHNOLOGY
INDUSTRY-LEADING DATA
CULTURE OF EXCELLENCE
"It’s informative, interesting and inspiring. Love it!"
- Anonymous Listener
FOUNDER, CHAIRMAN, FOUNDER & CEO, SCAN FOR MORE INFORMATION
one of the top commercial real estate podcasts Listen Now on CEO, FEDERAL


The office landscape has undergone a profound transformation in recent years, shaped by shifts in tenant preferences due to the pandemic, changes in urban development, and emerging trends in real estate investment. As remote and hybrid work models gained prominence, traditional office spaces faced rising vacancies, leading to an increased focus on integrating high-value amenities to attract tenants and boost occupancy. One standout evolution is the growing integration of restaurants and entertainment facilities within office campuses, which is helping landlords increase rents and enhance the appeal of office buildings. This shift underscores a significant trend: the transformation of vacant office space into amenity-rich hubs designed to draw a diverse range of users.
Amenities and green spaces serve as a strategic tool for not only landlords to attract tenants to the office building, but also for businesses to encourage employees back into the office. It provides for an attractive feature for workers who are looking to socialize and a way for landlords to align with businesses’ goals to foster an in-person work culture. Amenity-driven spaces are a valuable asset in attracting and retaining tenants and
Integrating restaurant spaces has become a strategic move for landlords as they look to add value beyond traditional workspaces. Restaurants within office campuses serve as both amenities for employees and attractions for the local community, helping to fill office vacancies and drive traffic to other on-site retailers. However, this approach requires substantial investment and long-term planning, as the high costs associated with restaurant buildouts may not yield direct profits for landlords for several years. In general, adding restaurant space takes up to eight years to break even, yet it is seen as a critical investment to increase rent premiums and overall appeal.
Operational challenges also accompany the integration of restaurants. Parking constraints can pose issues, especially in urban areas where space is limited. To address this, many office campuses, particularly older buildings with surplus parking, have introduced valet services. However, parking is not typically an issue after 5 p.m. as office workers leave for the day. Additionally, the hours of operation are often extended beyond typical office hours, with destination restaurants offering brunch, lunch, and dinner, catering to both office workers and external visitors. With the additional hours, restaurants must find creative ways to offer more parking.


In some areas, office occupancy rates have rebounded, driven by an increasing demand for smaller, amenity-rich spaces. Orange County, California, has bucked the trend of declining occupancy rates, seeing a steady expansion of tenant occupancy. Notably, Orange County office tenants expanded by nearly 650,000 square feet in the second quarter of 2024 and an additional 100,000 square feet in the third quarter. Smaller office suites have been especially popular, with over 2,000 leases signed for spaces under 5,000 square feet, accounting for 42% of leasing activity. This stands in contrast to larger office markets like Los Angeles and San Fransisco, where tenant occupancy declined by 5 million and nearly 2% of inventory, respectively, over the trailing year.
CHANGE IN SF BY MILLIONS
THE RETURN OF INSTITUTIONAL CAPITAL
The demand for Class A, amenity-rich office spaces has encouraged institutional investors to re-enter the
This demand has bolstered leasing activity, with Cousins Properties reporting quarterly leasing


The evolution of office spaces from traditional workplaces to multi-functional hubs with restaurants, fitness centers, and entertainment options marks a new chapter in commercial real estate. As landlords and investors continue to adapt to changing tenant expectations, the demand for flexible, smaller spaces with top-tier amenities is likely to persist. Office-to-residential conversions are also gaining momentum, with over 100 such projects underway in major cities as of late 2023, providing a sustainable solution to the oversupply of office space in certain markets.
By investing in high-quality, mixed-use developments, landlords are creating dynamic office environments that cater to a diverse range of tenants and visitors. This trend points to a hybrid future where office campuses serve as both workspaces and lifestyle destinations, fulfilling the evolving needs of the workforce while maximizing the value of real estate assets.
Source: CoStar, October 2024
CAREER OPPORTUNITIES AT MATTHEWS ™
SHARED SERVICES
PLATFORM
INNOVATIVE AGENT-FIRST TECHNOLOGY
INDUSTRY-LEADING DATA
CULTURE OF EXCELLENCE

SCAN FOR MORE INFORMATION


BY PATRICK FORKIN
Retail performance across the U.S. remains strong, characterized by limited availability and rising demand. As of Q4 2024, the national retail vacancy rate stands at 4.1%, while Q3 2024 saw the absorption of 4.2 million square feet—marking the sector's 15th consecutive quarter of steady demand growth.
The competitive retail landscape has prompted both investors and tenants to actively seek available spaces, setting their sights on strip malls, big-box retail, pad sites, and grocery-anchored centers. While these properties have availability for many kinds of tenants, tenant performance varies in each location and product type. Some tenants are thriving, driven by strong performance metrics and growing consumer demand, positioning them as “standout leaders” in the market. Meanwhile, other tenants are seeing the opposite and are struggling to keep pace, falling behind as “fading players.”
Changes in consumer preferences post-pandemic have bolstered the performance of strip malls across the country, with visits to this retail type increasing by 18%. The work-from-home trend that emerged during the pandemic has further contributed to its success. In addition, the convenient location of strip malls near major roads makes them easily accessible for consumers and enhances their appeal.
Strip malls tend to bring in a more diverse consumer base, making them attractive to tenants and driving higher asking rents and lower vacancy rates. The assortment of tenants will depend on each location, but investors can utilize consumer preferences to create a compelling variety of tenants. One standout performer in strip malls is beauty retailer Ulta, which has seen growing popularity among younger demographics, such as Gen Z and Gen Alpha. In response, Ulta plans to open approximately 200 new stores between 2024 and 2027. To further boost its visitations, Ulta is planning on increasing its loyalty program to 50 million users by 2028.


The retailer has already updated its interface for easier navigation and personalized product recommendations, further driving customer engagement.
In contrast, drugstores, which traditionally had a presence in strip malls and freestanding buildings, have faced declining performance in recent years. CVS announced its plans to close around 900 stores, due to decreasing profitability and lower consumer visits. Likewise, Walgreens is also making changes to its operations as it noted similar performance challenges to CVS. The tenant announced it will close around 25% of its 8,600 locations in the U.S.
Other personal goods stores, like Vitamin Shoppe and GNC, have also begun to fall behind. GNC filed for bankruptcy in 2020 and closed more than 1,200 locations. Franchise Group, owner of Vitamin Shoppe, filed for bankruptcy in November 2024. Vitamin Shoppe stores will remain open, but the company is struggling as its revenue declined by 5.5% throughout Q3 2024.
Source: Ulta Beauty
After notable closures of big-box tenants, like Bed Bath & Beyond and 99 Cents Only, experiential retailers have stepped in to stabilize this retail type’s performance. Over the past two years, experiential tenants have accounted for 15% of national leasing activity in big-box spaces. Some tenants that contributed to this growth are Crunch Fitness and Sky Zone, which have successfully repurposed vacant big-box locations.
Traditional big-box retailers, such as Target, are also adapting by exploring small-format store models to enhance their performance. Target currently has 170 small-format properties across the country, and it plans on adding more in locations where this format would thrive. Specifically, suburban areas will see more of these developments as this format can effectively serve local consumers. These compact locations are also cost-effective, helping retailers, such as Target, navigate the challenges of reduced retail availability.
Consumer interest in personal goods shopping has further fueled the expansion of discount retailers like Ross Dress for Less and T.J. Maxx. Ross operates 1,836 stores as of Q4 2024 and added 89 stores in 2024, with long-term plans of growing

to 2,900 properties nationwide. T.J. Maxx is also undergoing an expansion as the company plans to open 1,300 new stores worldwide, including the remodeling of 480 U.S. stores to accommodate its growing customer base.
However, some big-box tenants have struggled to maintain their footing. While JOANN Fabric and Crafts, together with Big Lots, once boasted their presence in big-box locations, both tenants are facing the effects of bankruptcy. In March 2024, JOANN filed for bankruptcy, but stated it will keep its 815 stores open. The firm stated it will move past its bankruptcy with $132 million in new financing, but it still struggles with decreased customer visits. Big Lots also filed for bankruptcy in September 2024, leading to the closure of 140 stores as of Q4 2024. All together, it plans on closing 494 locations, which is 36% of the stores it had at the start of 2024.


Ross Dress for Less Gross Profit & Net Income per Quarter AS OF Q4 2024
Source: Zacks Investment Research
Retailers in the food and beverage segment accounted for 20% of leasing activity over the past year, with quick-service restaurants (QSR) outperforming traditional sit-down casual dining establishments. The QSR industry has demonstrated strong and consistent growth, and Fortune Business Insights noted its market size grew from the $895.7 billion recorded in 2023 to $971.4 billion in 2024.
Similar to strip malls, QSR tenants grew during the pandemic because of health restrictions. With restaurants closing their dining areas, consumers sought out QSR locations where they could easily pick up food through a drive-thru. This trend has persisted post-pandemic with QSR visits continuing to outpace those of casual dining restaurants. The shift in consumer preferences impacted many casual dining locations, leading to closures of several properties for brands like Red Robin and Applebee’s.
One tenant that maintains its enormous presence in the QSR segment is Starbucks, and it plans on growing its locations to 55,000 stores globally by 2025. Along with its expansions, it is also incorporating new trends to its store model by
including Just Walk Out Technology. This initiative, created by Amazon, involves using cashier-less technology where customers can grab their item in store and pay digitally. The new method has already been implemented in two New York City locations, and Starbucks plans on using it in its store expansions.
Chipotle has consistently noted positive performance metrics, and is on track to continue its expansion activity. The tenant has plans to open around 315 to 345 new locations in 2025. To facilitate this growth, Chipotle has begun implementing Chipotlane in new stores. This model features a drive-thru where customers can place orders online and stop in the drive-thru to pick them up. As it moves forward with its expansion plans, Chipotle is anticipating that around 80% of its new locations will include a drive-thru.


Grocers have become a standout in the retail segment as the majority of retail construction nationally has been for grocery-anchored centers. These facilities have consistently proven to be beneficial for investors as they have high occupancy rates and low tenant rollover.
Technological advancements have further fueled the success of grocers across the nation as grocery pickups have become more adopted in stores. According to an eGrocery Market Forecast created by Brick Meets Click, online grocery activity will continue to flourish moving forward. Through 2028, online grocery sales will grow three times faster than in-store sales, and pickup grocery orders will grow by 5.4%.
While Walmart maintains its position as the largest grocer in the U.S., ALDI has gained attention for its aggressive expansion efforts. Known for offering high-quality products at significantly lower prices, ALDI plans to open 800 new stores nationwide by 2028. Its recent acquisition of Southeastern Grocers is set to enhance its presence in the Southeast, a key region for growth. The discount retailer has committed to spend over $9 billion on its expansion and store conversions, further solidifying its role as a major player in the grocery sector.

Source: Solomon Partners


While tenants’ business trends depend on many factors, the slowdown in the performance of fading players can be attributed to the rise in e-commerce and increased debt. The pandemic was also a large factor in consumer activity—especially in the grocery and restaurant segments. Consumers began to rely more on pickup options in these sectors as the pandemic limited in-person interactions, and this trend remained even after COVID-19 restrictions were lifted.
As consumer preferences continue to fluctuate, tenants must remain agile in responding to customer changes. Retailers and restaurants
that evolve their business models to match consumer trends will benefit the most, and will secure their place as a standout player in the competitive retail landscape.

GROWING RETAILERS


RETAILER BANKRUPTCIES


BY AUSTIN GRAHAM

The multifamily housing market has undergone a marked transformation from the unprecedented highs of 2021 and 2022. During those years, fueled by pandemic-driven shifts in living preferences and economic conditions, many metropolitan areas—particularly in the Sunbelt—experienced rapid rent growth and exceptionally low vacancy rates. This dynamic created a robust environment for investment, with assets of various types and locations quickly snapped up.
However, the success of that period also set the stage for a dramatic cooling. The record-breaking pace of construction during the boom years led to an influx of new supply, much of which came online in 2024. This increase in inventory coincided with a broader market shift in 2023 and 2024. Vacancy rates climbed above pre-pandemic norms, and cities that were previously rent-growth leaders in 2022 saw rents decline in 2024.
Compounding the challenges, multifamily property valuations have dropped over 20% from their peak. This devaluation raises concerns, particularly regarding properties facing imminent debt maturities. Owners of such assets may face refinancing difficulties in the current environment of higher interest rates and softer fundamentals. The once red-hot multifamily sector is now navigating a period of recalibration, with investors and stakeholders closely watching how these dynamics play out.
Source: Matthews Real Estate Investment Services™, Real Capital Analytics
Despite the current challenges in the multifamily sector, long-term economic and demographic trends suggest a strong recovery is on the horizon. Unlike the office market, which faces significant structural shifts due to changing workplace norms, the struggles in multifamily stem primarily from macroeconomic headwinds. The U.S. continues to face a housing shortage, and the demand for rental housing is bolstered by the sizable millennial and Gen Z populations. As these generations form households, the need for additional housing will only grow, driving demand well into the next decade.
The sharp decline in development starts in 2024 is another factor that will support multifamily fundamentals in the medium term. Once the current wave of newly constructed units is absorbed, the slower pipeline of new inventory will likely lead to tightening supply-demand dynamics, paving the way for rent growth and lower vacancy rates.
While a recovery in fundamentals and sales activity could begin as early as 2025, the multifamily market has undergone structural adjustments that investors must carefully assess. These include


The post-pandemic multifamily transaction market saw unprecedented levels of activity across all investor classes, including institutions, REITs, private investors, and syndicators. This frenzy drove deal flow and per-unit pricing to record highs, but the subsequent correction has exposed vulnerabilities, particularly among syndicators with less financial flexibility. While well-capitalized players managed to navigate rising borrowing costs and price declines through loan extensions or renewals, others were forced to exit the market.
By 2023 and the first half of 2024, institutional investors largely sat on the sidelines, leaving private investors as the dominant participants in a quieter transaction market. This reduced institutional competition created opportunities for smaller buyers to acquire assets at more attractive entry points compared to the peak prices of 2021-2022.
INSTITUTIONAL ACTIVITY RETURNED IN Q2 2024
Source: Matthews Real Estate Investment Services™, Real Capital Analytics
ENTERING 2025, PRIVATE EQUITY DRY POWDER IS ESTIMATED TO BE $253B, A FACTOR THAT SUGGESTS TRANSACTION ACTIVITY COULD ACCELERATE DRAMATICALLY NEXT YEAR.


Looking ahead to 2025, the dynamics are shifting. Interest rates are beginning to trend downward, encouraging large institutions and REITs to re-enter the market. These entities have amassed significant capital earmarked for multifamily acquisitions, setting the stage for a surge in transaction activity. Meanwhile, lending conditions, tightened over the past two years, are also stabilizing, positioning buyers and lenders alike to ramp up deal-making. Once market confidence improves, competition for assets is expected to intensify rapidly, rather than gradually.
This environment presents a strategic opportunity for well-capitalized investors with access to financing. Acting swiftly to secure deals in the current window could allow these buyers to build portfolios ahead of the anticipated influx of institutional competition. With the housing market on solid footing and demand poised to absorb the existing construction pipeline, another significant dip in per-unit pricing appears unlikely. Those who move now could gain a competitive edge in what is expected to be a reinvigorated multifamily market in 2025 and beyond.

As multifamily performance softened nationally, the market’s focus shifted toward high-end, stable assets, reflecting a broader strategy to mitigate risk while ensuring consistent cash flow. Private investors, who have dominated transaction activity during this period, have further influenced market trends. Notably, lower-tier but high-performing assets in secondary and tertiary markets have demonstrated resilience, maintaining relatively stable sales volumes and pricing. Suburban properties have shown a similar trend, outperforming Central Business District apartment towers in terms of sales stability.
For long-term investors, targeting well-performing buildings in prime locations remains a strategic way to safeguard value during challenging periods. Institutions active during the downturn have become increasingly selective, zeroing in on assets with strong fundamentals and predictable income streams. This strategic approach is evidenced by landmark deals like Blackstone’s $10 billion acquisition of AIR Communities in 2024, which added over 27,000 units in major markets such as Miami, Los Angeles, and Washington D.C. Such transactions underscore the attractiveness of larger, core markets, which are likely to see the sharpest increases in deal activity as institutional players re-enter the field.
Blackstone’s substantial capital reserves—reportedly utilizing only 5% of its available dry powder during its active 2024—highlight the scale of potential future investments by institutions. This aligns with a broader narrative: the absence of syndicators and undercapitalized players has cleared the way for well-funded institutions and private investors with strong lender relationships to dominate transactions in 2025. As capital deployment ramps up and competition intensifies, these players are poised to capitalize on a recovering market. For those positioned to act early, 2025 could offer an advantageous moment to secure prime assets before heightened competition drives prices upward.

The multifamily market faces a complex landscape as higher interest rates and market uncertainty temper investor activity. A wall of debt maturities looms over the sector, driven by extend-andpretend strategies that pushed refinancing into the future. Many investors are positioning themselves to capitalize on anticipated distress sales, hoping to acquire assets at reduced prices. However, this strategy could backfire, as heightened competition for distressed assets may suppress price discounts. Waiting for a wave of distress could prove less lucrative than acting proactively.
The assumption of widespread distress sales remains speculative. While multifamily distress tripled in 2024, it remains well below levels seen in previous downturns. If 2025 experiences limited distress, investors holding capital reserves might need alternative strategies to deploy their funds effectively. For those waiting for steep discounts, the lack of significant distress could lead to missed opportunities.
The fundamentals of the multifamily market further reduce the likelihood of severe distress. Concerns about rising vacancies and flattening rent growth are expected to ease as the market stabilizes in 2025. A significant undersupply of housing persists, even as the record-breaking construction wave of recent years begins to deliver new units. High borrowing costs throughout 2024 discouraged developers from launching new projects, and construction activity is projected to remain subdued from 2025 to 2027. While falling interest rates will facilitate deal flow in 2025, the lag in development timelines means that new units won’t quickly meet pent-up demand.
This dynamic creates an environment where wellcapitalized investors who move early could gain a competitive edge. By focusing on high-quality assets or well-performing properties in undersupplied markets, investors can avoid the crowded bidding for distressed sales and position themselves for growth as fundamentals improve. The time to act may be before the market consensus catches up with these stabilizing trends.


The hospitality segment was largely impacted by the high interest rate environment that occurred in 2024. Hotel performance began to decrease throughout the year as national RevPAR grew by only 1.7% yearover-year, which was driven by 1.5% rate growth. When dividing the hospitality sector, the full and select service segments noted RevPAR growth of 1.5% at the end of Q3 2024; at the same time, RevPAR for the limited service segment decreased by 2.8%.
Together with these performance metrics, sales also took a hit. Transaction volume recorded $5 billion at the end of Q3 2024. This sales activity is below the peak from 2019, and it is also around 30% lower than sales velocity from 2023. Overall, the trends noted for hotels in 2024 have led to a split in performance for each of the hospitality sectors. Hotels on the lower end noted decreases in room bookings, while higher-end hotels marked increased demand from the influx in group travel.
These dynamics underline the mixed performance within the hospitality sector, with clear distinctions between budget and premium offerings. The high interest rate environment has not only dampened operational performance, but also suppressed transactional activity.
“ Moving forward, performance in 2025 is expected to rebound.


Despite the overall decline in hotel sales volume nationally in 2024, the full service segment stood out with strong transaction velocity and notable contributions to the sector’s performance. The return of corporate and leisure travel also boosted the segment’s standout activity. Leisure travel rebounded strongly, increasing ADR by around 20% from pre-pandemic levels, underscoring robust demand for premium hospitality experiences. Group travel also played a pivotal role, increasing by 2.1% through October 2024, positively impacting larger markets and driving ADR growth by 3.8%.
Host Hotels has been an active player in boosting sales volume for this segment. In 2024, the hospitality REIT targeted Nashville for two trades as part of a portfolio. It acquired the 1 Hotel, as well as Embassy Suites by Hilton, in April 2024, and both properties are located in Nashville’s CBD. Host Hotels’ acquisition of these locations totaled $530 million, boosting full service hotel sales in Nashville to $869 million.
NATIONAL FULL SERVICE SALES ACTIVITY
Source: CoStar Group
The hospitality sector saw a slowdown in construction activity in 2024, but the select service segment emerged as a bright spot, with notable increases in inventory and strategic expansions. Room inventory for this sector grew by 3.3%, outpacing the full service segment by 0.5%.
Home2 Suites by Hilton has been actively expanding within the select service space and targeted Phoenix for one of its new developments. A key project in 2024 was the transformation of a 95-year-old building located in Phoenix’s CBD into a modern hotel. The remodeled property features 148 rooms, a meeting space, and an expanded lobby designed to accommodate both leisure and business travelers.
In May 2024, the newly-developed property sold for $43.3 million to Chatham Lodging Trust, underscoring investor interest in well-positioned select service properties.
Source: CoStar Group
$240K
$230K Forecast
$220K
$210K
$200K
$190K
$180K
$170K
$160K


Across the country, lower-end hotels have been impacted the most, with limited service construction activity decreasing more than other hospitality segments. This decline reduced inventory from 2,044,303 rooms during Q4 2023 to 2,034,351 rooms in Q4 2024. Demand in the segment also dropped as it decreased 3% from 2023 levels. The slowdown in activity for this sector can likely be attributed to the high inflation metrics that affected households across the U.S. in 2024.
Together with decreased demand, limited service operators felt the impacts of increased operating costs. This includes insurance, which rose by 38% for the hospitality sector. As of August 2024, the cost for hotel property insurance increased to around $680 per available room.
Hoteliers have also begun to struggle with contracted labor, as a result of hotel employees striking nationally. Many strikes erupted after Labor Day 2024 when employees walked out of the job to demand better pay and improved working conditions. In turn, strikes across the country create difficulties in hotel performance as hoteliers are unsure when the strikes will end.
Owners of limited service hotels have begun to sell their assets and reinvest in higher-tier properties, due to the recent challenges. This strategic move allows them to tap into market segments demonstrating resilience, such as full service and select service hotels that have benefited from the return of corporate and group travel. By selling their limited service hotels and reinvesting in higherlevel properties, owners can protect their equity, enhance their revenue streams, and set the stage for sustained growth in the evolving sector.
Source: CoStar Group

Despite the slowdown in hotel performance, some hoteliers are still recording increased performance metrics. Marriott International has been an active hotelier throughout 2024. As of Q4 2024, the firm’s pipeline grew 5% from the level noted in Q2 2024 and reached 585,000 rooms.
Marriott also announced its new brands, City Express and StudioRes, which will be limited service properties. The firm is already looking to open some City Express locations in 2025. This new brand seeks to provide an affordable stay for guests, and will be made up of 100-150 rooms. On the other hand, StudioRes will be a new location for guests in search of extended stay accommodations. This property will include studios that feature queen beds and a kitchen, and Marriott plans on developing 50 StudioRes locations across the U.S. in the long term.
Hoteliers have also increasingly begun to set their sights on extended stay properties, with demand for these hotels increasing by 3% through October 2024, compared to demand for conventional hotels increasing by 0.3%. Marriott has begun to match this trend as its other extended stay brands, TownePlace Suites and Residence Inn, are growing across the country. There are 21,000 rooms underway for TownePlace Suites, and Residence Inn is finalizing 19,000 rooms. Hilton is also matching the pace in demand with its extended stay brands Home2 Suites and LivSmart Studios. Home2 Suites has around 15,000 rooms underway, and Hilton stated it plans to open around 350 LivSmart properties nationally.
Wyndham Hotels & Resorts also boasted strong performance throughout 2024, and it grew its operations system by 4%. Its global franchisee rate improved by 40 basis points year-over-year, and its domestic sales grew 10% more in Q3 2024 than Q3 2023. The firm also noted 3% net room growth in its domestic select and full service hotels. One property that aided this performance is the reconversion of the Wyndham Garden Louisville East. The 102room select service property finished its fouryear renovation process in September 2024. The reconversion is now ready to meet guests’ needs, especially with the property’s proximity to Churchill Downs—home to the Kentucky Derby.
Source: CoStar Group, November 2024

Compared to other hospitality markets nationally, California and Florida remain successful in hotel performance as these states note consistently strong visitor numbers. Throughout 2024, these states marked increased transaction volume, with 176 trades in California and 164 sales in Florida.
As of Q4 2024, 50% of new hotel developments are in the Pacific, Mountain, and South Atlantic regions. In the South Atlantic, hotel developments remain stable in Florida—especially Fort Lauderdale. There are currently three hotels scheduled to deliver in the metro during 2025: the Omni Fort Lauderdale Hotel, Home2 Suites by Hilton Weston Fort, and the Whitfield Las Olas Hotel & Spa. The completion of all three properties will strengthen the metro’s full and select service segments.
Additionally, Related Group & Partners announced plans for a $2 billion mixed-use hotel development in the metro. The project will take up 40 acres at the Bahia Mar marina upon its scheduled opening in 2029, and will be under hotelier Marriott and branded as a St. Regis made up of 200 rooms.
On the West Coast, markets in California recorded consistent positive performance metrics throughout 2024. Particularly, Los Angeles and San Diego outperformed other markets in the state, with 2024 occupancy at 71.6% and 73.9%, respectively.
While developments declined nationally, construction is on the rise in Los Angeles and San Diego. There are about 2,000 rooms underway across 17 properties in Los Angeles, which will increase the market’s inventory by 1.9% upon completion. Standout submarkets for construction here are the Tri-Cities and East Los Angeles. San Diego will see its inventory increase by 4.4% with 12 hotels scheduled to open throughout 2026. The long-awaited Gaylord Pacific Resort Hotel and Convention Center is expected to complete in May 2025 and will be made up of 1,600 rooms. If it opens on schedule in 2025, it will bring the greatest addition of rooms in a year throughout the past 20 years.
The Midwest also records positive activity. Cleveland has made a strong recovery from its pandemic levels, and marked the highest RevPAR increase in the region with a 9.3% uptick. Indianapolis is also on the rise with a notable RevPAR boost of 7.3%.
Together with the jumps in RevPAR activity, hotel construction is ongoing in the region. Detroit and Indianapolis, combined, make up the most active delivery pipelines as more than 2,100 rooms are coming to market.
As interest rates decline, the hotel industry will likely see an increase in new supply moving forward. The Fed also expects inflation to return to the 2% target by mid-2025, which will further improve hotel activity. Despite sales declining in 2024, hotel owners have stated they expect transactions to improve during the first half of 2025, due to dry powder remaining on the market.
High inflation rates throughout the past few years have caused buyers to stay on the sidelines, but private and institutional investors are expected to come back with inflation cooling down. With inflation and interest rates softening, loans will be more accessible for investors to secure.

MITCHELL GLASSON
mitchell.glasson@matthews.com (949) 432-4502
MABELLE PEREZ
mabelle.perez@matthews.com (786) 206-9739
RYAN SANCHEZ
ryan.sanchez@matthews.com (949) 287-5854
DOMINIC HENDERSON
dominic.henderson@matthews.com (310) 561 8254
LUKE WHITTAKER
luke.whittaker@matthews.com (317) 493-0055
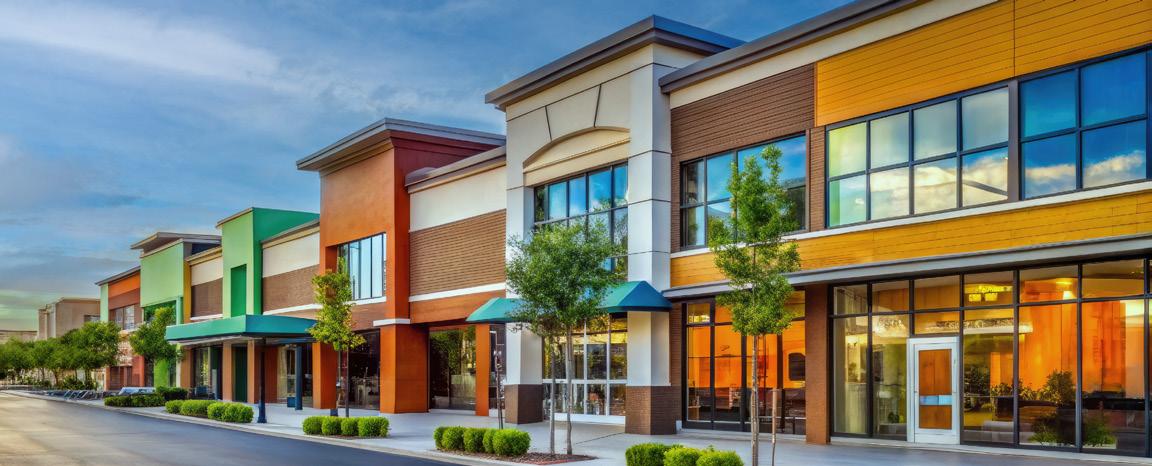
BY MATT LOPICCOLO
During the 2010s, media and investor sentiment regarding retail centers was overwhelmingly negative. Talks of a “Retail Apocalypse” swept through the media landscape, with many retailers feeling the effects of the recession that emerged from the 2008 financial crisis. Consumer spending growth was muted, employment markets were slow to recover, and a potentially industry-threatening factor loomed, the rise of e-commerce.


Online ordering for retail goods was hardly a new concept by the 2010s. Many investors believed e-commerce growth would spark the death of brick-and-mortar retail. Developers began pursuing alternative property types rather than constructing new retail centers, greatly diminishing the effects of new supply in the market. Why would the nation need so much brick-and-mortar space if shopping was taking place online?
These predictions were correct about e-commerce’s rapid growth, but at the same time, shopping centers have become a darling of the CRE industry. Record-low vacancy, stable rent growth, and resilient sales metrics have propelled retail centers from an underperforming asset class to a preferred category within the industry. All while e-commerce retail sales climbed 588% from 2010 to 2024.
Source: U.S. Census Bureau
The fear of a “retail apocalypse” heightened again in 2020, when COVID-19 restrictions and lockdowns enabled online shopping to accelerate. More people were ordering brickand-mortar staples like groceries online, and service-based businesses were forced to close their doors. Once again in the face of doubt, consumers returned to retail centers in full force, driving the property type to new heights while other property types struggled to grapple with rising interest rates.
Physical retail has been so successful in the face of these threats for a multitude of reasons. For many industries, like grocery, drugstores, and restaurants, online ordering has only served to augment physical space demand. In store or curbside pickup allow for heightened retailer revenue per location, helping many firms keep doors open during the pandemic and helping firms expand post-pandemic. Other retailers saw opportunity in what consumers missed during lockdowns, launching huge operations in the experiential retail segment, highlighted by the profound growth of facilities ranging from pickleball clubs and gyms, all the way to nail studios and hair salons. The result is an economy where online retail is rapidly growing, but in addition to in-store retail, rather than at its expense.

Grocery-anchored retail has long been a staple of many institutional grade retail portfolios. The foot traffic generated by these centers benefits surrounding tenants, boosting its value to investors for both its limited risk and potential for stable and growing rents. While many were scared that Amazon’s purchase of Whole Foods would end grocer’s retail dominance, this segment has only strengthened its position since Amazon entered the grocery game.
Even with the expansion of online groceries by both Amazon and Walmart, the two biggest players in the segment, grocery sales remain heavily skewed towards physical stores. This is especially true when compared to other retail segments like electronics, apparel, and furniture. Even with expanded online ordering, restaurant foot traffic grew more rapidly than any other retail segment from November 2023 to November 2024, according to Placer.AI.
Profitability is likely to pressure restaurant and
DESPITE GROWTH, ONLINE GROCERY SALES LAG OTHER CATEGORIES
Source: U.S. Census Bureau

At the same time, the food industry is experiencing unbelievable growth and has been fueled by the expanding use of food delivery apps. Restaurants converted space into pickup areas, many of which remain entering 2024, years after in-person service National chains like CAVA, Dutch Bros, and Wingstop have stepped up space demand, filling the void left by struggling legacy chains like Red Lobster, Boston Market,

These new restaurants and coffee shops prefer smaller spaces, usually around 3,000 square feet. Limited new development in this tranche has restaurant leasing competition near all-time highs. The lack of new development of such spaces, in combination with increased consumer demand for food services, has created a leasing environment where chains are having trouble finding available space, and roughly 75% of the new space that is constructed is already pre-leased. The slowdown in office construction has exacerbated the retail space shortage, as many office properties typically contain ground floor restaurant space, especially in
Consumers were clear in what they wanted out of retail spaces coming out of the pandemic, and that is an experience. Experiential retail comes in various forms, ranging from interactive displays augmenting traditional retail stores to fully immersive experiences. Traditional retailers like Dick’s Sporting Goods recently launched its “House of Sport” concept at 12 locations nationwide. House of Sport locations recorded a 7.2% increase in foot traffic last year, while traditional Dick’s locations saw traffic decrease 2.3% over the same period. Specific features of these locations include climbing walls, batting cages, and golf simulators. Dick’s success in this area has prompted plans to renovate 100 more stores into experiential concepts, capturing a portion of the market that is looking for more than what the convenience of e-commerce offers.
Non-traditional tenants have also gained substantially by offering customers an experience rather than a product. Some of the top retail leases signed in 2024 include gyms and athletic clubs, highlighted by the rapid growth of pickleball facilities and clubs. Smaller format gyms and boxing clubs have aided demand for mid-sized spaces, and firms like The Picklr, Chicken N Pickle, and even mini-golf tenants like Puttshack have effectively merged exercise and entertainment with their concepts. These kinds of experiences are irreplaceable by a phone or computer, insulating demand from online shopping trends.
Another segment of traditional retail that has benefitted greatly from its irreplaceability, is health and beauty retailers. While many people thought this segment could see a major shift to online sales during the pandemic, health and beauty providers ranging from nail and hair studios to makeup stores have thrived in the post-pandemic landscape. Beauty related retailers recorded 54% more visits in December 2023 than they did in December 2020, and most experts expect holiday retail sales to increase again in 2024. These strong demand drivers are one reason why Ulta Beauty and Sephora are major lease signers entering 2025.
While e-commerce does allow consumers to consume goods without utilizing physical space, its emergence and growth are hardly existential threats to the brick-and-mortar industry. Traditional retailers have found ways to get more out of their existing spaces by utilizing online channels, and an entire new kind of retailer has emerged to fill the experiential void online shopping’s convenience removes from retail consumers. The past calls for a “retail apocalypse” stifled development, in turn strengthening the brick-and-mortar retail outlook.
Looking ahead, younger consumers are more likely to utilize online challenges when buying goods. But, demographic trends suggest consumer spending is poised to grow so sharply, both in-person and online, that retail has an exceptionally bright outlook. The millennial cohort is on the verge of replacing Gen X as the top family formation generation, and a large influx of 30–50-year-olds suggests retail spending will rise substantially before the end of the decade. At the same time, the slightly smaller Gen Z is beginning to graduate college and enter the workforce, giving these older Gen Z’s substantial spending power in the economy for the first time. More young and well compensated consumers will boost overall spending on goods and services, both online and in-person for decades to come.
POPULATION BY AGE
Source: U.S. Census Bureau
BY MATT LOPICCOLO
matt.lopiccolo@matthews.com (858) 289-3957


BY DANIEL WITHERS

Developers, lenders, and owners are preparing for the next cycle. With the anticipation of interest rates coming down, inflation slowing, and an emerging gap in the multifamily market, owners are left to contend with where expenses will fall in 2025. In the last few years, insurance premiums and utility costs have placed disproportionate pressure on owners—accounting for 17% of total expense growth despite representing only 8% of total expenses. The latter part of 2024 brought a brief reprieve on insurance pricing, but the sentiment is mixed for 2025. The catastrophic fires in Los Angeles, among the most destructive in California’s history, are likely to drive historic increases in insurance premiums while exacerbating the region’s housing shortage. Some experts caution that this relief may be short-lived, considering the recent Fall hurricane and early fire season in 2025. In contrast, others suggest that even significant storm-related losses may not dramatically shift multifamily insurance costs. Despite the sentiment, insurance, and utility costs are still higher than pre-COVID, eroding NOI for many owners.
Before the pandemic, average insurance expenses hovered around $30 per unit per month, but by November 2023, they had climbed to approximately $65 per unit per month—a staggering 119% increase over four years, according to RealPage. In 2024, Los Angeles premiums surged by 30% year-over-year, and estimates suggest 2025 could bring further hikes, especially following the destruction of over 10,000 homes and structures in the fires. In certain markets, the figures were even more striking: in the West Palm Beach metro area, annual insurance costs soared to more than $1,800 per unit or $150 per unit per month. These spikes contribute heavily to rising overall operational costs, pushing the average cost per apartment unit up by 33% year-over-year, reaching $180 per unit.
This surge, coupled with a wave of market retrenchment as carriers reduce coverage, decline renewals, and exit what carriers believe to be high-risk markets, leaves apartment owners facing unprecedented operational burdens and few competitive insurance options. For example, as of late 2024, one in five homes in the Pacific Palisades was covered by California’s FAIR Plan,
the insurer of last report, signaling insures’ retreat from high-risk areas. As a result, NOI is under pressure, complicating debt options and making refinancing more difficult.
The situation is especially challenging for affordable housing developers, who must contend with stricter insurer requirements, soaring deductibles, and higher premiums that impact their ability to supply much-needed affordable units. Without meaningful relief, the capacity to meet demand and sustain the sector’s long-term health is at risk.
Growth in Costs by Expense Category
Source: Yardi Matrix
Natural disasters are poised to shape the insurance landscape in 2025, with floods, hurricanes, fires, and earthquakes impacting the nation in 2024. For example, the devastating Los Angeles wildfires, estimated to cost $135 billion to $150 billion in total damages, are the costliest in state history and are expected to further strain the insurance market and drive premiums higher statewide. On average, natural disasters drive premiums two to three times higher, especially in states like California and Florida.
Source: Yardi Matrix, RealPage
Beyond environmental factors, older multifamily properties with outdated infrastructure face growing scrutiny, as antiquated electrical panels and other legacy systems make them riskier and more expensive to insure, pushing insurers to raise rates or avoid coverage altogether. Rebuilding efforts in Los Angeles will be further challenged by material shortages, permitting delays, and skyrocketing costs, with developers already operating under constrained conditions.
Moreover, insurance practices increasingly consider crime rates, disproportionately affecting affordable housing developments and further elevating costs. While newer affordable housing constructions are somewhat insulated thanks to modern infrastructure that appeals to insurers, this protection still doesn’t entirely offset the challenges of development affordability without government subsidies. Meanwhile, inflation increased the cost of repairs,
materials, and labor, and a shrinking reinsurance market compounds these costs, leaving apartment owners grappling with higher premiums.
Compounding these pressures, apartment owners in places like Los Angeles must now contend with rising utility expenses, as updated waste management programs and elevated energy costs push electricity and trash service bills up by as much as 20%. For older, master-metered properties, the inability to pass these escalating utility costs onto tenants only exacerbates the financial strain, making it increasingly challenging for owners to maintain a stable and growing NOI. Texas and Florida grapple with hurricane threats and flood zones so severe that some insurance providers have exited these markets entirely. At the same time, areas like the Midwest, though less prone to natural disasters, still contend with inflation-driven operational cost hikes.
Houston-based Camden Property Trust reported better-than-expected Q2 2024 performance due to a 3% decline in insurance costs, marking a reversal from the 40% increase in 2023.
Similarly, Memphis-based MAA achieved a 1% decrease in premiums when renewing its property and casualty program, providing relief after years of steep cost hikes, but it does not anticipate further declines in 2025. However, not all firms share this optimism—Chicago-based Equity Residential saw a 10.4% rise in insurance costs during Q2 2024.

FIRE RISK REMAINS A CRITICAL CONCERN (ESPECIALLY IN CALIFORNIA) AS NEW MULTIFAMILY DEVELOPMENT OFTEN RELIES ON WOOD-FRAME CONSTRUCTION.
The still-fragile property insurance market makes precise budgeting difficult for multifamily owners. While property rate increases have moderated, with most asset classes experiencing risk-adjusted property rate hikes of 0% to 10%, the multifamily factor faces challenges, especially in casualty insurance. Primary liability costs are projected to rise by 10% to 20%, while umbrella rates are expected to increase by 10% to 15%. Concerns about crime scores are driving heightened scrutiny from underwriters.
Nationwide, multifamily property values have declined by 3.6% since 2019, with the South-Central region and Florida experiencing the steepest drops.
Interestingly, in regions like South Florida and California, where owners have seen some of the most substantial increases in insurance premiums, their effect on value is less as resilient rent demand and rent growth during 2021 and 2022 have mitigated the adverse effects on NOI. Comparing property values from 2023 to 2024, Los Angeles has experienced an approximate 1% increase, despite a modest decline of 0.73% since 2019.
While insurance costs have been a significant factor in property value declines, other drivers—such as higher cap rates, rising vacancies, slowing rent growth, and higher interest rates—have played even larger roles. Encouragingly, these trends appear poised for reversal. Shrinking supply pipelines, strengthening renter demand, and above-average rent growth in many markets are likely to buoy values.
Apartment owners have several proactive strategies to combat rising insurance and utility costs while enhancing their portfolios’ long-term health. Upgrading older infrastructure, such as replacing outdated electrical panels, can reduce fire risk and improve properties’ insurability, making them more attractive to insurance carriers. Owners can also explore insurance options through multiple brokers, bundle policies for discounts, and adjust deductibles to secure competitive rates. Encouraging residents to adopt renter’s insurance via platforms like RealCoverage— offering deposit insurance from as low as $8 per month—can mitigate owner risk and streamline insurance management while improving resident satisfaction and retention. Additionally, implementing Utility Management Programs, such as Ration Utility Billing Systems (RUBS), and investing in energy-efficient upgrades can lower consumption, protect NOI, and foster sustainable, resident-friendly communities.
Developers are also adopting climate-resilient materials and designs to protect properties
from extreme weather and achieve financial and operational benefits. Innovations like fireproof steel balconies, durable stone façades, and dynamic smart glass enhance properties’ ability to withstand floods, wildfires, and intense heat. Although these materials involve higher upfront costs, they offer substantial long-term returns, including lower repair and maintenance expenses, potential insurance premium credits, and improved energy efficiency.
The insurance market may begin to show signs of stabilization of properties situated outside of high-risk areas, with modest rate increases anticipated for well-maintained, low-risk assets, even as ongoing challenges persist in regions prone to catastrophes. On the utility front, rates are expected to continue climbing, especially in large metro areas with aging infrastructure—such as Los Angeles, where projected water rate increases, and sewer upgrades are poised to drive costs upward. Against this backdrop, apartment owners should remain vigilant and adaptable, preparing for evolving market conditions by implementing comprehensive asset and risk management strategies that help maintain a stable NOI and foster long-term operational resilience.