2021AROUNDTHEMALLEE


Mallee Sustainable Farming (MSF) Inc. a farmer-driven organisation committed to delivering research and extension services for the less than 350 mm rainfall Mallee region of NSW, VIC & SA.
MSF was formed in 1997 in response to a recognition that conservation farming practices still needed to be widely adopted across the region. There was a need to identify issues restricting adopting of technology that would enhance profitability and sustainability of farming systems. In the years since, MSF activities have led towards increased profitability across farms along with environmental and social benefits across regions.

Membership benefits include staying informed of research, trials and events that MSF delivers. We also engage members to help guide future RD&E applications.
Having a significant membership base gives MSF, a stronger voice when advocating for delivery of the new RD&E activities in our region.
We’re offering free memberships for all those who own or work on farms in the VIC, NSW & SA Mallee regions- so don't miss out, register today.
Sign up to become an MSF member on the website: www.msfp.org.au/membership

Amelioration responses in Mallee Sands 1
Paddock scale assessment of the impact of deep ripping on legume crops in the South Australian Mallee 5
Long term nitrogen management for sustainable farming systems in southwest NSW: 2021 season update 12
Farming can now access an online guide to fixing Mallee Seeps 16

Regenerative Agriculture in the low rainfall zone 20
Virtual fencing as a future paddock grazing management tool for mixed farmers: Weed control benefits 24
Authors:
Therese McBeath, Lynne Macdonald, Rick Llewellyn, Bill Davoren, Willie Shoobridge, Rachel Hennessey, Murray UnkovichCSIRO Agriculture & Food, Waite Campus
Funded By: GRDC (CSP00203)
Project Title: Increasing production on sandy soils in low and medium rainfall areas of the Southern region.
Peer Review: Nigel Wilhelm (SARDI)
● Physical constraints to crop water use are present in many sandy soils of the Mallee.

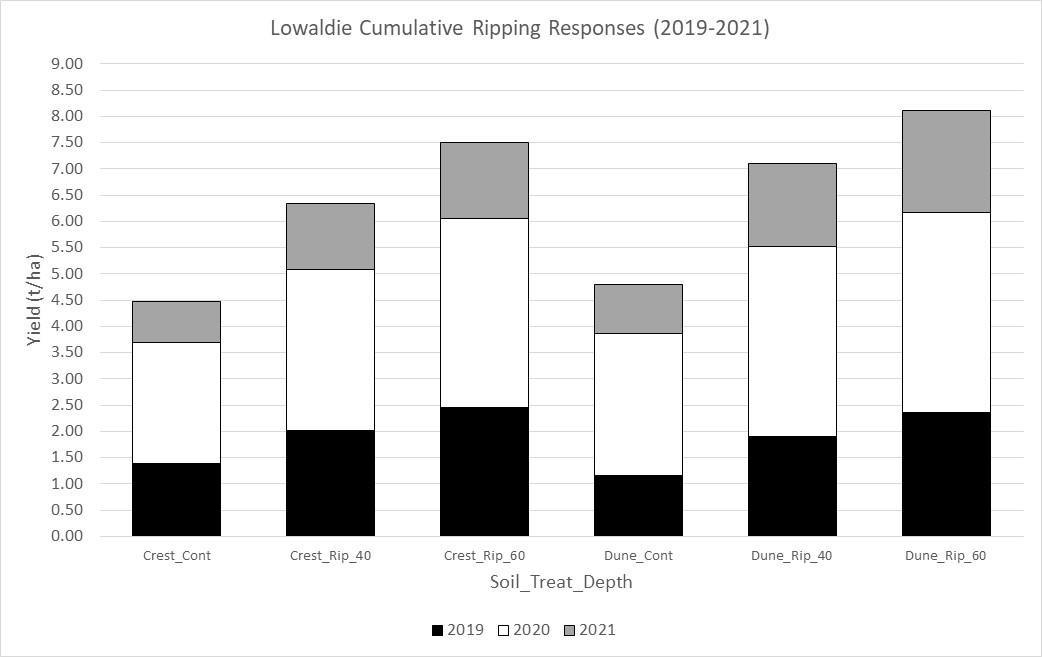
● Lowaldie had barley yield gains of up to 1.0 t/ha in 2021, 3 years after ripping, with 3.0- 3.3 t/ha benefit over 3 years.
● At Waikerie there were no indications that ripping or amendments had any benefits, 4 years after being implemented.
The aim of this work is to increase crop water use in underperforming sandy soils in the Southern cropping region by improving diagnosis and management of constraints. Water use and yields on sandy soils are commonly limited by a range of soil constraints that reduce root growth. Constraints can include a compacted or hard-setting layer inhibiting root proliferation, a water-repellent layer causing poor crop establishment, soil pH issues (both acidity and alkalinity) and/or poor nutrient supply. To achieve the best possible profit-risk outcomes, we are testing strategies implemented with the seeder (e.g., guided row sowing, seed placement, wetting agents, fertiliser placement, furrow management), through to high soil disturbance interventions (deep ripping, spading, deep ploughing) that require specialised machinery. Here we discuss the 2021 results from our sites at Lowaldie (near Karoonda) and Waikerie where the residual effects of ripping with and without amendments (chicken litter or fertiliser) were monitored.
A range of intensive interventions were implemented at Waikerie in 2018 to evaluate the value of increasing the depth of ripping with or without amendments (chicken litter (manure) @ 2.5 t/ha or nutrient inputs from fertiliser to match chicken litter) (Table 1). The shallow fertiliser treatment was banned at 8 cm depth prior to sowing while chicken litter was spread on the soil surface. In 2021 we measured the residual (fourth crop after ripping) responses to these treatments. The trials were sown with Astute triticale on 20 May with 20 kg N/ha and 10 kg P/ha as urea and MAP across all treatments. The 2021 season was below average with 136 mm growing season rainfall (164 mm average) and 215 mm annual rainfall (253 mm average).
A trial was established on two soil types (dune crest and deep sand) at Lowaldie in 2019 testing the response to nil, 40 cm or 60 cm ripping depth (Table 1). The plots were sown in 2021 with Spartacus barley on 1 June. A fertiliser rate of 10 kg P/ha was applied at sowing and a total of 60 kg N/ha was applied through the season (40 kg N/ha at sowing and 20 kg N/ha on 19 August). The 2021 season had below-average rainfall with 149 mm in the growing season (237 mm average) and 229 mm for the year (337 mm average).
Table 1. SA Mallee treatments indicating the type of physical intervention approach, amendments used, and placement strategy.
Site(Yrest) Treatment (depthcm) AmendmentType Amendment Placement
Waikerie1(2018) Rip(30),Rip(60) ChickenLitter(2.5t/ha),fertilisermatchedatripping time deep,surface
Lowaldie(2019) Rip(40),Rip(60) Nil
The unamended control and ripped treatments had the most soil water pre-sowing with 66 (ripped)- 79 mm (control) in the top metre, while the no rip plots that received chicken litter or matching fertiliser nutrients in 2018 had the lowest level of soil water with 59-62 mm (Table 2). These nutrient rich plots were some of the higher yielding plots in 2020. Pre-sowing profile mineral Ns were widely varying from 86 kg N/ha/m to 241 kg N/ha/m for the fertiliser placed at 30 cm. An enriched N layer was found around the treatment depth and in the deepest layer for the deep fertiliser treatments. While fertiliser and deep chicken litter treatments had higher soil mineral N in general, the magnitude of effect was not consistent despite the same amount of N being applied for each treatment. Establishment counts were not affected by treatments and averaged 129 plants/m2 while GS31 biomass with undisturbed plus chicken litter had more biomass than all other treatments. These differences were not present later in the growing season due to the dry conditions. Severe hail damage prevented any assessment of grain yields.
Table 2. Waikerie 2021 in-season measurements in response to ripping and addition of amendments and fertiliser in 2018. Within a column, a treatment appended by a different letter is significantly different from another (P=0.05). CL is chicken litter.
Treatment Pre-sow water(m intopm)
Pre-sowN (kg/hain topm)
GS31 biomass for triticale (t/ha)
GS31soilN (kg/haintop 70cm)
Norip 79a 86cde 0.21b 47cd
Norip_CL_surf 62b 104cde 0.40a 37d
Norip_fert_match 59b 125bc 0.26b 53bcd
Rip_30_CL_deep 70ab 105cde 0.24b 52bcd
Rip_30_fert_deep 68ab 241a 0.22b 69ab
Rip_60_CL_deep 66ab 84cde 0.28b 51bcd
Rip_60_fert_deep 66ab 155b 0.20b 72a
LSDatp=0.05 12 42 0.10 17
At the time of sowing, there was 89-128 mm of water in the top m of soil in 2021 but low N availability with only 1325 kg mineral N/ha (Table 3), regardless of treatments. Crop establishment was not affected by treatment averaging 96 plants/m2 on the dune soil and 90 plants/m2 on the crest. Crop growth was quite variable on the crest and no significant differences in biomass between treatments were measured. However, there was 0.32 t/ha more biomass in response to deep ripping at 60 cm in the deep sand.
Table 3. Lowaldie 2021 in-season measurements in response to ripping and addition of amendments and fertiliser. Within a column, a treatment appended by a different letter is significantly different from another (P=0.05).
Treatment Name
Pre-sow mineralN (kg/hain top metre)
GS31 biomass for barley (t/ha) DeepSand
Pre-sow water(mm intop metre)
Norip 25 105 0.45b
Rip@40 17 108 0.61ab Rip@60 23 128 0.77a LSDat p=0.05 NSD NSD 0.22 Crest
Norip 22 89 0.38
Rip@40 15 105 0.55
Rip@60 13 94 0.63 LSDat p=0.05 NSD NSD NSD
Ripping in 2019 generated substantial barley yield benefits in 2021 with 0.47 to 0.64 t/ha increases with ripping to 40 cm and 0.66 to 1.02 t/ha increases with ripping to 60 cm depending on the soil type (crest vs. dune) (Figure 1).

Large physical interventions (ripping, spading, deep cultivation) can improve crop productivity in hard-setting sandy soils, but there are risks of small yield benefits or even yield loss in very low rainfall seasons which can be difficult to recover. At a cost of $100/ha for ripping, the Waikerie and Lowaldie sites have strongly contrasting risk vs. reward outcomes (Waikerie 4-year yield response +0.2 t/ha and Lowaldie 3-year yield response +3.32 t/ha).
The question must be asked, what is different between the Lowaldie and Waikerie sites that might cause this contrast in outcomes? We think that the difference in rainfall is important. In 3 of the 4 seasons at Waikerie, the growing season rainfall was around 100 mm, so the frequency of water stress was a critical constraint across all treatments at this site, limiting any benefits from loosened sand. In addition, the soil below the ameliorated layer is quite different at the two sites. Lowaldie is deep sand with some clay (20%) from 70 cm depth, while Waikerie has a rocky layer from 40-50 cm depth. Therefore, it is likely that there is far less water in the Waikerie system which is accessible for the ameliorated crop to convert to extra yield.
The research undertaken as part of this project is made possible by the significant contributions of growers through both trial cooperation (Schmidt and Loller families) and the support of the GRDC.


The broader Sandy Soils Project team is gratefully acknowledged for valuable input.

1Frontier Farming Systems
Funded By: Natural Resources SAMDB
Project Title: Paddock scale assessment of the impact of deep ripping on legume crops in the SA Mallee.
Peer Review: Karen Moodie
Key Words: Legume crops, deep ripping, sandy soils, groundcover
Key Messages
● Two demonstration sites were established near Lameroo to compare ripped and un-ripped treatments in field peas and faba bean.
● Previous small scale trials have shown significant increases in pulse crop production and yield from deep ripping sandy Mallee soils; however, this effect was unable to be replicated in either paddock in 2021.
● Lameroo experienced a very dry growing season and delayed autumn break, which may have limited yield potential and, therefore, the ability for the legume crops to respond to the deep ripping treatment.
The Murraylands and Riverland Landscape Board and Mallee Sustainable Farming have identified that legume crops grown on sandy soils in the South Australian region are providing sub-optimal levels of both productivity and vegetative ground cover protection. The consequence ofthis isthat the soil condition benefits provided by the legume crop during the growing season are rapidly lost due to subsequent wind erosion on these soils. This leaves the soil vulnerable to ongoing erosion and can lead to reduced productivity and groundcover protection of subsequent crops. Small scale research trials have shown that deep ripping can significantly improve the productivity of legume crops grown on sandy soils, with up to 300% increase in legume biomass and grain yields recorded.
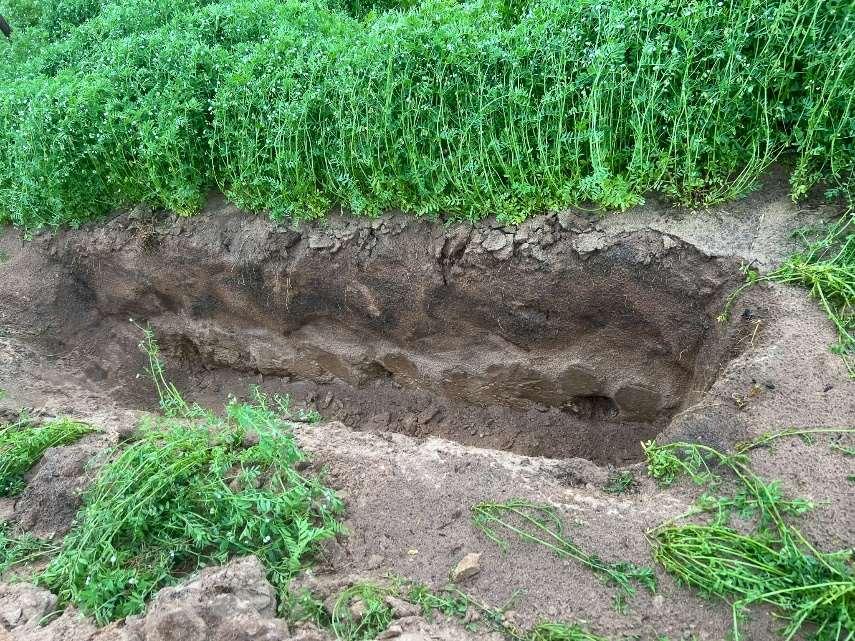
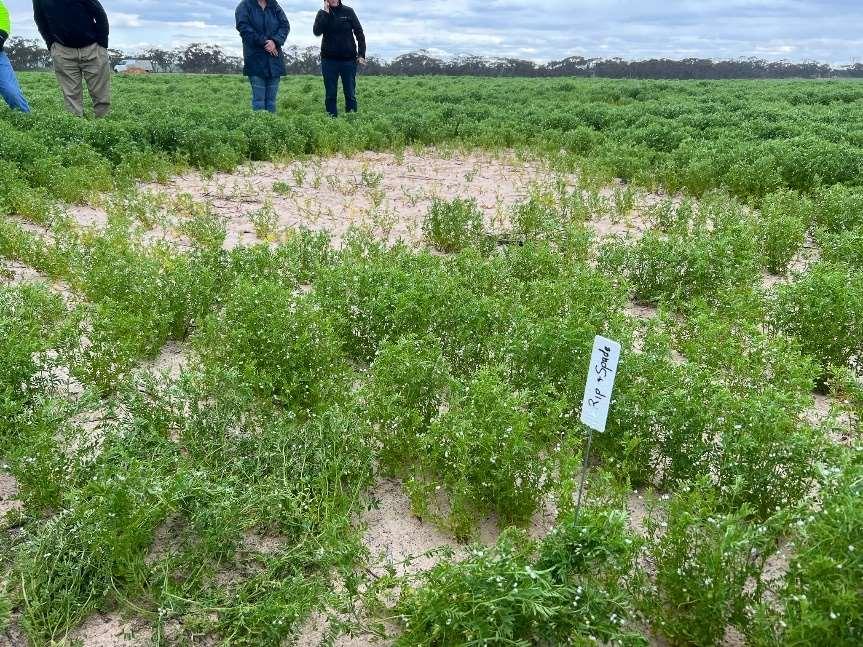
Two sites were established in 2022 to demonstrate deep ripping in faba beans and field peas on a commercial scale. The paddocks were located approximately 25 km North West of Lameroo in the South Australian Mallee. One site was sown to Faba Beans, and the other site was sown to Field Pea. In April, the collaborating farmers implemented a single deep ripped strip in each paddock, approximately 20 m wide (Figure 1 and Figure 2). Within each paddock, paired monitoring sites were established so that each 20 x 20 m monitoring area within the deep ripping was adjacent to an equivalent sized monitoring area within the unripped section of the paddock.
Figure1.Overviewofthefababeandemonstrationpaddock.Theblackpolygonshowsthelocationofthedeeprippingstrip. Thewhitesquaresshowthelocationofthefour20mx20mmonitoringsiteswithinthedeeprippedstripandadjacenttothe stripintheunrippedarea
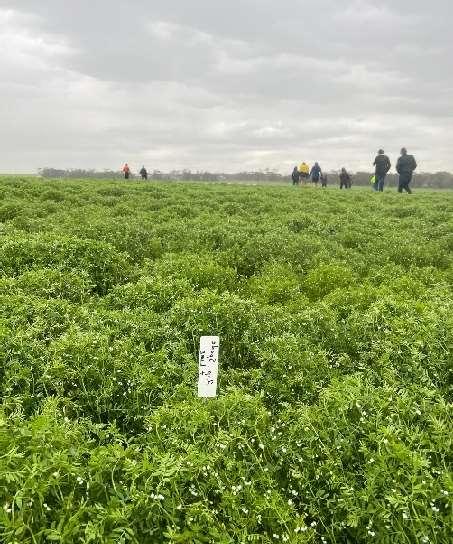
Figure2. Overviewofthefieldpeademonstrationpaddock.Theyellowpolygonshowsthelocationofthedeeprippingstrip. Thewhitesquaresshowthelocationofthefour20mx20mmonitoringsiteswithinthedeeprippedstripandadjacenttothe stripintheunrippedarea.
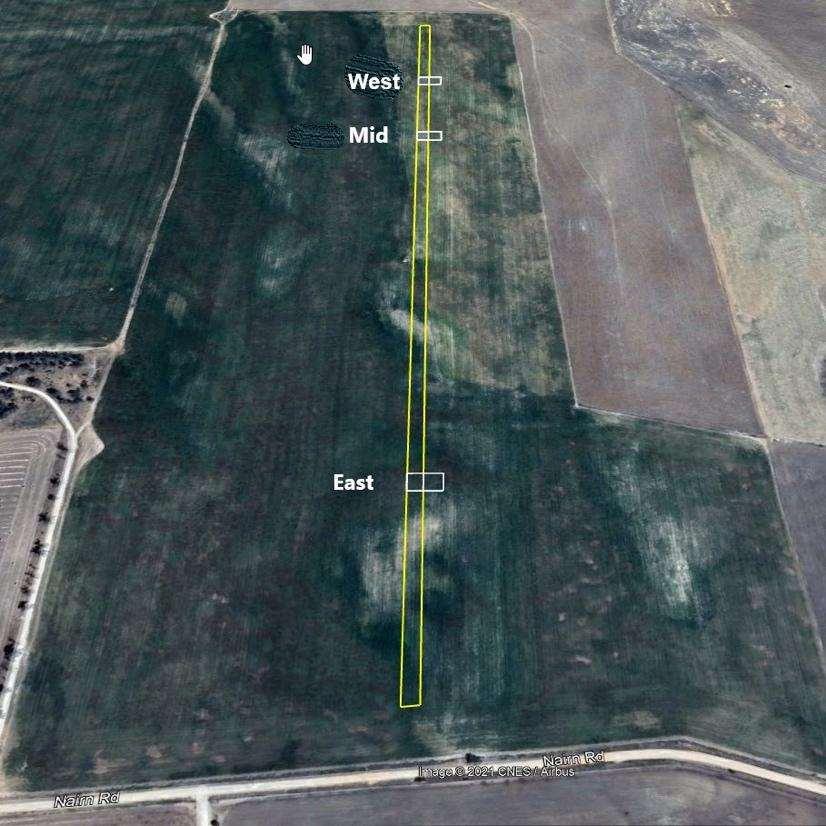
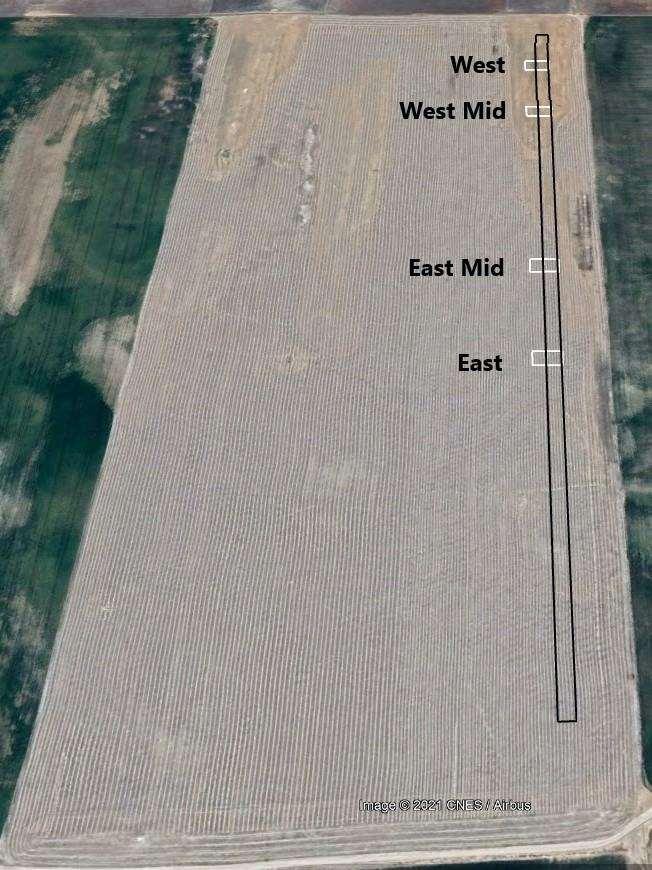
In the faba bean paddock, four monitoring sites were established, while three sites were established in the field pea paddock (Figure 1 and Figure 2). Both commercial crop paddocks were sown and managed by the collaborating farmer.
The crop inputs used by the farmer in each paddock are provided in Table 1.
Table1. AgronomicinputsappliedtotheFabaBeanandFieldPeademonstrationpaddocksin2021.
FabaBean FieldPea
Input Rate Input Rate
Variety PBASamira 100kg/ha PBAPearl 100kg/ha
Terbyne750WG 1kg/ha Diuron900WG 0.55kg/ha
PreEmergent Herbicide
ConquestDargo500SC 1L/ha ConquestTriconFlexi 480 1.2L/ha
ConquestTriconFlexi480 1.2L/ha
Fertiliser DAPS 50kg/ha DAPS 50kg/ha
Herbicides
ConquestNitro240 0.5L/ha ConquestNitro240 0.5L/ha Haloxyfop520 0.08L/ha Haloxyfop520 0.08L/ha LeopardHerbicide 0.19L/ha LeopardHerbicide 0.19L/ha
MCPA750 0.1L/ha ConquestDefcon500SC 0.15L/ha
Fungicide Orius430SC 0.145L/ha NufarmSpinFloSystemic Fungicide 0.5L/ha
Insecticide KarateZeonInsecticide 0.036L/ha KarateZeonInsecticide 0.036L/ha
Desiccants Spraytop250SL 0.8L/ha Spraytop250SL 0.8L/ha ConquestSanction200 0.75L/ha ConquestSanction200 0.75L/ha
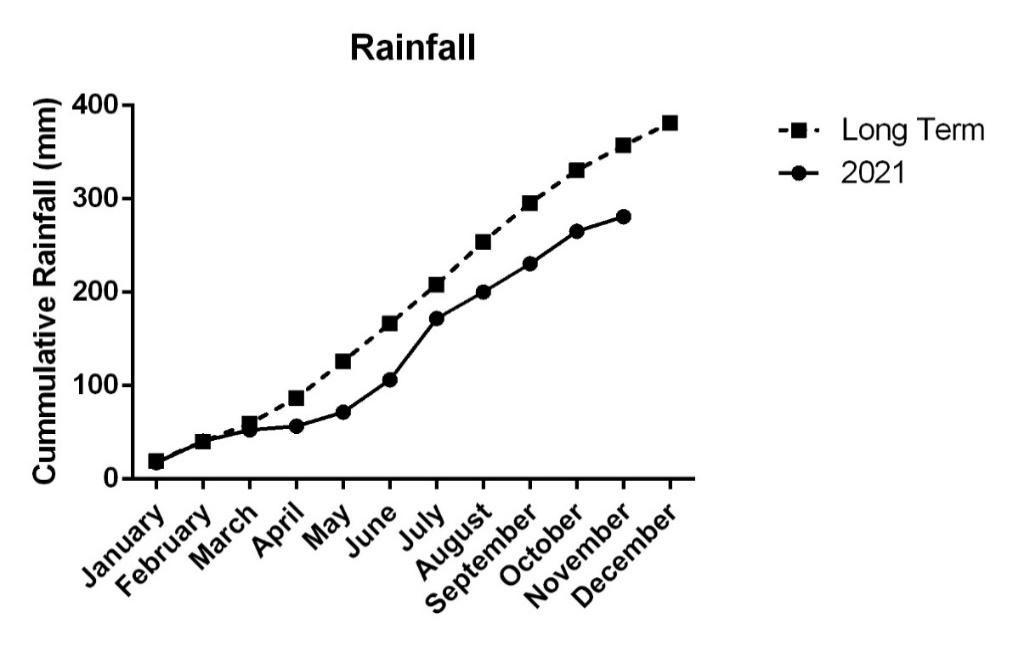
The region experienced well below average rainfall in the first half of the year. Cumulative rainfall up until the end of June was approximately 40 percent lower than the long-term average (Figure 3). This resulted in the soil conditions being very dry when deep ripping was undertaken. Furthermore, low and sporadic rainfall events posed significant problems for germinating crops, especially for crops sown dry into non-wetting sands.
Figure3. Cumulativerainfallforthe2021seasoncomparedtothelong-termaverage.RainfalldatasourcedfromtheBOM Parrakieweatherstation.
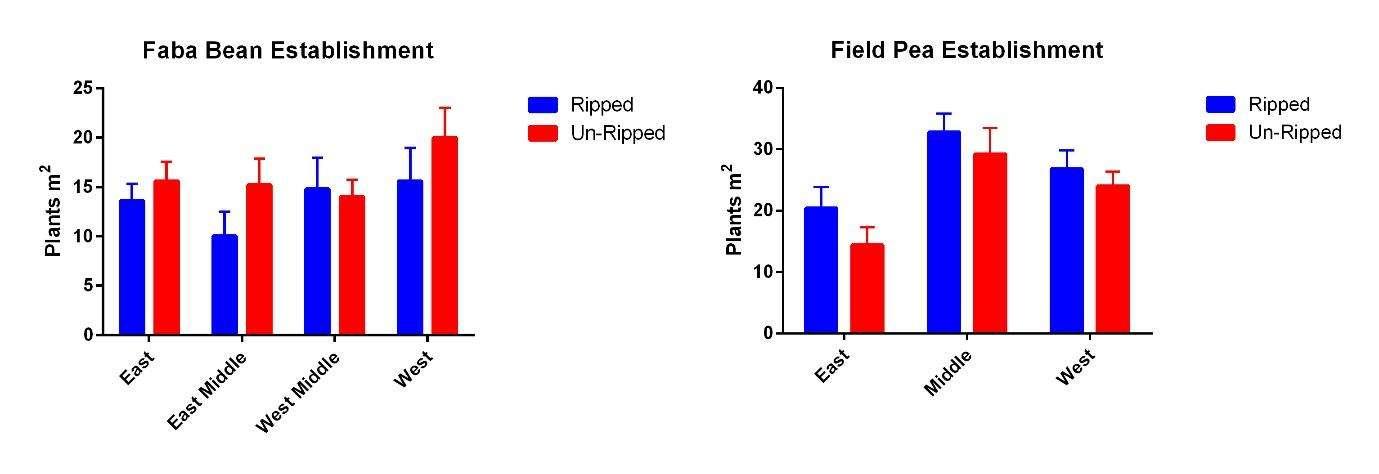
Crop establishment was measured on the 23rd of July 2021 for both sites. Within each 20 x 20 m monitoring area, the number of established faba bean or field pea plants was assessed in ten 0.5 x 0.5 m quadrats.
For the faba beans, the establishment was slightly better in the un-ripped plots; however, the reverse was confirmed at the field pea site. However, for both crops, the overall establishment was less than expected. For example, the recommended plant density for faba beans is around 25 plants m2, and for field peas are, approximately 45. The exceptionally dry soil and small and infrequent rainfall events likely led to poor crop establishment on these nonwetting soils in 2021.
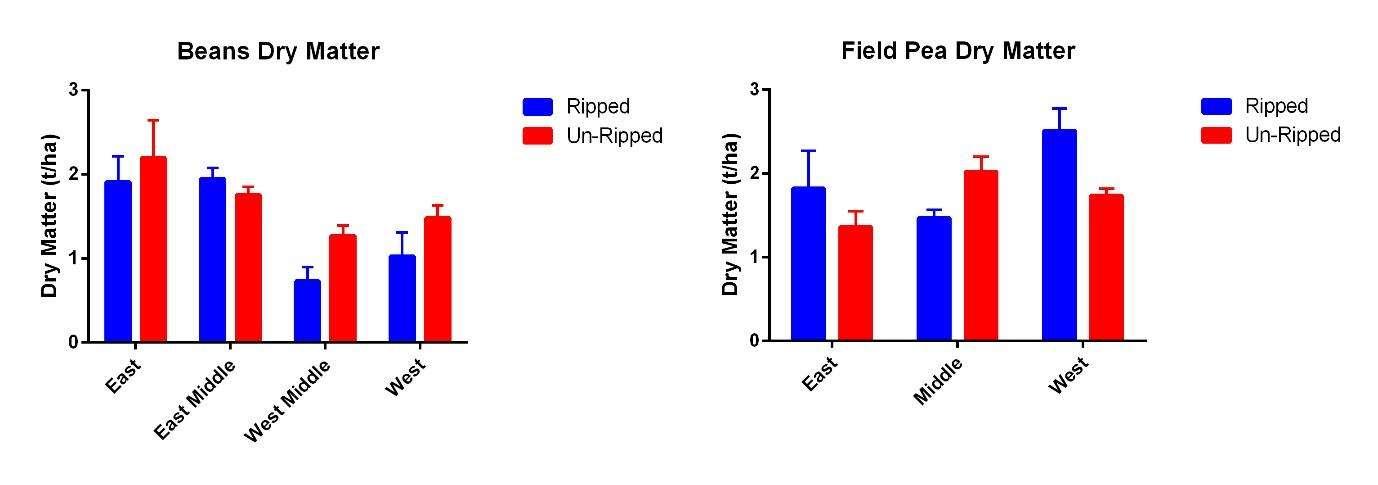
Dry matter followed a similar pattern to the establishment for each crop (Figure 5). Biomass was low, and on average each crop produced less than 2 t/ha. Biomass production has likely been limited by low crop density numbers but also from competition from the herbicide resistant ryegrass at each location. Figure5.Fababeanandfieldpeadrymatterwasmeasuredforeachmonitoringareawithineachdemonstrationsite.
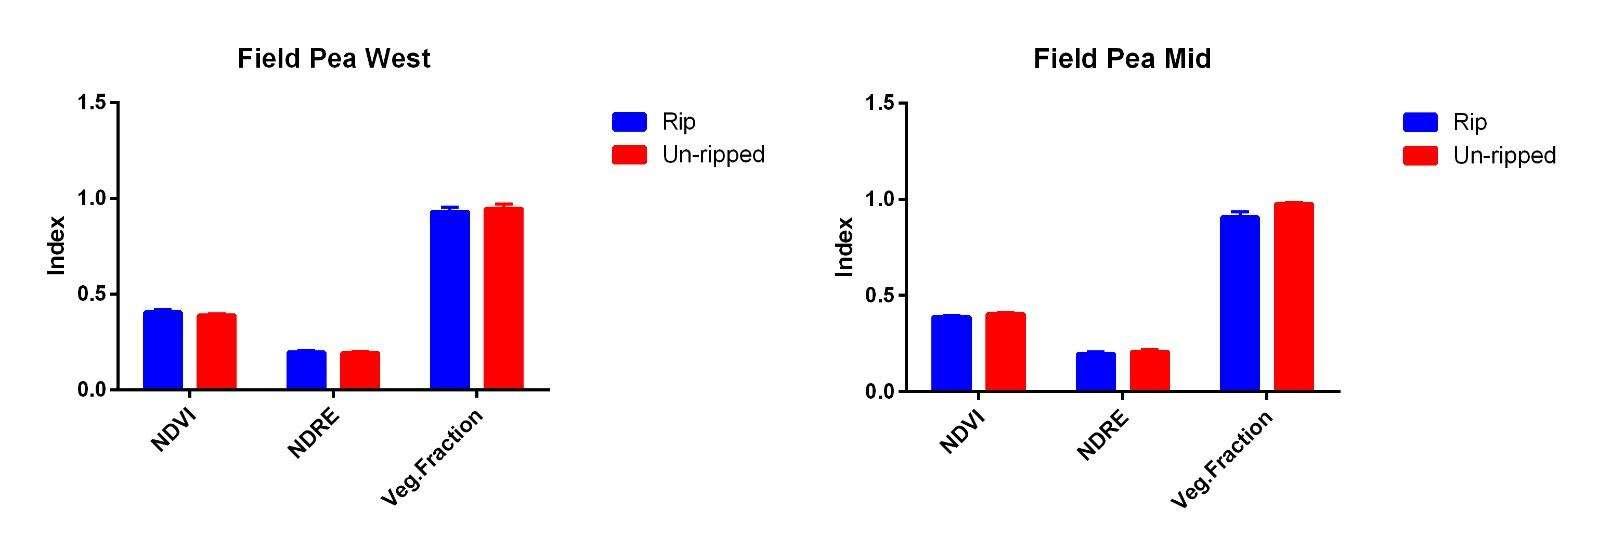
Both sites were scanned with an Unmanned Aerial Vehicle (UAV) mounted the multispectral camera to measure differences in Normalised Difference Vegetation Index (NDVI), Normalized Difference Red Edge Index (NDRE) and Vegetation Fraction (Veg. Fraction) (Figure 6 and 7). There was no clear difference between ripped and ripped treatments at each monitoring location within the faba bean or the field pea paddock. However, multispectral data showed that groundcover levels were very low on the sandiest soils in the faba bean paddock. At the West and West Mid monitoring sites in the faba bean paddock, the vegetation fraction was only 20-30 %, with the worst groundcover levels in the ripped area at the west middle monitoring site (Figure 8). Faba bean establishment was also suppressed by deep ripping at this monitoring location (Figure 5). In contrast, field peas provided very high vegetative ground cover levels of more than 90%, irrespective of ripping treatment (Figure 9).
Figure7.
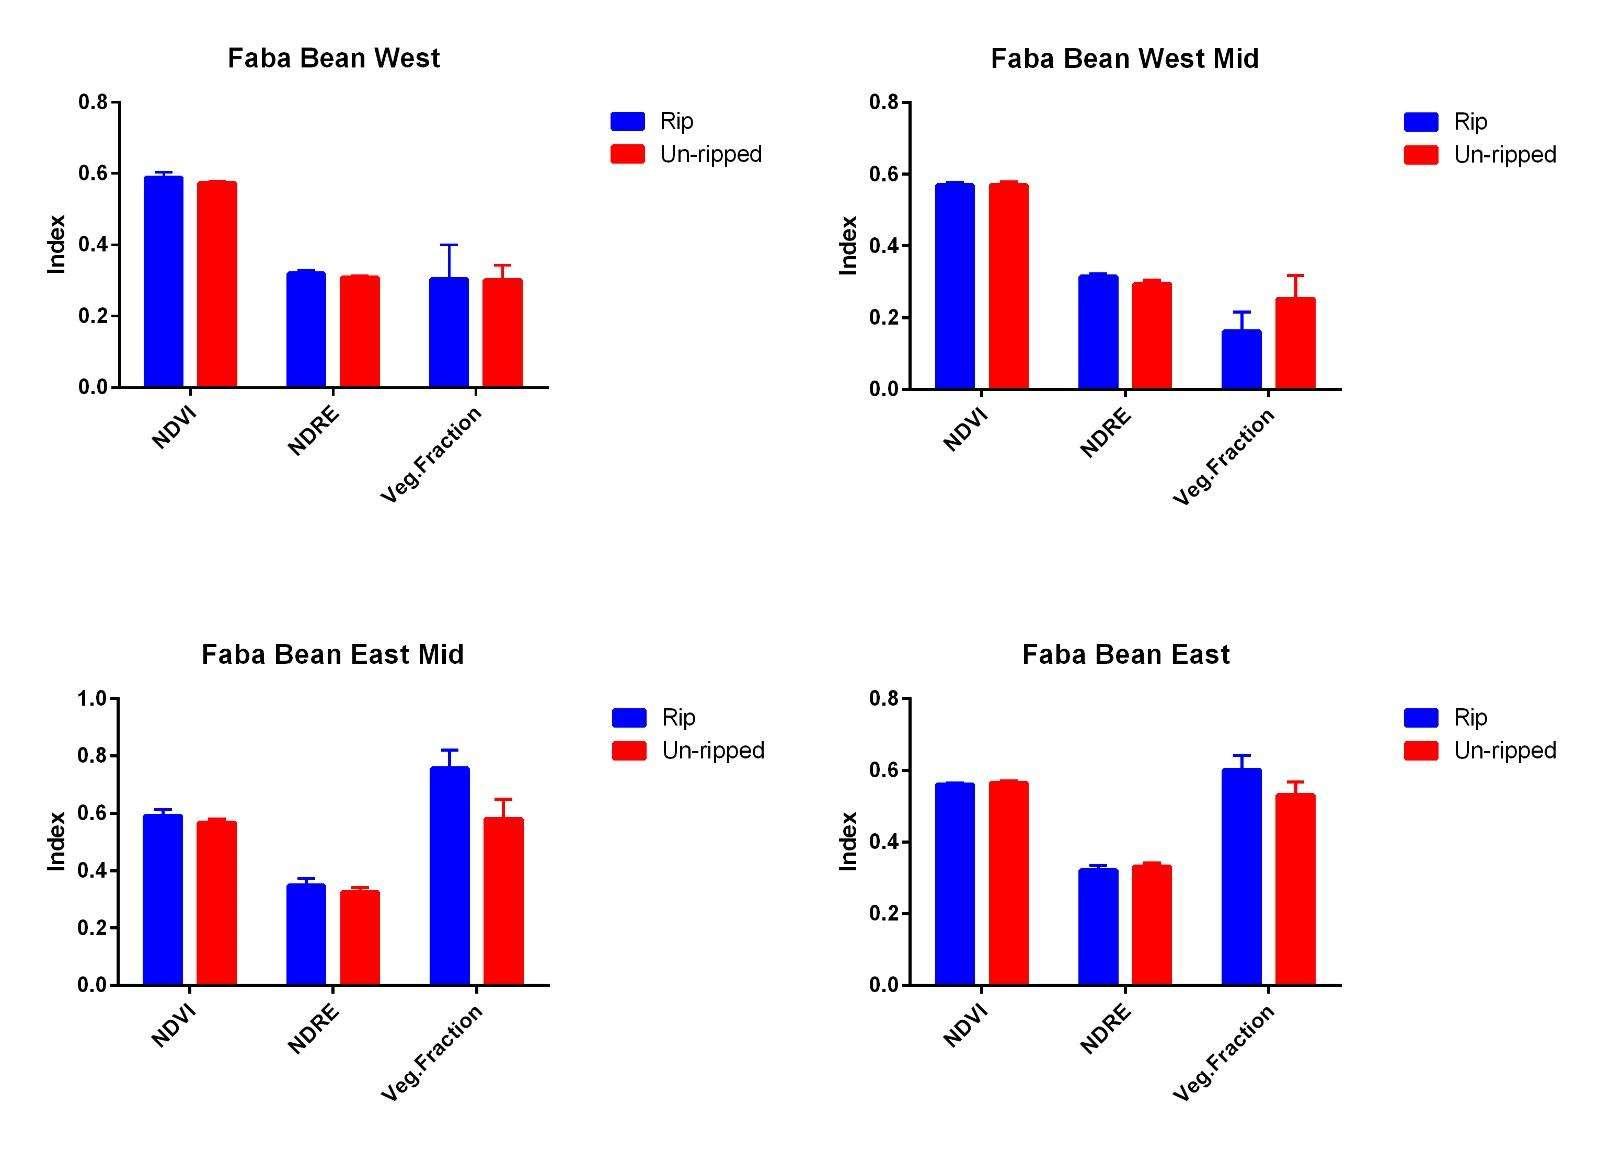
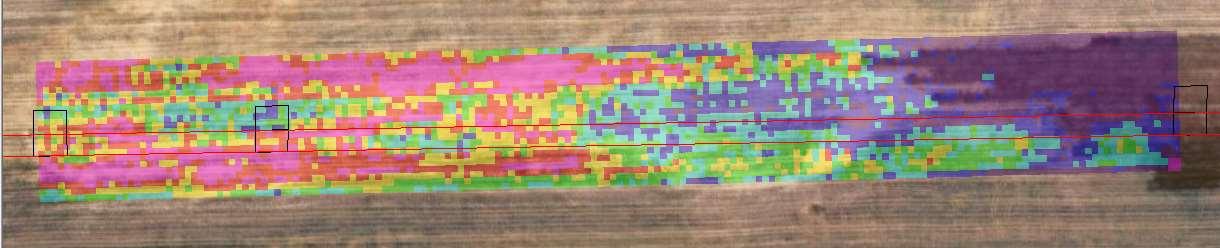
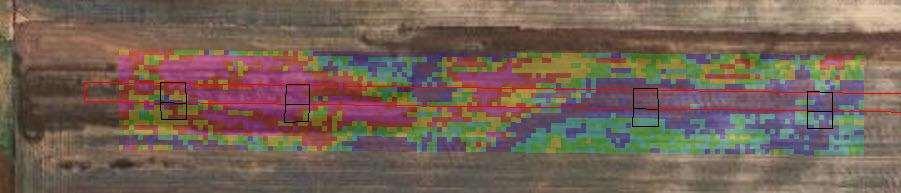
Figure8.
Figure9. NDVI,NDREandVegetationFractionforthedeeprippedandun-rippedmonitoringareaateachmonitoringlocation inthefieldpeapaddock.
Several attempts were made to source yield data from the farmers' harvester, however, no data was able to be obtained.
The commercial demonstration sites were not able to replicate the responses to deep ripping observed in smaller replicated trials in previous seasons. This may have been a function of the dry seasonal conditions coupled with a late autumn break which significantly delayed crop germination. Low rainfall and late emergence may have limited the potentialyield ofeachcrop,thereby limitingthe potentialfor deep rippingto providea benefitsuchhasbeenobserved in previous seasons. There were also agronomic factors that may have contributed, such as non-wetting soils leading to poor establishment and competition from ryegrass in each crop.
Thank you to Adam Broadbent and the rest of the team at McPiggery for their collaboration on this project.
This project was supported by the Murraylands and Riverland Landscape Board with funding from the Australian Government’s National Landcare Program.


1
Funded By: Western Local Land Services (WLLS)
Project Title: Local Land Services Partnership
Peer Review: Tanja Morgan (MSF)
Key Words: Soil N supply, crop N demand, N balance, legume, low rainfall
Key Messages
A late break and only 166 mm GSR at the site limited legume biomass production to less than 1 t/ha in 2021 which was 1/3 of the production in the previous year.
The break phase in 2020 affected wheat yields in 2021 with wheat grain yield ranging from 3.3 t/ha following fallow to 1.7 t/ha following medic pasture.
Wheat yields were not responsive to N fertiliser rates, which suggests grain yield differences following the break phase were due to differences in soil water rather than residual N.
To achieve a neutral N balance across the break-wheat rotation, the 30 kg N/ha was required following lentils and vetch hay, 50 kg N/ha following fallow and more than 70 kg N/ha.
Vetch brown manure and medic pasture treatments provided a surplus of N across the two-year rotation.
The cropping region in Southwestern NSW has evolved dramatically in the last one-two decades. Traditionally cropping practices were highly conservative with one-two seasons of mechanical fallow between cereal crop phases before these rotationsmoved towards continuous cropping withcereal crops during the 2000s. This led to major gains in water use efficiency and environmental benefits from improvements in groundcover, however, this system was not sustainable with the eventual development of agronomic issues such as brome grass and declining fertility.
Over the past decade, there has been further refinement in paddock rotations with the adoption of more diverse rotations. Legume crops such as lentils, chickpeas, field peas and vetch have become an important component of regional crop sequences and the added nitrogen (N) supply from these enterprises is providing significant vigour and yield benefits to subsequent cereal crops.
Despite the obvious benefits of improved N supply, most farmers are reluctant to apply additional N inputs from inorganic fertiliser inputs. Therefore, the question remains as to if further productivity gains can be achieved, particularly in better rainfall seasons, with improved N supply over and above what is supplied through the organic N sources from legumes. Furthermore, while pulse crops can fix considerable quantities of N, significant quantities of N are also removed through products such as hay and grain. Therefore, additional N fertiliser inputs may be required to prevent N from being mined from the soil organic N pool.
The trial site is located at Gol Gol in Southwestern NSW. The site has sandy and alkaline soil withkey properties shown in Table 1. The site is divided into three sub trials with each to be planted to a different phase of a three-year rotation in each season (Table 2). Within the wheat and barley phases, four different N rates are applied: 10, 30, 50, and 70 kg N/ha. The 2021 season was the second year of the trial.
Table 1. Key soil properties at the site
Treatment MineralN (kg/ha) Phosphorus (Colwell)
PBI Sulphur (KCL) pH(CaCl2) Salinity (EC1:5) Boron (Hot) Clay (%) Sand (%) Silt (%)
0-10 9 32 61 5.9 7.6 0.13 1.7 19.3 70.0 11.3 10-30 25 8.4 7.9 0.13 1.8 25.7 64.7 10.0 30-60 28 6.7 8.1 0.16 2.6 35.3 49.3 15.3 60-90 17 7.9 8.4 0.34 11.0 34.3 48.3 18.0 90-120 15 15.3 8.4 0.42 19.7 36.6 46.0 17.6
The site was sown dry on the 7th of May in 2021, with germination not occurring until early June. All crops received starter fertiliser: Break crops (Vetch, Lentil, Oats, Medic) received Granulock Z at 48.7 kg/ha while wheat and barley received DAP S Z at 62.5 kg/ha. Urea was applied as a top-dress application on the 12th of July to the wheat and barley treatments where an additional N above the starter fertiliser rate was required (e.g. 30, 50 and 70 kg N/ha). The oaten hay treatment in the break crop phase also received 30 kg N/ha. In-crop weeds, pests and diseases were managed with crop specific applications of pesticides throughout the season.
Results & Discussion
Break
With the autumn break not arriving until early June and with only 116 mm of growing season rainfall, biomass production from legume crops up to 1 t/ha. This was only about one third of the growth achieved in the first year of the trial. Consequently, N removal was also lower, with approximately 10 kg N/ha removed in lentil grain and 27 kg N/ha removed in hay crops (Table 3).
Table 3. Dry matter production and grain yield for treatment in the 2021 break crop phase. Phase DryMatter (kg/ha)
The preceding crop affected the yield, test weight, screenings, and protein levels of the wheat crop gown in 2021. The highest yield followed fallow, but that treatment had the lowest protein level. The medic pasture had the lowest yield of 1.72 t/ha and that had the highest protein % of 12.14. (Table 4). Nitrogen fertilizer had little effect on the crop with the only statistically significant effect being an increase in protein percentage from 10.68% to 11.46%. The response was not linear, with the largest effect coming from the increase from 10 to 30 kg/ha of N.
Table 4. 2021 wheat grain yield and quality following different break phases in 2020.
2020Crop GrainYield kg/ha TestWeight kg/hL Screening % Moisture % Protein % Fallow 3.32 79.89 0.92 10.71 10.33 LentilPulseCrop 2.51 79.79 1.03 10.68 10.92 MedicPasture 1.72 79.53 1.25 10.70 12.14 OatenHay 2.33 79.54 1.03 10.88 10.59 Vetch BrownManure 2.18 79.61 1.07 10.78 11.98 VetchHay 2.72 79.61 0.87 10.69 11.09 pvalue <.001 0.009 <.001 0.192 <.001 LSD 0.163 0.223 0.115 n.s 0.308
Table 5. Wheat grain yield and quality for each fertiliser rate treatment.
NRate(kgN/ha) GrainYield kg/ha TestWeight kg/hL Screening % Moisture % Protein % 10 2.46 79.58 1.09 10.76 10.68 30 2.48 79.67 0.97 10.72 11.27 50 2.48 79.67 1.00 10.73 11.29 70 2.43 79.73 1.04 10.74 11.46 pvalue 0.83 0.393 0.079 0.961 <.001 LSD n.s n.s n.s n.s 0.25
As this was the second year of the trial, barley was grown where wheat was grown in 2020 and did not have a background of break phase treatments. However, N fertiliser rates had been applied in the prior wheat crop. The addition of N fertiliser in 2021 had a non-linear effect on barley yield with the highest yield obtained using 30 kg N/ha (Table 6). Barley grain yield declined with the highest N rate (70 kg N/ha), possibly due to haying off caused by an oversupply of N. This is supported by the data for grain protein levels which showed grain protein increased linearly with an increased N rate.
Table 6. Barley grain yield and quality for each fertiliser rate treatment.
NRate(kgN/ha) GrainYield kg/ha TestWeight kg/hL Screening % Retention % Moisture % Protein %
10
1.50 69.25 0.70 98.14 10.39 12.69 30 1.64 69.38 0.53 98.37 10.35 13.75 50 1.59 69.44 0.61 98.08 10.36 14.52 70 1.47 69.56 0.60 97.98 10.37 15.66 pvalue 0.022 0.067 0.018 0.051 0.925 <0.001 LSD 0.12 n.s 0.11 n.s n.s
Previous crop rotation had a significant impact on grain yield of the 2021 wheat crop, however, there was no response to N fertiliser rates. This implies that the differences in grain yield were due to differences in soil water and or some other impact such as root disease. As the chemical fallow treatment had the highest and the medic pasture treatment had the lowest grain yield, it appears that soil water was an important driver of wheat yield at the site in 2021.
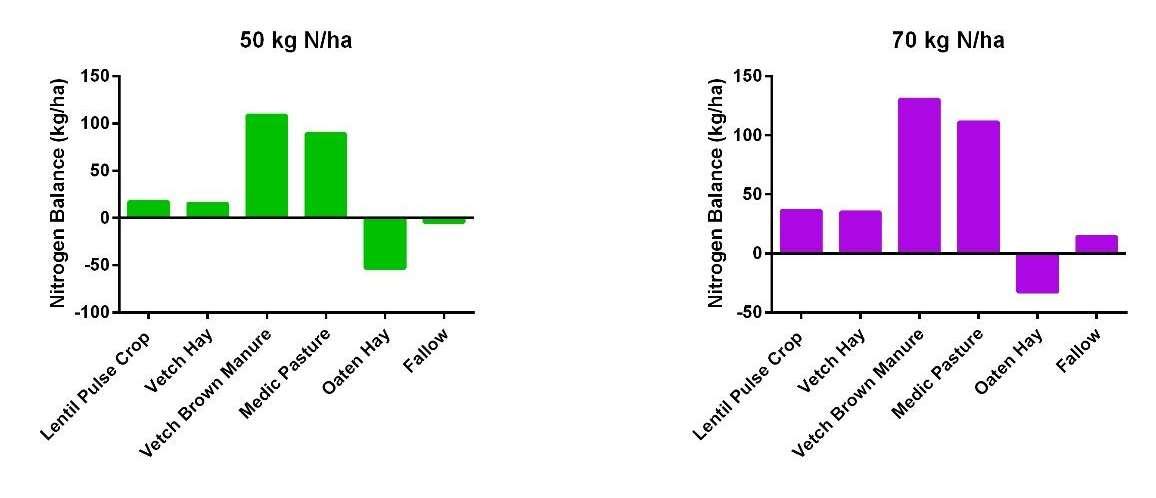
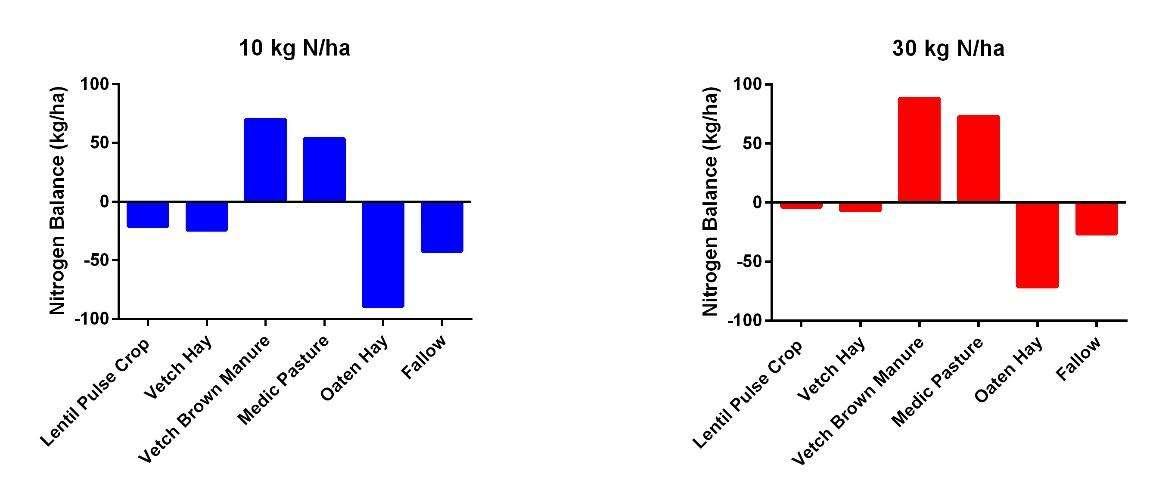
A N audit was also conducted across the two-year break-wheat phase (Figure 1). In order to achieve a neutral N balance, the 30 kg N/ha fertiliser rate was required following lentils and vetch hay, 50 kg N/ha was required following fallow and more than 70 kg N/ha was required following oaten hay. Nitrogen fertiliser rates less than this means that nitrogen is being exported by the crop from the organic pool. In contrast, the vetch brown manure and medic pasture treatments were providing a surplus of N irrespective of N fertiliser rate and therefore had a positive impact on the soil N bank.
Figure 1. The nitrogen balance of the break (2020) – wheat (2021) phase for each N fertiliser rate applied to wheat in 2021.
This projecthas beensupportedbyWesternLocalLandServices withfundingfromthe Australian Government’s Future Drought Fund.

Thank you to the Linklater Family, Ian, Daniel and James, for providing land for this long-term trial.
 Authors: Chris McDonough1
Funded
By:National Landcare Program, Grains Research Development Corporation, Murraylands and Riverland Landscape Board, Project Title: "A holistic approach to seep management for preventing land degradation in the landscape"

This project has found practical management solutions for all Mallee Seep scenarios to help halt their spread and bring areas back into production.
Targeted lucerne strips have been highly effective in reducing and drying out perched water tables within 12 months.
Puccinellia has provided excellent living cover for many scalded areas and helped restore saline scald back to healthy soil over time.
The keys to Mallee seep management lies in understanding the source of the issue, the stage of its development and the salinity level of the perched water table.
The new online Mallee Seeps Decision Tree allows farmers to find practical solutions to their own Mallee Seep situations by following simple guidelines using their own site information.
Mallee Seeps have become a growing farmland degradation issue across the Mallee in recent years. This has been due to the move toward more intensive farming systems where summer weed control strategies have led to reduced water use in sandy rises, resulting in the formation of localised perched water tables causing waterlogging, scalding and salt accumulation in surface layers. This has been exacerbated by periods of high out of season rainfall contributing recharge water into these catchments, as well as dry, hot periods of high evaporation and capillary rise binging more salt to surface scalds.
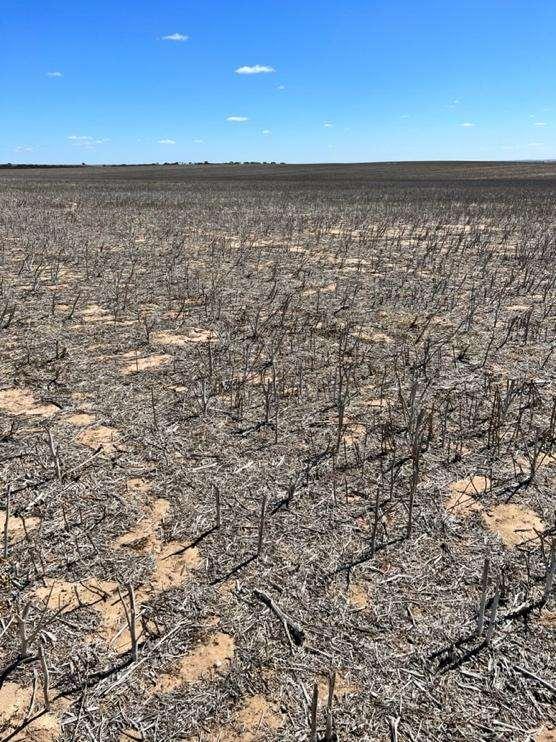
Picture: Dry saline land in the Mallee
However, the MSF Mallee Seeps Project has shown many positive results in turning these problems around through undertaking extensive on-farm demonstrations and trials, as well as assessing the longer term impacts of former Murraylands and Riverland Landscape Board trials. These experiences, along with those of participating farmers, have now been captured in the new online Mallee Seeps Decision Tree that has recently been developed.
This interactive program shows: how to identify mallee seeps from other saline land degradation, how mallee seeps form in our modern mallee farming system,
the key factors farmers need to assess, and
clear practical strategies that farmers should take that best suit their particular situation.
There are multiple links within the decision tree to brief videos from various sites that show the practical on-farm applications, management techniques and successful results of rehabilitation in recent years.
This project worked closely with farmers at least 16 farmers across all areas of the South Australian and Victorian Mallee with Mallee seeps at various stages of development and severity, within different farming systems and rainfall zones, to assess their situations and trial various ways to stop their spread and bring the land back to production. This included the strategic use of various high water use options, as well as the use of salt tolerant pastures and soil amelioration techniques using farmer scale applications to remediate these sites. There were also 2 smaller plot trial sites set up to directly measure and compare the effective water use of various strategies, as well as investigations into several remote sensing technologies, such as NDVI and deep soil imaging, to assess their practical application for Mallee Seep management.
Trials and demonstrations were set up in a variety ofways withsoil moisture monitoring equipment, piezometers, rain gauges, neutron probes, data loggers and photo points to best assess the impacts of all the treatments undertaken. Videos were made at all sites highlighting the management undertaken taken, successes of various strategies, with interviews of both farmers and project specialists included.
On-farm trial and demonstration work from both the MSF Mallee Seep Projects has led to the following conclusions.
The 2 main aims of any Mallee Seep management are to:
a. Establish living cover over scalded bare areas, as this helps to restrict evaporation and capillary rise from bringing salts to concentrate at the surface, bring saline land back to health, and b. Intercept and utilise excess water flows. If the flows of water into the discharge zone is not stopped, then any site rehabilitation will be very limited or only temporary, and therefore unlikely to prevent the spread of the Mallee Seep further into the paddock.
The 5 steps to successfully rehabilitating Mallee Seeps are as follows:
1. Make sure you are dealing with a Mallee Seep and not other saline land issues such as regional groundwater salinity, creek line salinity or dry saline land (magnesia patches), as each form has different causes and requires different management strategies.
2. Establish where the water is most likely coming from by standing at the scald or discharge zone and assessing the landscape for potential water interception zones. This can be aided by viewing satellite images (including NDVI) and digging holes to find water tables.
3. Consider what stage of development the Mallee Seep is at. Early/mild stage seeps can be addressed before they become a serious degradation issue, while intermediate/moderate and established/severe phases will require more strategic management to rehabilitate.
4. Measure the water quality. Perched water tables at the affected discharge zone usually sit within the top 2m of the surface (occasionally deeper) and can vary between fresh low levels of <8 dS/m (<5000 ppm) to a highly saline >35 dS/m (>21000ppm). Higher salinity reduces productive management options and will increase effective rehabilitation times.
5. Work out what to do. Once a farmer/advisor has made the above assessments they are encouraged to visit the online Mallee Seeps Decision Tree Mallee Seeps Decision Tree - Mallee Sustainable Farming (msfp.org.au) to work through various solutions that will best suit their particular circumstances. This includes many short videos and explanations of successful management strategies, including numerous items from this EP Mallee Seeps Project demonstration sites.
Mallee Seeps will continue to develop and grow, particularly after periods of high unseasonal rainfall. Early recognition and action is vital to prevent early saturated areas or small bare patches from becoming large bare scalds that are both unproductive and a hazard to farm machinery. Farmers should investigate any areas at the base of sandy rises that are initially showing unusually high levels of crop growth or staying green for longer going into harvest. It is not uncommon to dig and find a perched water table within 1.5m.
The keys to successfully managing Mallee Seeps lie in understanding both the salinity level of the perched water tables (which can range from very fresh, to saltier than seawater) as well as the stage of seep development. While early identification and strategic action is vital in reducing impacts, even well-established seep scalds have been brought back into production.

Where water tables are found to be less saline, targeted strips of lucerne close to the discharge areas can quickly reduce and even dry them out. In highly saline sites, salt tolerant trees may be the best option for lowering water tables, or the lucerne may need to be targeted higher up the slope to intercept fresher recharge water.
Once stemming the flow of water into a recently developing area has been set up, then it may be possible to bring sand and straw over smaller saline patches and then continue to crop over them. However, in situations where moderate to severe saline scaling has already formed, then establishing and maintaining living cover over affected areas with salt tolerant grasses such as Puccinellia becomes a priority. Where this has occurred, tests have shown a reversal of surface soil salinisation after about 12 months of good establishment.

Sites where both the flow of water into seep areas has been contained, and living soil cover re-established over affected areas, have always shown a reduction in land degradation and restoration of soil back to productivity. At some sites, this has even led to a return to crop production.
While achieving these outcomes can be difficult depending on circumstances, this new Online guide shows practical solutions and examples where seep impacts have been halted, reversed, covered, and revitalised. Farmers and advisors are encouraged to visit this program at https://msfp.org.au/mallee-seeps-decision-tree/ or through the MSF Website.
This project is supported by Mallee Sustainable Farming with funding from the Australian Government’s National Landcare Program, the GRDC and the Murraylands and Riverland Landscape Board.


Project Partners include Mallee Sustainable Farming, Frontier Farming Systems, Insight Extension for Agriculture, Agrivision Consultants, CSIRO, Coorong Tatiara LAP, University of Adelaide.

Authors: Gupta Vadakattu1, Jamie Wilson2
1CSIRO Agriculture & Food Waite Campus, 2Mallee Sustainable Farming
Funded By: Future Drought Fund Drought Resilience Program Project Title: Regenerative Agriculture in the low rainfall zone
Regenerative Agriculture is an approach to farming that uses soil conservation techniques to improve the overall ecosystem.
Regen Ag techniques focus on improving the state of the natural capital that is soil, water and biodiversity.
Low rainfall farmers who practice no-till, focus on building biomass, have diverse cropping rotations and maintain soil cover are already following the principles of regenerative agriculture.
Regenerative Agriculture (Regen Ag) over the last few years has gained increased attention in a wide range of primary productionsectors including viticulture, livestock and broadacre farming. Regen Ag means different things to different people but is essentially the improvement of soil health through management.
This is achieved by maintaining ground cover, practising no-till or zero-till and increasing biomass inputs and rotational diversity. Soil health, soil ecology and improvements in soil structure are key drivers for regen ag. Since the 1990’s farmers in the low rainfall zone (LRZ) of the Mallee have been increasingly moving from minimum to no-till/zero-till farming systems.
This through its very nature has led to vast improvements in soil structure in the LRZ as a result of minimal disturbance and maintaining stubble retention for soil cover. This adds to the overall benefits to soil health through inputs of biomass driving microbial activity and as a flow on the soil structure and overall ecological improvements.
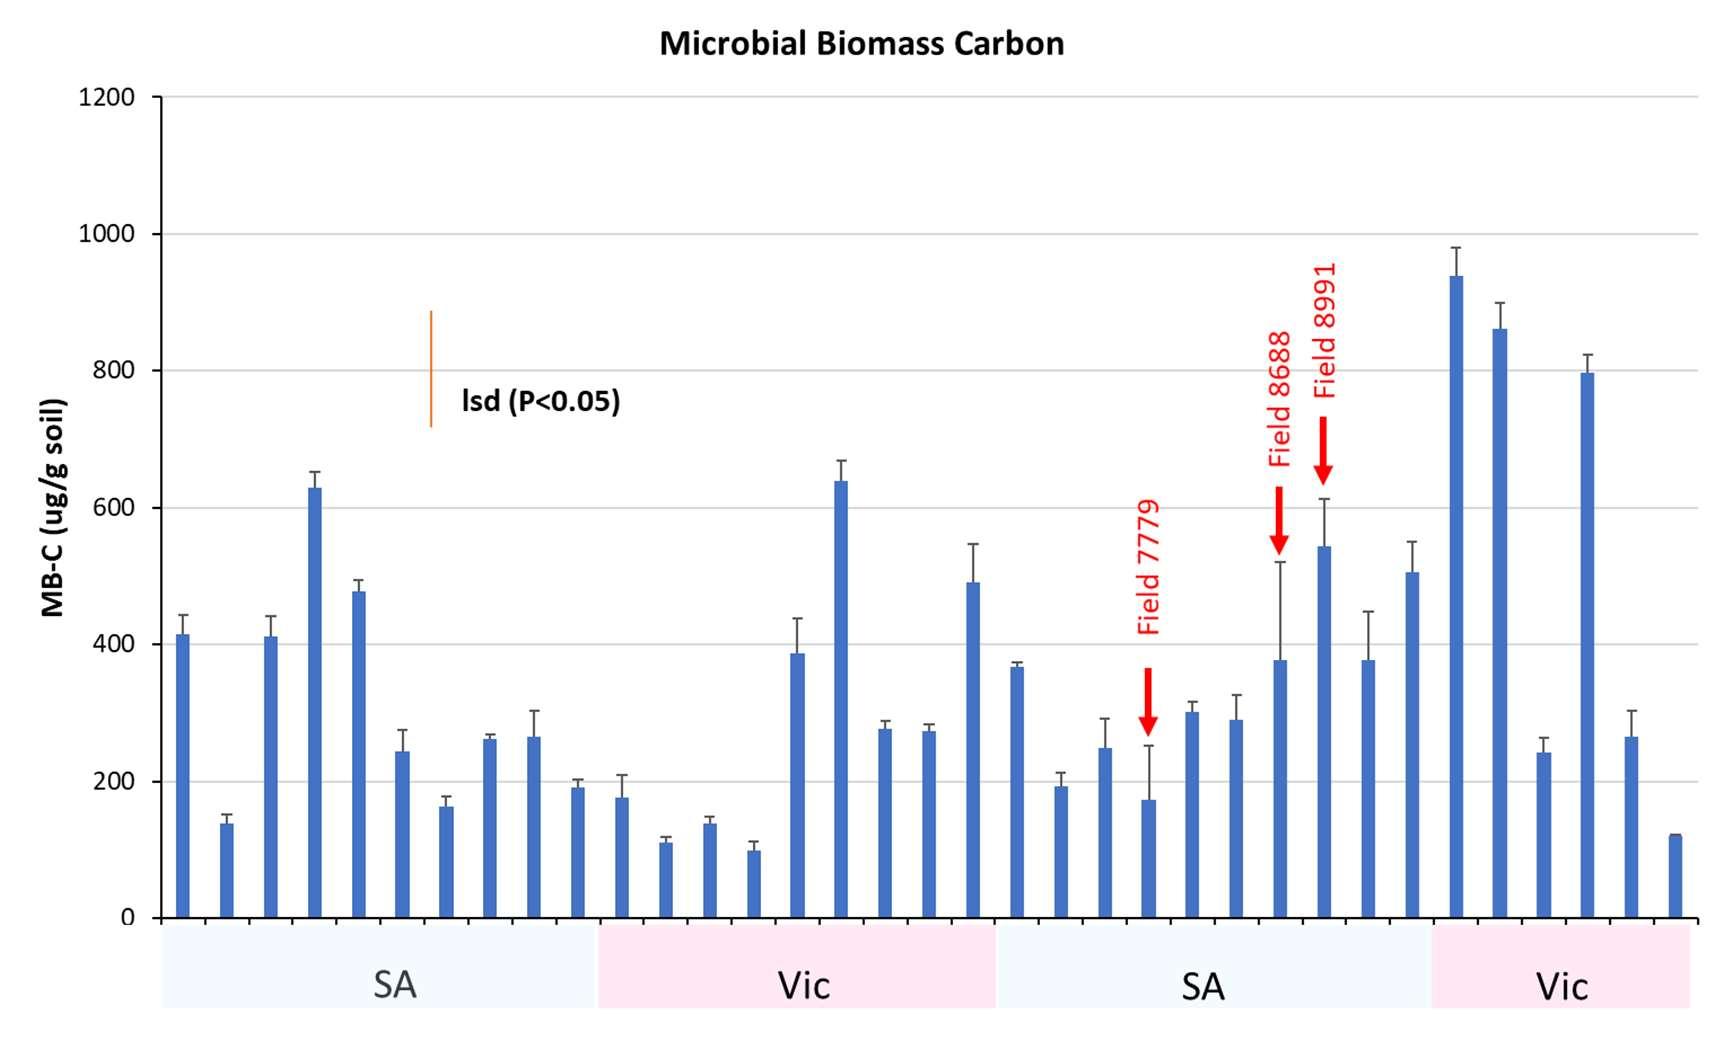
The objectives of the project were to look at a range of paddocks across the LRZ and their rotations, seeding systems, inputs and all aspects of the paddock's history and conduct tests on the microbial biomass carbon and the nitrogen mineralisation potential of the soil. The results have been used as an indication of soil health and resilience. The data below shows the results of spring 2021 soil tests across the LRZ, analysed by Dr Gupta Vadakattu and the team at CSIRO.
These tests across a range of paddocks (34) across SA and Victoria LRZ show the diversity of paddocks and farming systems and the huge range of variability in soil health drivers.
Oneof thekey driversbehindthe wholeecologicaldrivensystemisSoilOrganicCarbon (SOC)andthiscanbemeasured through a variety of factors. The graphs below show microbial biomass (soil health) and nitrogen mineralisation potential indicating the organic matter and therefore overall soil nutrition.
An interesting factor is that field 8991 in Graph 1 & Graph 2 is a high input farmer that is driving the system through a very diverse rotation zero till farming system, minimal to no grazing and as much stubble retention as possible on the soil surface.
In conjunction with this project, BCG is undertaking a literature review that is gathering as much information that has been published to identify key factors that would be beneficial for the LRZ.
Graph 1 – Microbial biomass carbon – CSIRO 2022 Vadakattu
Graph 2 – Nitrogen mineralisation potential – CSIRO 2022 Vadakattu
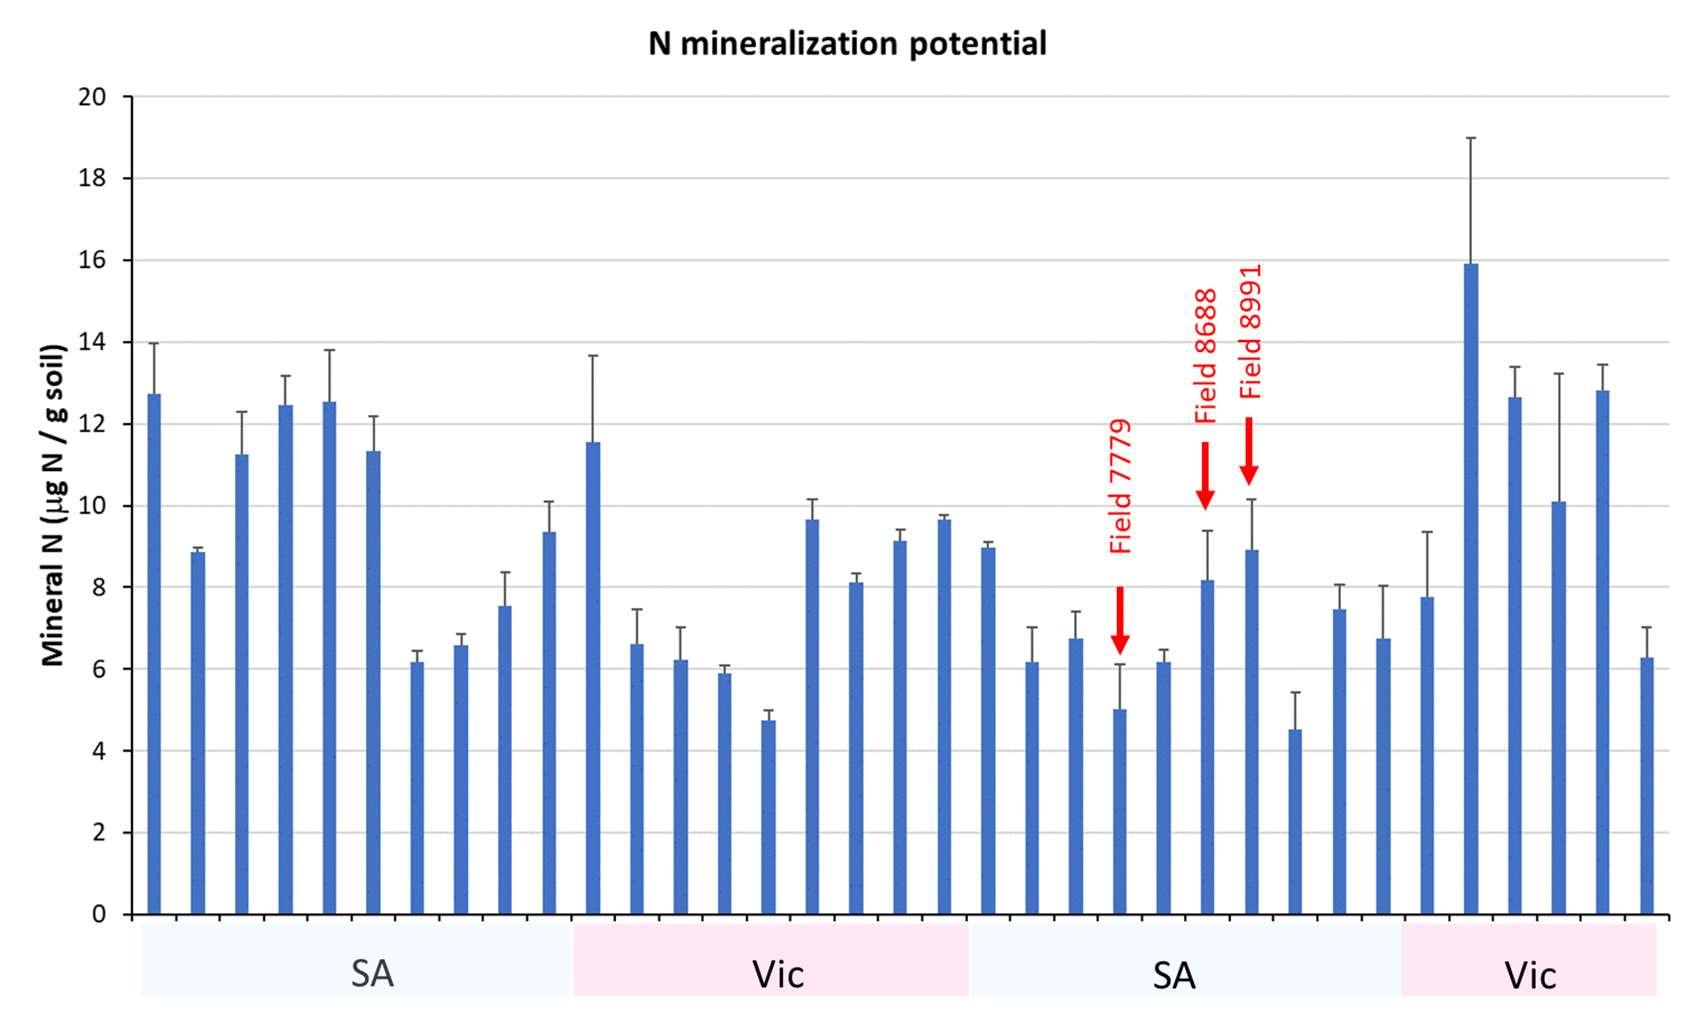
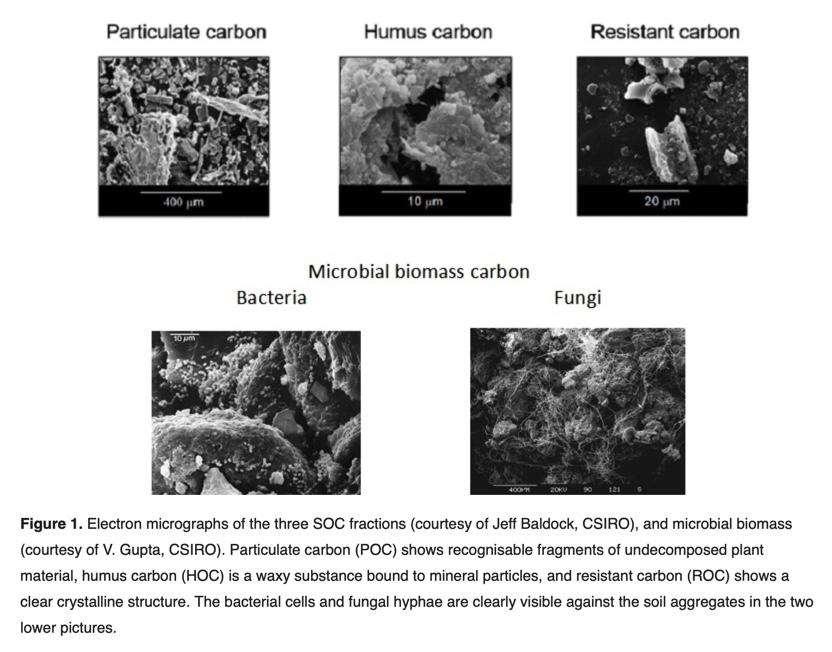
Rainfall or lack thereof is proving to be one of the biggest driving factors for Soil Organic Carbon improvement due to reduced plant growth and therefore cover and hence organic material entering the system. The greater the amount of plant material via biomass production and retention faster the increase in the cycling of organic material into the system the benefit through nutrient and microbial cycling is increased. More SOC equals better soil structure and microbial feed house. Figure 1 below shows the complexity of the system.
The diversity and soil cover that has been achieved by field 8991 can be referenced with the autumn photo below (Photo 1) showing the stubble cover and diversity of previous crop rotations (barley, canola, wheat, barley, lupins and canola). This diversity and range of crop architecture is why this field is an outlier from the MSF sampled paddocks. To keep the SOC cycling efficiently the addition year on year of Stubble minimum 2.5t/Ha.
The project has highlighted that soil testing should be an important part of input planning to match crop requirements with soil available nutrients and do not lead to mining of the profile.
Ripping and soil amelioration can lead to improved biomass and therefore should be considered to reduce growth restraints of crops and improve crop health and therefore plant growth, improving these areas that were previously poor performing.
CSIRO research has shown that 60KG/Ha of nitrogen in LRZ maintains N and hence yield, this includes soil N and added N so total annual nitrogen requirements. Nitrogen use in the LRZ is often variable however nitrogen research ( by J Hunt – Latrobe University) has shown that keeping the N Bank slightly N positive provided the best overall long term grossmargin and resultedin net gains of > 13%yieldincrease overall 0.9t/ha ofyieldincrease and a 0.7% SOC increase.

The project has sampled paddocks across a range of environments in the LRZ. These soil samples were taken in spring (September 2021) and autumn (April 2022) to assess each paddock. Paddock backgrounds were also gathered including rotations, inputs crop types and yields. The majority of the paddocks tested by MSF were sandy through to sandy loam.
Paddocks were tested at Younghusband, Bowhill, Lameroo,Paruna, Taplan, Meribah, Borrika, Wynarka, Geranium and Peake. The previous list shows the diversity of the tests across the mallee region of SA. Growing season rainfall for these paddocks in 2021 ranged from 90mm to 210 mm, again showing the diversity of the LRZ Mallee area.

Biomass in the system is a key driver to soil organic carbon and overall soil healthwhich can be challenging to maintain in the low rainfall zone, particularly in very low rainfall or drought years. Management techniques that will support regenerative practice in the low rainfall zone include:


Minimise soil disturbance
Have diversity in the crop rotation – cereals, legumes, oilseeds etc
Keep the N Bank positive to maintain soil fertility and maximise growth
Maintain soil cover through cover crops or crop stubble cover (minimum 50%)
Consider a mixed species winter crop where it has an economic fit
Soil improvements through ripping and amelioration
Authors: Rick Llewellyn
Research Team: Jackie Ouzman, Caroline Lee, Damian Mowat, Jim Lea, Dana Campbell, Willie Shoobrdge
CSIRO Agriculture & Food, Waite Campus
Funded By: GRDC with additional support from Australian Wool Innovation, and CSIRO in collaboration with Agersens
Project Title: The invisible fence line. How Virtual Fencing is reshaping weed control

Virtual fencing technology was successful in applying strip grazing to a vetch paddock over 18 days.
Weed damage due to grazing was significantly higher where strip grazing using virtual fencing was applied, with ryegrass seed head density reduced by over 50% compared to an open grazed paddock.
There was no significant difference in the cattle weight gains achieved by the virtually fenced and control group.
Virtual fencing technology is nearing commercial release in Australia. The technology uses automated GPS-enabled, solar-powered neckband devices to train cattle to stay within a virtually fenced boundary using audio cues. There is potential for virtual fencing to benefit mixed farming systems with the ability to manage grazing pressure better, weed populations and ground cover across increasingly large cropping paddocks. While an early-stage prototype for experimental use with sheep is developing, trials with the Agersens e-shepherd technology are being conducted to test potential applications on mixed farms using cattle.
The Long Plains trial follows on from a successful month-long trial conducted at Eden Valley in 2019 that demonstrated the ability of virtual fencing to exclude cattle from sensitive paddock areas using a virtual fence line contoured to the exclusion zone. In this GRDC-supported project, the potential for virtual fencing to be applied to improve weed control in mixed cropping systems is being explored. The aim of the trial was to test the ability of virtual fencing to achieve higher levels of grazing pressure on weeds in the spring leading into a subsequent crop.
The trial was conducted on a 70 ha vetch paddock where hay had been cut and removed. Additional fencing was constructed to produce the trial design shown in Figure 1. Due to spring rain, there was substantial vetch and weed regrowth. Weeds present at notable densities were annual ryegrass and sowthistle, with some prickly lettuce. Weeds were typically at or near flowering.
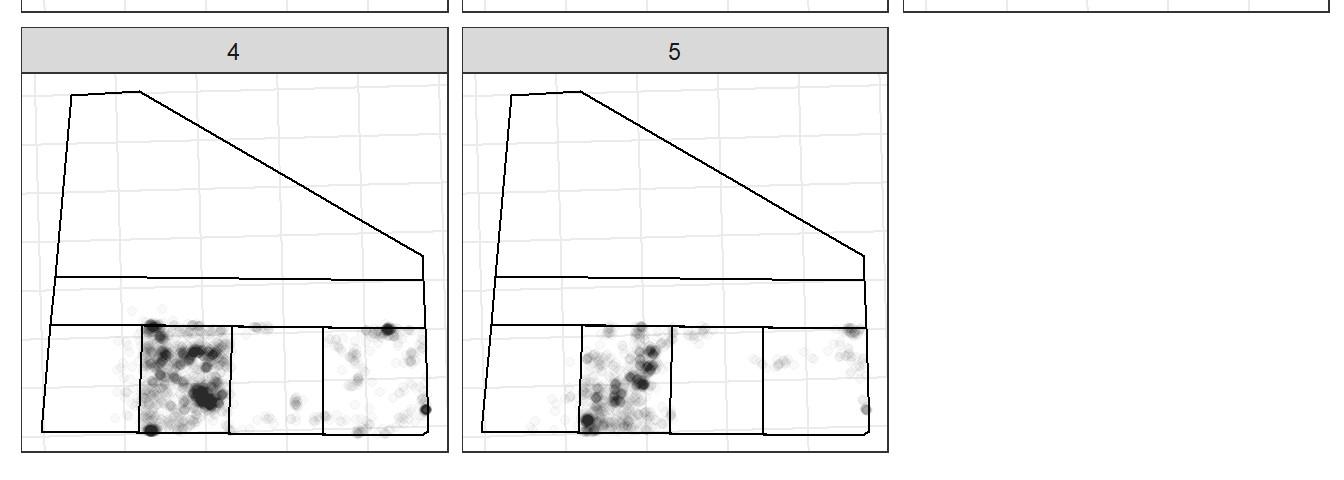
Forty cattle (mainly Hereford; average initial weight 306kg) were used in the trial, each wearing the latest version of the Agersens e-shepherd device. The cattle entered the trial paddock on October 21 and were removed on November 9. Twenty animals were run in an equal area ‘control’ paddock where the devices were used for spatial monitoring, but virtual fences were not applied. The other 20 animals were placed in the virtually fenced treatment paddock, with only approximately a quarter of the total area initially available for grazing due to the 1st virtual fence being in place (Figure 1). Each virtual fence was in place for 5-6 days, with the final grazing period involving removal of the virtual fence to allow grazing of the remaining area. As animals only had access to one water point (as shown in Figure 1), grazed sub-paddocks remained open to animal traffic and return grazing.
Cattle were weighed on entry and exit. NDVI-based measures were taken pre and post grazing using CropCircle. Weed counts and quadrat cuts were taken pre and post grazing, including before a new virtually fenced sub-paddock was opened up to grazing. Weed plant numbers, seed head numbers, and weed and vetch biomass were measured across all areas of the paddock. Weed densities will be measured in the wheat crop to be sown in 2021.
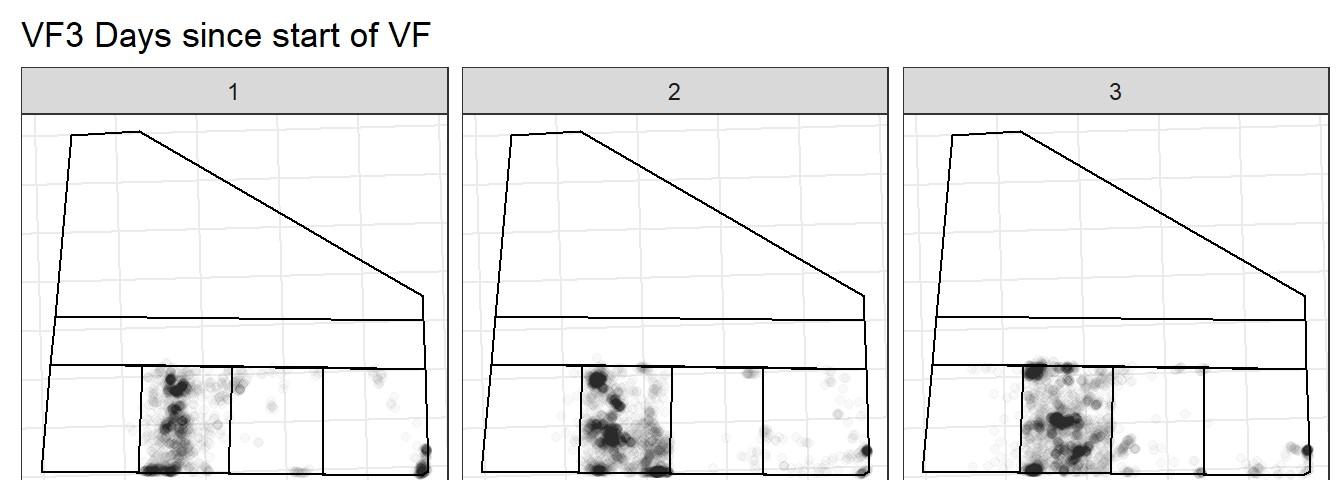
The virtual fencing was highly effective in containing cattle in the virtually fenced sub-paddocks. Residency maps show not only the efficacy of the virtual fence but the rate at which animals enter the newly opened grazing areas following a virtual fence shift (see example animal residency shift in days following 2nd shift of virtual fenceline shown in Figure 2). Animals were quick to learn to respond to the audio signal, with the proportion of audio signals relative to all signals (audio plus electronic) already above 75% over the first day and above 80% after day 3.
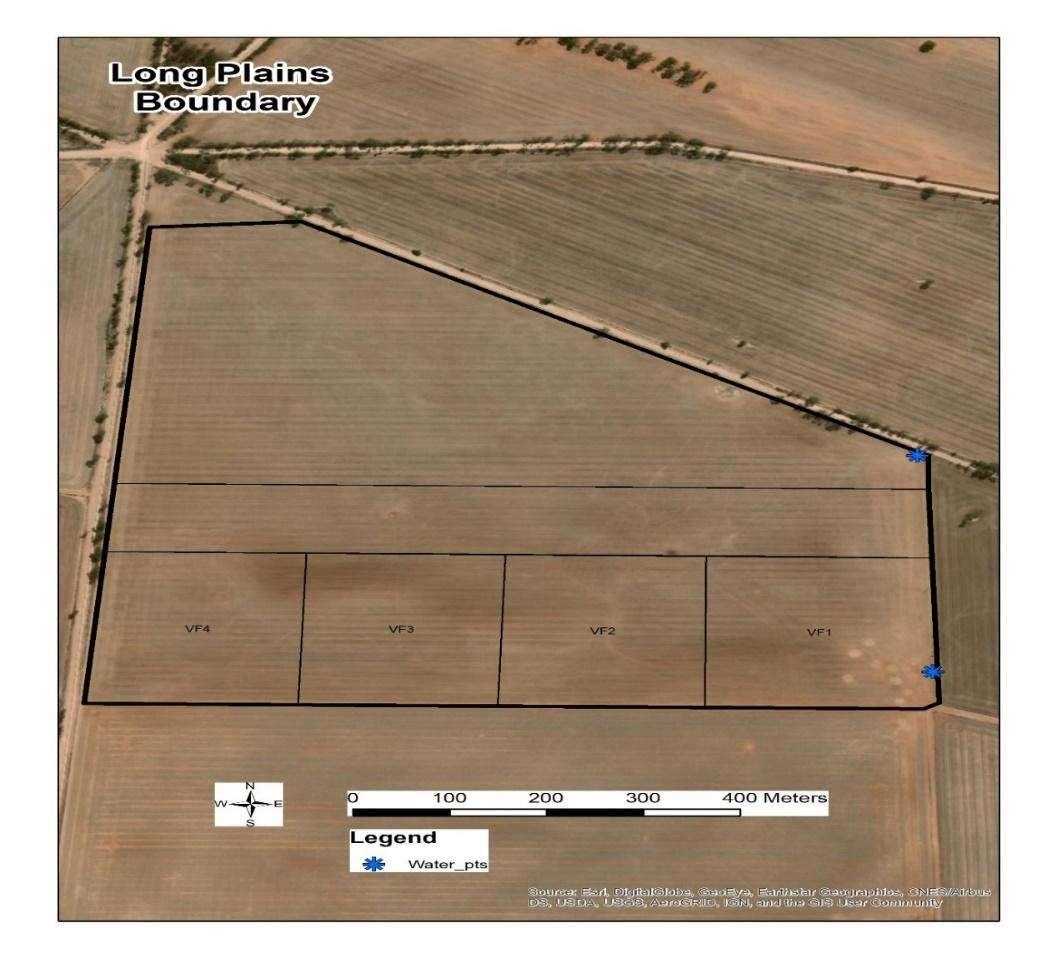
Figure 2. Animal residency over days 1-5 following shift of virtual fence from 2nd position (VF2) to a third position (VF3) on day 1. Darker shading represents the more frequent residency of animals.
There was no difference in weight gain between the virtually fenced animals and the control animals (P=0.4), with an average weight gain of approximately 1.4kg/day.
A range of NDVI-based data output from CropCircle technology from pre- and post-trial paddock measures was spatially analysed. Post-trial results show the large differences in resulting green groundcover between the virtually fenced areas, including the area only opened for grazing in the final days of the trial (VF4), the open grazed area, and the ungrazed buffer area (Figure 3).
There were no significant pre-trial differences in average weed density found between the different paddock areas (P>0.4), but the virtual fence strip-grazing treatment resulted in over 50% fewer ryegrass plants (P=0.01) and ryegrass heads (P=0.03) post-trial. Ryegrass plant density was 2/m2 in the virtually fenced area and 6/m2 in the openly grazed area. Ryegrass seed head density was 10/m2 in the virtually fenced area, and 23/m2 in the control open grazed area.
Post grazing sowthistle density was insufficient to detect differences between treatments. Further weed impact analysis is being conducted using biomass and weed density measures in the 2021 wheat crop.
The e-Shepherd technology can effectively contain young cattle in sub-paddock zones and enable fence line shifts for strip grazing (or targeted grazing pressure). The ability to utilise sub-paddock virtual fencing within a cropping paddock can effectively increase grazing pressure on weeds while managing groundcover, in this case leading to significantly reduced ryegrass at seed set without reducing cattle weight gains compared to an open grazed control paddock.
The effectiveness of virtual fencing for managing zonal grazing in a dual-purpose crop to optimise ground cover, weed control and crop yield potential will be assessed with cattle in 2021. Following the 2021 cattle trials, field testing will begin using a prototype research device adapted for use with sheep.


The project is funded by GRDC with additional support from Australian Wool Innovation and CSIRO in collaboration with Agersens. The collaboration and generous assistance of Peter Cook (Caringa) is gratefully acknowledged, as is the role of SANTFA in assisting with trial site identification.