BETTER FROST DECISIONS
Knowledge to inform grower and adviser decisions for pre-season planning, in-season management and post-frost event responses

IN THIS ISSUE
Discover the latest updates on rainfall and weather conditions, including the ever-present question of El Nino
BFD September podcast
Using elevation to refine wheat planting dates

BFD Facebook group
CROPS, people, MONEY & you…and frost
Sneak peak: Pre-season planning tool – crop flowering calculator
Discover the latest updates on rainfall and weather conditions, including the ever-present question of El Nino
PeterHayman,SARDI
TheBureauofMeteorology,theexpertsinthefield,have releasedtheirupdatedanalysis,givingusa70%chanceof headingintoElNino.WhilewemaynotofficiallybeinElNino yet,theoutlookremainsdryformostofSouthernAustralia, particularlyinthegrain-growingareas.
Butthere'smoretothestory.TheBureau'sclimatedriverssite suggeststhatwemightseesomeinterestingdevelopmentsin thecomingweeks Andwhenitcomestofrostpredictions, they'renotjustrelyingonhistoricaldata-they'reusing forecaststodeterminewhichareasareatrisk
WELCOME
As the spring season is now upon us it can be an anxious time for many, as the fruits of our labour sit exposed to the elements as we approach the seasonal finish line.
We can see that harvest is on the horizon but we are not quite there yet So what could possibly go wrong?
Heat stress, moisture stress, and the ’f’ word....frost!
At this time of year it’s all out being prepared. Hope for the best but be prepared. Take a read through this issue as we join you in preparing for the season ahead.
ISSUE 8 | SEPTEMBER 2023
Continued
As temperatures gradually rise, crops are maturing faster than usual after a relatively mild winter. However, this brings its own set of challenges Our agronomic practices, including early planting and the use of quick-maturing crop varieties, may actually increase the risk of frost damage. It's not uncommon to experience frosts in the first week of September, or as late as October and even November which demonstrates the unpredictability of frost events.
For farmers, this is a crucial time of year. They've taken risks and made investments in their crops, hoping for a rewarding spring season. Frost can jeopardize their efforts, affecting not only crop yields but also nitrogen levels. While many farmers are cutting back on nitrogen due to frost concerns, it's important to consider the potential carryover of nitrogen to the next year. Our understanding of this phenomenon is still evolving, but it has implications for cash flow and fertiliser input strategies
To address these risks and others, the Grains Research Development Corporation investment, RiskWi$e, will see farmers supported in the regions to better inform their decision making on risky topics such as frost .

This initiatives aim to engage with local farmers, tap into their knowledge and experiences, and develop strategies to better quantify and hopefully manage risk on the farm.
Risk is not just a concept on paper; it affects real lives and livelihoods. The next four years will see a concerted national effort led by CSIRO to work together to make farming practices more resilient and successful. Stay tuned for more insightful discussions and solutions, as this topic will continue to dominate conversations in the near future.
NEW PODCAST OUT NOW!!
USING ELEVATION TO REFINE WHEAT PLANTING DATES
Matt Gardner (AMPS Agribusiness)
Key messages:
Lower frost risk areas at the top of the slope can be planted earlier to optimise potential yield benefits without necessarily increasing frost risk
Lower parts of the landscape have narrower optimum flowering windows – they frost longer and later, but heat stress risk stays the same. Given the difference in frost risk, there is an opportunity to match varieties to frost risk zones
Crop maturity is delayed at the bottom of the slope. Interestingly, this can help negate some of the frost risk at the bottom of the slope
Growers and advisers usually rely on their farmexperience, crop models and local weather station data to choose planting dates. On flatter country the local weather station data might be relevant on farm, but where topography is more varied, local data is needed.
From 2014-2016, Matt Gardner and the team at AMPS Agribusiness ran a GRDC-funded trial asking if it was possible to use elevation to refine planting dates (optimal flowering windows) at a paddock and farm level. The trials were so successful they continued until 2021.
Elevation and yield maps from 2013 partly prompted the trial (Figure 1), where the lowest parts of the paddock yielded only 0.5 t/ha, and the highest 10 times than, at 5 1 t/ha


Although using elevation alone isn’t ideal to assess frost risk, tying elevation to on-farm temperature data can help gauge frost risk.
The trials
At Liverpool Plains (Premer) and Moree (Gurley), trials were sown at the top and bottom of the slopes in both paddocks. There was a 20 – 53m elevation difference between the top and bottom of the slopes.
The tops of the slopes were ‘ green zones’ i e low frost risk, and the bottom of the slopes ‘red zones’, i.e. high frost risk.
Six varieties (EGA Eaglehawk, EGA Gregory, LPB Lancer, Suntop, LPB Spitfire, LPB Dart) were sown at three different planting dates - late April, mid May, early June.
TinyTags were installed to measure temperature at the top and bottom of the slope every 15 minutes.
Continued
Figure 1. 2013 yield map (left) and corresponding elevation (right) at Gurley site.
Key results
The bottom of the slopes at both sites had more frosts, longer frosts, and a longer cumulative frost time (where frost length = hours < 0°C)
At Gurley, on average (2014-2019), there was an extra 34 frost events and extra 135 hours of frost at the bottom of the slope. At Premer, this was an extra 42 frost events and 210 hours frost at the bottom of the slope.

The bottom slopes were always slower to flower. Those planted in late April were 10 days later, mid-May were 7 days later and early June were 6 days later than the top of the slope.
Although there was an average 2 – 3°C difference between top and bottom slope at both locations, the average maximum temperature was similar for both top and bottom slopes – meaning a shorter optimum flowering window at the lower elevations.
Net returns - how do these results translate into $?
Analysing the net returns for Lancer wheat over the 8 years at both sites:

Planting in mid-May gives similar returns to late April, but with lower frost risk at the bottom of the slope.
Planting in late-April gave superior returns at the top of the slope which had limited frost risk.
More detail – Gurley bottom of slope
Looking at individual years, planting in late April is the clear winner from 2015 - 2017, 2019, and 2021. However, throw in one very frosty year like 2020, which had 5- 6 late August frosts, and the cumulative benefits are effectively wiped out. In 2020, the late April plots returned only $52/ha while the mid-May plots yielded $1413/ha.
Figure 2 Example trial site image with 21 m elevation difference
Continued
Table 1. Summary of average net returns at Gurley and Premer from 2014 - 2021
Net return ($/ha) for cv LRPB Lancer at Gurley top and bottom slope sites for three planting dates from 2014 to 2021
More detail – Premer bottom of slope
At Premer, late April planting in frost zones had better returns from 2014-2018, and 2021. However, as with Gurley, one bad frost year (in this case 2019) caused substantial losses of $286/ha, largely evening up the average net return.


Top of the slope
At the top of the slope at both Premer and Gurley, planting early (late April) increased net return by $157–204/ha/year compared to planting in mid-May.
Conclusion
This trial has shown that elevation has a large impact on frost risk but not on the risk of heat stress during grain fill. This presents an opportunity for growers to plant earlier in higher parts of the landscape without necessarily increasing the frost risk.
While elevation can be used as a valuable tool to evaluate frost risk, other factors such as drainage lines, aspect, tree lines and position in the landscape also need to be considered.
To Listen - GRDC Podcast
Frost Risk Part 2: Site elevation
https://grdc.com.au/news-and-media/audio/podcast/frost-risk-pt-2-site-elevation

2
Table
Table 3. Net returns ($/ha) for cv LRPB Lancer at Premer top and bottom slope sites for three planting dates from 2014 to 2021
JOIN OUR BETTER FROST DECISIONS

FACEBOOK GROUP!
A public group providing frost updates and frost response information, including:
support to identify frost damage info to assess your options for frosted crops planning for next season an opportunity to reflect and review on frost events and your response.

Join here https://www.facebook.com/groups/ 1120487535225571
CROPS, people, MONEY & you…and frost
We caught up with ThinkAgri’s Kate Burke at the National RiskWi$e meeting in Sydney, to discuss the impacts of frost and other stressful events on farmer decision making.

Kate has written a book that directly relates to the challenges faced by farmers, particularly managing the mental and financial aspects of dealing with frost. In farming, we all strive to thrive and leave a legacy, but the reality can be tough and emotionally draining.

“Unfortunately, we are often not equipped with the skills to handle these difficult situations. However, with some forward planning and scenario analysis, we can effectively manage events like frost or drought It's essential to confront these challenges head-on, rather than avoid them”, Kate explains.
In her book, Kate emphasizes the importance of managing our minds and utilizing what we can control to tackle the things we can't. She refers to this as our "thinking landscapes" and encourages self-awareness to navigate through different mental states - whether it's being in our head, grounded, or feeling overwhelmed in the swamp.
Kate has both conducted extensive research and worked closely with farmers and their families. She has observed various reactions when things go wrong. Some individuals may shut down or express disappointment, while others may turn to anger. As an agricultural professional, Kate understands the whirlwind of emotions farmers experience during such times.
Recovering financially from these challenges often involves making sound decisions under pressure and seeking guidance from advisors. It's a skill that can be developed with practice. In areas prone to frost, farmers have become accustomed to facing these setbacks and have learned to bounce back quickly.
Kate adds, “Sometimes, when we aren't confronted with significant challenges, the impact can be even worse. We tend to attribute the success or failure of a season solely to our own efforts, rather than recognizing the influence of external factors, like the weather. Younger generations may find their first experience with frost or drought particularly difficult, whereas those who have experienced multiple setbacks have gained resilience through past experiences ”
If you notice someone struggling, it's essential to create a supportive environment. Simply being present and asking the question "Are you okay?" can make a significant difference. If you don't have a close relationship with the person, reaching out to someone who is close to them and expressing concern can also be helpful.
While agronomic solutions are often discussed in challenging situations like frost, it's important to remember the human aspect. Supporting one another and providing a listening ear can go a long way in helping farmers navigate through these difficulties.
Kate will be joining our team of technical experts, supporting the Better Frost Decisions Facebook group, and will provide some useful guidance on making tough decisions in the event of significant frost damage
AboutKate
Dr Kate Burke’s practical and pragmatic approach to farming is based on thirty years of experience as an agricultural scientist in the dryland cropping sector. She knows how to connect the dots of science, people and money. With a unique blend of evidence, insight and empathy, Kate encourages readers to clear the fear and take the steering wheel toward Excellent Farming.
SNEAK PEAK: PRE-SEASON PLANNING TOOL – CROP FLOWERING CALCULATOR
With an ever-increasing array of crop varieties to choose from, it can be hard to keep track of when to sow which one, or if a newer variety might suit the sowing window better. To make life easier, CSIRO are developing an online crop flowering calculator that visualises the optimal flowering period for wheat, barley and canola varieties.
The tool is based on the optimal flowering period – when the crop should start flowering for the highest average yield potential. The optimal flowering period is a balancing act to minimise frost, heat and water stress (Figure 1). Crops that flower too early might have insufficient biomass, while crops that flower too late risk damage from heat and water stress.

The crop flowering calculator brings together decades of field research data and new genomics information to make sure growers have access to relevant flowering window information for their region.
Lilley says, “The intention is to support agronomists and growers to make sowing time decisions that are more aware of the frost and heat risks so they can choose combinations of time of sowing, species and cultivar for their specific paddock scenario.”
Dr
Co-project lead, CSIRO scientist
Julianne
Continued
Figure 2 If selecting a sowing date, the tool shows where the flowering window for each variety falls compared to the optimal flowering period for the chosen region Each row represents a different variety Variety names have been removed from the image
Figure 1. The optimal flowering window balances frost, heat and water stress. Image courtesy of Julianne Lilley, CSIRO.
How the flowering calculator works
The tool has three main steps: 1 2. 3
Choose your location e g Wagga Wagga
Locations are based on Bureau of Meteorology weather stations. When the tool is released there will be 77 locations available with a long-term goal of 850 locations
Choose your crop – wheat, barley or canola. Then choose the sowing date if you know when you want to sow and need help choosing a variety, or variety if you know what varieties you want to plant and need to work out when to sow.
By sowing date
Choose this option when you have a set sowing week and need to choose varieties that will flower in the optimal window in your region. The tool graphs every variety in its database. You can narrow down the results by filtering by company or cultivar.

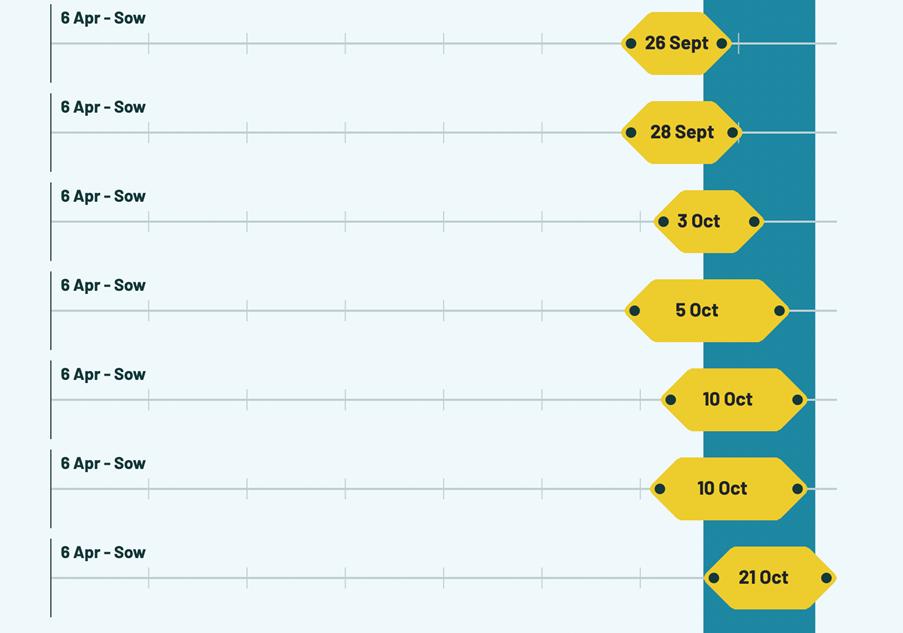
Figure 2 shows part of the results if sowing during the week of April 6. The vertical blue band is the optimal flowering window for Wagga Wagga. Each row represents a different wheat variety The yellow polygons are the range of flowering dates over the last 60 years and the date listed is the median flowering date for that variety.
By variety
If you already have seed in the shed and need to find the ideal sowing time, you can compare up to three varieties at a time.
Figure 3 compares three varieties across a range of sowing dates. The vertical blue band is the optimal flowering window. If the farmer wanted to sow in the week of April 6, the fast (yellow) and mid (green) cultivars would flower too early, but the slow cultivar (purple) falls within the ideal flowering window.
For both options, canola has extra filtering options – by herbicide – to narrow down by different herbicide groups
“If a grower knows they want to use a triazine tolerant variety, for example, they can filter and only show those varieties,” says Julianne.
How is the flowering window calculated?
The optimal flowering period for each location is derived from 60+ years of simulations which use local climatic and soil data to predict the period of flowering which delivers maximum yield.
The flowering period for a particular sowing date and variety combination is simulated using genetic predictions of flowering response to local climatic data
The work from the National Phenology Initiative (NPI), which analysed the genetics of 64 wheat and 32 barley varieties to link genes to flowering windows, plays a critical role In Phase 2 of the NPI, the team are analysing the genetics of new wheat, barley and canola varieties which are included in the NVT.
Continued
Figure 3 Users can compare up to three varieties at a time across a range of sowing dates Yellow = fast cultivar, green = mid cultivar, pink = slow cultivar
The NVT flowering observations are used to validate the flowering dates from the genetic model. Beyond the Crop Flowering Calculator, the genomics-based phenology parameters for each variety will be made available to the APSIM initiative for inclusion in APSIM and other tools like Yield Prophet.

“In the past, we had to run experiments all over the country in lots of different environments and collect very detailed measurements to work out the flowering window – which is very expensive,” says Julianne.
“What the NPI did was determine the genes that controlled flowering in recent Australian varieties, and used this knowledge to predict what a variety’s flowering response should be under different climatic variables.”
By validating that information against field observations, the team developed a way to predict flowering time from a plant’s genetics
A pipeline to feed new varieties into the tool
The team at CSIRO are working with the National Variety Trials (NVT) team to develop a methodology to feed flowering information into the tool
“When companies have a new variety, they put it into the NVT to have it tested Part of the testing is collecting the flowering observations from the NVT,” says Julianne
The aim is to have a system where new crop genomic information is used to predict the flowering window, with the NVT used to check the predictions in the flowering calculator match what is happening in the field. Because the NVT are run across the country in so many regions, the data should be widely validated.
“What this will mean is that the day a new variety is released, growers and advisors have access to the flowering window information,” says Julianne.
When will it be available?
The Crop Flowering Calculator is still in development and will be available for 77 locations in 2024, with a vision of 850 locations by the end of the project in 2026
Project details
The project is run by Julianne Lilley and Jeremy Whish at CSIRO, with funding from GRDC. Project code: CSP2206-012RTX - National Phenology Initiative - Phase 2 -Next Gen Flowering Calculators

