BETTER FROST DECISIONS
Knowledge to inform grower and adviser decisions for pre-season planning, in-season management and post-frost event responses.

IN THIS ISSUE
Abriefreviewoftheclimatein theMalleein2023
BFDFacebookgroup&April podcast
Insightfromourtechnical experts
Q+AwithSarahDayfrom SARDI
FrostEconomicScenario Calculator
A BRIEF REVIEW OF THE CLIMATE IN THE MALLEE IN 2023 WELCOME
Peter Hayman and Bronya Cooper, SARDI Climate Applications
After a wet finish to 2022, many Mallee growers missed out on an early start in 2023 with patchy rain through May but a wet June followed by a very dry finish (July to Oct). Minimum temperatures were warmer than average, but the number of very cold nights was above normal. Reports of frost damage were local and some damage might have occured under the radar.
Each year is unique and farming systems and varieties are always changing. Nevertheless, we can assess individual events in 2023 and calculate how 2023 as a season compared to the historical record. This is useful for interpreting trials and learning from grower experience.

Welcome to the first issue of the Better Frost Decisions newsletter for 2024! As we rapidly approach the 2024 growing season, it is crucial to reflect on the challenges and lessons learned from the previous season. In this edition, we take a comprehensive look back at 2023, particularly focusing on the impacts of frost during the spring months across the GRDC Southern Region. From multiple frost events in some regions, to relatively minimal impact in others, the variability of climatic conditions underscores the importance of adaptive strategies in agriculture.
ISSUE 9 | APRIL 2024
Photo credit - Sarah Day, SARDI
The PIRSA summary for 2023 available at Crop and pasture reports - PIRSA includes this summary of 2023 “Late October frost events had a significant impact in some later maturing paddocks in parts of the Upper North, Mid North, Murray Plains and Upper South East regions, however many producers were unaffected. In most cases the very dry conditions during late winter and early spring were considered to have more impact on grain yields than frost”. At a series of grower meetings in the Mallee, growers and agronomists commented on the dry spring with frost limited to localised damage. The overall sense was that crops had performed better than expectedconsideringthedryspring.
The 2023 cropping season across the Mallee benefited from the very wet October and November in 2022. On some soils this rain may have washed salt out of the rootzone which increases the effective bucket size. Many growers were maintaining excellent control of summer weeds which kept this moisture for the 2023 crop through an average to dry December 2022 to March2023.
In April 2023 growers in Eyre Peninsula and the South East received good top up rainfall but most Mallee growers missed out. May 2023 was average to dry before a very wet June. The rest of the growing season (July to October) was exceptionally dry. While it is usual to have one or two dry months, it is rare to have the run of four dry months. This 4-month period was ranked as decile 1 for the South Australian Mallee and decile2-3fortheVictorianMallee. Afterthevery dry end to the growing season, November and December2023werewetterthanaverage.
Table 1 and accompanying maps in Figure 2 show a series of cold nights in the 2023 cropping season. The synoptic maps show the consistent pattern of a high-pressure system which is what we expect for cold, clear, dry air on a calm night. The frost on the 26th of October was damaging for many grain crops in the medium and high rainfall zone and affected viticulture. Most crops in the Mallee were past the development stage by late October. A late October frost is a good reminder of the challenge of avoiding frost by floweringlate.

Figure 1. Decile maps of monthly rainfall from the Bureau of Meteorology. www.bom.gov.au

Table 1 Minimum temperatures on cold nights at six representative sites in the Mallee (Bureau of Meteorology).
The radiation frosts that cause damage in the Mallee happen on still, clear, cold nights, but relating minimum temperature measured at a weather station to freezing damage to crops is complex. An obvious complication is the limited weather stations recording temperature. Even if a crop is near a weather station, we know that the air can be much colder at head height than the measured temperature at 1.2m. Furthermore, there is not a direct relationship between air temperature and freezing in plant tissues. Frost damage differs between crops, soil type, moisture in the air, stages of cropdevelopmentandother factors such as the presence oficenucleatingbacteria.
Figure 3 shows the daily minimum and maximum temperature for the last three years. The nights colderthan2oCaremarked as blue dots and the days hotter than 30 degrees marked as red dots. Ideally the run of cold nights end before the hot days start. For most sites in 2022 the cold nights stopped well before the heat started. However, in 2021 and 2023 there is an overlap that points to the challenge of the risky nature of farming intheMallee.

 Figure 2. Minimum temperature maps and corresponding synoptic charts from Bureau of Meteorology temperature archive and Chart Analysis archive. www.bom.gov.au
Figure 3. Time series of minimum and maximum temperatures from July to October in 2023, 2022 and 2021 for six sites in the Mallee.
Figure 2. Minimum temperature maps and corresponding synoptic charts from Bureau of Meteorology temperature archive and Chart Analysis archive. www.bom.gov.au
Figure 3. Time series of minimum and maximum temperatures from July to October in 2023, 2022 and 2021 for six sites in the Mallee.
So far in this article we have looked at single cold nights in 2023 (Table 1 and Figure 2) and compared the temperature for the last three years (Figure 3). However, we haven’t addressed how 2023 compared with a longer record. Maps of the decile of temperatures during the 2023 growing season (Figure 4) show that across the Mallee, maximum temperatures were very much above average and minimum temperatures were averageoraboveaverage.

Table 2. Deciles of Growing Season Temperature, cold sum, heat sum and growing season rainfall. Growing season temperature and rainfall calculated 1 April to 31 Oct, ColdSum and HeatSum are calculated between 1-Aug and 30-Nov 2023.
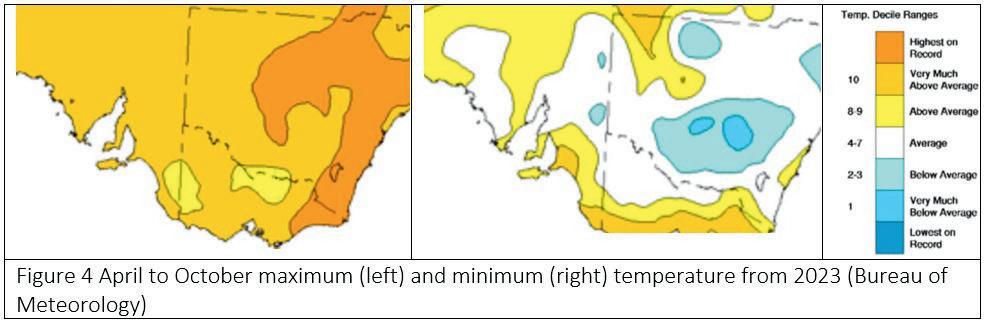
The high maximum temperatures shown in Figure 4 are consistent with the cloudless days and low rainfall. The average to warmer minimum temperature is less expected given the low rainfall in spring, this might be due to overall warming,butalsothewetterthannormalJune.
There is not a strong relationship between the average minimum temperature for the season shown in Figure 4 and extremely cold nights. The relationship between extreme hot days and the seasonal average maximum temperature is also weak. This is likely to be because the extreme events are more closely related to individual weather events than the climate for the season. Table 2 shows the decile rank of 2023 for a measure of cold nights (cold sum) and hot days (heat sum). The deciles are based on the period 1957to2023.
The Coldsum is calculated by accumulating the degrees C colder than 2°C. Following this approach, a zero-degree night is scored as 2 and -1°C scored as 3. The Heatsum is calculated in a similar way with a day of 31 is given a score as 1 and33scoredas3.
Although an imperfect measure, it provides a ranking of how much extreme cold and heat has occurred in a year. These measures don’t take into account the exact timing of the cold night or hot day. Consistent with Figure 4, Table 2 shows that the warm mean temperatures [(Max + Min) /2] with only Lameroo below Decile 8. Despite the warmer than normal average temperatures, the Coldsum calculation indicates a higher level of extreme cold. Loxton was affected by a run of very cold nights. The Heatsum calculations show decile 8 hot extremes for Balranald and Nhill but decile5or6fortheotherlocations.
In some years there are widespread damaging frosts that receive media coverage but in years like 2023, frost is more localised and largely under the radar. Frost damage has been noticed by some growers in some paddocks, but it is likely that minor losses from frost and cold damage go unnoticedinyearslike2023.
 Figure 4. April to October maximum temperature (left) and minimum (right) temperature from 2023 across South Australia, Vicotria and NSW. (Bureau of Meteorology) www.bom.gov.au
supporttoidentifyfrostdamage infotoassessyouroptionsforfrostedcrops planningfornextseason anopportunitytoreflectandreviewonfrost eventsandyourresponse.
https://www.facebook.com/groups/ 1120487535225571


NEW PODCAST OUT NOW!! JOIN OUR BETTER FROST DECISIONS FACEBOOK GROUP! A public group providing frost updates and frost response information, including:
Join here!
INSIGHT FROM OUR TECHNICAL EXPERTS
2023 was largely frost free during the reproductive period of the crop. The exception to this was the event on the 26th-27th of October which saw many areas dip significantly below zero for a long time. Most of the early sown crops/early maturing varieties were far enough advanced to avoid significant damage from this event as the grain was nearly harvest ripe.

Jeff Braun
However, in the later, cooler districts (slower crop development) or where longer season varieties were sown (e.g. DS-Bennett and Big Red winter wheats) to “avoid” frost, frost tended hit really hard as grain was still quite doughy at this stage in these situations. Again, this highlighted to me that you can’t avoid frost by time of sowing or variety choice if you farm in a really frost prone area.
Canola was a surprise for me. It handled the late frost during late pod fill extremely well. Yields were slightly affected with most crops yielding approximately 0.5t/ha less than anticipated and quality commonly dropped to Canola X grade, which proved a slight headache for growers logistically and financially. Overall, I was happy with how the crop performed and am thinking we may use canola in the place of wheat in some rotations.
My top tips for frost planning this season:
You know where your frosty areas of your farm are. Don’t plant risky crops like wheat or peas. Restructure your rotations to include more barley, hay, pasture, oats or beans in these areas to reduce your risk.
2.
1. Don’t plan on delayed sowing to “avoid” frost. You would be better served observing point 1.
3.
Get access to some accurate temperature monitoring equipment i.e. how cold was it for how long. There are various means for doing this e.g. Mesonet, Tiny Tag temperature loggers, max/min thermometers. If you know when the frost occurred you can begin monitoring and planning actions. Having your “head in the sand” and not looking is not a management strategy
Q+A WITH SARAH DAY FROM SARDI
Better Frost Decisions Project Manager Paige Cross recently spoke with Sarah Day, a Senior Research ManagerforSARDI,basedinClare.Sarah’sfocusisonpulseagronomy.Belowwesharesomeofthekey questions and answers with the full interview available via the upcoming Better Frost Decisions Podcastepisode.
Q: Sarah, as a researcher who facilitates many trial sites across South Australia, could you share your observations regarding frost during the 2023 growing season?
A: Frost often emerges unexpectedly, particularly in regions experiencing drought conditions, as I've found from overseeing numerous trial sites across South Australia. In 2023, parts of SA were notably dry, which typically exacerbates frost occurrences.
Some sites experienced minimal damage, while others faced 10, 20, or even 30 significant frost events below zero. These events varied widely in frequency and intensity, highlighting the unpredictability of frost distribution across different regions.

Q: What are the benefits of growing pulses in terms of frost management strategies?
A: Pulses respond differently to frost compared to cereals. While they are sensitive, they can offer advantages such as continued flowering after early frost events that are not too severe. This resilience provides opportunities for yield recovery even after some initial setbacks.
Q: Have you observed any changes in frost susceptibility in pulses over your career?
A: No significant changes have been noted. While there are perceived differences, robust research is needed to substantiate these observations and understand the impact of frost events on various crop varieties and growth stages.
Q: Were the sites that experienced the more frequent or repeated frost events those areas where you would traditionally expect to be frosted?
A: Frost can indeed appear where least expected. While some sites align with traditional frost-prone areas, others experience unexpected occurrences due to complex environmental factors like topography and microclimates. Thus, predicting frost events accurately remains a challenge.
Having reviewed the weather data, it seems that the 2023 frost events were for an extended period of time, which can be more detrimental than a short period of cold.
For more information about Sarah Day or the GRDC funded project ‘Development and extension to close the economic yield gap and maximise farming systems benefits from grain legume production in SA’ project code: UOA2105-013RTX please visit https://msfp.org.au/projects1/grainlegume-production/
Q: Is there a point in the growth stage where a significant frost event might cease flowering altogether for pulses?
A: Late frost events, especially in September or October, can halt flowering entirely, leaving no chance for crop recovery. However, if frosts occur earlier in the season, such as in June or July before full flowering, there's still potential for yield recovery.
Q: What strategies or considerations would you recommend be considered for frost management in the 2024 season?
A: Diversification and risk mitigation are key. Variable-rate nutrition and fertiliser applications tailored to frost-prone areas, staggered sowing schedules, and ongoing identification of frost zones will inform targeted management interventions. This multifaceted approach aims to minimise the impact of frost on crop yields and enhance overall resilience in the face of climate variability.
FROST ECONOMIC SCENARIO CALCULATOR
In the December 2021 issue of Better Frost Decisions, we introduced the Frost Economic Scenario Calculator. Now available online, the calculator is a way to test out different frost scenarios and management options to see the impacttheyhaveonthefarm’sbottomline.
The calculator gives users a broad idea of how gross margins change with management decisions, such as cutting a certain amount for hay or growing different crops. Users can compare up to five scenarios to help choose which management strategies might work best forthemthisseason.
Information needed to use the calculator
Thecalculatoruseszonestoclassifyfrostrisk: Green:areaswithnofrostrisk Amber: sometimes frosted and if not frosted hasproductioncapabilityliketheredzone Red: areas frequently or severely damaged byfrost.
As such, using the calculator requires a decent understanding of frost risk and impacts across the farm i.e. which areas get severely damaged, areasthatareonlysometimesdamaged,andhow yields are affected by varying levels of frost. Printing off a map of the farm and mark out green, amber and red zones, can help gauge the areaofeach.
Usersalsoneedtoknowandhaveconsidered: theunfrostedyield/haforeachenterprise on-farmpriceforeachenterprise($/ha) what salvage options you could choose and when you would choose them, e.g. if a certain amount of the wheat crop is damaged by frost,cutforhay variable costs ($/ha) such as fertiliser, weed control, cutting, baling, etc. for both normal operationsandsalvageoperations.
The calculator is best used as a guide and is only as good as the data entered. It does not account forcapitalcostssuchasbuyingnewmachinery.
Testing scenarios
To get the most out of the calculator, think through how the farm operates normally and what management options are available in various frost situations, ranging from no frost up to the worst frost. Test different scenarios, such as a different crop, more or less area of certain crops, and different salvage options, to compare the impact on the overall gross margin. The calculator will show if various decisions, such as salvaging frosted wheat for hay, are viable options.
The calculator is very flexible, letting users specify their crop choices, frost management options, and trigger points for when to implementasalvageoption.
For example, three scenarios were set up in the calculator (Table 1). Scenario 1 is the baseline farming system, used to compare changes. In scenario 2, the grower will cut up to 200 ha of wheat for hay if it is more than 50% damaged (theseparametersaresetupinthecalculator).
In scenario 3, the grower plants milling oats instead of cereals on 75 ha of country that is the mostfrostprone(redzone).

Table 1. Hectares allocated to each enterprise in three scenarios.
(Note: blue shading indicates different management strategies chosen compared to scenario 1.)
Continued....
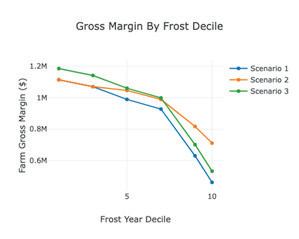

During less frosty years, allocating 75ha to milling oats rather than cereals in the worst frost areas (scenario 3) had the highest gross margin while there was little difference in scenarios 1 and 2. In more severe frosts, cutting frosted wheat for hay (scenario 2) outperforms scenarios 1and3(Figure1left).
The ‘Difference’ column graphs (Figure 1 right) compares the difference in gross margin between the scenarios. This example shows that cutting frosted wheat for hay generated a profit of $50 – 60,000 each year in the lower frost deciles, and $250,000 in the highest frost decile, comparedtonotcuttingforhay(scenario1).
A
planning tool
The calculator is a planning tool, best used at the start of the season. The creators envisage growers and agronomists going through the plans for the season, past experiences, predictions for this season, and running through a few scenarios to work out the ideal way to managefrostthisseason.

Users can download the data file (.json) to reimportnextyearandtweak,ratherthanhaving to fill it out again. Agronomists can save files for eachclient.
Try it out
Tryitonlineat:https://sfs.org.au/frost-calculator
Help videos are underway to walk users through eachsection.
The calculator has been designed by Michael Moodie, Frontier Farming Systems and further developed by Southern Farming Systems through investment from GRDC and the Better FrostDecisionsProject.

 Figure 1. Line graph comparing gross margins at different frost deciles between the three scenarios (left); column graph showing the difference in gross margin between scenarios 1 and 2 for various frost deciles (right).
