BETTER FROST DECISIONS
Knowledge to inform grower and adviser decisions for pre-season planning, in-season management and post-frost event responses
Minimum temperatures in the growing season of 2022
PeterHaymanandBronyaCooperSARDIclimateapplications
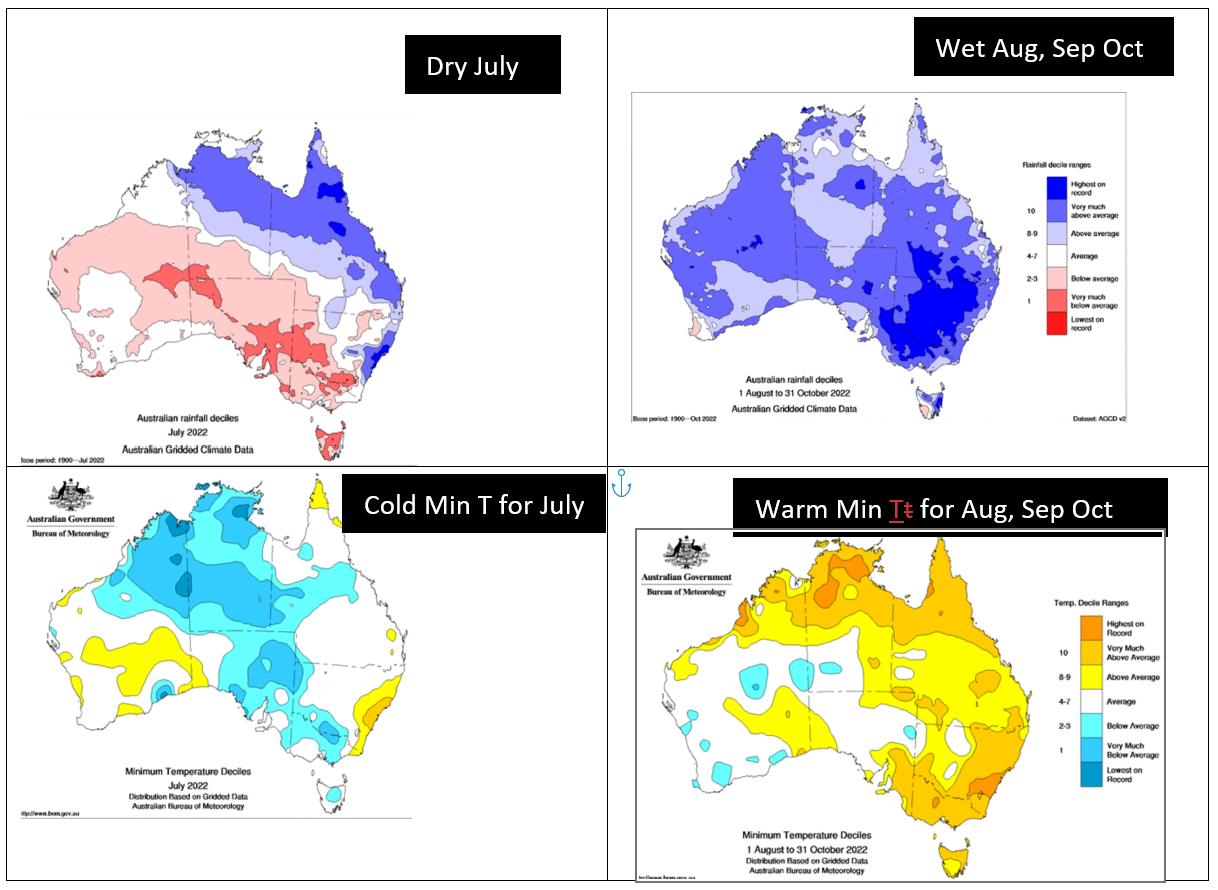
Thewidespreadfrostsacrossthesoutherngrainsbeltin2022hadthe potentialtobethemostexpensivefrostinhistoryduetothe combinationofhighinputcosts,potentiallyhighgrainpricesand promisingyields.July2022wasfrostybutgraingrowersinmost regionsarereportinglimiteddamagefromalessfrostyAugust, SeptemberandOctober. Thesemonthshavecreatedchallengesfor managingdisease,andworriesofawetharvestandinsomecases, flooding.
AcrossmostoftheAustraliangrainsbelt,Julywasextremelydrywith coldnights.TheimportantmonthsforfrostdamageofAugust, SeptemberandOctoberwereunusuallywetwithwarmernights (Figure1). TheBoMdeclaredanegativeIndianOceanDipoleinlate JulyfollowedbyaLaNinainSeptember Theseclimatediversincrease thechanceofwetterconditionswithmorecloudcoverandhence warmernights.Cloudandmoistureintheairandsoilreducefrostrisk andthisisshowninspatialpatternsoftherainfallandtemperature deciles(Figure1).Whereitwasdry,nightstendtobecolder,whereit iswetnightstendtobewarmer
IN THIS ISSUE
Minimum temperatures in the growing season of 2022
GRDC Frost tour through South Eastern Australia Ice nucleating bacteria research Better frost and heat management tools on the horizon
WELCOME
The last issue for this year comes as many parts of the country are experiencing extremely challenging weather, making upcoming harvest conditions tough for many In this issue, we continue our regular catch-up with Dr. Peter Hayman to find out more about the growing seasons minimum temperatures.

We also hear about the recent GRDC Frost study tour through South Eastern Australia, Ice nucleating bacteria research and better frost and heat management tools on the horizon
Next issue is due early 2023.

ISSUE 6 | DECEMBER 2022
Continued
Figure 1 Deciles of rainfall and temperature Maps sourced from the Bureau of Meteorology Recent and historical rainfall maps, Australian Bureau of Meteorology (bom gov au), Climate Maps - Temperature Latest (bom gov au)

Figure 2: Minimum temperature maps for the cooler nights during July 2022 in Southern Australia. Maps sourced from the Bureau of Meteorology Climate Maps - Temperature Archive (bom.gov.au).
Nevertheless, even in years with these climate divers, we can still get calm, clear, cold nights Althoughlesscommon,frostinwetyearstendto be more costly. Frost adds insult to injury in a drought,butthemostexpensivefroststoagrains businesscanbeinagoodyearbecauseoftheloss of the potentially high yield. Furthermore, in a wetterthanaverageseason,salvageoptionssuch as hay or grazing tend not to be as profitable. Agronomists and growers also refer to the psychological challenge of a frosted crop when neighboursarecelebratingsuccess. Intherestof thisarticle,welookatsomeofthecoldnightsin moredetail.
The very frosty July
There were about 13 cold nights in July (Figure 2). As a quick guide, the grey areas indicate zero to three degrees, light pink zero to minus three and darker pink minus 3 to minus 6 This is gridded data based on BoM weather stations measured at the Stevenson screen. As a general rule, the temperature at head height is about 2 degrees colder than the Stevenson screen. Parts of the landscape can be quite different from the gridded data, especially if in a valley or at the bottom of a sandhill
Continued....
August September and October – warmer, but not frost free

Although minimum temperatures in the critical months of August, September and October were warmer than average, and there were fewer frosts than average, the BoM gridded data shows that there were some very cold nights with the potential of frost damage (Figure 3). This reinforces the point that even in years with strong climate divers for wetter conditions with more cloud cover and hence warmer nights (negative IOD and La Nina), we can still get calm, clear, cold nights. Potential frost nights include 8th and 9th of August, 31st August to 3rd September, 6-11th of September and 9th of October.
Each minimum temperature map in Figure 3 is paired with a synoptic chart. A consistent pattern is the large high pressure system across the southern grains belt In a previous GRDC project James Risbey (CSIRO) worked with SARDI Climate Applications to look at the synoptic patterns over the last 50 years when spring nights dropped below two or zero degrees in the Australian grains belt. James used software to trace the source of air particles and found a complex process of descending cold, dry air from about 50o south that was then entrapped in a high-pressure system. Although the climate drivers of negative IOD and La Nina tend to reduce the frequency of these synoptic patterns they are not eliminated. Continued....
Figure 3: Minimum temperature maps (left of pair) and corresponding synoptic charts for the cooler nights during August, September and October 2022 in Southern Australia. Synoptic charts are from 10am AEST on the given day. Maps sourced from the Bureau of Meteorology Climate Maps - Temperature Archive (bom gov au) and Analysis Chart Archive (bom gov au)

Punthari – a frosty site east of Mt Lofty ranges
SARDI scientist, Brendan Kupke is running a SAGIT project at Punthari where he is monitoring temperature in a gill screen at 1.2m. Temperatures during this period were up to 7 °C colder at Punthari compared to Murray Bridge, most notably the frosty morning of 6th September where Murray Bridge recorded a minimum of 3 °C and Punthari recorded -3 4 °C Some of the difference could be due to the different measurements (BoM station vs gill screen), but these differences are likely to be small compared to the different locations. Yongala is cold and in this season the site at Punthari seems to be even colder.
The complicated relationship between frost and minimum temperature
The title of this short article is minimum temperature in 2022, not frost in 2022 As farmers and agronomists observing frost are aware, the relationship between minimum temperature and frost is complicated. There are a number of reasons for this. First, of all weather measurements, minimum temperature is the most sensitive to location in the landscape. The human body is quite sensitive to small changes in temperature and we have all experienced walking through spots where cold air has drained.

Second, minimum temperature changes at a very fine spatial scale within a wheat paddock, especially during a radiation frost on a cold, clear, still night.
Due to this temperature variation across a small area frost researchers have to be careful of the influence laneways or other buffers play in a landscape. Third, even if you knew the minimum temperature of every wheat head, this doesn’t tell you about the occurrence of frost. Why, because zero degrees Celsius isn’t the freezing point of water.
Zero degrees Celsius is the melting point of ice rather than the freezing point of water. Pure water can stay as a liquid at temperatures as low as -40 °C Supercooled Water and Bacteria’s Bag of Tricks | Shout Out Science! (wordpress.com). Nucleating sites such as dust, pollen or some bacteria will cause water to freeze closer to 0 °C. Some bacteria are especially effective at nucleating ice crystals. This might have an advantage for mobility to form rain from super cooled water in clouds and then when delivered to a new location to rupture plant cells. The West Australian Department of Primary Industries and Regional Development (DPIRD) is examining the role of ice nucleating bacteria Frosts are related to cold nights, but there is a lot more required for a frost than a cold night See "Ice nucleating bacteria research" later in the newsletter for more information.
Figure 4: Daily minimum temperature observations between 1st August to 31st September 2022 at Murray Bridge and Yongala (Bureau of Meteorology), and 1st August to 7th September 2022 at Punthari (gill screen observations from Brendan Kupke, SARDI).
Catch up on our "Better Frost Decisions" podcast episodes this harvest...


 Early sown frosted wheat at Punthari .
GRDC Frost study tour through South Eastern Australia
In early September, 14 growers from Western Australia crossed the desert to check out frost management in South Australia and Victoria. The trip took the growers through Adelaide, Clare, Loxton, Birchip, Geelong and Melbourne.

Study tour host, Gary Lang (Wickepin grower and GRDC Western Panel Chair), said that while they didn’t find any magic solutions to frost management, there were some notable differences in management strategies and interesting research that could help frost management in the future.
The new X-ray CT system at the Australian Plant Phenomics Facility (APPF) at the Waite campus, Adelaide, can quickly analyse cereal varieties to understand how frost (and heat and drought) affect grain development This will help researchers choose varieties more likely to cope with different conditions
Some insights the group gained from the tour were:
It is important to identify frost-prone areas and treat them differently to other area of the paddock.
How ice nucleating bacteria could be making frost damage worse.
Most farmers the tour visited had very large hay sheds to store hay from frosted crops for feed or sale when the east coast drought.
Although not related to frost, one highlight for the group was the amount of lentils growing between Clare and Ballarat “I have never seen that volume of lentils growing before,” Gary said. Since returning from the tour Gary and some other growers are keen to introduce pulses into their rotation.
Another highlight was the Hyper Yielding Crop site in Victoria “Seeing 7 – 8 t/ha crops was eye opening,” Gary said.
Growth Chambers at Waite. Used to progress crops to the appropriate crop stages when needed for research. Image: Brenton Leske.
Different management approaches
One key difference noted was that eastern growers have the option of cutting frosted crops for hay.
“SA and Vic growers can manage frost by cutting hay and feeding the next mob of droughted cattle elsewhere. It’s part of the business strategy. This is not an option for WA growers as we don’t have the volume of livestock. We have to export anything made into hay and the quality of frosted crops doesn’t allow it to find a home on the export market.”
Growers at the hyper yielding site in Victoria. Image: Brenton Leske
Continued
Options in the west lie more in crop choice. At Gary’s place in Wickepin, delayed sowing was the primary mitigation option for 20 years, but still meant an average 23% frost loss as well as 3040% yield potential loss from delayed sowing Then through the national frost initiative they learned to grow alternative crops. Oats and barley are less susceptible to frost than wheat and a better choice in frost prone areas.
Gary said, “In 2016 we had 7 nights under minus 4°C in September and still managed to make a profit. We had replaced 600ha of frost prone wheat country with 600ha of oats which did well did well that year.”

Where to next?
Gary’s number one choice would be to perfect chilling cabinets so frost research can happen year-round, rather than relying on a few frost events each year. Frost cabinets or chilling cabinets exist but they tend to be small and are not custom built for frost research.
Gary is hoping to entice eastern growers to WA next year to see the frost strategies used in the west (as well as showcasing the nuances in sand we don’t get to appreciate in the east). On top of the educational benefit, tours like this are a great way to meet other growers. All respondents from the post-tour survey noted how valuable the tour was in building connections with other farmers and agricultural research staff. A nice dinner and a cold beer never go down too badly, either
Register your interest for a study tour to WA in 2023 admin@msfp.org.au
Ice nucleating bacteria research
There is more than cold weather to blame for frosted crops. Ice nucleating bacteria (INB) (Pseudomonas syringae), raise the temperature at which water freezes. When INB is in a grain crop, frost damage in the field can occur at minus 2°C, higher than the minus 8°C usually needed in plants free from INB.
Although INB have been known to scientists for decades (and industry; ice nucleating proteins are added to snow machines to help artificial snow form in warmer temperatures), there has been little work in grains crops in Australia.
Research scientist Dr Amanuel Bekuma from the Department of Primary Industries and Regional Development, Western Australia (DPIRD, WA) is part of the new GRDC frost research project led by FAR Australia (FAR2203-001RTX) With little research in grains to build on, one of the first steps was to confirm how much of a role INB were playing in frost damage.
“I bought some ice nucleating protein – the same product used to make fake snow – and applied prior to a frost event to wheat plants at flowering stage. The product increased frost damage up to 3-fold; treated plots had up to 60% frost damage compared to 20% in the control plots. This was a clue that the bacteria are responsible,” Amanuel said.
Next, researchers checked how prevalent INB is in cropping systems. INB is concentrated in the stubble, older leaves and to some extent in rainwater – adding weight to farmer’s anecdotal evidence that frost damage is worse if there is a light shower late in the afternoon or the evening before the frost.
Unfortunately, INB activity seems to be high during flowering, when grains crops are particularly sensitive to frost
“We don’t know exactly why this is but can speculate that it is because by flowering, the plants have older and senescing leaves which are a good food source for the bacteria.” Amanuel has not seen INB on green and healthy leaves of the plant, “If the INB is present, it is at a level too low for us to detect.”
By flowering, there is also canopy cover which protects the bacteria from sunlight, which reduces bacterial viability.
Finding ways to reduce INB populations during flowering could therefore reduce frost damage. One part of the project FAR2203-001RTX is looking at a range of commercially available products including:
Bactericides to kill the INB
Biological products to compete with the INB to reduce concentration and impact in the field.
Cryoprotectants to enhance the plant’s capacity to tolerate frost.
Field trials are currently underway at the Dale frost research nursery in Western Australia. In addition, controlled environment experiments using a frost cabinet are also underway – just in case there are no frost events at the field site during the project. The frost cabinet, which can simulate frost, is also being used to screen the different chemical and biological control products.
Dr Kenton Porker, project leader from FAR Australia, says, “This is new and novel research. With INB, we are still in the learning stage. We are trying to understand how widespread INB is, the impact it causes, and then how to reduce its impact on frost severity.”
Continued....
In the future, links between INB and crop genetics are one research avenue. Amanuel hopes to find out if certain varieties are more or less likely to host INB, as this will be part of the long-term frost management solution

There is also much more to understand about INB populations and frosted grain. At the moment we know that frosted grain has higher populations of INB, but we don’t know if the INB is causing the frost damage or if the INB inhabit the creases in the grain after the frost damage
Other research angles
The INB research is part of a broader research project addressing frost tolerance and avoidance in wheat, barley and canola (FAR2204-001RTX). The project is also investigating better farming systems to avoid frost. For example, by manipulating flowering times and having a more diverse range of flowering times to spread the frost risk.

“In the past we have sown cereals late to flower late, but there’s a trade-off with yield potential,” Kenton says. “We are looking at ways to sow early and flower late, through different genetics and techniques, such as pruning the crop, using hormones or defoliants, to slow crop development so it flowers later.”
At the end of the day, Kenton says this kind of deliberate management intervention will be most suited to areas of high frost risk. It is important for growers to understand their own frost risk and manage the high-risk zones. This could have the biggest impact in reducing frost damage and yield loss.
References and further reading
Bekuma A et al. 2022 Wheat genotypes differ in seed-borne ice nucleating bacterial (INB) population GRDC Update Paper https://grdc.com.au/resources-andpublications/grdc-update-papers/tabcontent/grdc-update-papers/2022/03/wheatgenotypes-differ-in-seed-borne-ice-nucleatingbacterial-inb-population
Bekuma A et al 2021 Stubble and senesced leaves are the main sources of ice nucleation activity in wheat GRDC Update Paper https://grdc.com.au/resources-andpublications/grdc-update-papers/tabcontent/grdc-update-papers/2021/02/stubbleand-senesced-leaves-are-the-main-sources-ofice-nucleation-activity-in-wheat
Knights S 2022 Frost physiology knowledge base grows. GroundCover. Issue 158. https://groundcover.grdc.com.au/agronomy/fros t-management/frost-physiology-knowledgebase-grows
Knights S. 2022. Are bacteria part of the frost puzzle? GroundCover Issue 158. https://groundcover.grdc.com.au/agronomy/fros t-management/are-bacteria-a-part-of-the-frostpuzzle
Growers at the hyper yielding site in Victoria. Image: Brenton Leske
Better frost and heat management tools on the horizon

Growers and advisers will soon have access to new tools to help manage weather risk. These tools including improved algorithms for crop modelling, detailed frost and heat maps, and new digital ag products will be generated as part of a four-year joint project between GRDC and CSIRO.
A key aim of Frost and Heat Management Analytics (FAHMA) is to improve our understanding of the damage that extreme events can cause to crop growth and yield.
“We already know a lot about frost and heat, however, the relationships between temperature and crop damage need further research to develop decision making tools,” says Dr Julianne Lilley, CSIRO project co-leader.
“Being able to predict the degree of damage certain temperatures cause at different growth stages can help growers decide on the best management strategy after a frost event.”
Once teased out, these ‘damage functions’ will have multiple uses. They will be fed into APSIM (Agricultural Production Systems sIMulator) to improve crop modelling and can be linked to frost and heat maps to generate new management tools and insurance products.
Frost and heat maps
Frost and heat maps at a sub-paddock scale will help growers track the severity and duration of extreme temperature events. Figure 1 show some example maps. Growers and advisers will have access to historical and near-real-time maps.
“By comparing historical maps, growers can see which paddocks are prone to regular frost and those which rarely frost,” Dr Lilley says.
While most growers have a good idea of where frost is a problem, the maps will make it easier to delineate different frost management zones and adapt cultivar choice and sowing time accordingly.
In season, the maps will help growers quickly assess the extent and severity of the damage and decide whether to leave the crop, cut for hay, or graze it.
“After frost, growers need to make a quick decision, in about 2-3 days, because hay quality will start to deteriorate. But it can take a few weeks to visually see the extent of the damage by which time the hay quality has deteriorated. Having temperature map in real time means growers can make decisions in real-time,” Dr Lilley says.
Continued
New management tools
The project has partnered with several ag tech companies to translate the research into new digital ag products. The damage functions and frost and heat maps will form the basis of new tools that help growers with farm planning and managing risk.

To ensure the research leads to usable products, grower and adviser interviews are underway to identify what tools would most help them
“As scientists we believe we know what will help, but to make sure the outcomes are useful for growers, we need to ask them what they need and then work with them to deliver a product,” says Dr Lilley.
“Instead of making tools then trying to find users. From the outset of the project, we have been working closely with the ag tech sector to ensure the research suits the delivery of decision tools through these companies.”

Insurance benefits
The research could also lead to improved insurance offerings Instead of relying on the closest weather station data, or subjective inpaddock assessments, insurance companies can use the maps and yield risk information to refine their policies. Growers can use the same information to choose a policy that suits their needs.
FAHMA is combining existing field and controlled environment experimental data from Australian frost and heat projects with international research. The project aims to deliver decision making tools for canola, wheat and barley by 2024, which can then be trialled and adapted As there is less existing research to work with for chickpeas and lentils, some experimental field work is underway and the outcomes will take longer.
Figure 1 Example temperature maps for three frost nights during 2016 at Hopetoun, Victoria Image source: Uday Nidumolu, CSIRO.
