Investment Summary

This document is confidential and may not be reproduced or redistributed. The information presented herein has been prepared for informational purposes only and is not an offer to buy or sell, or a solicitation of an offer to buy or sell any security or fund interest or any financial instrument and is not to be considered investment advice. This presentation is for institutional use only and is not to be distributed to any party other than its intended recipient. The following materials present information regarding a proposed creation of a special purpose vehicle (the "Issuer") which would offer securities (the “Securities”) to finance its acquisition of a portfolio of financial assets to be selected and managed by the portfolio manager referred to herein (the "Manager").
These materials have been prepared to provide preliminary information about the Issuer and the transactions described herein to a limited number of potential underwriters of the Securities for the sole purpose of assisting them to determine whether they have an interest in underwriting the Securities. The views and opinions expressed in this presentation are those of Life Bridge Capital LLC (“Life Bridge Capital Capital”) and are subject to change based on market and other conditions. Although the information presented herein has been obtained from and is based upon sources Life Bridge Capital believes to be reliable, no representation or warranty, expressed or implied, is made as to the accuracy or completeness of that information. No assurance can be given that the investment objectives described herein will be achieved. Reliance upon information in this material is at the sole discretion of the reader. This data is for illustrative purposes only. Past performance of indices of asset classes does not represent actual returns or volatility of actual accounts or investment managers, and should not be viewed as indicative of future results. The investments discussed may fluctuate in price or value. Investors may get back less than they invested.
The forward-looking information contained in these materials is subject to certain inherent limitations. Such information is information that is not purely historical in nature and may include, among other things, expected structural features, anticipated ratings, proposed or target portfolio composition, proposed diversification or sector investment, specific investment strategies, and forecasts of future market or economic conditions. The forward looking information contained herein is based upon certain assumptions, which are unlikely to be consistent with, and may differ materially from actual events and conditions. In addition, not all relevant events or conditions may have been considered in developing such assumptions. Accordingly, actual results will vary and the variations may be material. Prospective investors should understand such assumptions and evaluate whether they are appropriate for their purposes. These materials may also contain historical market data; however, historical market trends are not reliable indicators of future market behavior.
Information in these materials about the Manager, its affiliates and their personnel and affiliates and the historical performance of portfolios it has managed has been supplied by the Manager to provide prospective investors with information as to its general portfolio management experience and may not be viewed as a promise or indicator of the Issuer's future results. Such information and its limitations are discussed further in the sections of these materials in which such information is presented.
Past performance of indices or asset classes does not represent actual returns or volatility of actual accounts or investment managers and should not be viewed as indicative of future results. The comparisons herein of the performances of the market indicators, benchmarks, or indices may not be meaningful since the constitution and risks associated with each market indicator, benchmark, or index may be significantly different. Accordingly, no representation or warranty is made to the sufficiency, relevance, importance, appropriateness, completeness, or comprehensiveness of the market data, information, or summaries contained herein for any specific purpose.
Past performance is not indicative of comparable future results. Given the inherent volatility of the securities markets, it should not be assumed that investors will experience returns comparable to those shown here. Market and economic conditions may change in the future producing materially different results than those shown here. All investments have inherent risks.


Executive Summary Property Profile Financial Analysis Market Overview Portfolio & Case Studies Index 7 16 23 30 35 42Table of Contents
Summary
Investment
Investment Offering Investment Highlights
SECURITY
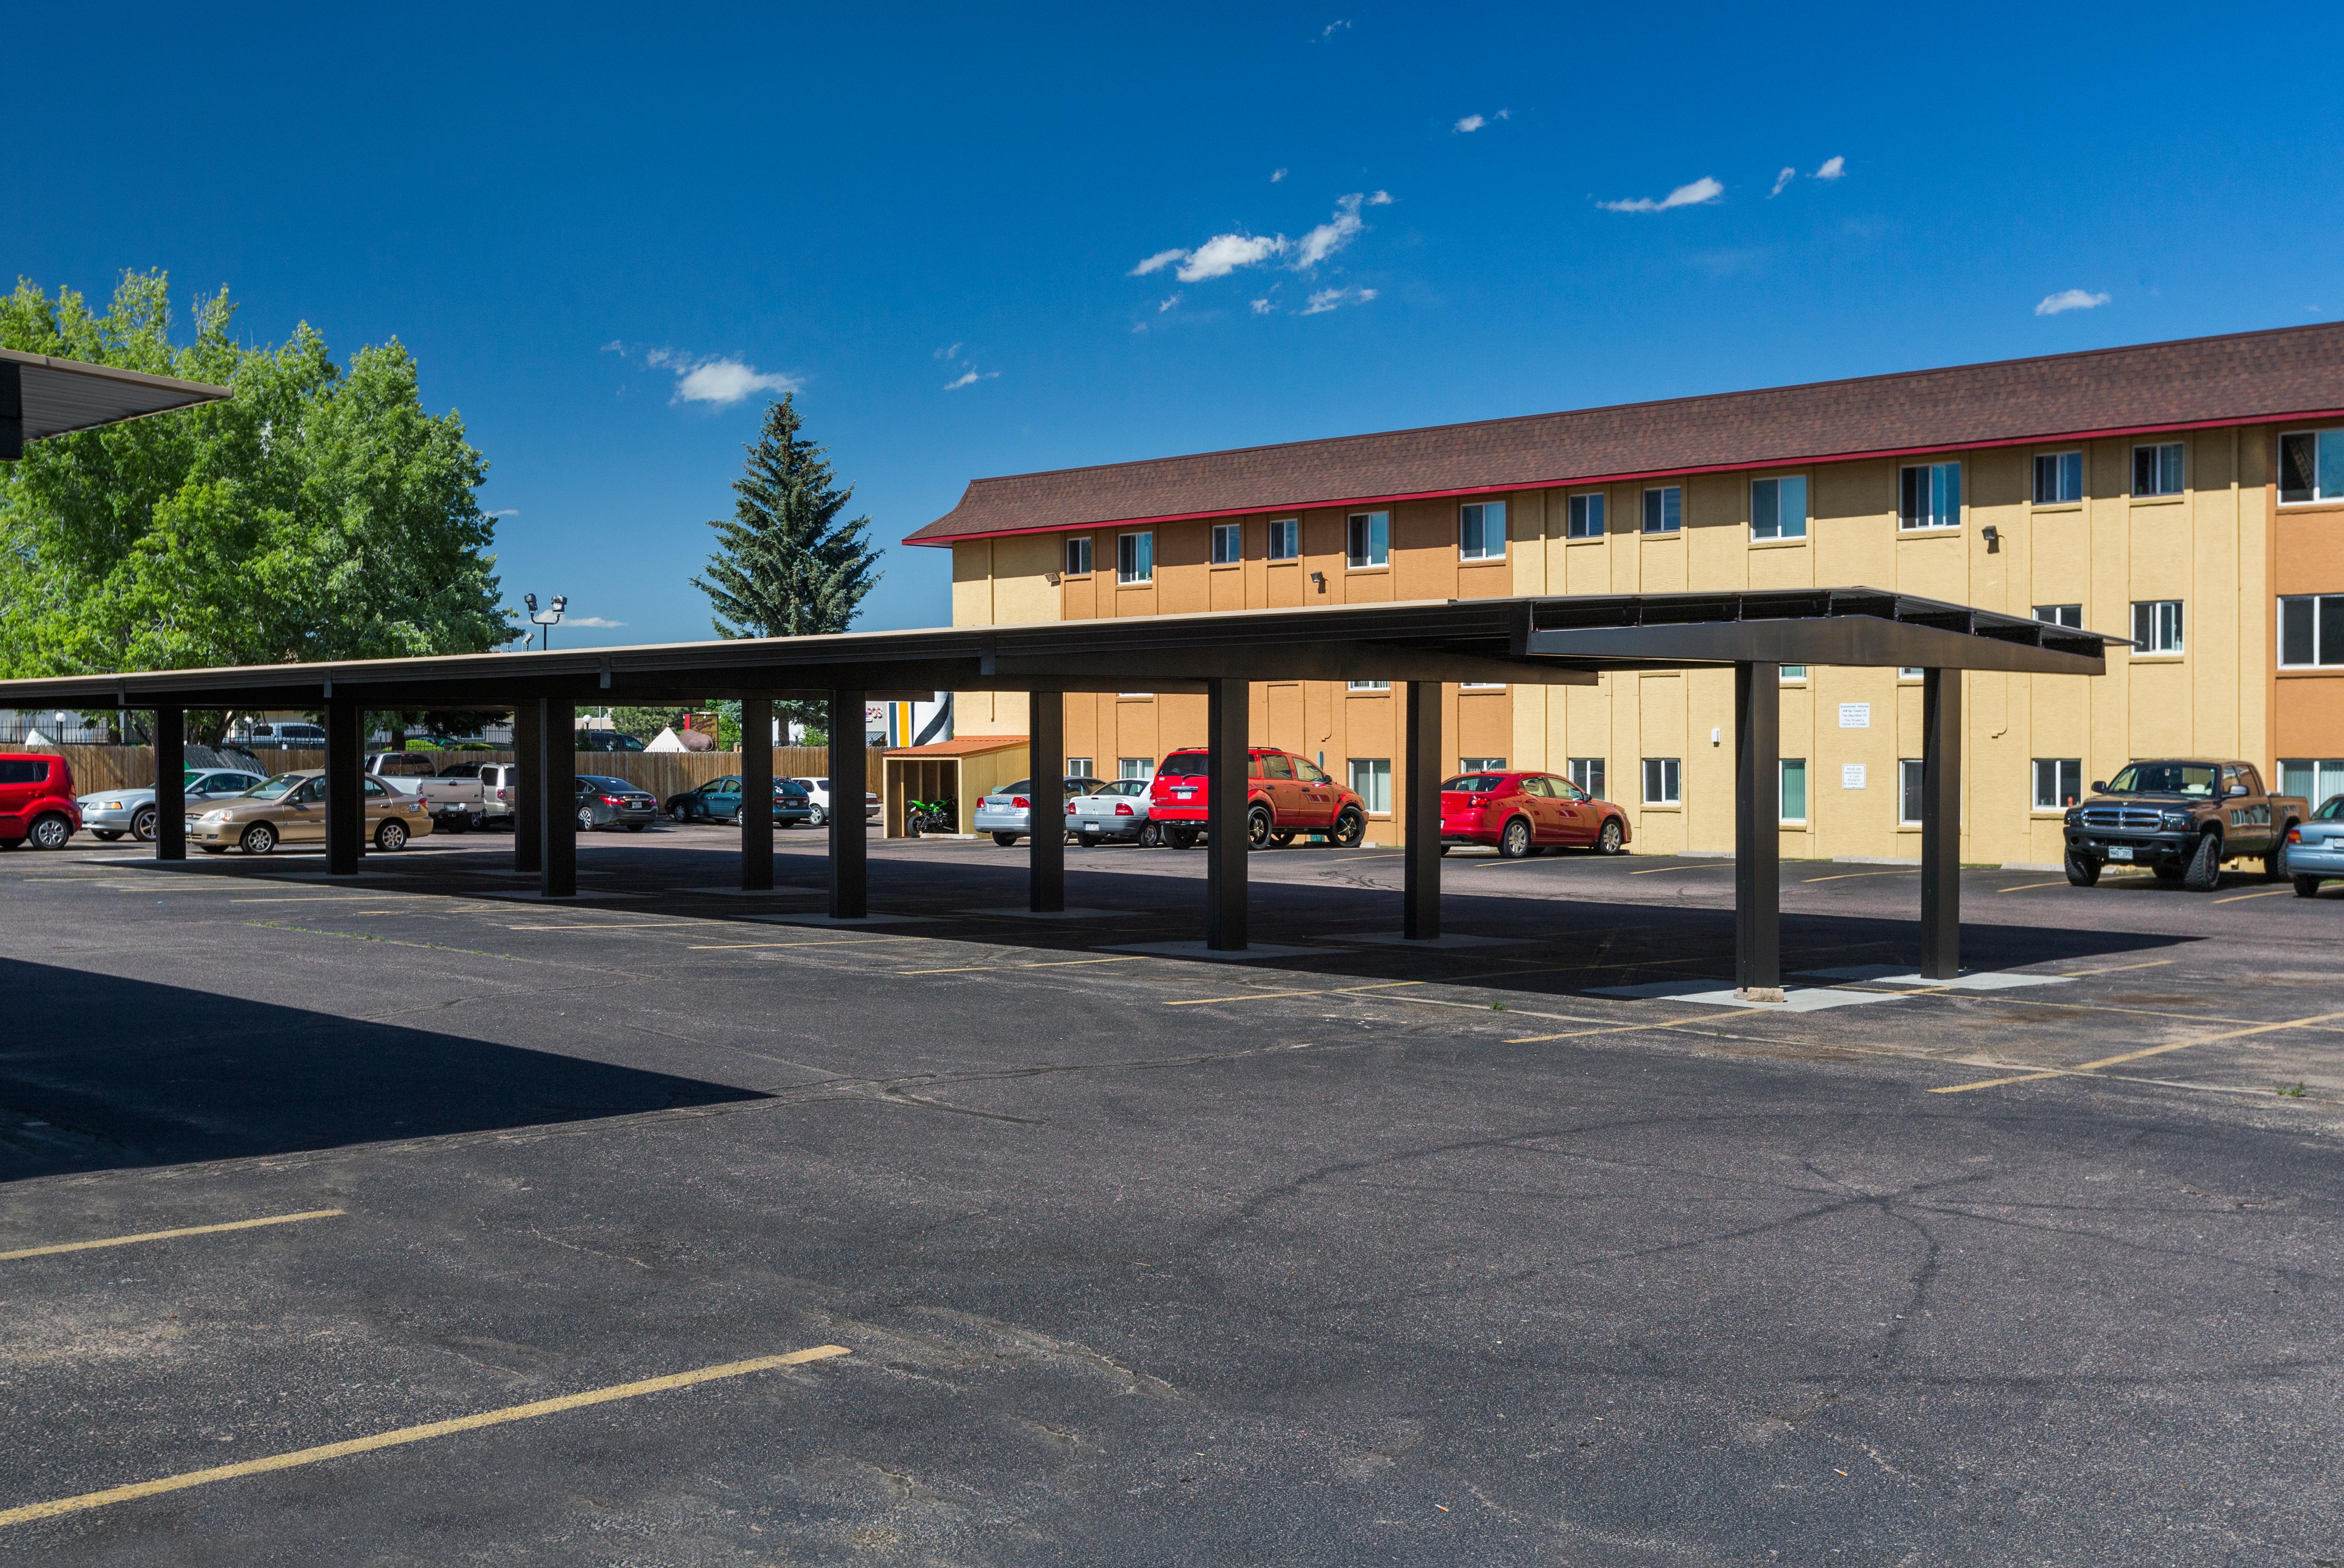
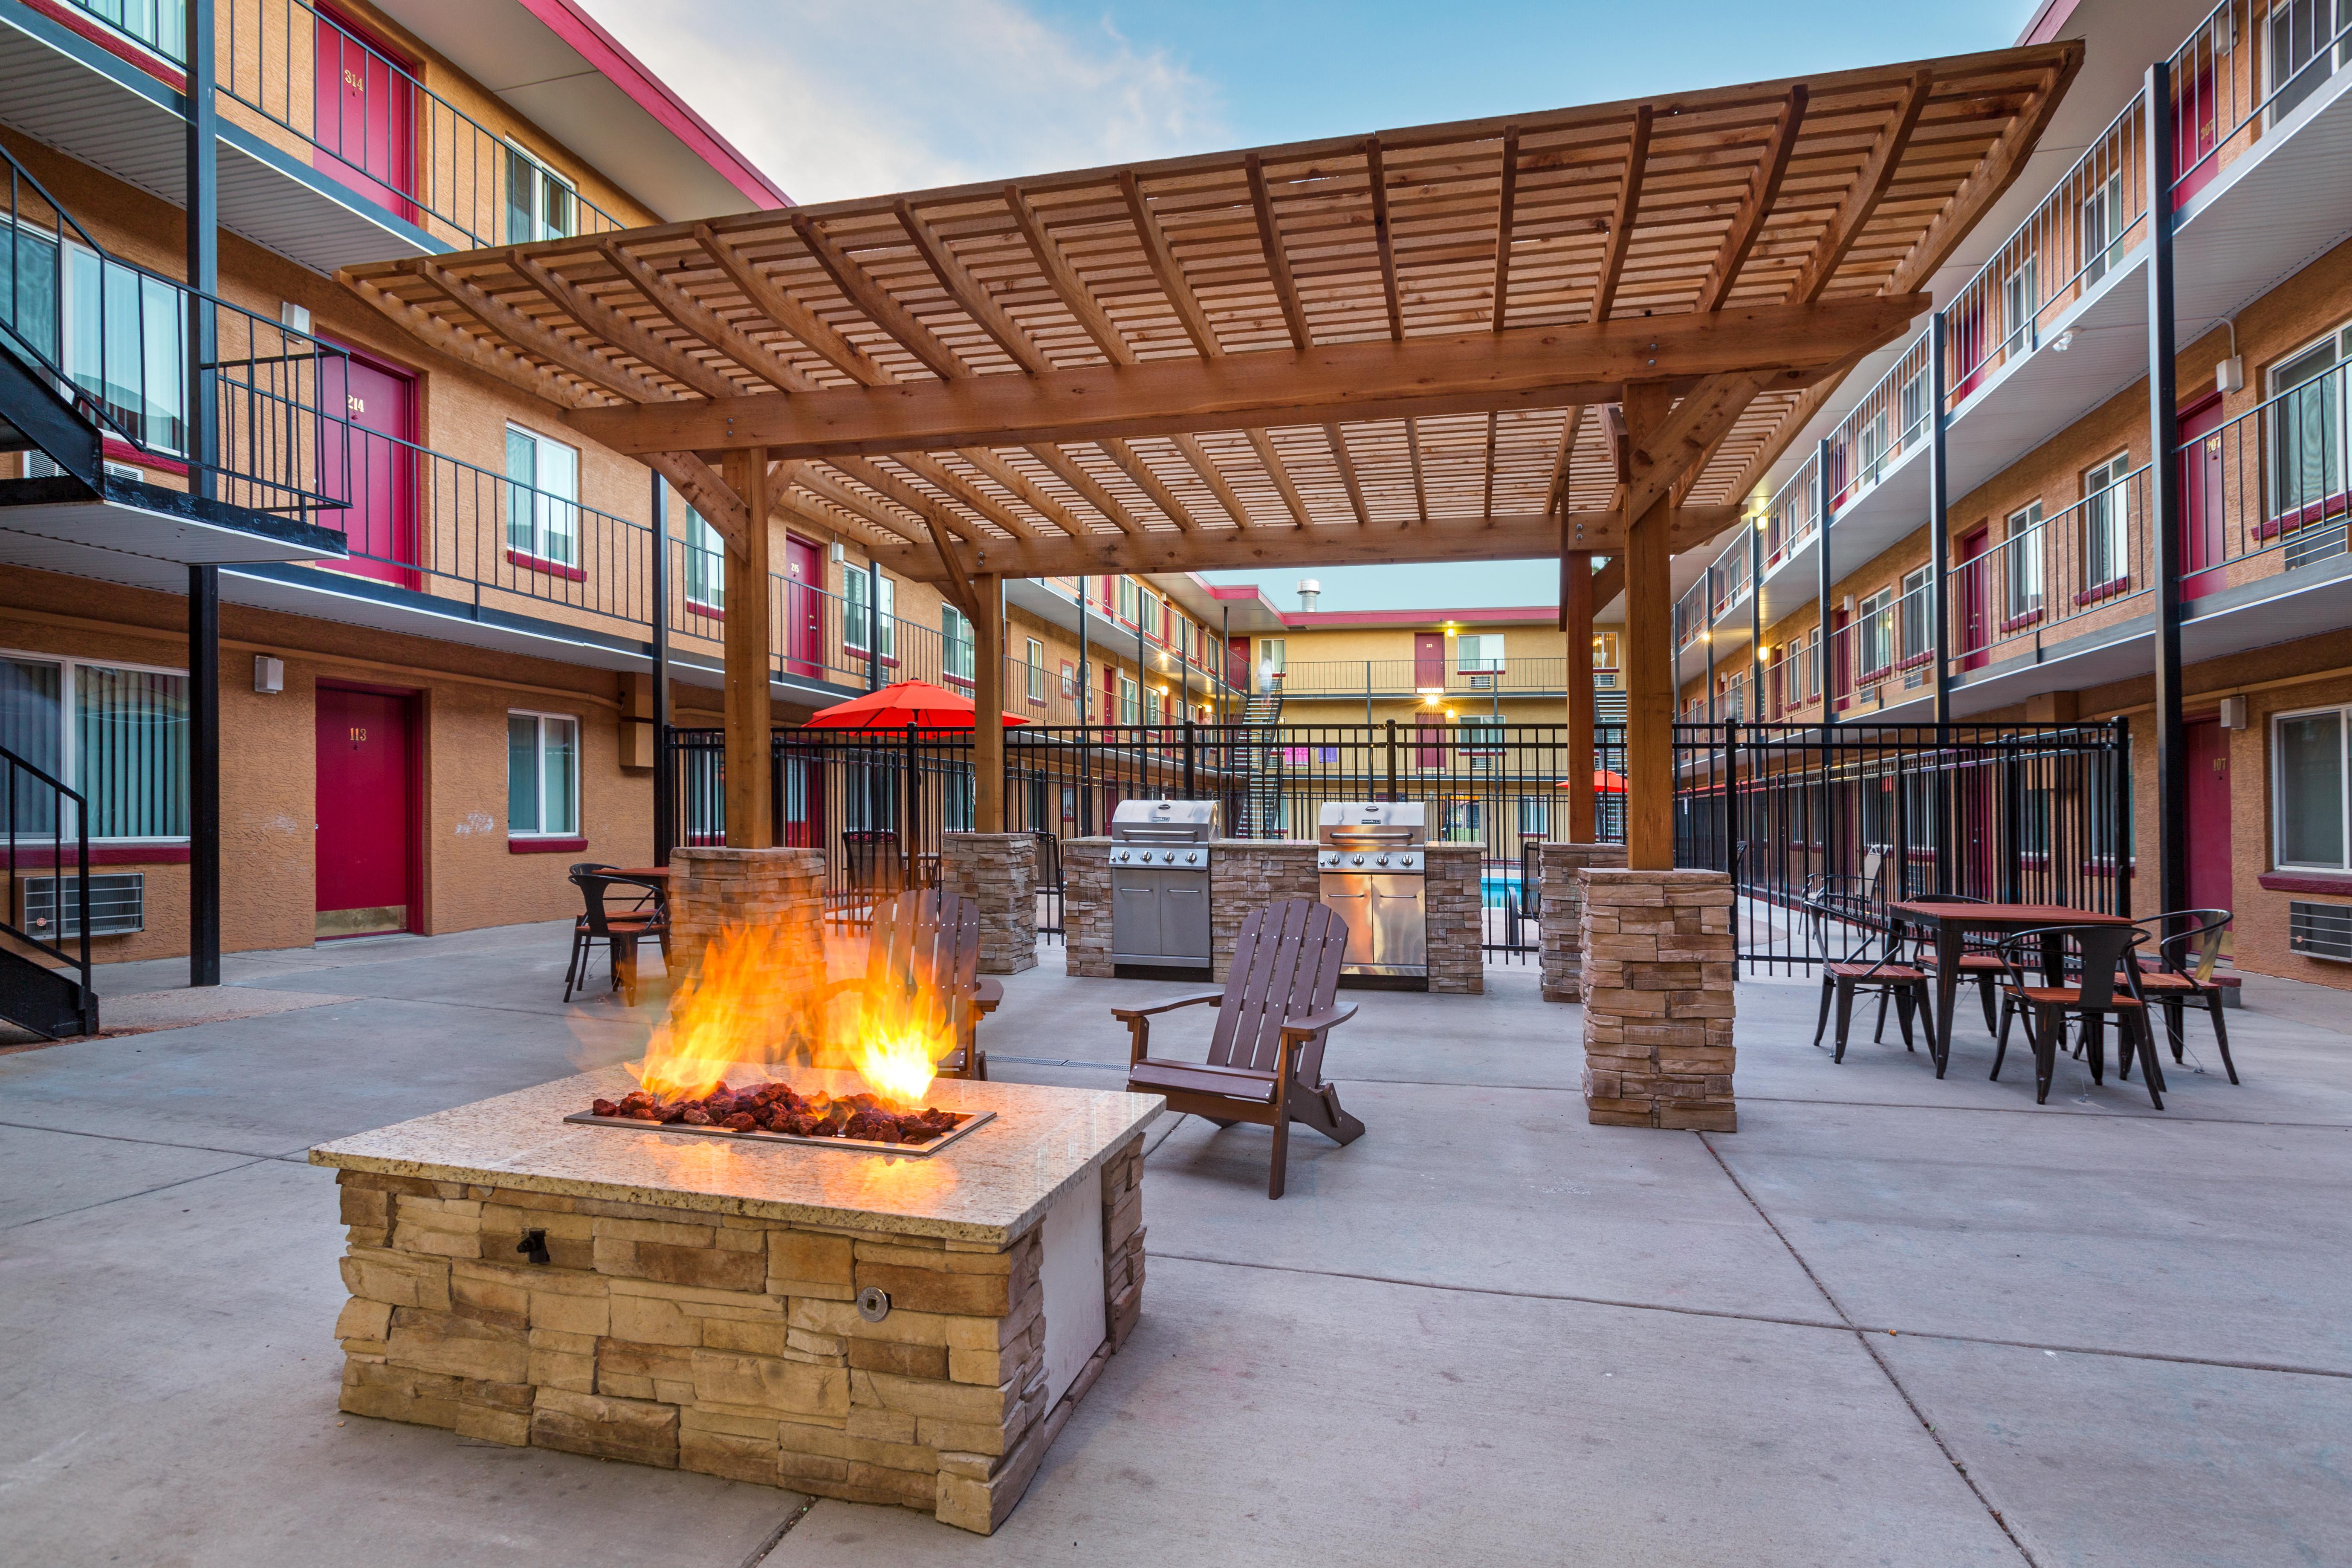
The property is fully gated with passcode entry and has 40 carports rented on a firstcome first-serve basis.
GREAT LOCATION
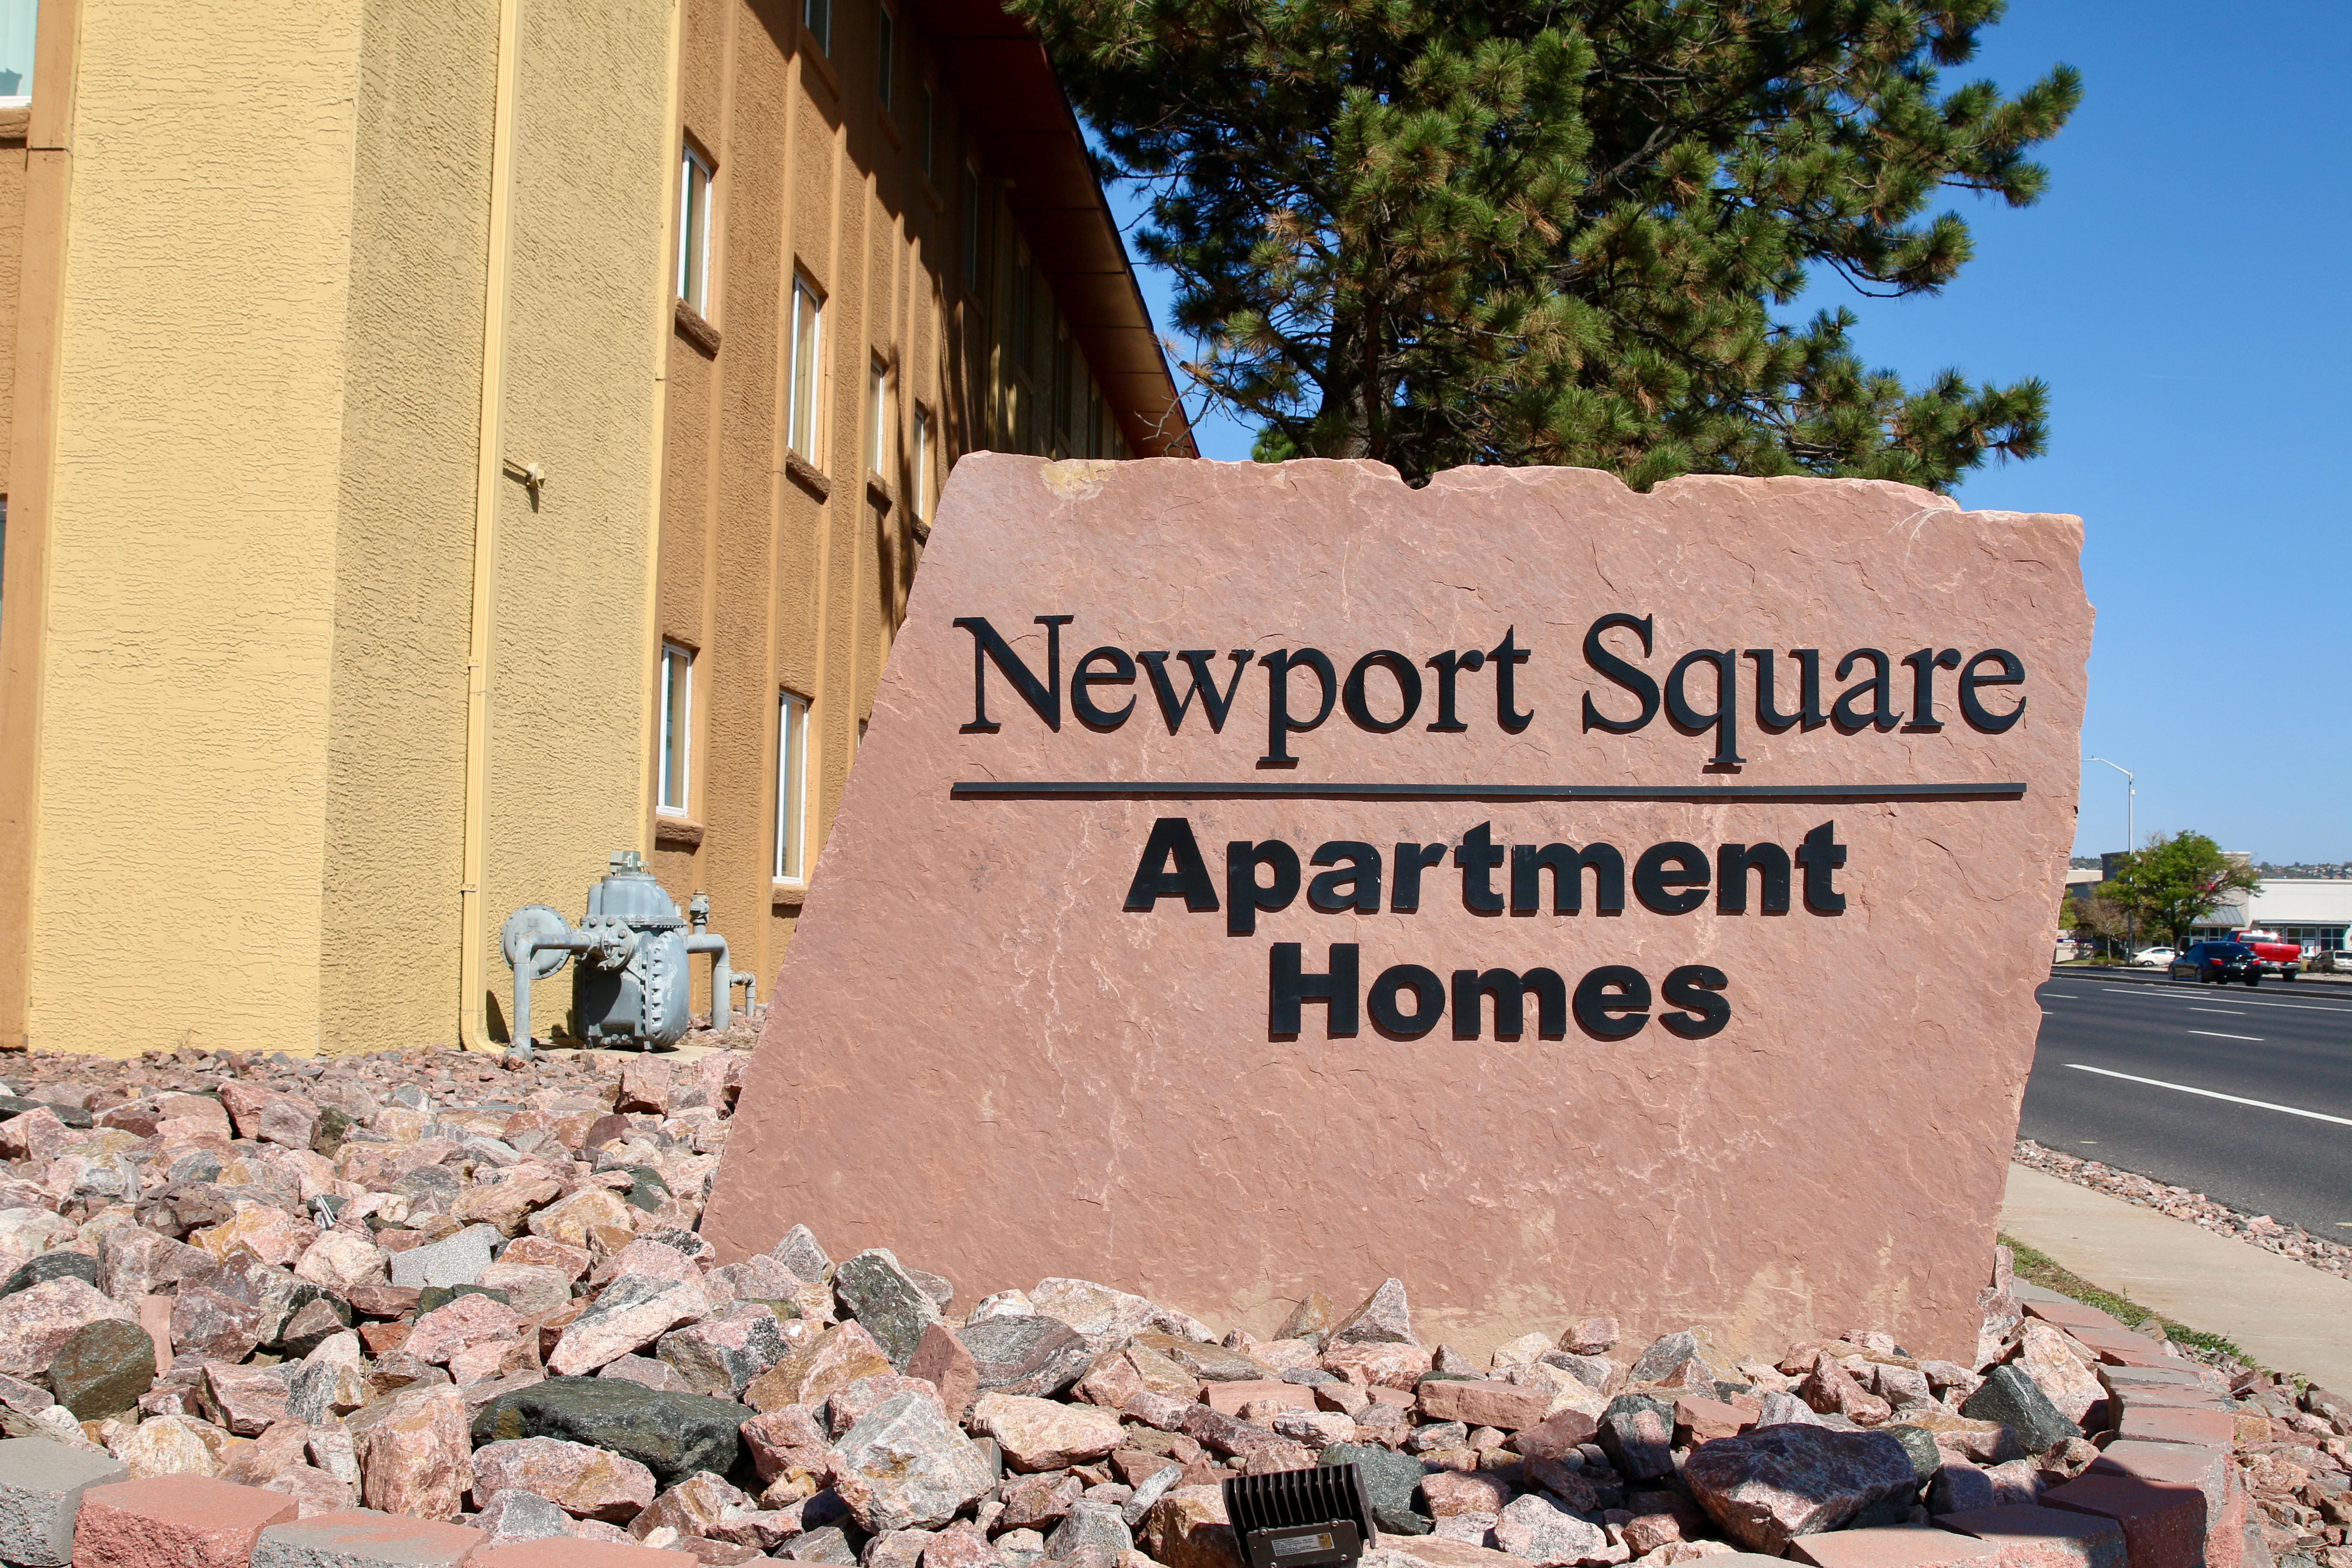
Newport Square has great visibility on Academy Blvd, one of the busiest roads in Colorado Springs.
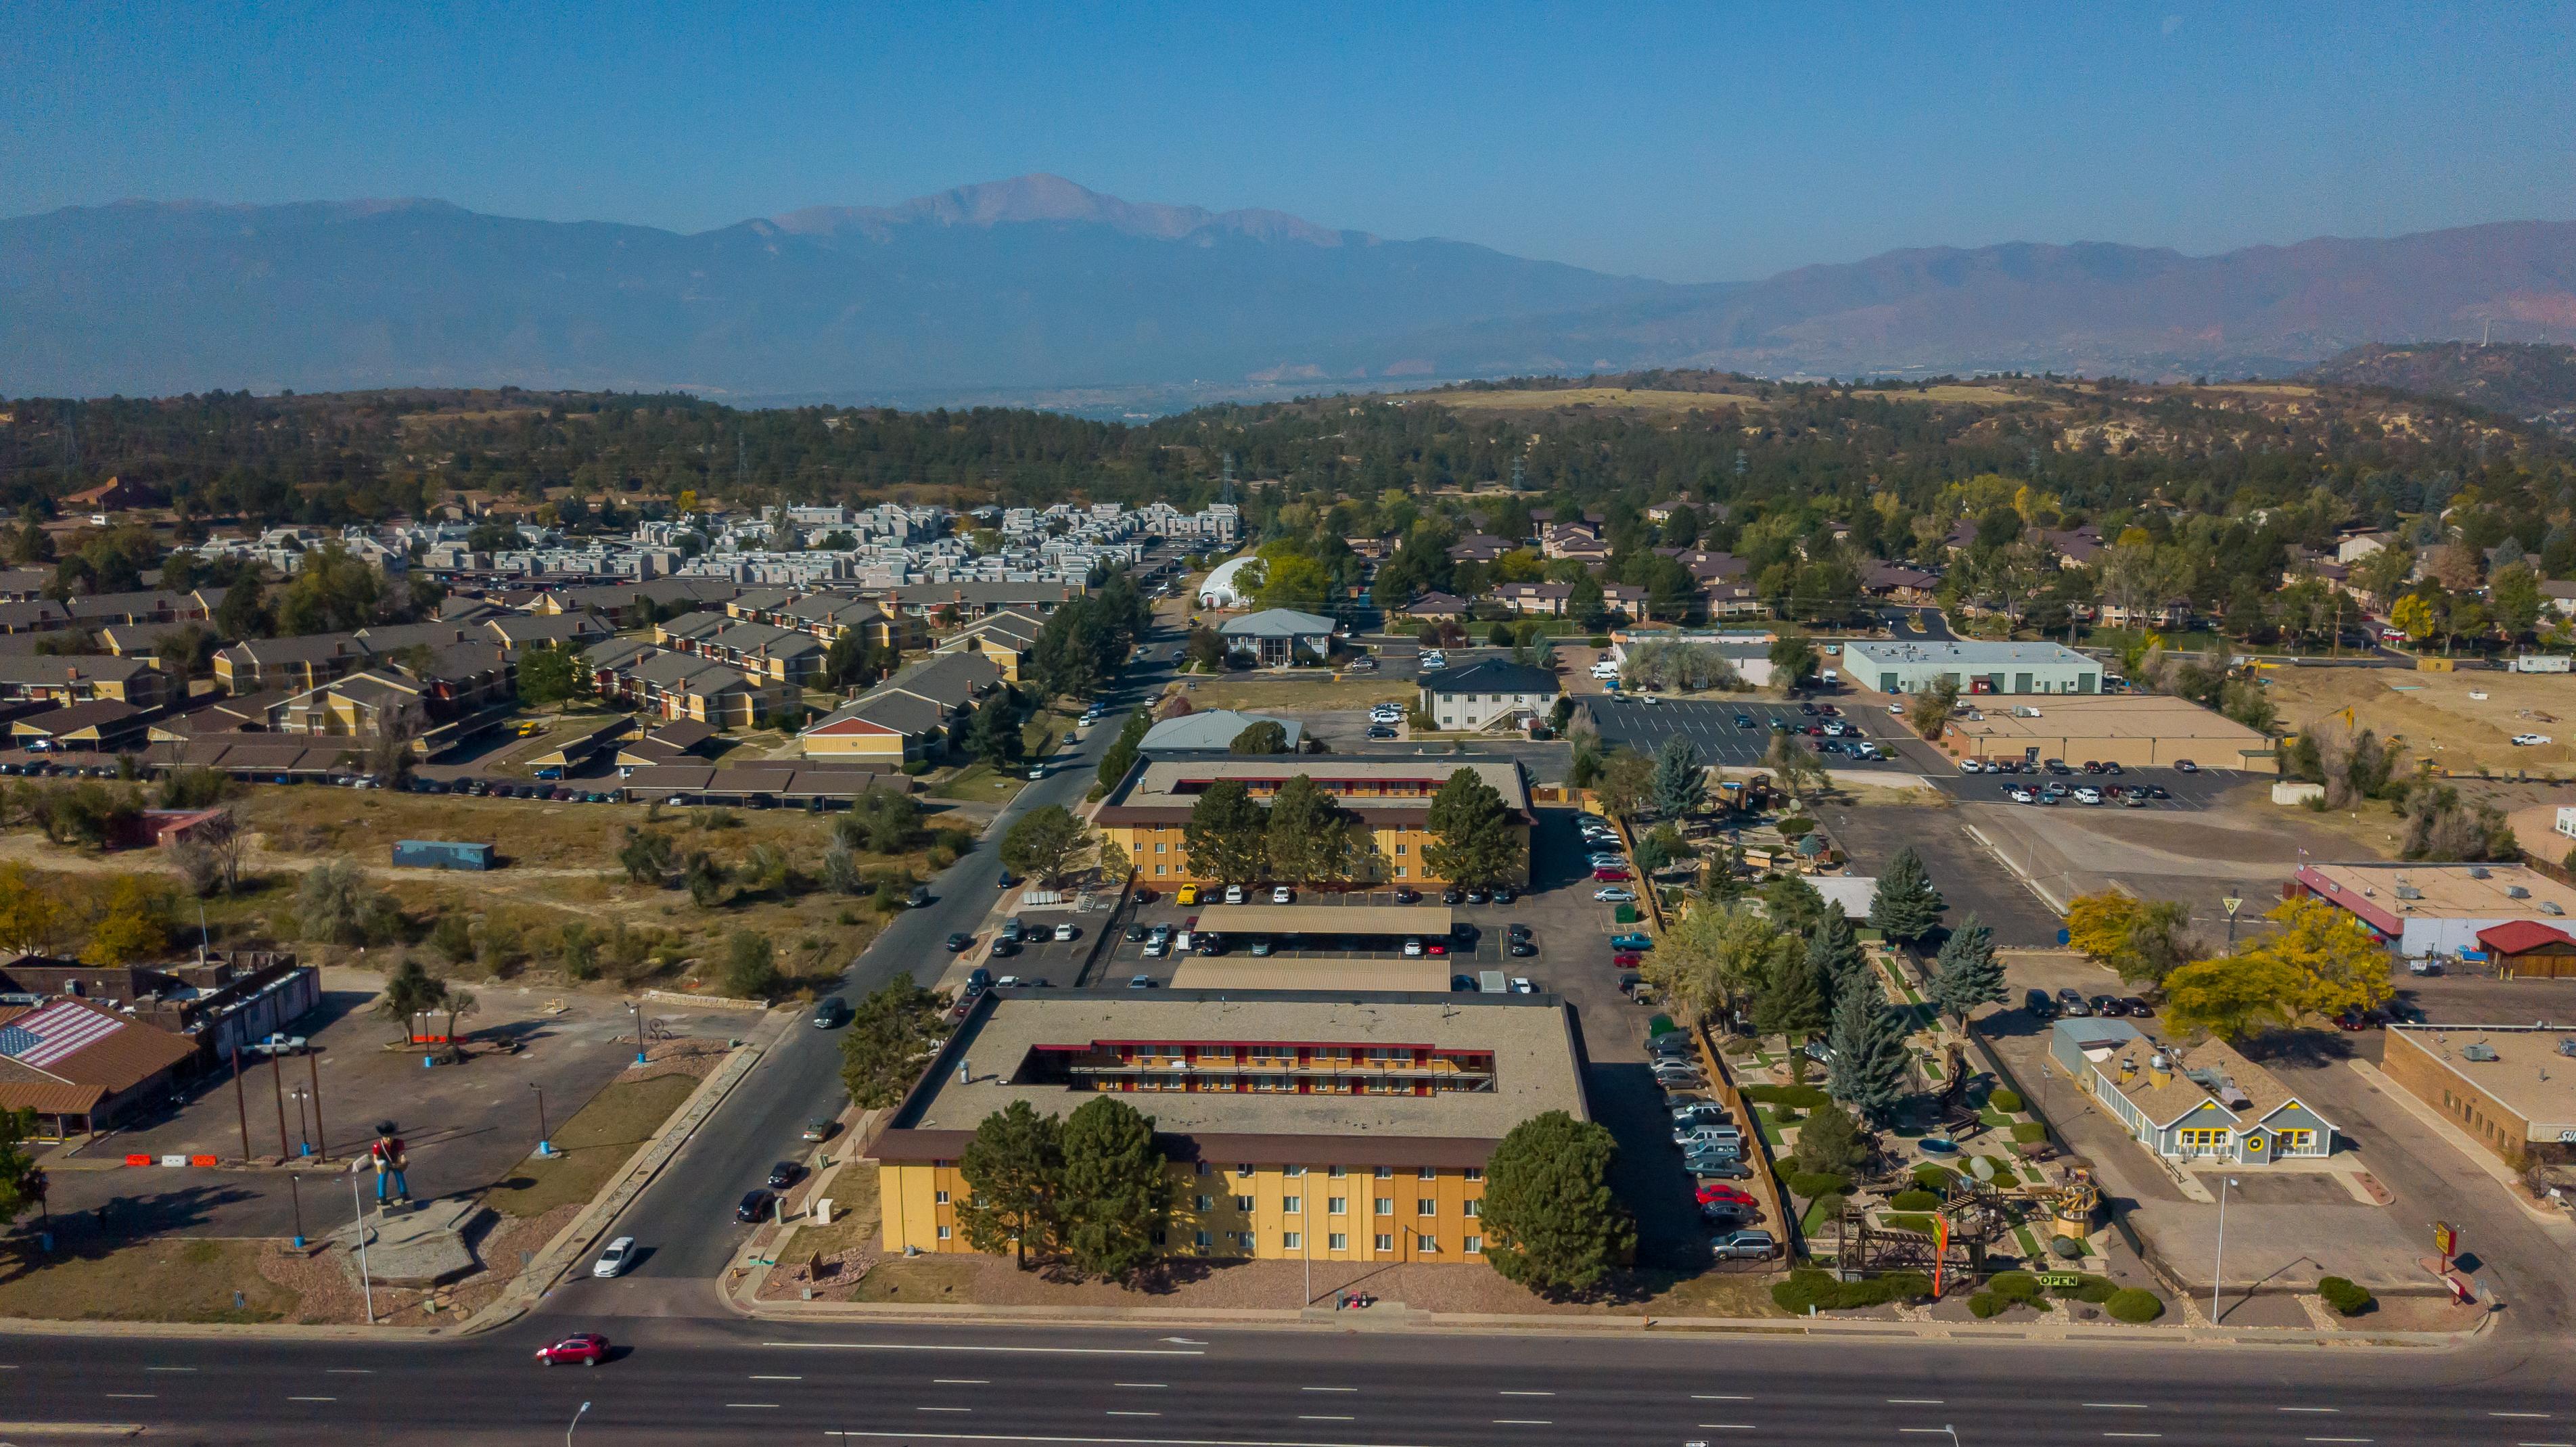
Life Bridge Capital has identified Newport Square for acquisition


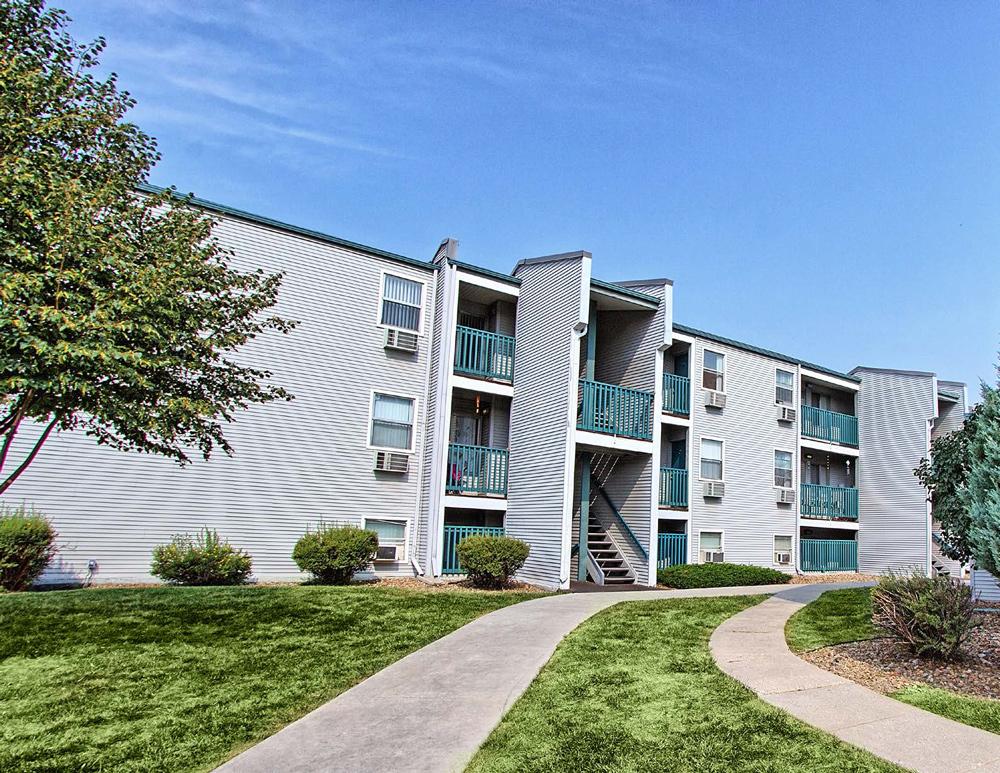
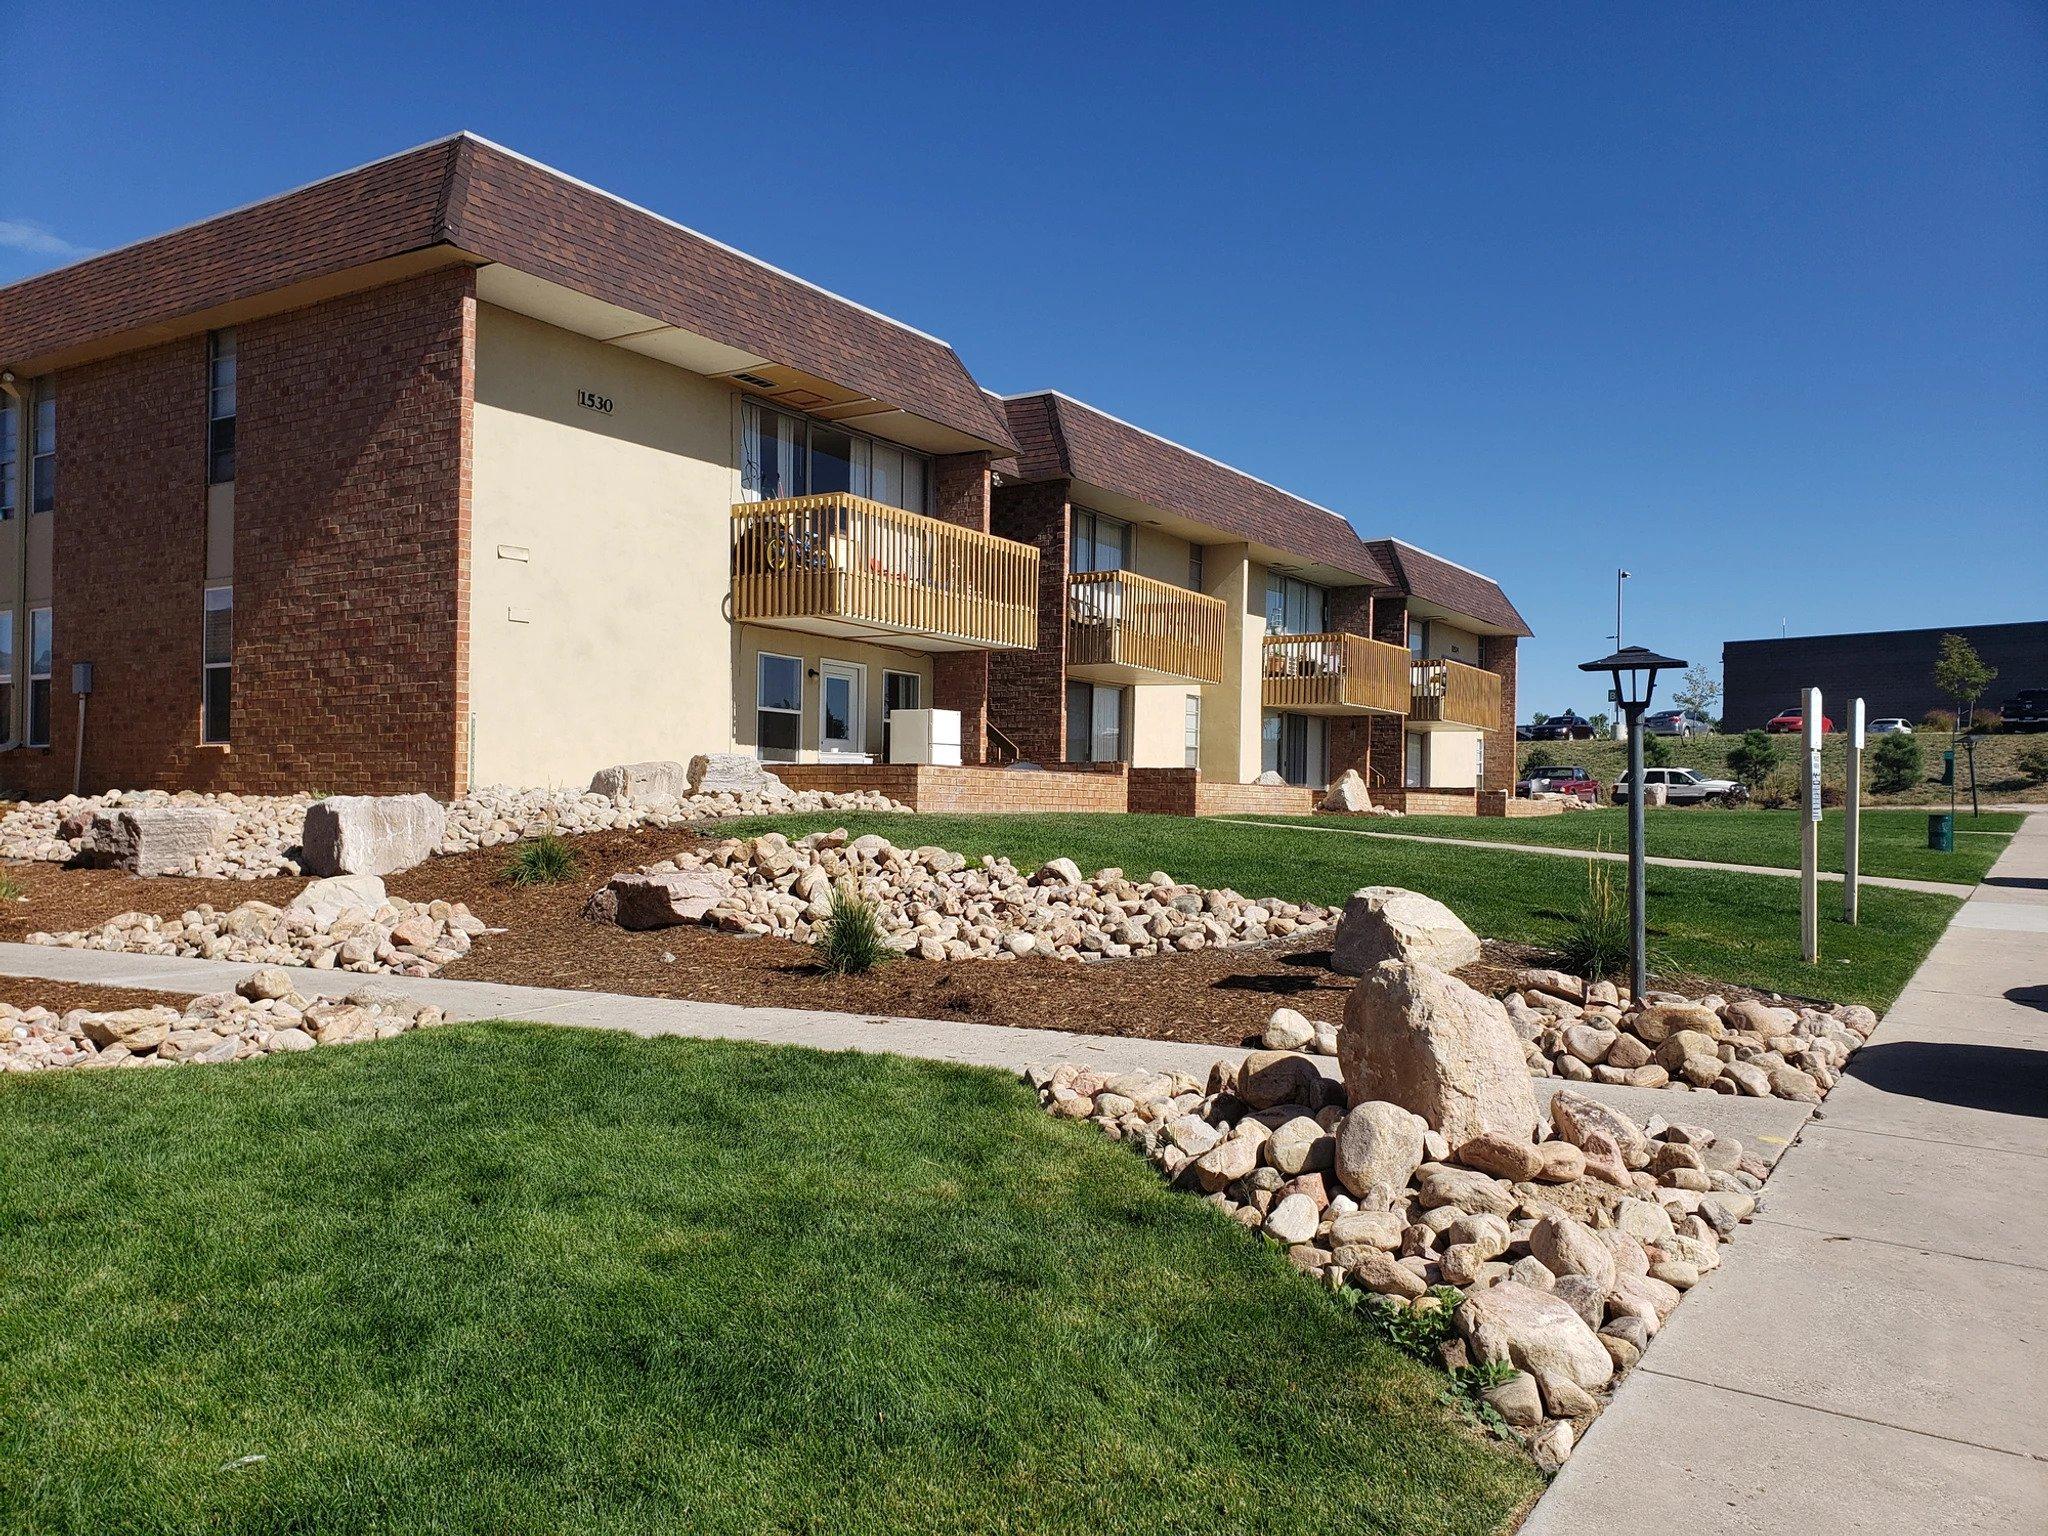
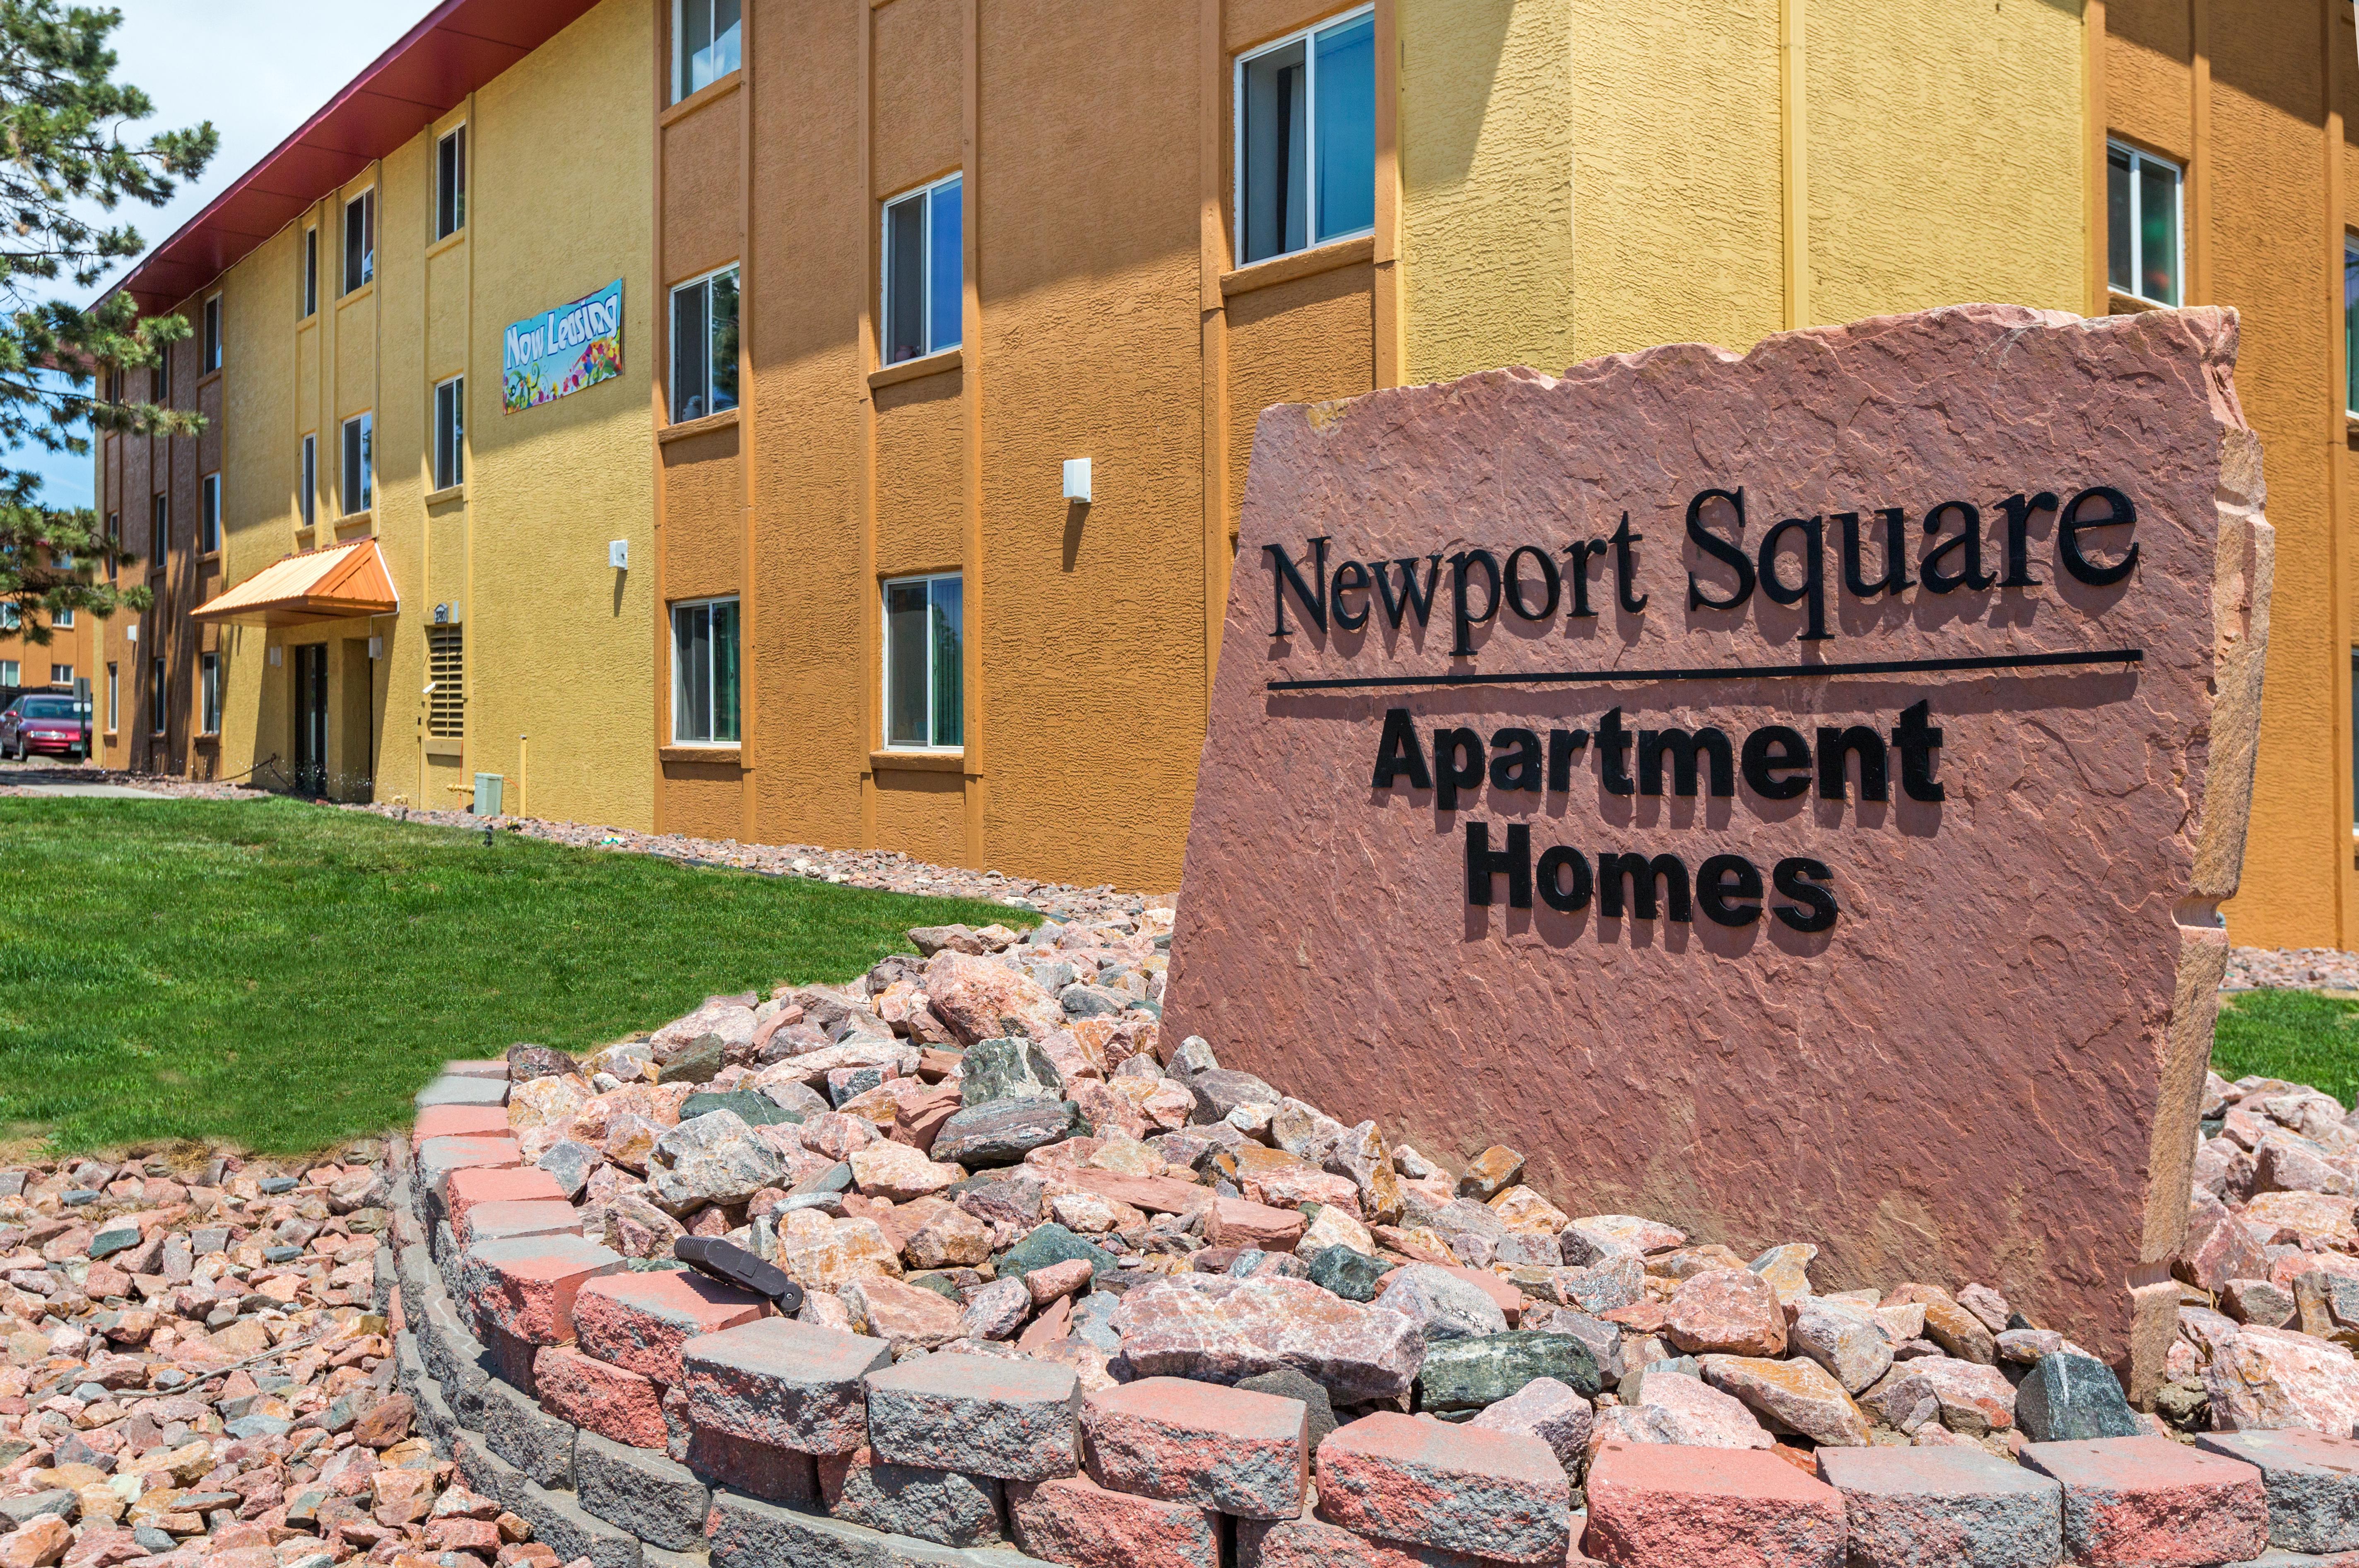
This asset is a 118-unit surface parked apartment community built in 1971. Located in central Colorado Springs, Newport Square is ideally located to attract tenants from a wide variety of employers, including Amazon, the Colorado Springs Airport, various military bases, and a variety of commercial and retail businesses along the Academy Blvd corridor.
Newport Square has a good mix of 1 and 2 bedroom units and offers covered parking, rarity for complexes in the area. By implementing a thorough unit interior renovation plan, Life Bridge plans to create a vibrant community that will attract tenants while delivering excellent returns to our equity partners.
OFFERING SUMARYOFFERING SUMARY CAP (T12) 5.34% REVERSION CAP 5.85% EXPENSE RATIO (T12) 34% OCCUPANCY (AS OF 10/1/20) 99.2% DSCR 1.30 PURCHASE PRICE $14,500,000 HOLD TIME 5 YEARS EQUITY REQUIRED (TOTAL) $5,500,000 CLASS A IRR & AVG ANNUAL RETURN 10% CLASS B. INVESTORY EQUITY MULTIPLE 2.02 CLASS B INVESTOR AVERAGE ANNUAL RETURN* 8.59% CLASS B INVESTOR AVERAGE ANNUAL RETURN** 20.36% CLASS B INTERNAL RATE OF RETURN (IRR) 17.01% *Excluding proceeds from sale **Including proceeds from sale Investment Summary
Partner (B) - Class B: Class B investors sit behind Class A investors in the capital stack, per the diagram. Class B has a preferred return of 8% which will accrue over the life of the deal. Cashflow from operations remaining after paying out Class A will be distributed to Class B investors monthly. The minimum investment in Class B is $50k. This tier is for investors who want to maximize their returns over the life of the investment. Class B investors will participate in the upside upon disposition or capital events.


Limited
INVESTOR DISTRIBUTION OF CASH FLOW 10% Preferred to Investor MEMBERSHIP OWNERSHIP 10% Preferred to Investor Two-Tiered Equity Structure CLASS B PARTNERSHIP STRUCTURE INVESTOR DISTRIBUTION OF CASH FLOW 8.0% Preferred to Investor 70/30 Split Thereafter MEMBERSHIP OWNERSHIP 70% to 17.01% IRR 50/50 Split Thereafter GENERAL PARTNER DEBT LIMITED PARTNER (B) LIMITED PARTNER (A) 30% Owner 70% Owner$5,500,000 $10,875,000


Sample Returns INVESTOR RETURNS BASED ON $100,00 INVESTMENT – CLASS A INVESTMENT YEAR 1 YEAR 2 YEAR 3 YEAR 4 YEAR 5 INVESTOR ANNUAL PERCENT RETURN 10% 10% 10% 10% 10% INVESTOR RETURN ON INVESTMENT ($100,000) $10,000 $10,000 $10,000 $10,000 $10,000 RETURN FROM DISPOSITION – LIMITED PARTNER - - - - 100,000 TOTAL RETURN – LIMITED PARTNER ($100,000) $10,000 $20,000 $30,000 $40,000 $150,000 INVESTOR RETURNS BASED ON $100,00 INVESTMENT – CLASS B INVESTMENT YEAR 1 YEAR 2 YEAR 3 YEAR 4 YEAR 5 INVESTOR ANNUAL PERCENT RETURN 8.0% 10.4% 8.0% 8.0% 8.5% INVESTOR RETURN ON INVESTMENT ($100,000) $8,000 $10,380 $8,000 $8,000 $8,540 RETURN FROM DISPOSITION – LIMITED PARTNER - - - - $158,884 TOTAL RETURN – LIMITED PARTNER ($100,000) $8,000 $18,380 $26,380 $34,380 $201,804 RETURN SUMMARY IRR EQUITY MULTIPLE AVG COC* ANNUALIZED** LIMITED PARTNER (CLASS A) 10.0% 1.70x 10.0% 10.0% LIMITED PARTNER (CLASS B) 17.0% FIX 2.02x 8.6% 20.4% *Excluding proceeds from sale **Including proceeds from sale


Investment Highlights Buildings 2 Units 118 Parking Stalls 184 Build Date 1973 Acres 2.71


Property Profile Property Specifications Amenities Business Plan Floor Plans


Property Specifications PROPERTY DETAILS YEAR BUILT 1973 ACRES 2.7 BUILDING STYLE 3 Story Walk Up ROOF EPDM NUMBER OF BUILDINGS 2 ROOF AGE Installed 2017 NUMBER OF STORIES 3 CONSTRUCTION TYPE Stucco and Brick UNIT MIX (AS OF OCTOBER 2020) BED/BATH AVG SF # UNITS OCCUPIED RENT/UNIT RENT/SF PROJECTED RENT PRO. RENT /SF 1BR/1BA S 540 49 97% $785 $1.45 $950 $1.76 1BR/1BA L 550 8 97% $795 $1.45 $995 $1.81 1BR/1BA SWD 550 11 97% $850 $1.55 $995 $1.81 2BR/1BA S 790 26 96% $885 $1.12 $1,050 $1.33 2BR/1BA L 810 24 96% $895 $1.10 $1,095 $1.35 TOTAL 447 118 97% $836 $1.31 $1,009 $1.53 PARKING PARKING 184 COVERED PARKING 40 HANDICAP ACCESSIBLE PARKING 3 SPACES PER UNIT 1.5
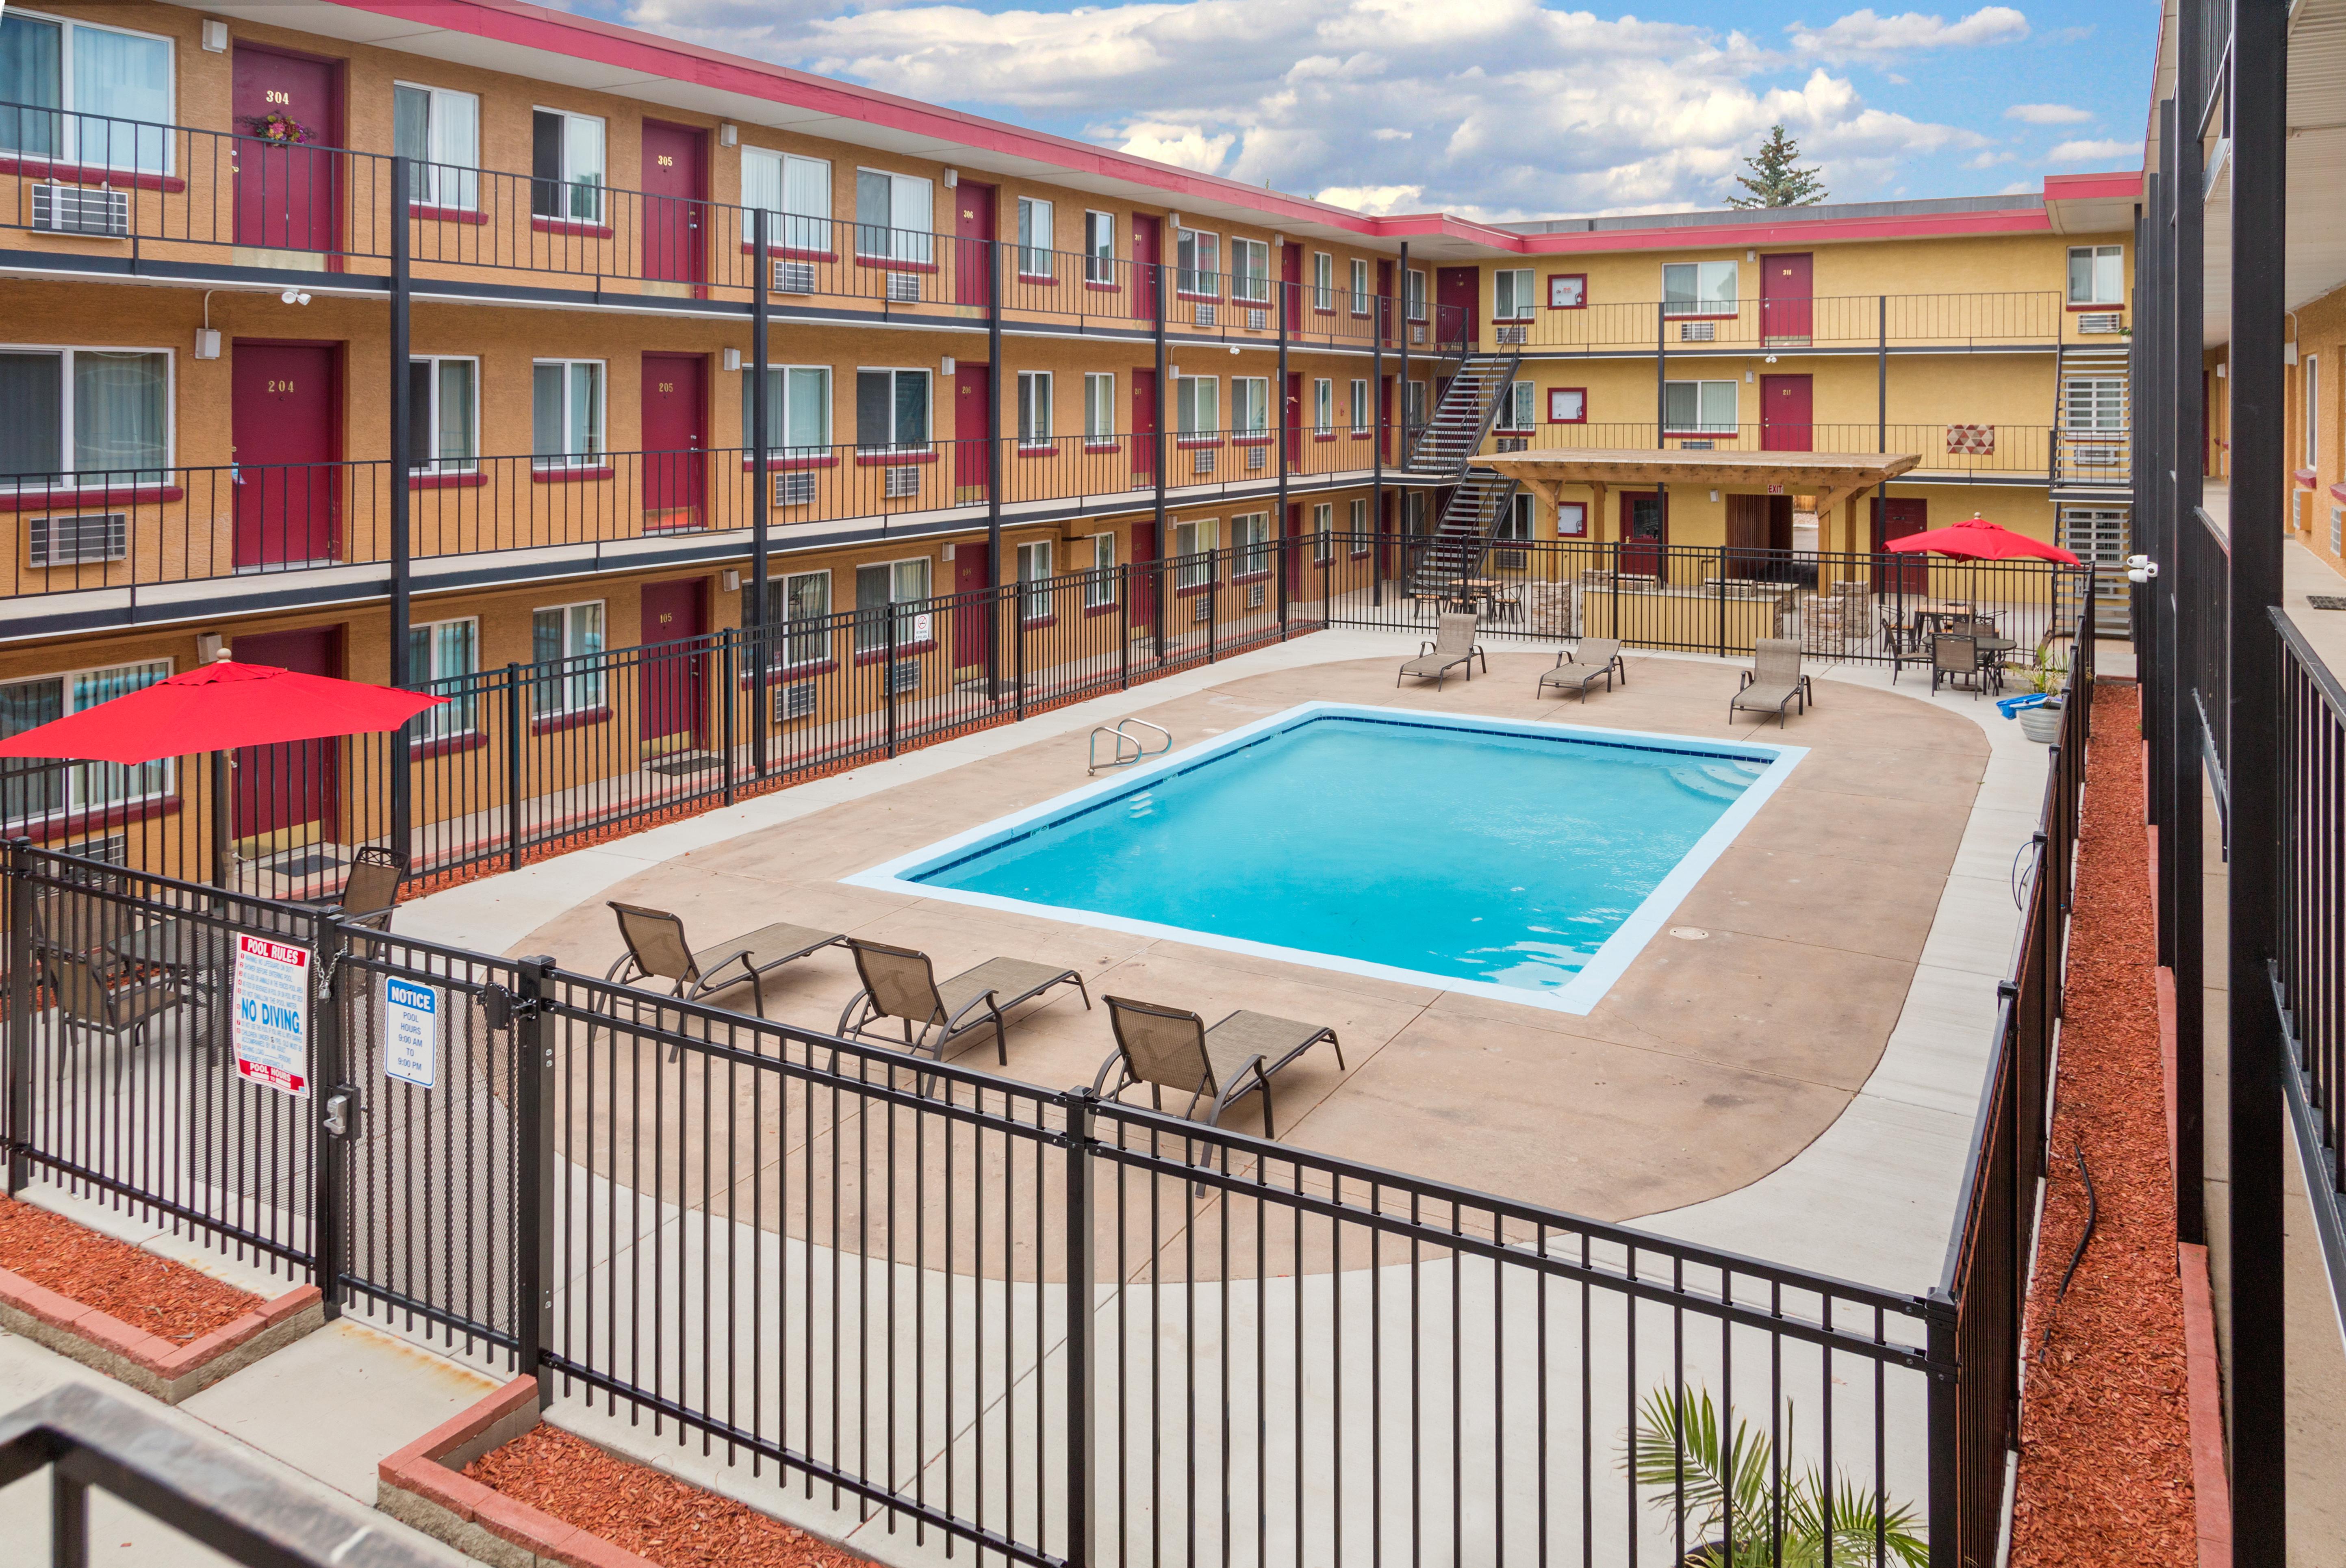


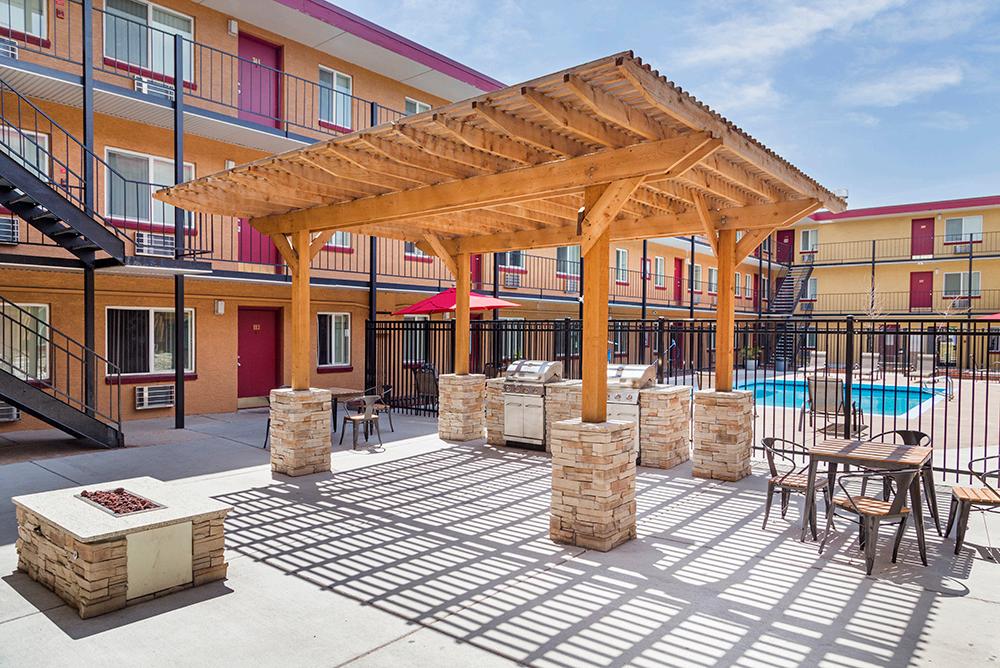
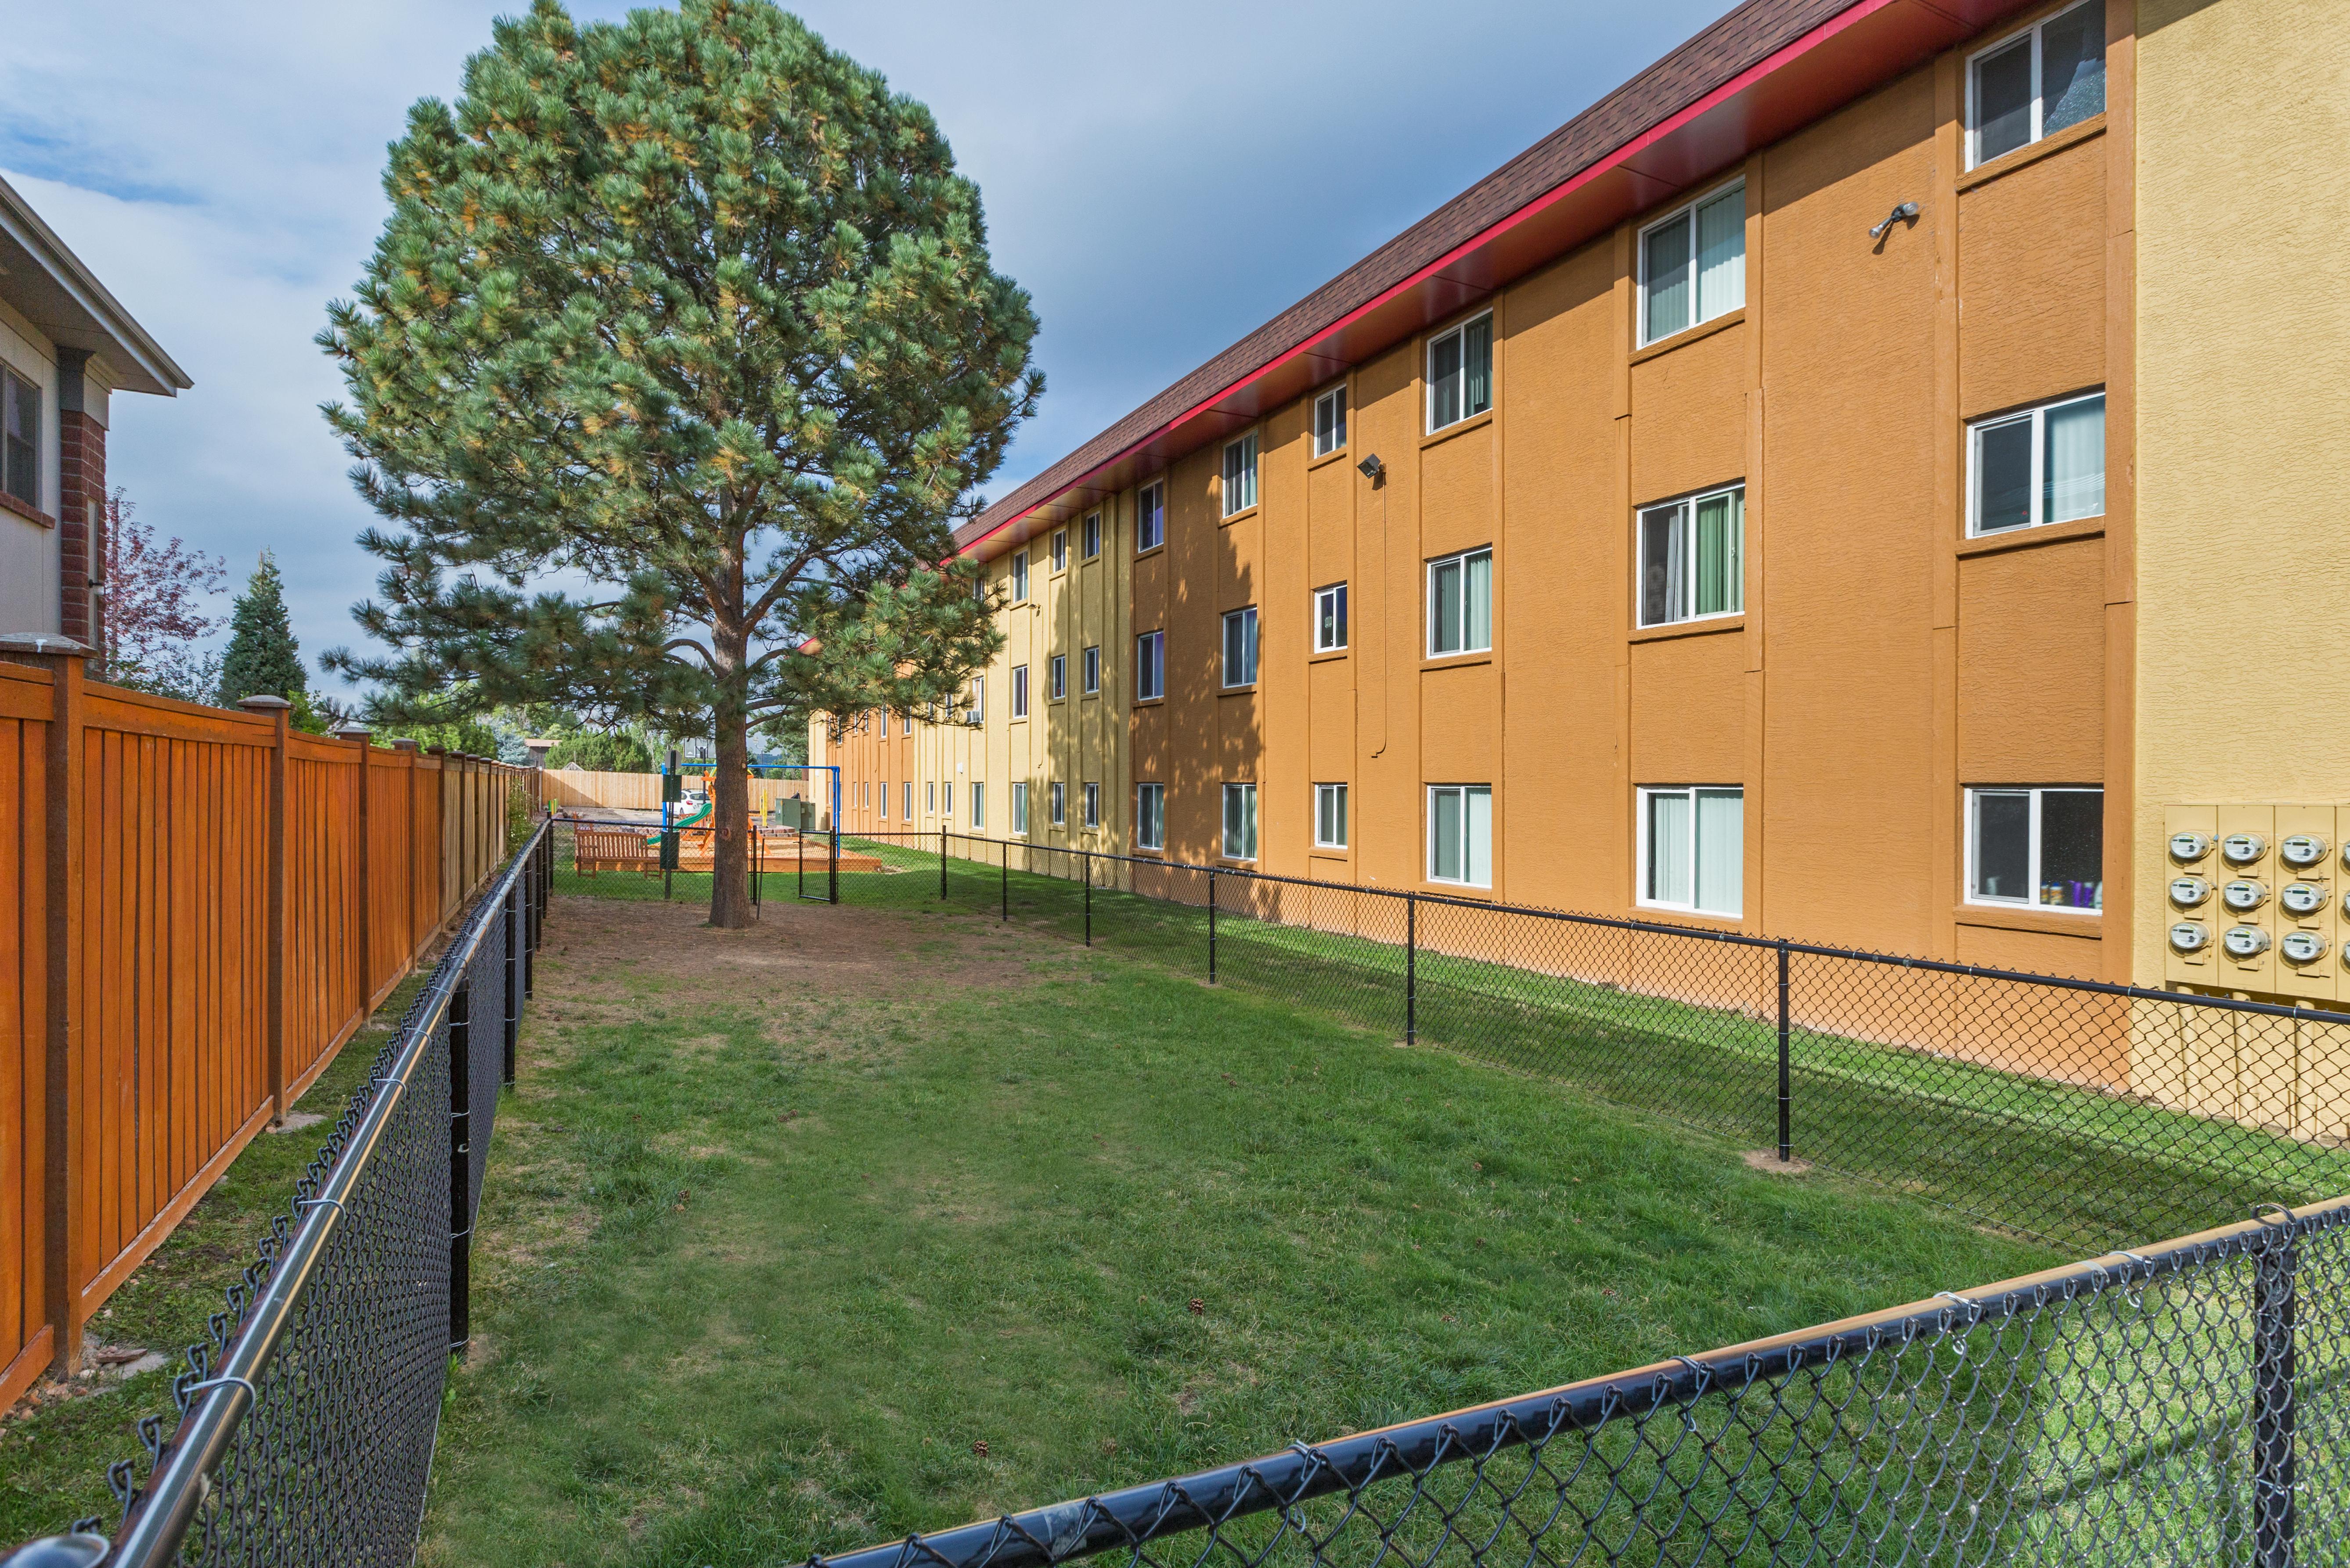
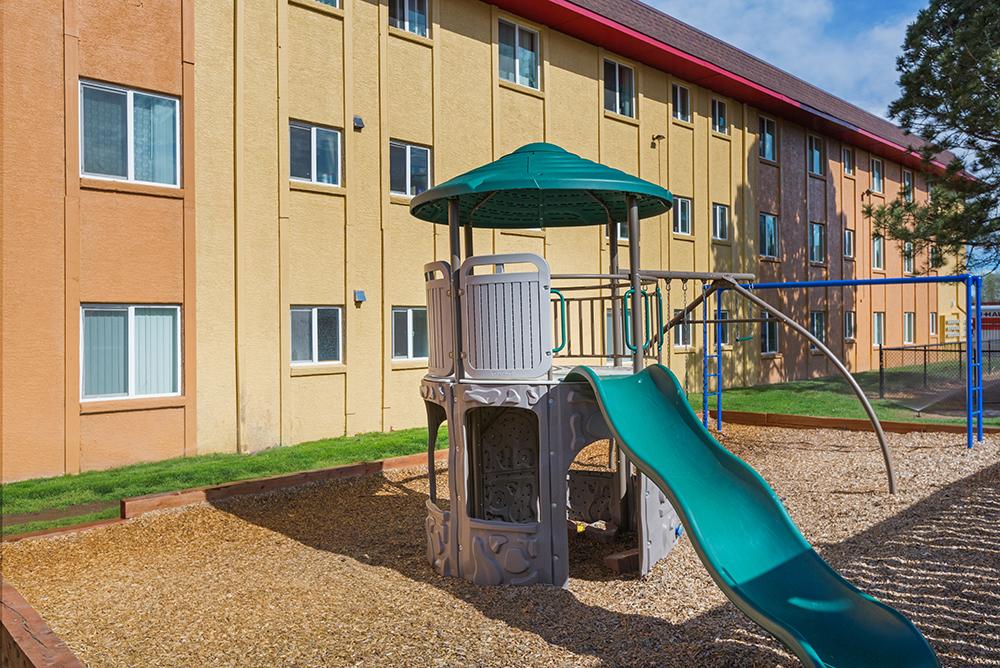
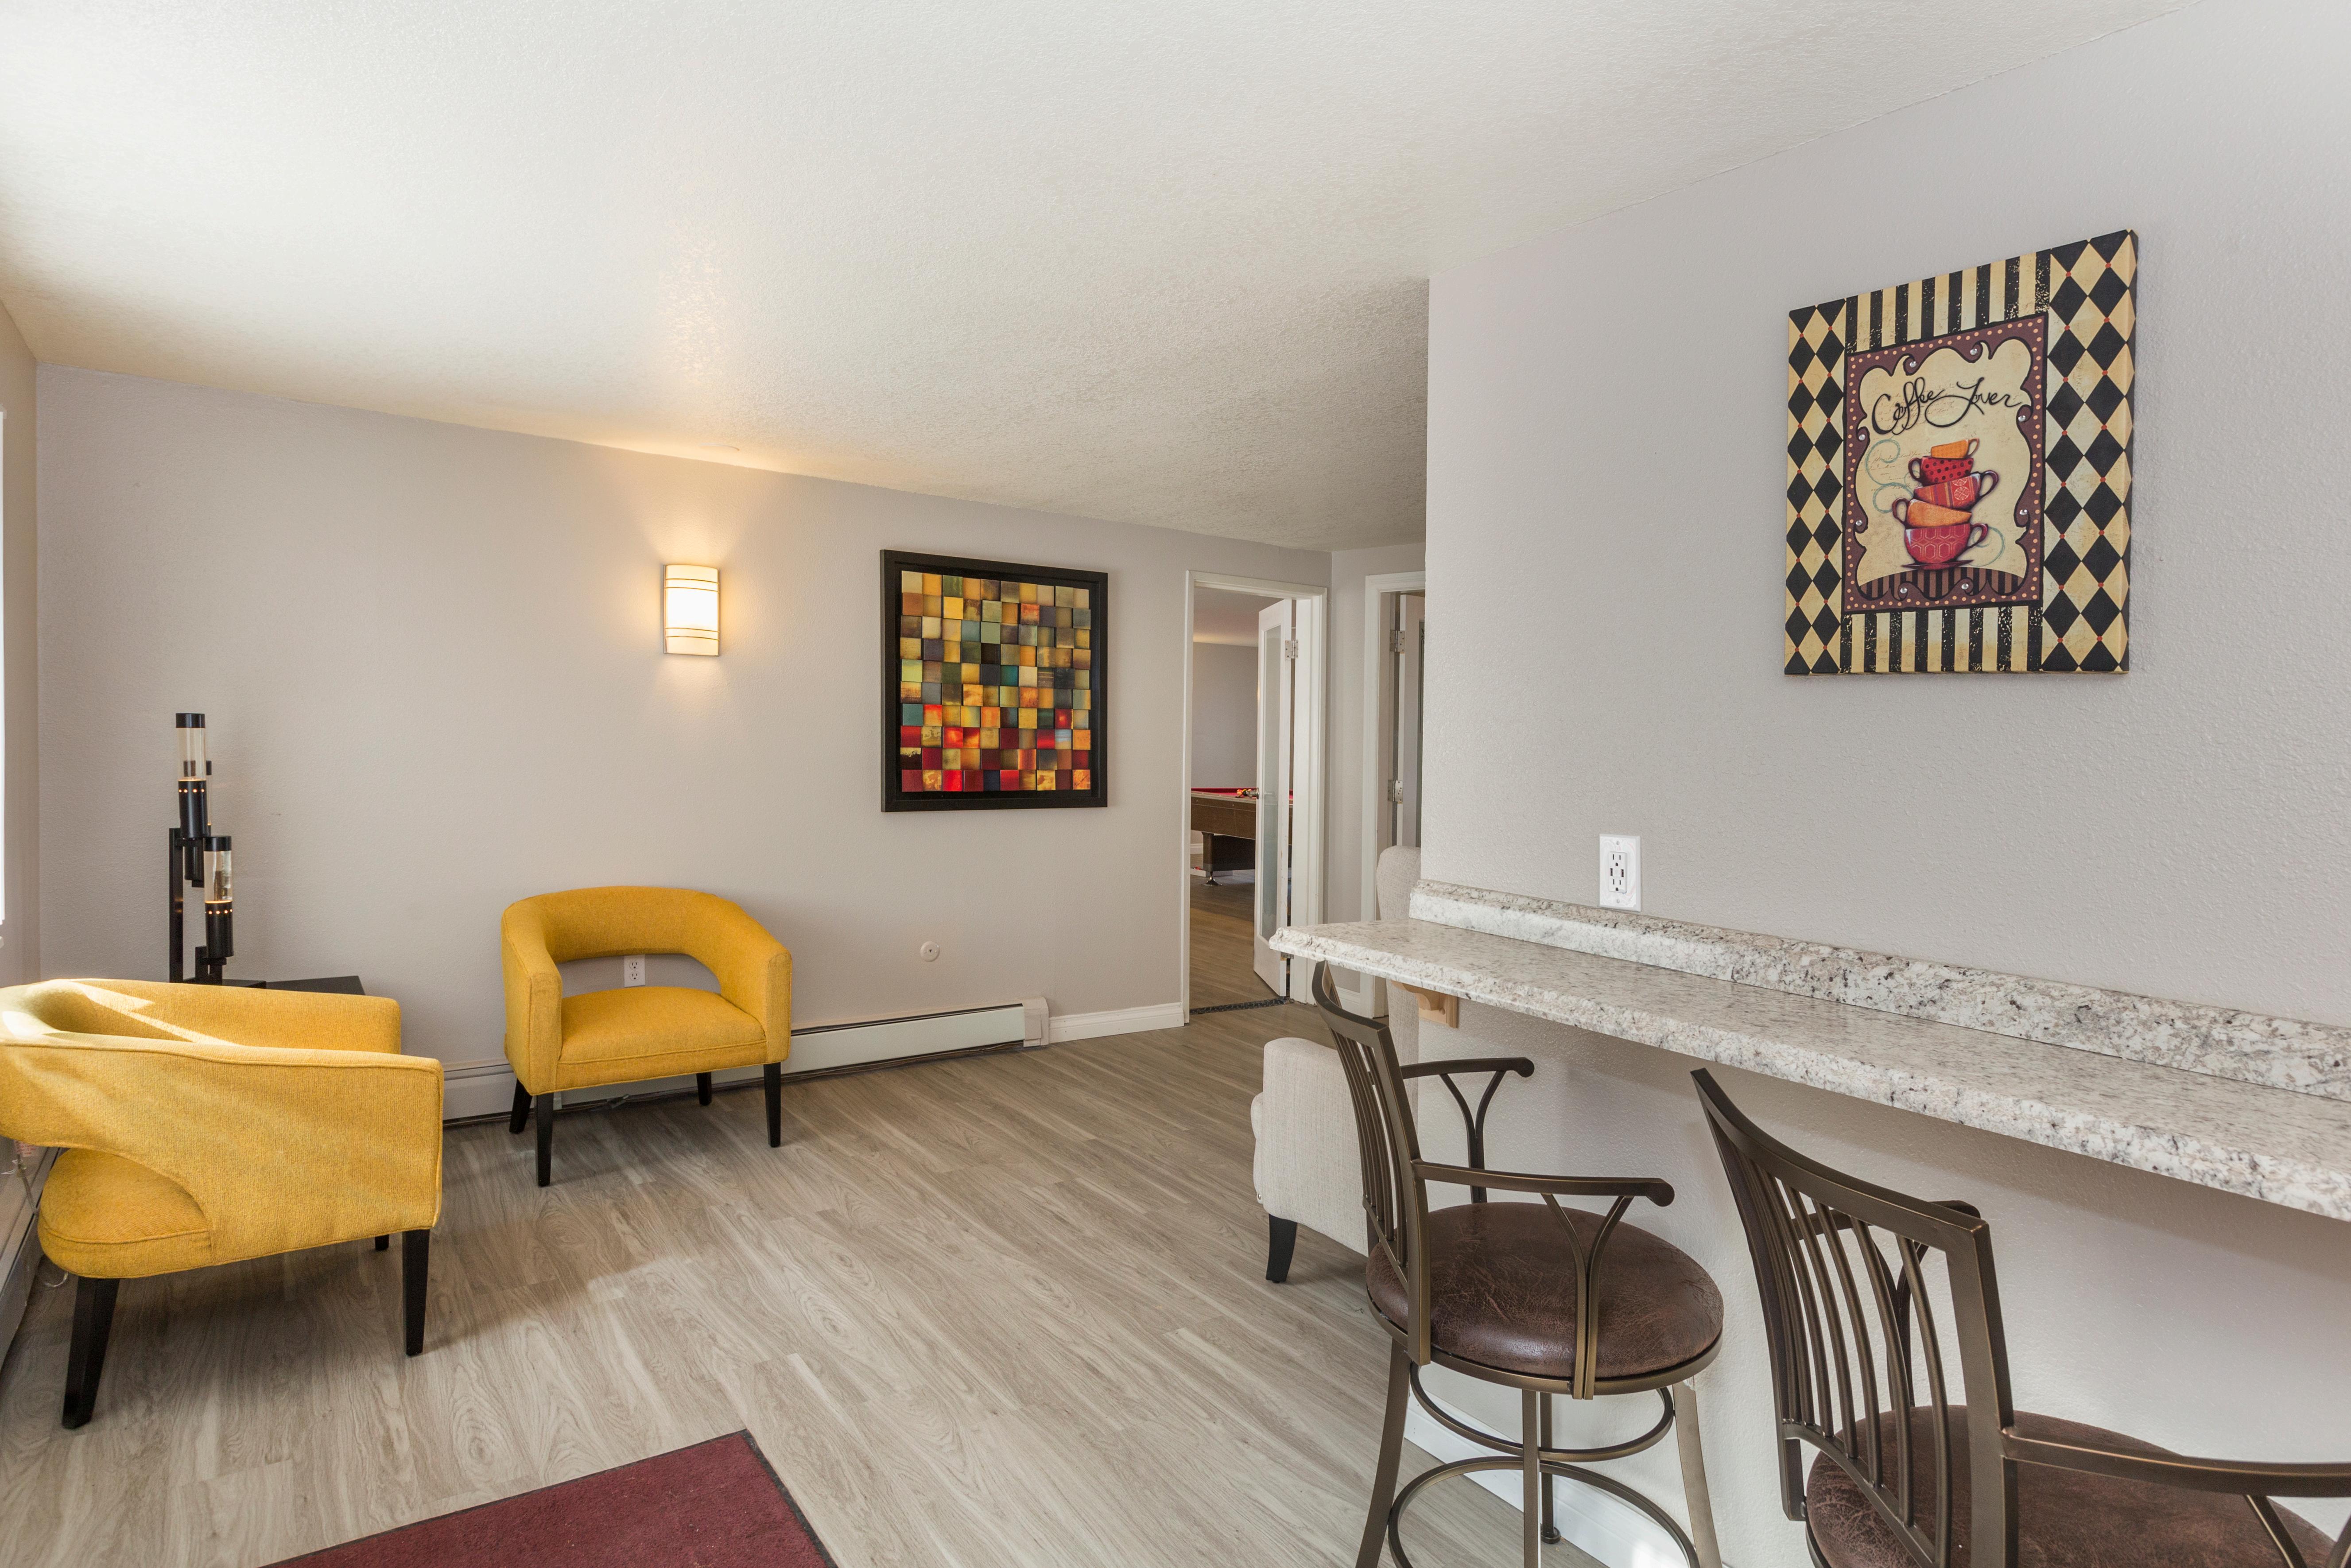
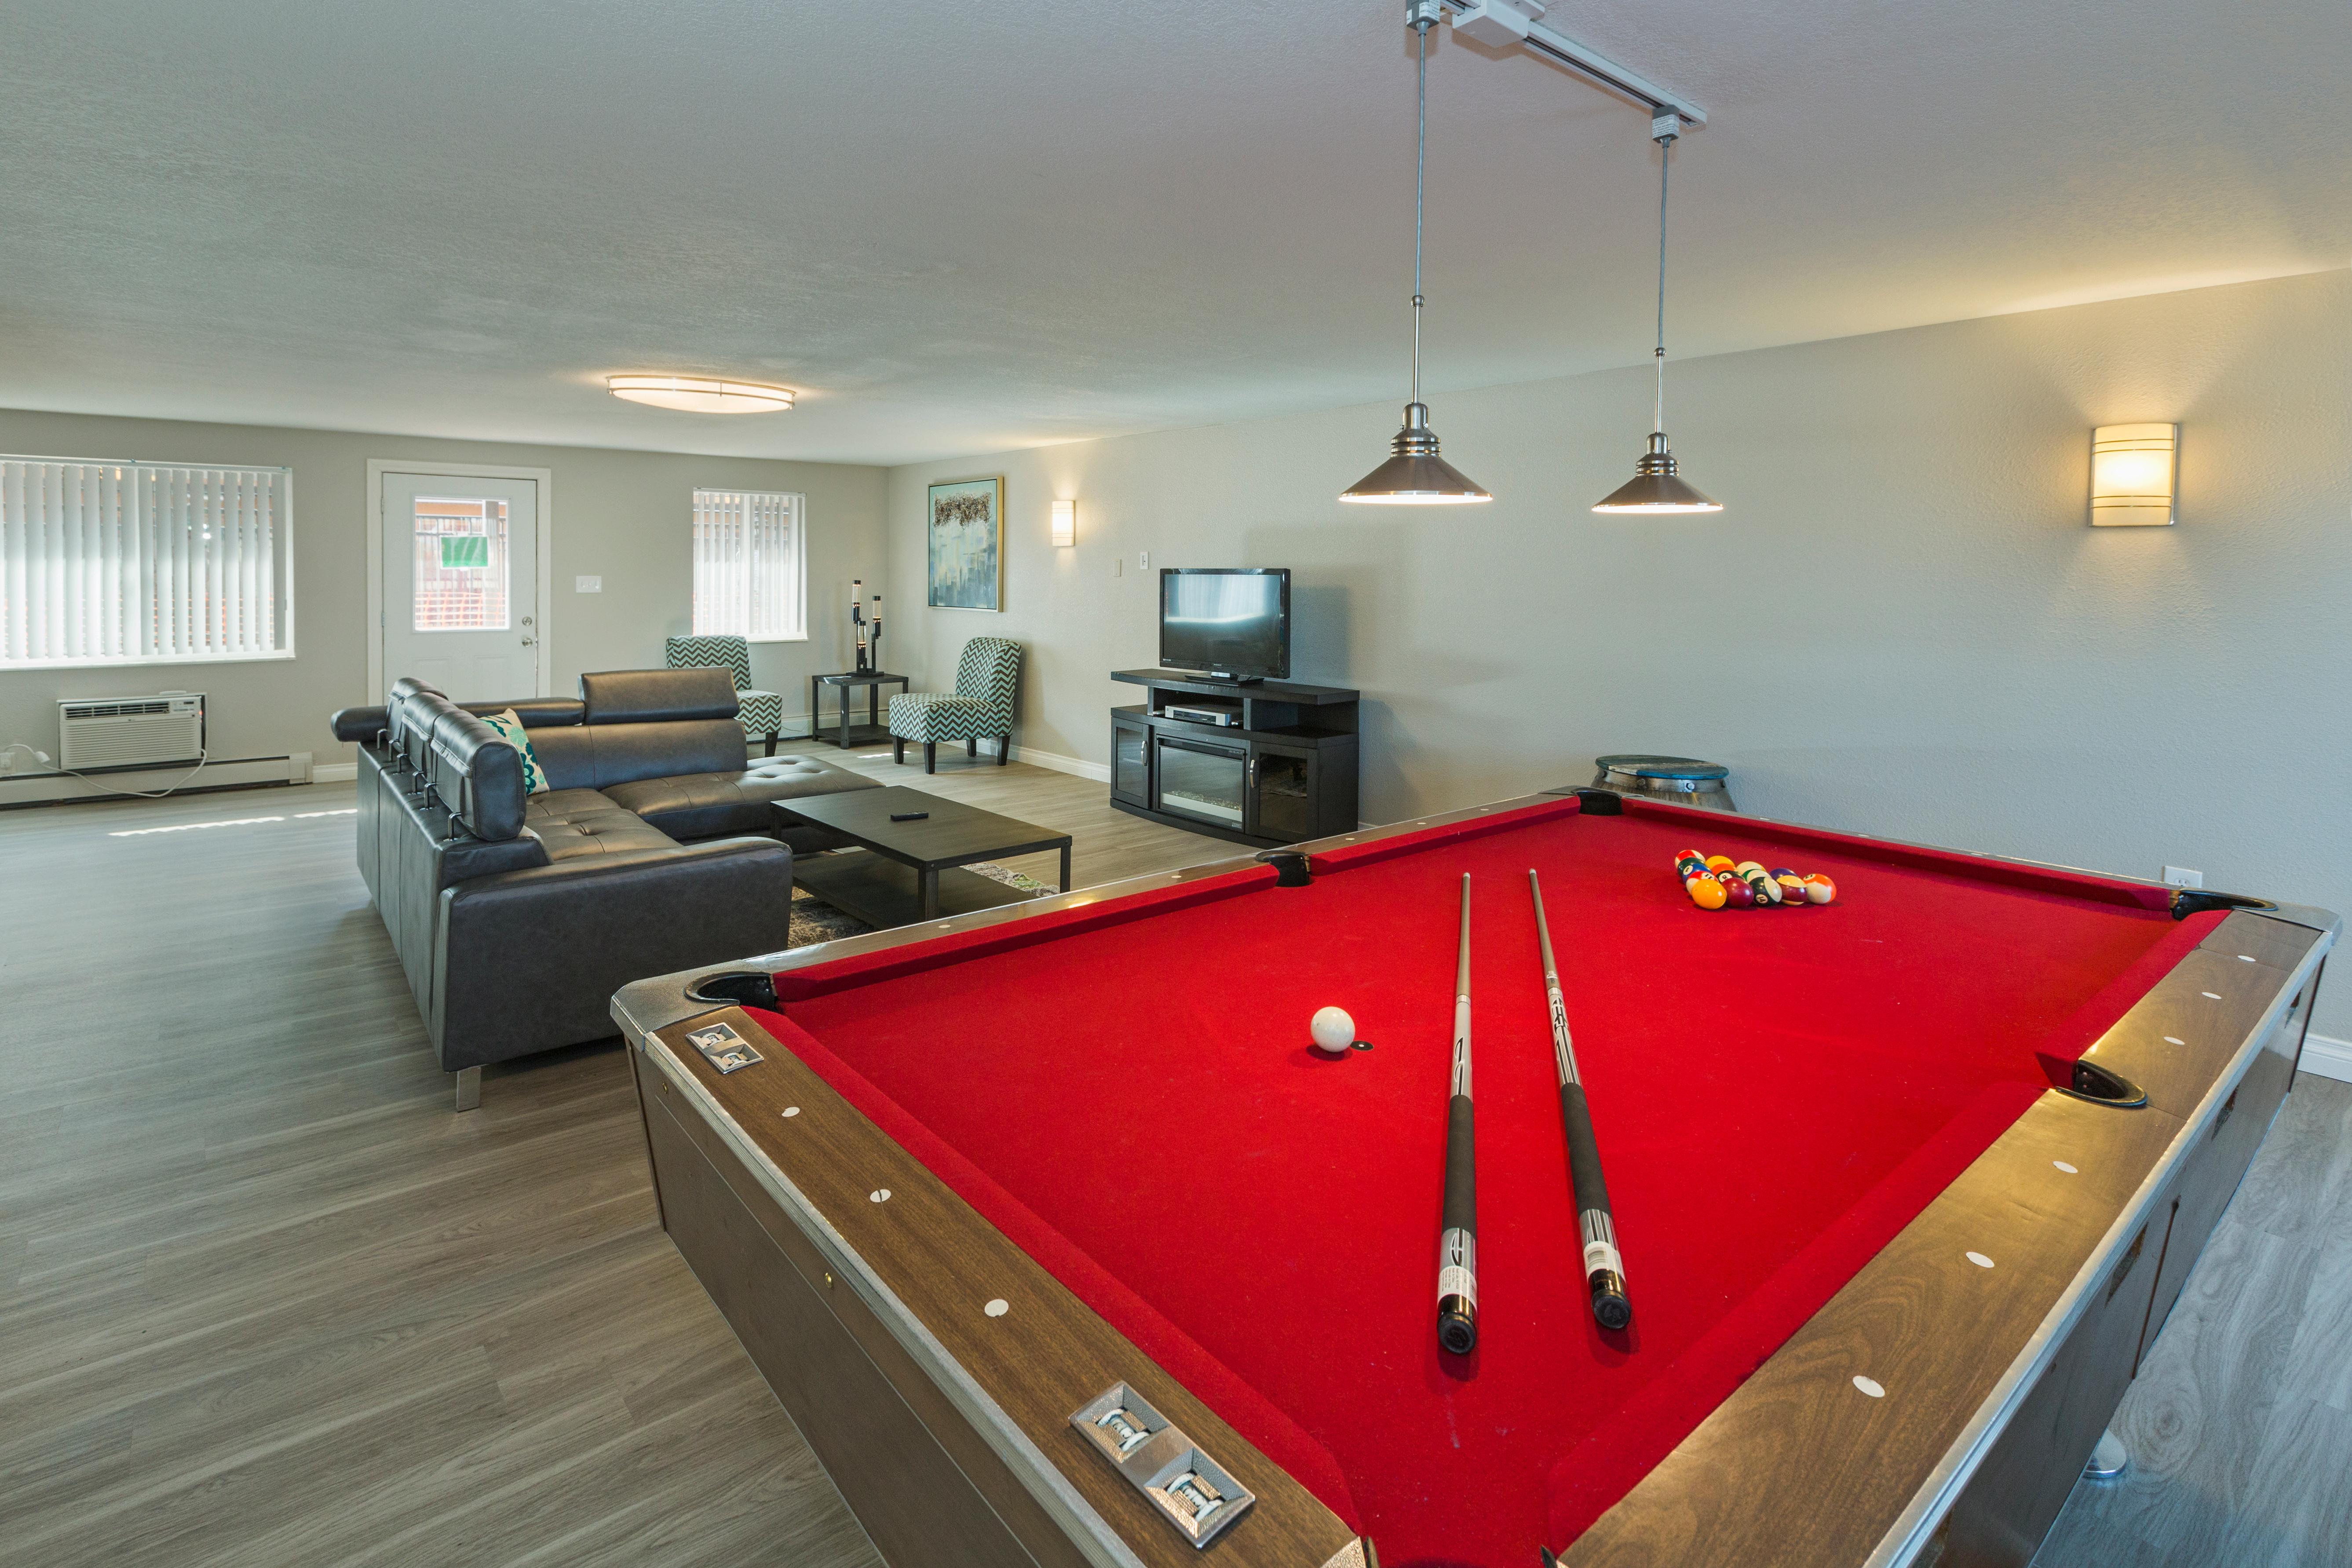
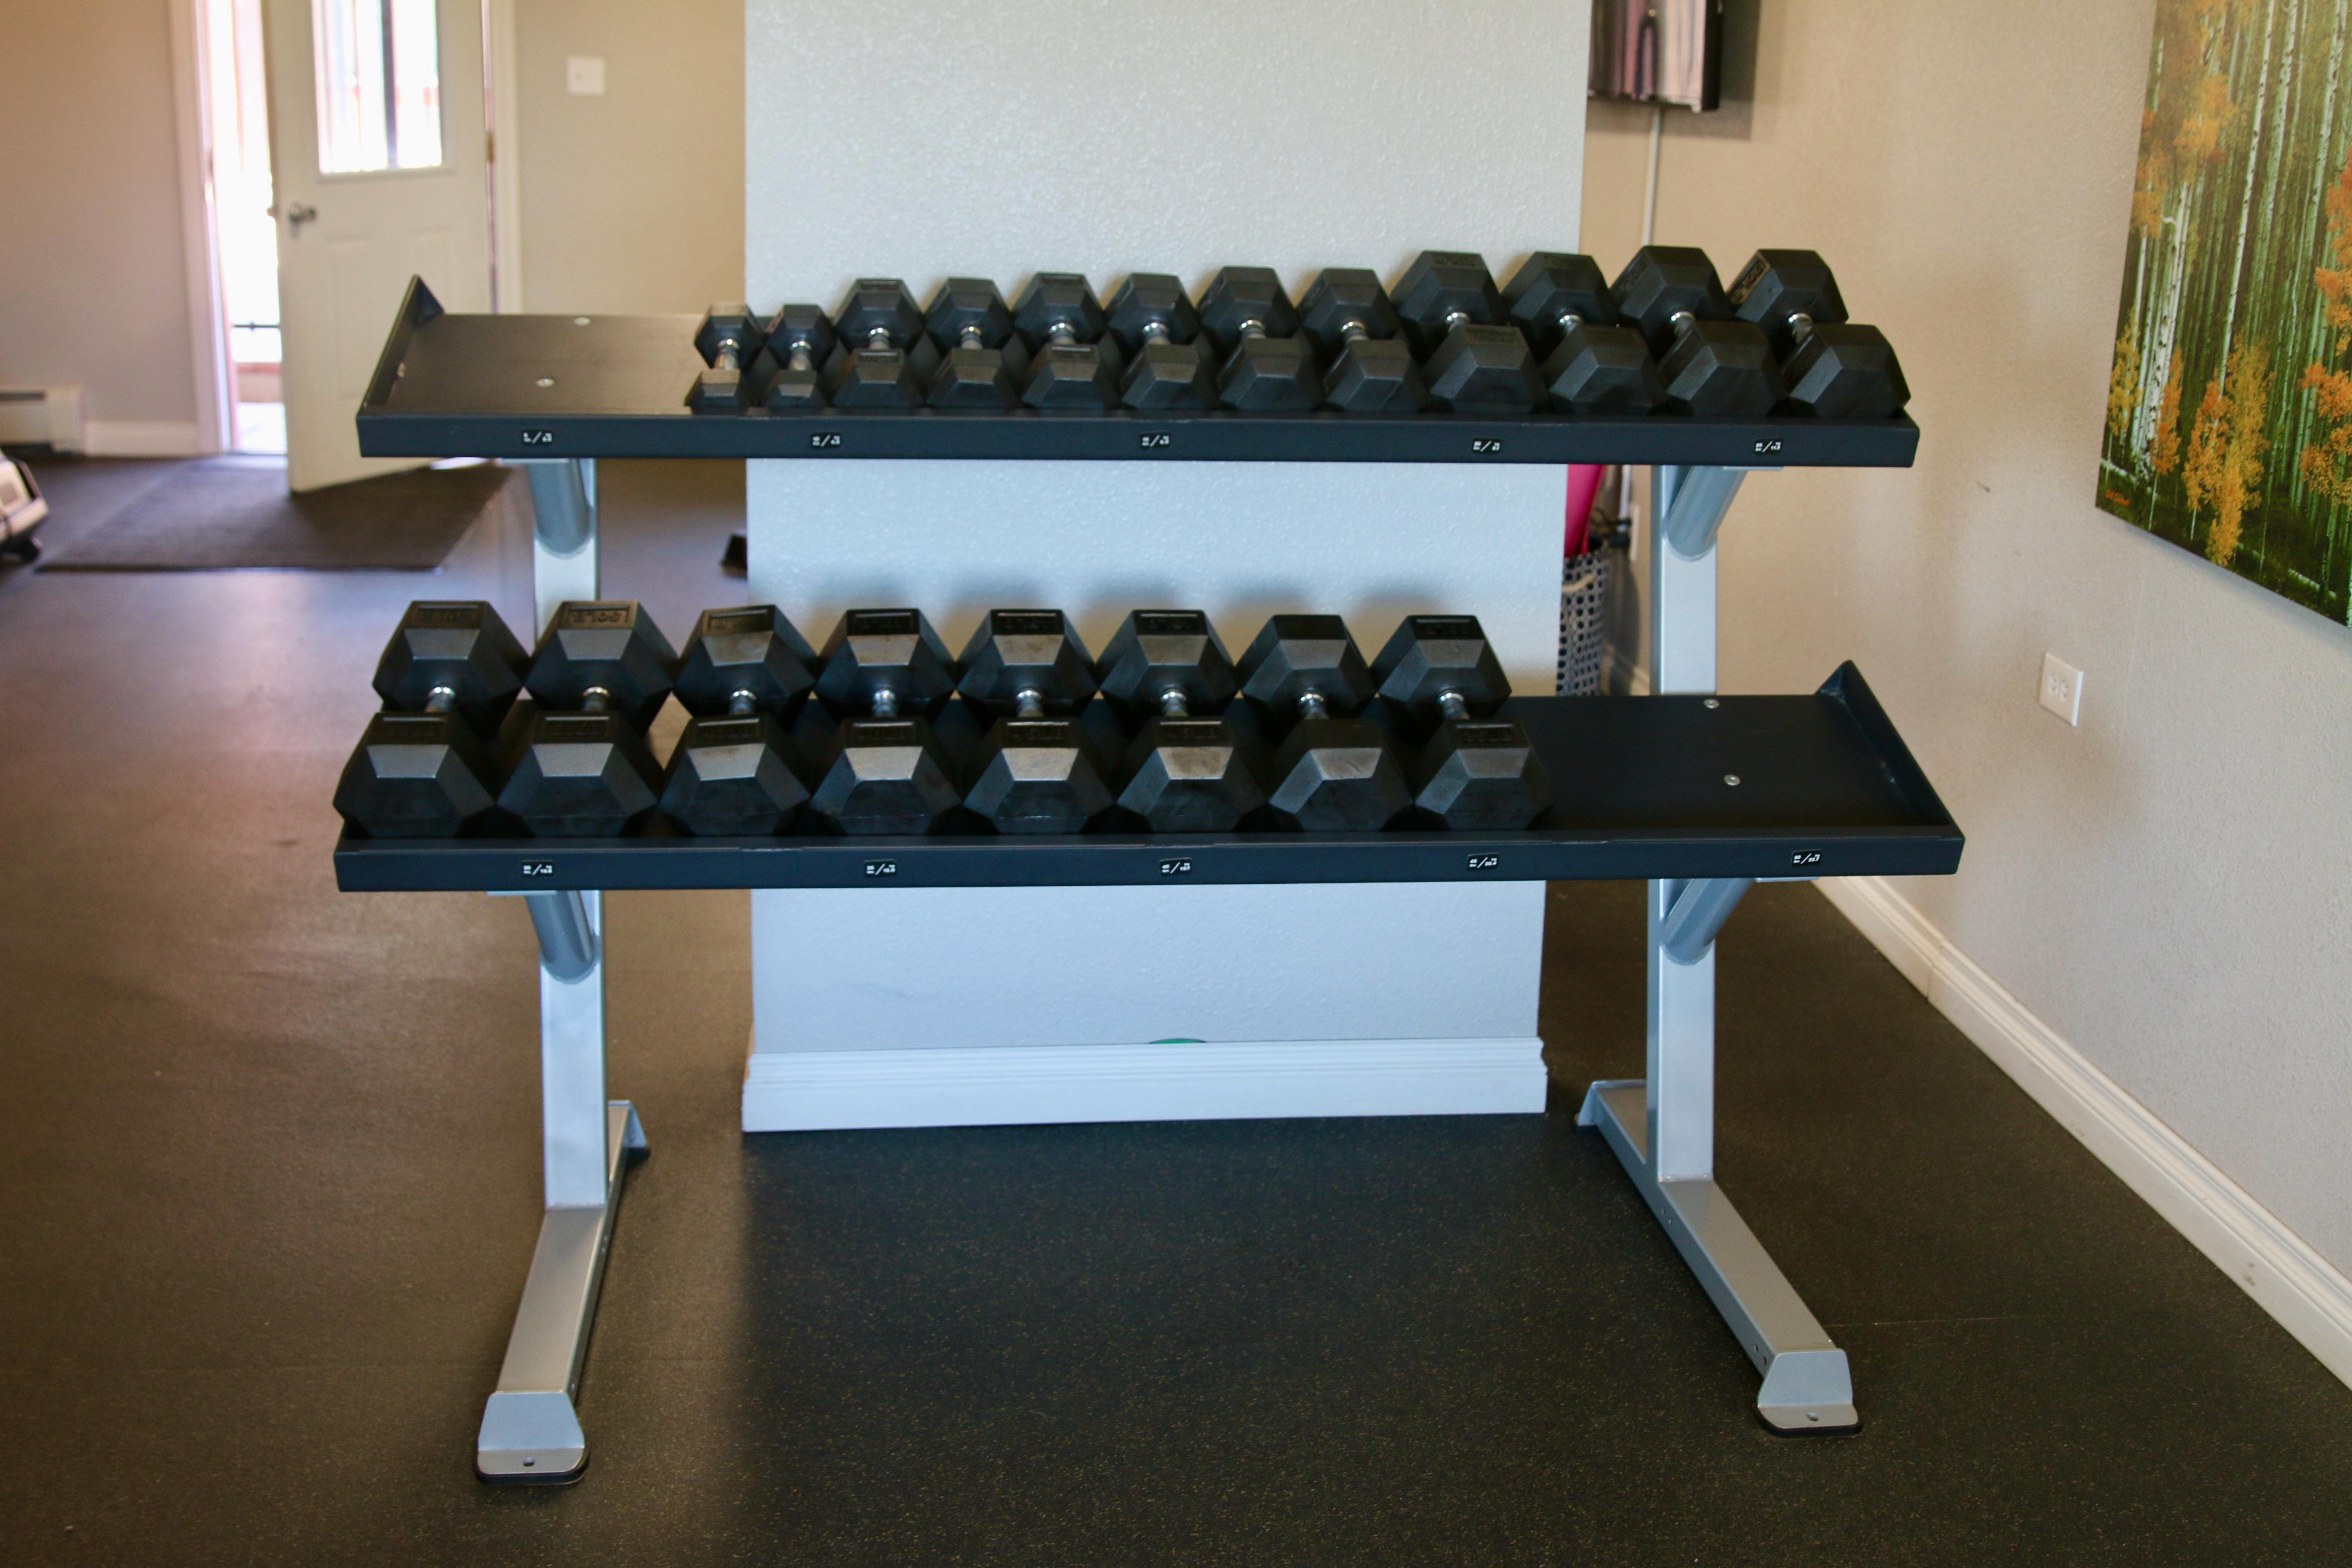
• 24-hour Fitness Center with Cardio, Resistance, and Free Weights • On-Site Clubhouse with Multimedia Center and Refreshments • Leash-Free Dog Park • Playground Amenities & Features • Covered Parking • Online Rent Payments and Maintenance Requests • Courtyard with Grills • Washer/Dryer in Select Units
Under-Market Rents: The current ownership group has

As evidenced in the
to the
on the
MIX (AS OF OCTOBER 2020)
such as
and common
in
BED/BATH
for
RENT/SF
Long-Term
RENT /SF

Business Plan
focused
major external systems
roofs, boilers,
areas.
below rental table, Newport Square is substantially below market
rents, primarily due
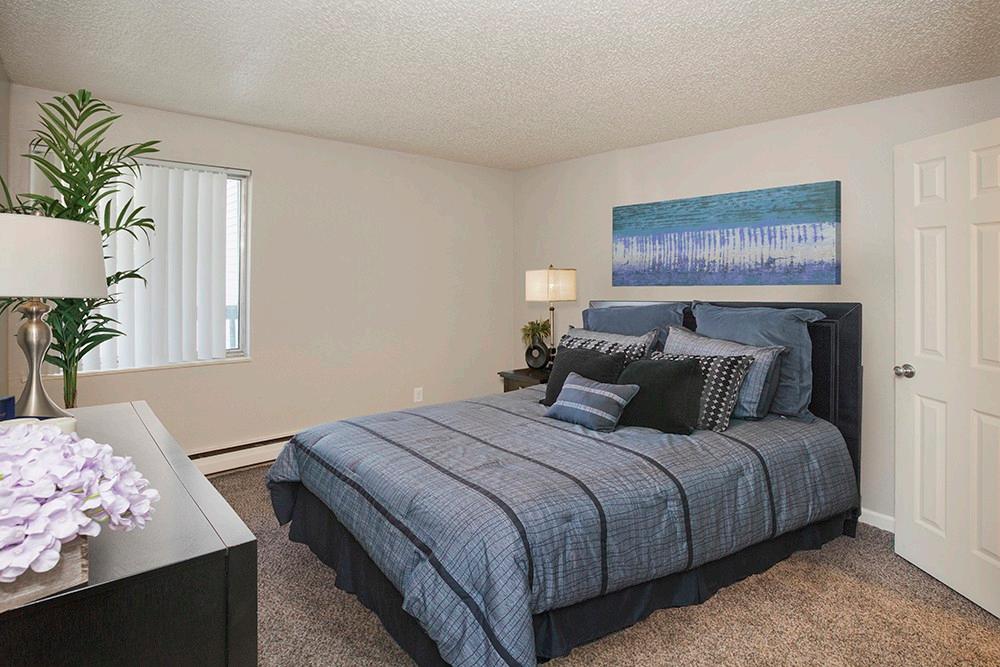
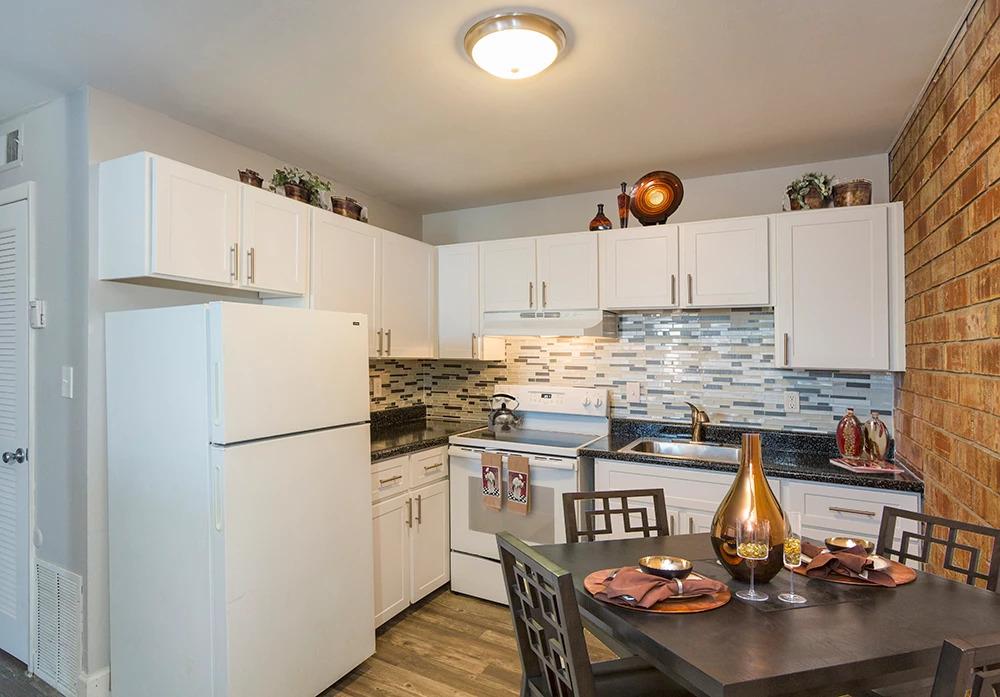
condition of the units themselves. We plan to implement a comprehensive unit renovation schedule, including new doors, countertops, cabinets, vanities, lighting, plumbing, and flooring. These renovations will position the property to attract a significantly higher class of tenant. Unique Upgrades: We plan to add washer/dryer combos to most of the one bedroom units. In Colorado Springs the average rent increase with in unit laundry is $75 per month. We also plan to invest in updating the landscaping to foster a sense of community Manage
Cashflow and
Growth: The Colorado Springs market is one of the fastest growing in the country, this trajectory is reflected in the current occupancy rate of 97% across work-force housing in the MSA. With businesses like Amazon, Ent Credit Union, and InN-Out continuing to invest locally the prospects are bright for continued rent growth which will result in strong cashflows and equity growth. UNIT
AVG SF # UNITS OCCUPIED RENT/UNIT
PROJECTED RENT PRO.
1BR/1BA S 540 49 97% $785 $1.45 $950 $1.76 1BR/1BA L 550 8 97% $795 $1.45 $995 $1.81 1BR/1BA SWD 550 11 97% $850 $1.55 $995 $1.81 2BR/1BA S 790 26 96% $885 $1.12 $1,050 $1.33 2BR/1BA L 810 24 96% $895 $1.10 $1,095 $1.35 TOTAL 447 118 97% $836 $1.31 $1,009 $1.53


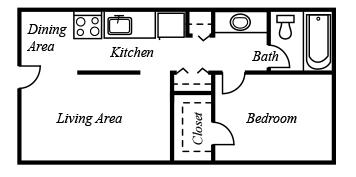
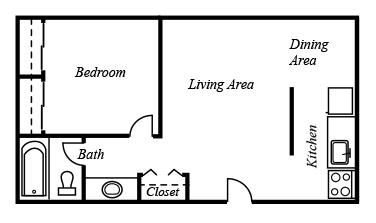

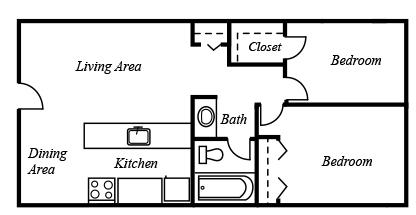
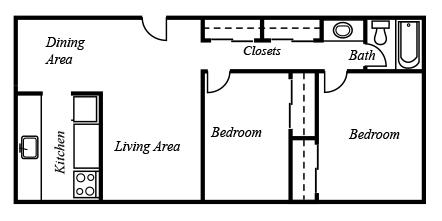
Floor Plans 1BR/1BA S (540 sq ft) 42% 1BR/1BA L (550 sq ft) 7% 1BR/1BA SWD (550 sq ft) 9% 2BR/1BA S (790 sq ft) 22% 2BR/1BA L (810 sq ft) 20%


Financial Analysis Debt Financing Pro Forma Projections Capital Sources & Uses Rent Comps Sale Comps Sensitivity Analysis


Debt Financing DEBT FINANCING PRINCIPAL BALANCE $10,875,000 LOAN TO VALUE 75% INTEREST RATE 3.625% MONTHS OF INTEREST ONLY PAYMENTS 24 TERM (YEARS) 10 FIXED OR ADJUSTABLE FIXED RATE AMORTIZING PERIOD (YEARS) 30 PREPAYMENT PENALTY NO PREPAYMENT RECOURSE YES


Pro Forma Projections YEAR 1 YEAR 2 YEAR 3 YEAR 4 YEAR 5 INCOME $1,361,149 $1,555,000 $1,602,680 $1,700,000 $1,751,000 GROSS POTENTIAL RENT $1,424,100 $1,466,800 $1,493,342 $1,536,100 $1,584,200 OTHER INCOME $193,300 $199,100 $202,100 $208,300 $214,400 LOSS TO LEASE/BAD DEBT ($142,800) ($36,200) ($37,300) ($38,400) ($39,700) VACANCY LOSS ($114,800) ($72,400) ($74,600) ($79,200) ($79,200) EFFECTIVE GROSS INCOME $1,171,700 $1,341,108 $1,381,500 $1,422,700 $1,465,400 TOTAL NET INCOME $1,364,700 $1,537,208 $1,583,600 $1,631,000 $1,679,800 OPERATING EXPENSES PAYROLL $109,700 $110,800 $113,600 $116,400 $119,300 CONTRACT SERVICES $10,900 $11,000 $11,300 $11,600 $11,900 REPAIRS & MAINTENANCE $28,500 $28,800 $29,500 $30,270 $31,000 UTILITIES $132,500 $134,000 $137,200 $140,000 $144,200 ADMINISTRATIVE $25,000 $25,300 $26,000 $26,500 $27,300 INSURANCE $62,000 $62,600 $64,000 $66,700 $67,400 MANAGEMENT FEE $41,000 $46,000 $47,500 $49,000 $50,300 REAL ESTATE TAXES $34,090 $50,000 $51,000 $52,500 $53,800 LEGAL $3,100 $3,200 $3,300 $3,300 $3,400 MARKETING $16,000 $16,200 $16,600 $17,000 $17,400 TOTAL OPERATING EXPENSES $462,790 $487,900 $500,000 $513,270 $526,000 % OF EGI NET OPERATING INCOME $901,910 $1,048,308 $1,102,600 $1,117,730 $1,153,800


Capital Sources & Uses CAPITAL SOURCES AND USES LOAN PROCEEDS $10,875,000 INVESTOR EQUITY $5,500,000.00 TOTAL CAPITAL $16,375,000.00 PURCHASE PRICE ($14,500,00.00) CAPEX ($700,000.00) RESERVES ($488,750.00) ACQUISITION FEE – 2% ($327,500.00) CLOSING COSTS ($250,000.00) LOAN GUARANTOR FEE – 1%* ($108,750.00) TOTAL ($16,375,000.00) *Recourse Loan


Rent Comps BUILDING NAME UNITS YR BLT/REN AVG SF AVG RENT/SF AVG RENT/UNIT 1 BEDROOM 2 BEDROOM PARK AT PALMER 112 1973 705 $1.53 $1,030 $975 $1,085 PARK AT PENROSE 372 1971 570 $1.75 $995 $940 $1,050 CANDLEWOOD 231 1974 812 $1.23 $988 $875 $1,100 NORTH 49 79 1974/2019 535 $2.03 $1,084 $972 $1,195 NEWPORT SQUARE 118 1973 648 $1.30 $896 $862 $930



Sales Comps SALE DATE PROPERTY NAME # OF UNITS YEAR BUILT PER UNIT SALE PRICE PRICE PER SF MARCH 2020 STRATUS 216 1963 $127,778 $27,600,000 $138.38 JUNE 2019 LINCOLN SPRINGS 180 1997 $108,333 $19,500,000 $148.47 JANUARY 2020 PALMER PARK 200 1971 $130,500 $26,100,000 $200.15 NOVEMBER 2019 ARTEMIS AT SPRING CANYON 292 1971 $237,329 $69,300,000 $258.20 SEPTEMBER 2019 CANYON RANCH 328 1972 $173,780 $57,000,000 $203.81 OCTOBER 2020 NEWPORT SQUARE 118 1973 $122,881 $14,500,000 $146.00


