

Investment Summary
This document is confidential and may not be reproduced or redistributed. The information presented herein has been prepared for informational purposes only and is not an offer to buy or sell, or a solicitation of an offer to buy or sell any security or fund interest or any financial instrument and is not to be consider ed investment advice. This presentation is for institutional use only and is not to be distributed to any party other than its intended recipient.
The following materials present information regarding a proposed creation of a special purpose vehicle (the "Issuer") which would offer securities (the “Securities”) to finance its acquisition of a portfolio of financial assets to be selected and managed by the portfolio manager referred to herein (the "Manager"). These materials have been prepared to provide preliminary information about the Issuer and the transactions described herein to a limited number of potential underwriters of the Securities for the sole purpose of assisting them to determine whether they have an interest in underwriting the Securities.
The views and opinions expressed in this presentation are those of Life Bridge Capital LLC (“Life Bridge Capital Capital”) and are subject to change based on market and other conditions. Although the information presented herein has been obtained from and is based upon sources Life Bridge Capital believes to be reliable, no representation or warranty, expressed or implied, is made as to the accuracy or completeness of that information. No assurance can be given that the investment objectives described herein will be achieved. Reliance upon information in this material is at the sole discretion of the reader.
This data is for illustrative purposes only. Past performance of indices of asset classes does not represent actual returns or volatility of actual accounts or investment managers and should not be viewed as indicative of future results. The investments discussed may fluctuate in price or value. Investors may get back less than they invested.
The forward looking information contained in these materials is subject to certain inherent limitations. Such information is inf ormation that is not purely historical in nature and may include, among other things, expected structural features, anticipated ratings, proposed or target portfolio composition, proposed diversification or sector investment, specific investment strategies, and forecasts of future market or economic conditions. The forward looking information contained herein is based upon certain assumptions, which are unlikely to be consistent with, and may differ materially from actual events and conditions. In addition, not all relevant events or conditions may have been considered in developing such assumptions. Accordingly, actual results will vary and the variations may be material. Prospective investors should understand such assumptions and evaluate whether they are appropriate for their purposes. These materials may also contain historical market data; however, historical market trends are not reliable indicators of future market behavior.
Information in these materials about the Manager, its affiliates and their personnel and affiliates and the historical performance of portfolios it has managed has been supplied by the Manager to provide prospective investors with information as to its general portfolio management experience and may not be viewed as a promise or indicator of the Issuer's future results. Such information and its limitations are discussed further in the sections of these materials in which such information is presented.
Past performance of indices or asset classes does not represent actual returns or volatility of actual accounts or investment managers and should not be viewed as indicative of future results. The comparisons herein of the performances of the market indicators, benchmarks, or indices may not be meaningful since the constitution and risks associated with each market indicator, benchmark, or index may be significantly different. Accordingly, no representation or warranty is made to the sufficiency, relevance, importance, appropriateness, completeness, or comprehensiveness of the market data, information, or summaries contained herein for any specific purpose.
Past performance is not indicative of comparable future results. Given the inherent volatility of the securities markets, it should not be assumed that investors will experience returns comparable to those shown here. Market and economic conditions may change in the future producing materially different results than those shown here. All investments have inherent risks.


7 16 23 30 35 42 Executive Summary Property Profile Financial Analysis Market Overview Portfolio & Case Studies Index Table of Contents
Executive Summary Investment Summary Investment Offering Investment Highlights
GREAT LOCATION
Copper Chase is right across from Broadmoor Town Center, a 34-store shopping mall with a variety of top stores.
The
FAMILY-ORIENTED
is
with a
area, a variety of
perfect amenities for

property
equipped
play
sports courts, and outdoor grills –
families.
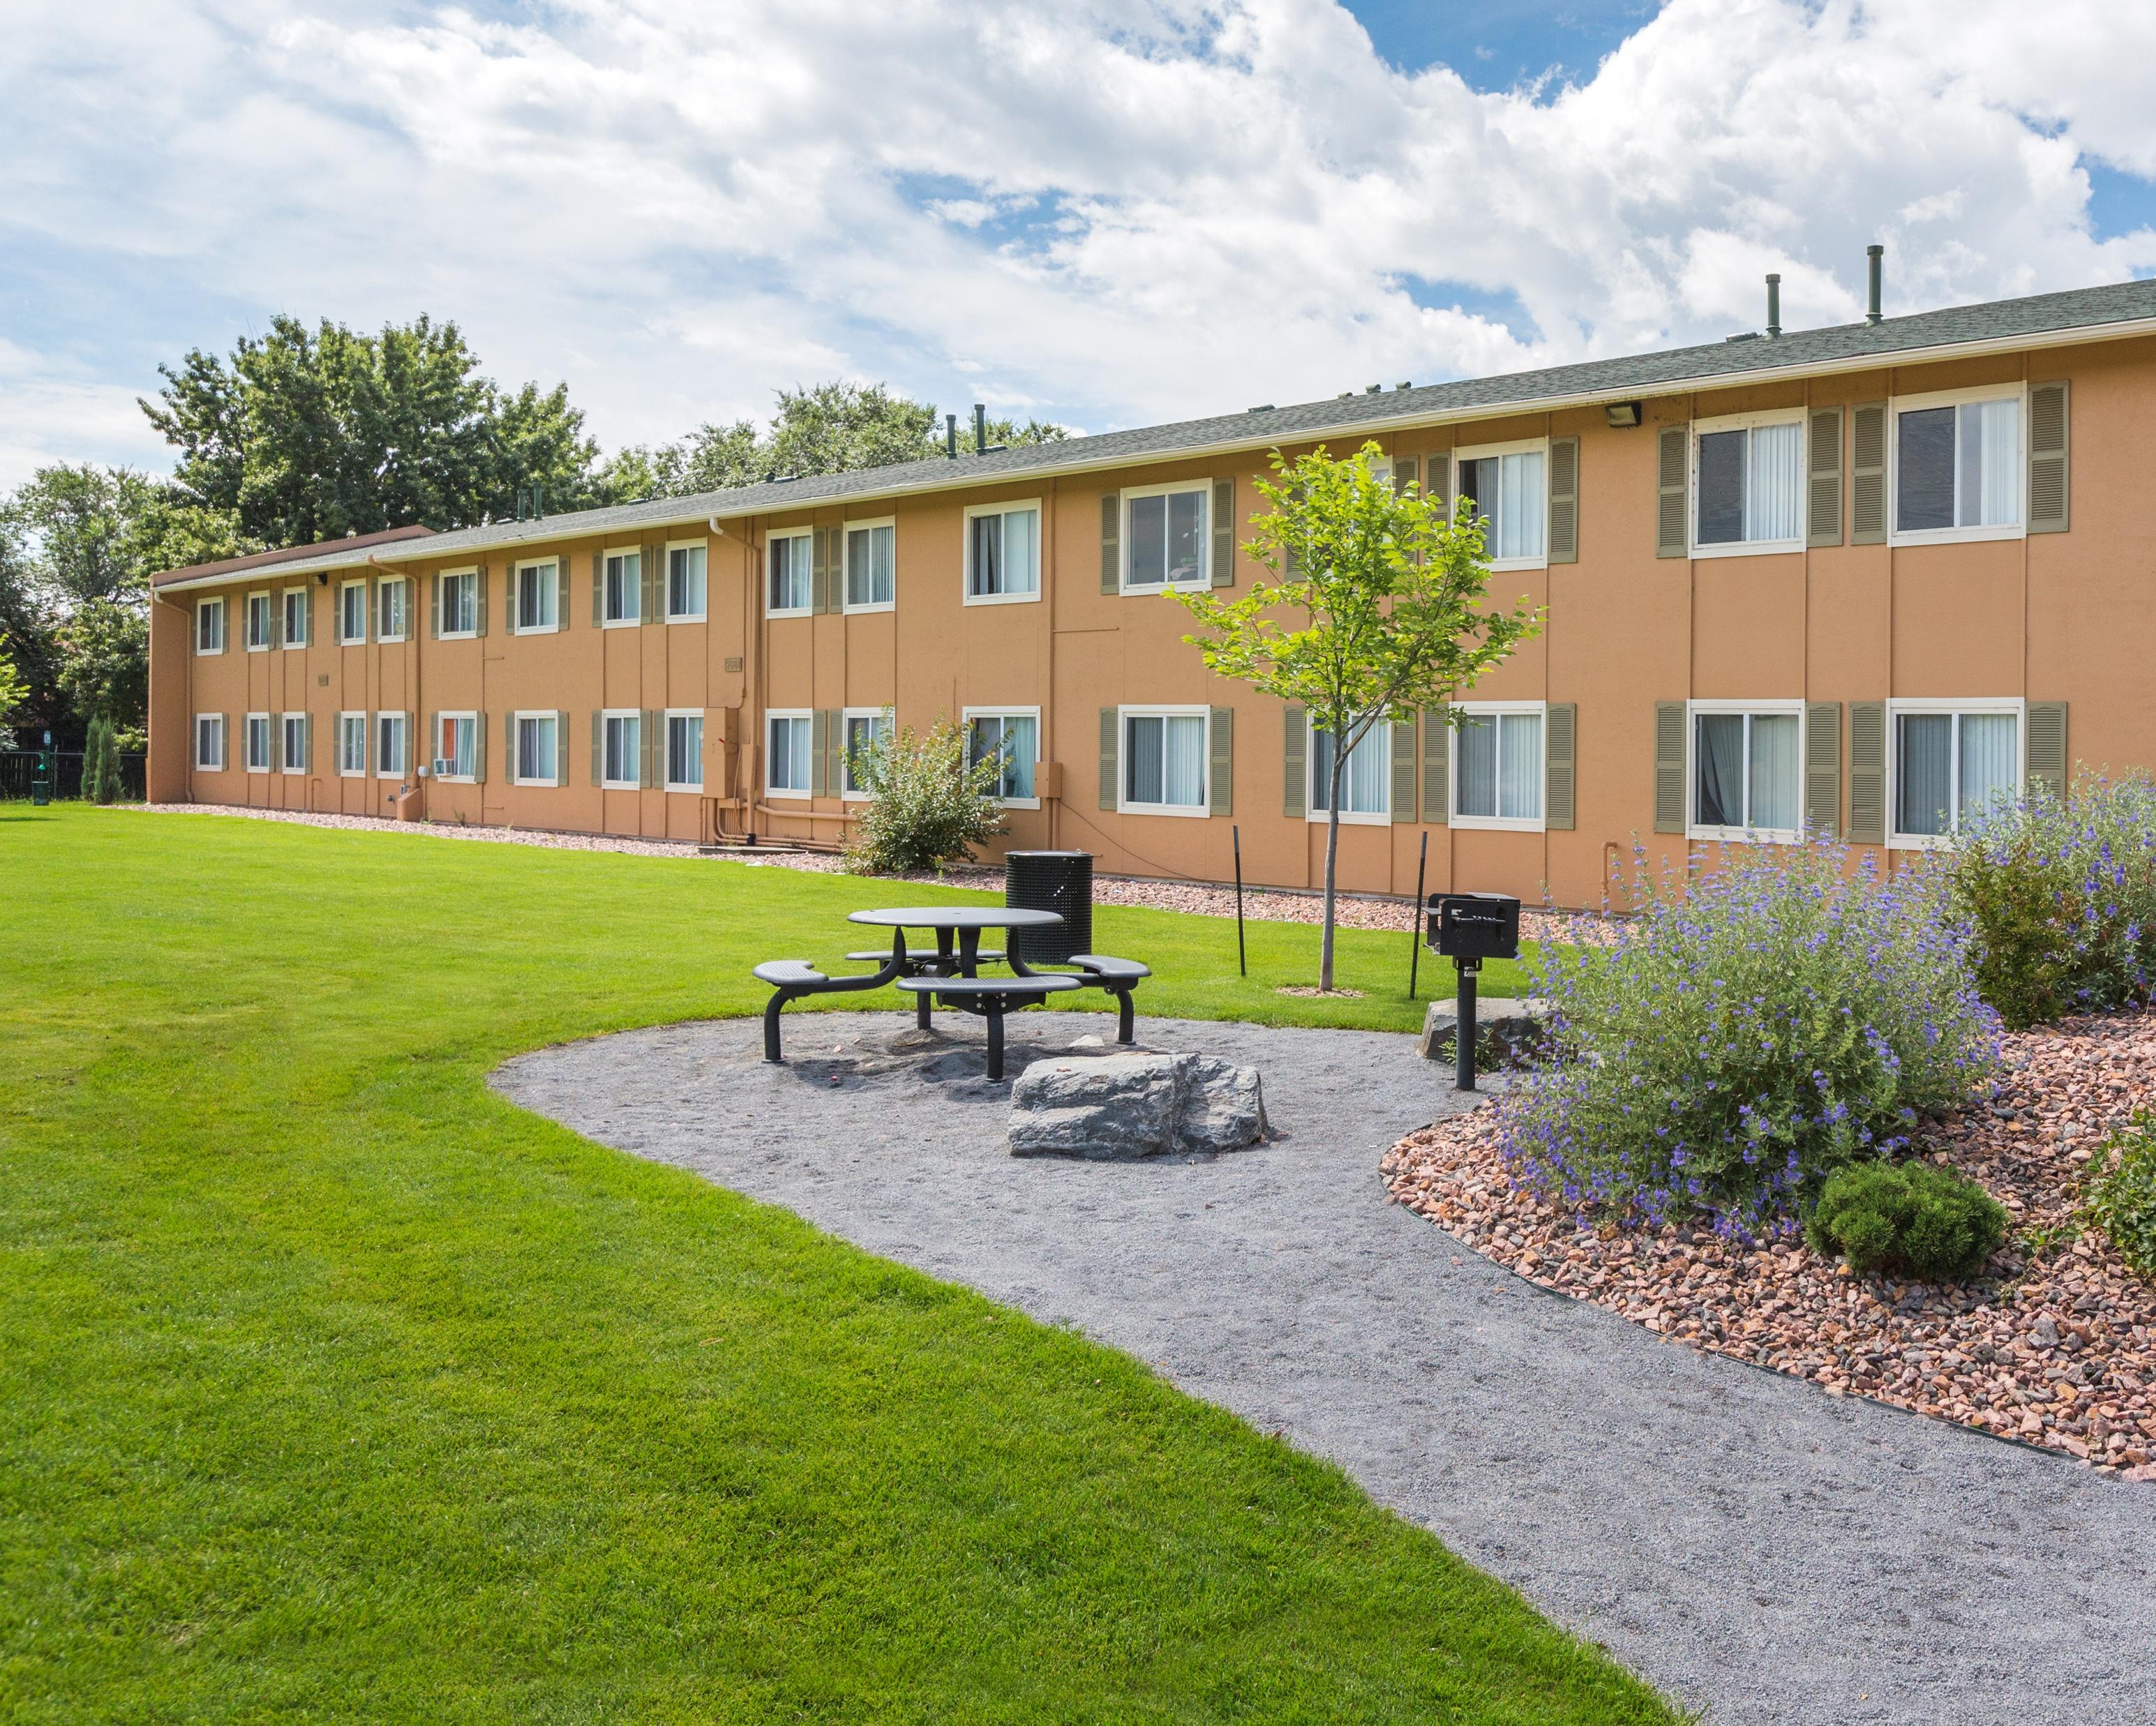
This asset is a 149 unit surface parked apartment community built in 1969. Located on the west side of Colorado Springs, Copper Chase is ideally located to attract tenants from a wide variety of employers, including The Broadmoor, Amazon, nearby retail centers, and the Colorado Springs Airport.

Copper Chase has an exceptional mix of 1, 2, and 3 bedroom units on an expansive and wellmaintained plot across from the Broadmoor Towne Centre Mall. By implementing a thorough unit interior renovation plan, Life Bridge plans to create a vibrant, family style community that will attract tenants while delivering excellent returns for our equity partners.
Life Bridge Capital has identified Copper Chase for acquisition
OFFERING SUMARYOFFERING SUMARY CAP (T12) 4.55% REVERSION CAP 5.30% EXPENSE RATIO (T12) 35% OCCUPANCY (AS OF 10/1/20) 94% DSCR 1.27 PURCHASE PRICE $27,300,000 HOLD TIME 5 YEARS EQUITY REQUIRED (TOTAL) $10,902,806 CLASS A IRR & AVG ANNUAL RETURN 10% CLASS B. INVESTORY EQUITY MULTIPLE 2.00 CLASS B INVESTOR AVERAGE ANNUAL RETURN* 8.79% CLASS B INVESTOR AVERAGE ANNUAL RETURN** 20.09% CLASS B INTERNAL RATE OF RETURN (IRR) 16.83% *Excluding proceeds from sale **Including proceeds from sale Investment Summary
Two-Tiered Return Structure:
A two tiered return structure gives investors more choices when placing their equity. Investors have the opportunity to invest in either tier of equity Class A, Class B or a combination of both Class A and Class B. Diversifying in both classes allows for a risk adjusted and blended return.
Limited Partner (A) Class A:
Class A investors sit behind the debt in the capital stack and have a preferred return of 10% paid out monthly with minimum investment of $50,000 per investor. Due to the position in the capital stack, Class A investors have virtually no upside upon disposition or another capital event. This tier is for investors who prefer stronger cash-flow and minimal risk.
Limited Partner (B) - Class B:
Class B investors sit behind Class A investors in the capital stack, per the diagram. Class B has a preferred return of 8% which will accrue over the life of the deal. Cashflow from operations remaining after paying out Class A will be distributed to Class B investors monthly. The minimum investment in Class B is $50k. This tier is for investors who want to maximize their returns over the life of the investment. Class B investors will participate in the upside upon disposition or capital events.
CLASS A PARTNERSHIP STRUCTURE INVESTOR DISTRIBUTION OF CASH FLOW 10% Preferred to Investor MEMBERSHIP OWNERSHIP 10% Preferred to Investor Two-Tiered Equity Structure CLASS B PARTNERSHIP STRUCTURE INVESTOR DISTRIBUTION OF CASH FLOW 8.0% Preferred to Investor 70/30 Split Thereafter MEMBERSHIP OWNERSHIP 70% to 17% IRR 50/50 Split Thereafter GENERAL PARTNER DEBT LIMITED PARTNER (B) LIMITED PARTNER (A) 30% Owner 70% Owner$10,902,806 $20,475,000
Sample Returns INVESTOR RETURNS BASED ON $100,00 INVESTMENT – CLASS A INVESTMENT YEAR 1 YEAR 2 YEAR 3 YEAR 4 YEAR 5 INVESTOR ANNUAL PERCENT RETURN 10% 10% 10% 10% 10% INVESTOR RETURN ON INVESTMENT ($100,000) $10,000 $10,000 $10,000 $10,000 $10,000 RETURN FROM DISPOSITION – LIMITED PARTNER 100,000 TOTAL RETURN – LIMITED PARTNER ($100,000) $10,000 $20,000 $30,000 $40,000 $150,000 INVESTOR RETURNS BASED ON $100,00 INVESTMENT – CLASS B Investment Year 1 Year 2 Year 3 Year 4 Year 5 INVESTOR ANNUAL PERCENT RETURN 8.0% 9.7% 10.3% 8.0% 8.0% INVESTOR RETURN ON INVESTMENT $100,000 $8,000 $9,698 $10,272 $8,000 $8,000 RETURN FROM DISPOSITION LIMITED PARTNER $149,638 TOTAL RETURN – LIMITED PARTNER $100,000 $8,000 $17,698 $27,970 $35,970 $193,608 RETURN SUMMARY 10.0% Equity Multiple AVG COC* Annualized LIMITED PARTNER (CLASS A) 1.50x 10.0% 10.0% LIMITED PARTNER (CLASS B) 16.98% 2.00x 8.8% 20.1% *Excluding proceeds from sale **Including proceeds from sale

Investment Highlights Buildings 14 Units 149 Parking Stalls 210 Build Date 1969 Acres 10.39

Property Profile Property Specifications Amenities Business Plan Floor Plans
Property Specifications PROPERTY DETAILS YEAR BUILT 1969 ACRES 10.39 BUILDING STYLE Garden ROOF Pitched (8) and Flat (6) NUMBER OF BUILDINGS 14 ROOF AGE 8 years NUMBER OF STORIES 2 CONSTRUCTION TYPE Wood Frame UNIT MIX (AS OF OCTOBER 2020) BED/BATH AVG SF # UNITS OCCUPIED RENT/UNIT RENT/SF PROJECTED RENT PRO. RENT /SF 1BR/1BA 600 23 82.6% $906 $1.51 $1150 $1.92 2BR/1BA 690 6 95.7% $1095 $1.59 $1195 $1.73 2BR/1BA 735 40 95.7% $1095 $1.49 $1250 $1.70 3BR/1BA 944 64 96.3% $1230 $1.30 $1575 $1.67 3BR/1BA 971 16 96.3% $1230 $1.27 $1625 $1.67 TOTAL 149 94% $1138 $1.27 $1,412 $1.44 PARKING SURFACE PARKING 210 HANDICAP ACCESSIBLE PARKING 15 SPACES PER UNIT 1.4

Amenities & Features • Large Outdoor Pool • Volleyball Court • Basketball Court • Courtyard with Grills • Open recreation areas • Playground • W/D Hookups
Under-Market Rents: The current ownership group has focused on updating the electrical system, stairway and balcony renovations, and extensive landscaping modernization. As shown in the below rental table, Copper Chase is substantially below market in rents, primarily because the staff hasn't pushed for market rates. Units leased over the past 3 months are going for rates within 5% of our projected, post renovation figures. By implementing a comprehensive unit renovation schedule including windows,
countertops, cabinets, vanities, lighting, plumbing, and flooring the property will be positioned to achieve rent growth into the future while attracting a significantly higher class of tenant.
UNIT MIX (AS OF OCTOBER 2020)
BED/BATH
Tenant Engagement:
to add soccer goals and bleachers to the
on the SE corner of the property, add additional
around the pool, and renovate a vacant space in the laundry room to function as a leasing office, thereby gaining another unit.
Manage for Cashflow and Long-Term Growth: The Colorado Springs market is one of the fastest growing in the country, this trajectory is
in the current occupancy rate of
across work-force
in the MSA. With businesses like Amazon, Ent Credit Union, and
Out continuing to invest locally the prospects are
rent
for
which will result in strong cashflows and equity
Business Plan
doors,
We plan
park
amenities
reflected
97%
housing
In N
bright
continued
growth
growth.
AVG SF # UNITS OCCUPIED RENT/UNIT RENT/SF PROJECTED RENT PRO. RENT /SF 1BR/1BA 600 23 82.6% $906 $1.51 $1150 $1.92 2BR/1BA 690 6 95.7% $1095 $1.59 $1195 $1.73 2BR/1BA 735 40 95.7% $1095 $1.49 $1250 $1.70 3BR/1BA 944 64 96.3% $1230 $1.30 $1575 $1.67 3BR/1BA 971 16 96.3% $1230 $1.27 $1625 $1.67 TOTAL 149 94% $1138 $1.27 $1,412 $1.44


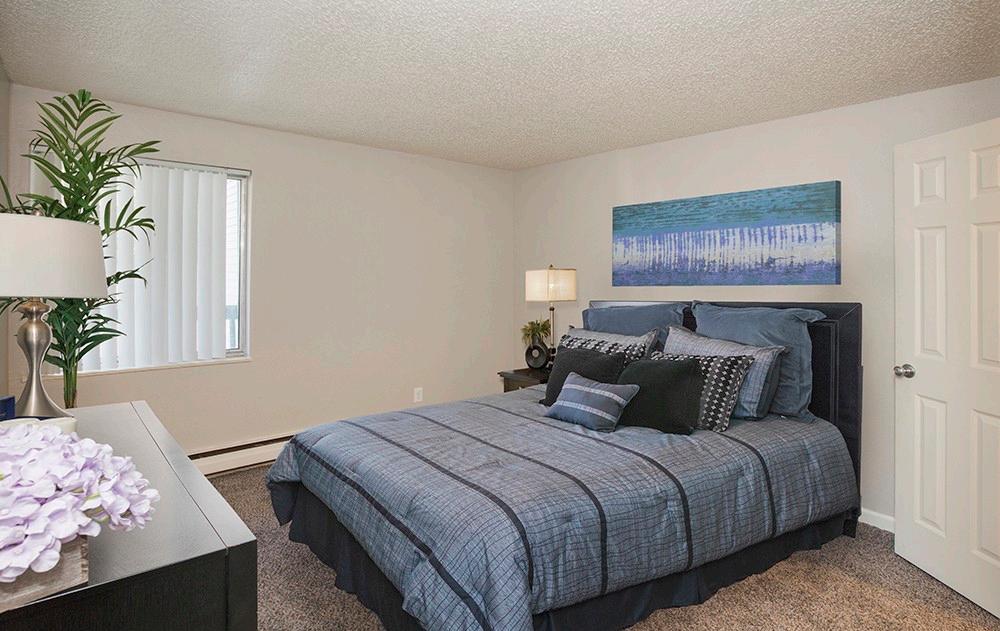
Floor Plans Cucharas – 1B/1B Powderhorn – 2B/1BR Arapahoe – 3B/1BR


Floor Plans Aspen –Monarch2B/1BR – 3B/1BR
Map

Property
Debt Financing DEBT FINANCING PRINCIPAL BALANCE $20,475,000 LOAN TO VALUE 75% INTEREST RATE 3.1% MONTHS OF INTEREST ONLY PAYMENTS 36 TERM (YEARS) 10 FIXED OR ADJUSTABLE FIXED RATE AMORTIZING PERIOD (YEARS) 30 PREPAYMENT PENALTY Yield Maintenance RECOURSE NO
Financial Analysis Debt Financing Pro Forma Projections Capital Sources & Uses Rent Comps Sale Comps Sensitivity Analysis
$88,218
$65,790 $67,435
Pro Forma Projections YEAR 1 YEAR 2 YEAR 3 YEAR 4 YEAR 5 INCOME Gross Potential Rent $2,525,040 $2,562,916 $2,639,803 $2,718,997 $2,800,567 Loss to Lease/Bad Debt $252,504 $64,073 $65,995 $67,975 $70,014 Vacancy Loss $202,003 $128,146 $131,990 $135,950 $140,028 EFFECTIVE GROSS INCOME $2,070,533 $2,370,697 $2,441,818 $2,515,072 $2,590,525 Other Income $304,000 $333,560 $353,567 $364,174 $375,099 TOTAL NET INCOME $2,374,533 $2,709,257 $2,800,535 $2,884,551 $2,971,087 Operating Expenses Payroll $180,000 $181,800 $186,345 $191,004 $195,779 Contract Services $83,135 $83,966 $86,066
$90,423 Repairs & Maintenance $80,245 $81,047 $83,074 $85,150 $87,279 Utilities $180,793 $182,601 $187,166 $191,845 $196,641 Administrative $20,000 $20,200 $20,705 $21,223 $21,753 Insurance $62,000 $62,620 $64,186
Management Fee $71,236 $81,128 $83,862 $86,377 $88,969 Real Estate Taxes $57,765 $85,000 $87,125 $89,303 $91,536 Legal $5,000 $5,050 $5,176 $5,306 $5,438 Marketing $20,000 $20,200 $20,705 $21,223 $21,753 Turnover $37,500 $37,875 $38,822 $39,792 $40,787 Deposit to Replacement Reserve $37,250 $37,250 $37,250 $37,250 $37,250 Total Operating Expenses $834,924 $878,887 $900,635 $922,639 $945,207 Net Operating Income $1,539,609 $1,830,370 $1,899,900 $1,961,912 $2,025,880
Capital Sources & Uses CAPITAL SOURCES AND USES Capital Sources & Uses Loan Proceeds $ 20,475,000 Investor Equity $ 10,900,000 Total Capital $31,375,000 Purchase Price $ (27,300,000) CapEx $ (1,728,000) Reserves $ (1,272,000) Acquisition Fee = 2% $ (627,500) Closing Costs $ (369,062) Loan Guarantor Fee = 0.25%* $ (78,438) Total $ (31,375,000) *Recourse Loan

Rent Comps BUILDING NAME UNITS YR BLT/REN AVG SF AVG RENT/SF AVG RENT/UNIT 1 BEDROOM 2 BEDROOM 3 BEDROOM Copper Chase 149 1973 827 $1.66 $1,370 $1,054 $1,417 $1,640.00 Cheyenne Crossing 372 1984 RENO 2018 997 $1.38 $1,380 $1,235 $1,525 Sky at Bear Creek 231 1973 RENO 915 $1.27 $1,165 $1,075 $1,255 Bonterra Lakeside 160 1972 1,041 $1.70 $1,774 $1,749 $1,857 $1,718.00 Broadmore Ridge 200 1974 797 $2.01 $1,605 $1,674 $1,500 $1,642.00

Sales Comps SALE DATE PROPERTY NAME # OF UNITS YEAR BUILT PER UNIT SALE PRICE PRICE PER SF March 2020 STRATUS 216 1963 $ 127,778 $ 27,600,000 $138.38 October 2020 THE TOWNHOUSE 54 1965 $ 161,111 $ 8,700,000 $98.75 January 2020 PALMER PARK 200 1971 $ 130,500 $ 26,100,000 $200.15 November 2019 ARTEMIS AT SPRING CANYON 292 1971 $237,329 $69,300,000 $258.20 September 2019 CANYON RANCH 328 1972 $173,780 $57,000,000 $203.81 October 2018 UNIVERSITY VILLAGE 310 1966 $164,839 $51,100,000 $190.32 June 2017 BONTERRA LAKESIDE 156 1973 $183,333 $28,600,000 $166.81 December 2020 COPPER CHASE 149 1969 $183,221 $27,300,000 $220.35

Sensitivity Analysis OCCUPANCY REVENUE TOTAL EXPENSES* 95% $2,702,788 $ 1,479,497 80% $2,324,032 $ 1,468,134 70% $2,071,528 $ 1,460,559 60% $1,819,024 $ 1,452,984 50% $1,566,520 $ 1,445,409 46% $1,465,518 $ 1,442,379 CAP RATE IRR 5.70% 13.96% 5.50% 15.38% 5.30% 16.98% 5.10% 18.31% 4.90% 19.83% *Includes debt service
Market Overview Colorado Springs, Colorado

Colorado Springs, Colorado
Located just 60 miles south of Denver, Colorado Springs is the second-largest city in Colorado and is located in El Paso County the second-most populous county in the state of Colorado. Known for its natural attractions and mild climate, Colorado Springs experiences 300 days of sunshine annually. The community’s beautiful setting and high quality of life have helped to build a growing community of academic, government, high-tech, non-profit, and defense-related businesses.

Colorado Springs, CO
#1 Fastest Growing City for Millennials Top 5 Job Market in the US 5th Best Big City to live in
Rapid Home Value Appreciation
Colorado Springs has recently led the state with the highest growth in single family home prices. Through July 2020, average home values increased a remarkable 13.7% as many homeowners saw tremendous value compared to Denver. Colorado Springs median home price has increased from $338,00 to $378,000 yet is still 14% below the average for the state ($439,500) and 17% below the average home in Denver ($455,000).* This leaves a significant amount of room for continued appreciation as more homeowners and renters move to Colorado’s second largest city. As more residents discover the high quality of life at an unmatched value for a metro of 700,000+ people, the market will continue to experience sizable growth in the housing market moving forward.
Surrounded By Major Employers and City Attractions
Residence at Copper Chase is surrounded by major employment areas and attractions such as the Colorado Springs Airport, Downtown Colorado Springs, Ft. Carson, and the Broadmoor area. The property is an 8-minute drive to downtown Colorado Springs, which features a wide range of office, retail, restaurants, and cultural amenities for residents to enjoy. With over 4-million square feet of office space, downtown offers strong employment opportunities, and is home to workforce of more than 29,000 employees. Fort Carson is located just a few miles south and east of the property and is situated on 236,000 acres of land. The prestigious Broadmoor area offers several options for recreation. Garden of the Gods has recently been ranked as the #1 park in the United States by TripAdvisor, ahead of Central Park in New York.
1st Mountain City 5th Best Economy in the nation
1st Mid-Sized
American Cities
Colorado Springs, CO


Portfolio Ridgecrest Commons Stratus Apartment Homes Lincoln Springs Apartments The Vue at Chapel Hill Newport Square (under contract)
Plan:


Business
• Implement best-in-class management practices to bring rents to market • Selectively invest in unit upgrades to interest prospective tenants • Implement a long term strategy to maintain market presence and foster a sense of community, PROPERTY DETAILS CLASS A CONSTRUCTED 2017/2019 LOCATION Nampa, ID UNITS 172 PURCHASE PRICE 28.5M Ridgecrest Commons
Business Plan:
• Complete a thorough landscaping update that will focus on creating a sense of community for our residents through the addition of additional amenities,


Implementing higher standards for properly qualifying new residents to bring the delinquency numbers more in line with local market averages
Implementing a thorough value-add program that focuses on renovating the unit interiors with new flooring, electrical and plumbing fixtures, appliances, and countertops.
•
•
PROPERTY DETAILS CLASS C CONSTRUCTED 1975 LOCATION Colorado Springs, CO UNITS 216 PURCHASE PRICE 27.6M Stratus Apartment Homes
Business Plan:
• The overall goal with Lincoln Springs is to improve the property operations through a variety of renovations and cost-cutting measures that will both generate profit during the ownership period and drive appreciation of assets for capital gains upon sale.
• Replacing all roofs immediately using an existing insurance claim
• Professionally manage the property for economic occupancy

• Drive value for current and future tenants through landscaping upgrades and interior renovations
• Increase asking rents by an average of 7%
Lincoln Springs Apartments PROPERTY DETAILS CLASS C CONSTRUCTED 1974 LOCATION Colorado Springs, CO UNITS 180 PURCHASE PRICE 19.5M
Business Plan:


• True value add opportunity, significant management challenges under previous ownership • Rebranded asset as “The Vue @ Chapel Hills” while creating a stronger reputation • Bring unit types up to quality of surrounding assets at $4,500 per unit • Update landscaping and provide additional amenities including a dog park, playground, grill station, and community garden The Vue at Chapel Hills PROPERTY DETAILS CLASS C CONSTRUCTED 1967 LOCATION Colorado Springs, CO UNITS 64 PURCHASE PRICE 7.55M
Plan:


Business
Newport Square Apartments (under contract) PROPERTY DETAILS CLASS C CONSTRUCTED 1974 LOCATION Colorado Springs, CO UNITS 180 PURCHASE PRICE 19.5M • Complete a full renovation of all unit interiors • Update the exterior landscaping and laundry facilities • Implement best-in-class management practices to drive tenant satisfaction
Index

Team
Management
Property
Our
DUNMIRE PROPERTY MANAGEMENT
Management
We are partnering with Dunmire Property Management to implement our business plan. To date DPM manages nearly 4000 units across the MSA, and nearly 500 units for Life Bridge Capital. The DMT team is dedicated to creating healthy communities across Colorado Springs and continues to be an excellent partner with Life Bridge Capital, delivering above pro forma performances at every project to date.
OUR GOAL:
Our Goal: Add amenities such as a soccer field, leasing office, and additional grilling stations to further position the property as a great community for families
Our Goal:
Update all 149 units with a full interior lift utilizing a mix of in-house and external contractors to keep on schedule.
Replace all windows on the property to drive utility savings for tenants and further enhance Copper Chase's standing with prospective tenants
Property
Team
Life Bridge Capital is a multifamily investment firm with over $100,000,000 of assets under management. Life Bridge is focused on acquiring properties in Rocky Mountain metropolitan statistical areas (MSA’s) which demonstrate consistent rent growth, low vacancy and a growing Real GDP. The firm repositions properties through operational efficiencies, moderate-to-extensive renovations and complete rebranding.
SAM RUST:
A lifelong learner, Sam Rust is a managing partner at Life Bridge Capital and full time investor in commercial real estate. Sam graduated from Thomas Edison State University with a BSBA in Business Management and currently lives in Colorado with his wife and 5 children. He has been active in commercial real estate since 2017 and has led the acquisition of a portfolio of properties across Colorado and Idaho with a value in excess of $100 million. When not underwriting or touring properties, Sam enjoys spending time outdoors with his family chasing beautiful views, Ultimate Discs, or big game.

Founder of Life Bridge Capital LLC, Whitney began his real estate investing career in 2009. Whitney’s passion is working with investors, helping them secure financial security via the exceptional opportunities that multifamily syndication offers. Whitney

hosts The Real Estate Syndication Show, a daily podcast where he has now interviewed over 750 experts providing cutting-edge tools and strategies of the syndication business. Whitney and his wife Chelsea are on a mission to help other families through the process of adoption. They have personally endured the financial burdens that the process puts on families and have committed 50% of their profits to this goal. Whitney and Chelsea have three children by adoption.
WHITNEY SEWELL:
Our

A Leading Multifamily Investment Firm sam@lifebridgecapital.com 720-230-6804 whitney@lifebridgecapital.com 540-585-4338 SAM RUST: WHITNEY SEWELL:
