ANNUAL REPORT


WE CARE


In our fully integrated value chain – covering about 70 companies and 6 000 employees – we work together to create the world’s most efficient and sustainable value chain for seafood.
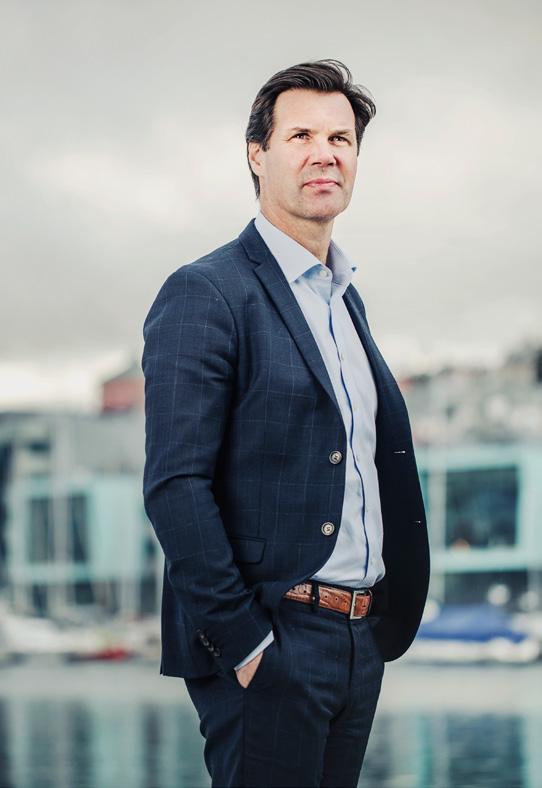
Henning Beltestad CEO
Lerøy Seafood Group
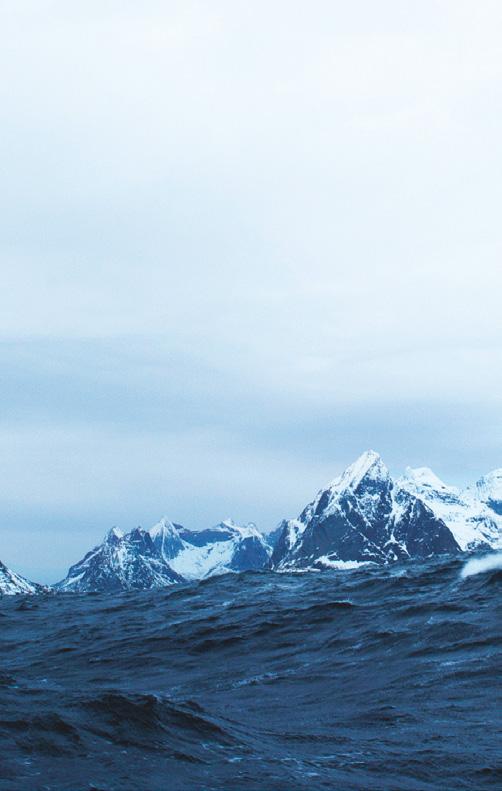
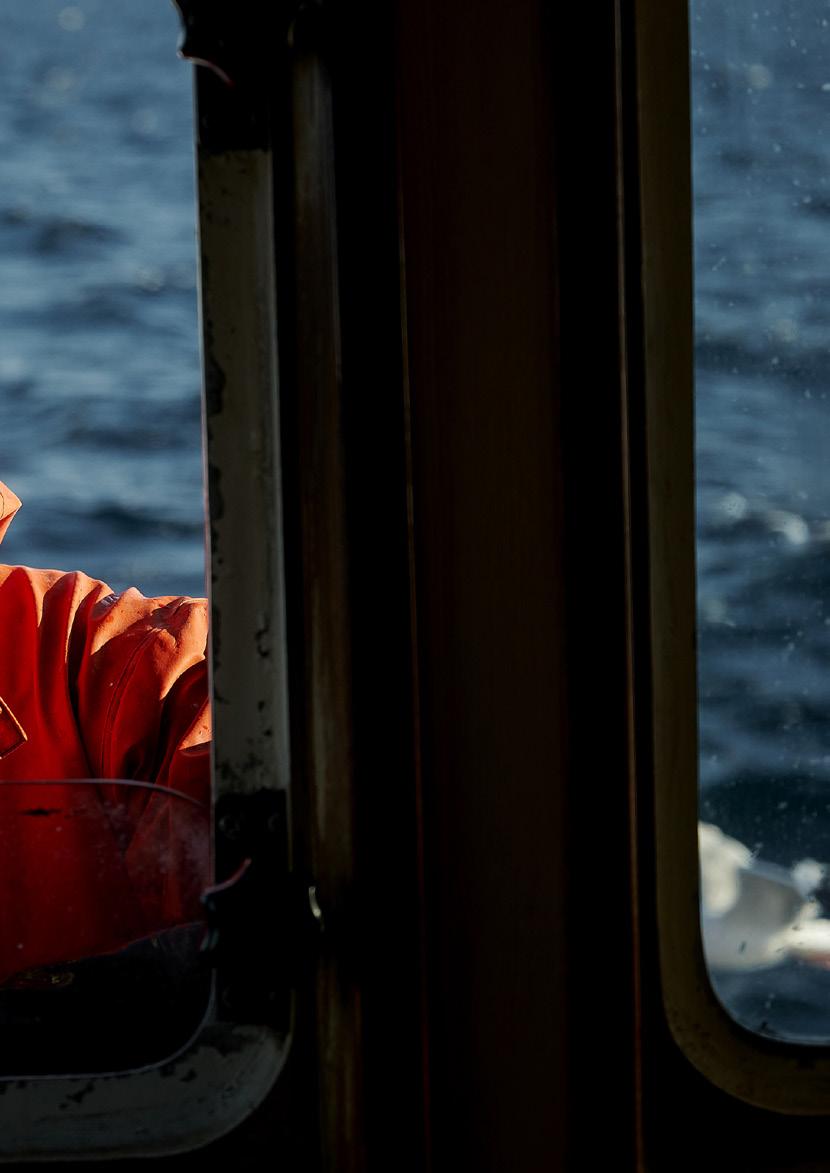
In the sea we found the source of life. In the fish we found our history. The basis of life along Norway’s coast.
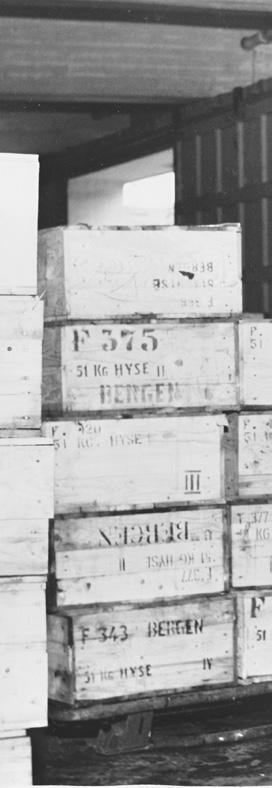
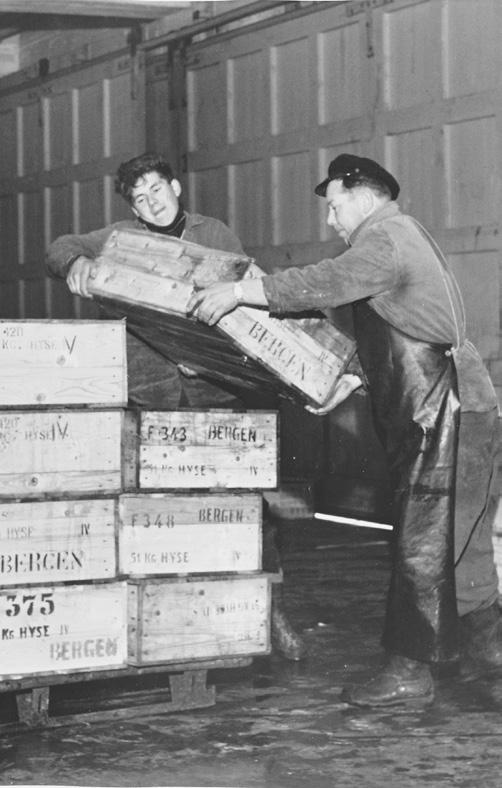
Lerøy Seafood Group ASA can trace its operations back to the late nineteenth century, when fishermanfarmer Ole Mikkel Lerøen began selling live fish at the fish market in Bergen.
The fish were hauled in corfs behind Lerøen’s rowing boat from the island of Lerøy to the market, a journey of six to twelve hours, depending on the prevailing winds and currents.
Lerøen’s commercial activities expanded to include retail sales in Bergen, the sale of live shellfish, and a budding export business. In 1939, two of his employees, Hallvard Lerøy Sr. and Elias Fjeldstad, established a wholesale and export company –Hallvard Lerøy AS. In time, the company invested in facility to process whitefish and pelagic fish and in fish farming. Poor results and thin capitalisation forced the company to close down or sell these operations in the early 1990s in order to safeguard what was then its core business: wholesale and exports. In 1994, the company carried out a last emergency share issue and started the process of re-establishing a healthy business. At that time, the company’s equity was valued at NOK 20 million, prior to an issue worth NOK 5 million.
The potential for growth within fish farming and increasing customer requirements necessitated a radical change in the Group’s business concept and strategy. Up to 1997, the Group was a family-owned operation. In 1997, however, a private placing with financial investors was carried out for the first time, aiming to develop the Group in every part of the value chain. This was the start of what was to become a series of major investments within fish farming. In 1999, the company acquired a minority interest in what was then Hydrotech-Gruppen AS. In the summer of 2001, Norskott Havbruk AS was founded with the sole purpose of acquiring Golden Sea Products, now Scottish Sea Farms Ltd., in the Great Britain.
The Group was listed on Oslo Stock Exchange in June 2002, providing access to the capital market for the Group and thereby strategic financial room to manoeuvre. Sufficient access to capital, in addition to expertise, have been critical factors in developing the Group from a wholesaler/seafood exporter to what is now a global and fully integrated seafood corporation. At the turn of the new millennium, large parts of the fish farming industry were seriously undercapitalised and suffering from the impact of a shortterm perspective and a lack of risk management.
Lerøy was in a good position in August 2003 when we purchased Nye Midnor AS as it was then called – the company that now makes up the main share of Lerøy Midt AS. The Group went on to acquire Lerøy Aurora AS in 2005, the remaining shares in Hydrotech-Gruppen AS in 2006, Lerøy Vest in 2007 via a business combination, and a majority shareholding in Sjøtroll Havbruk AS in 2010. The acquisition and demerger of Villa Organic were conducted in 2013 and 2014. The abovementioned companies, a number of minor acquisitions, highly skilled local management and organic growth have allowed Lerøy to develop into one of the world’s largest producers of Atlantic salmon and trout
Over time, the Group has made substantial investments in the VAP, Sales and Distribution segment. These investments have provided growth opportunities in relation to the sale of own-produced salmon and trout, creating a wider product range and opening the door to new markets.
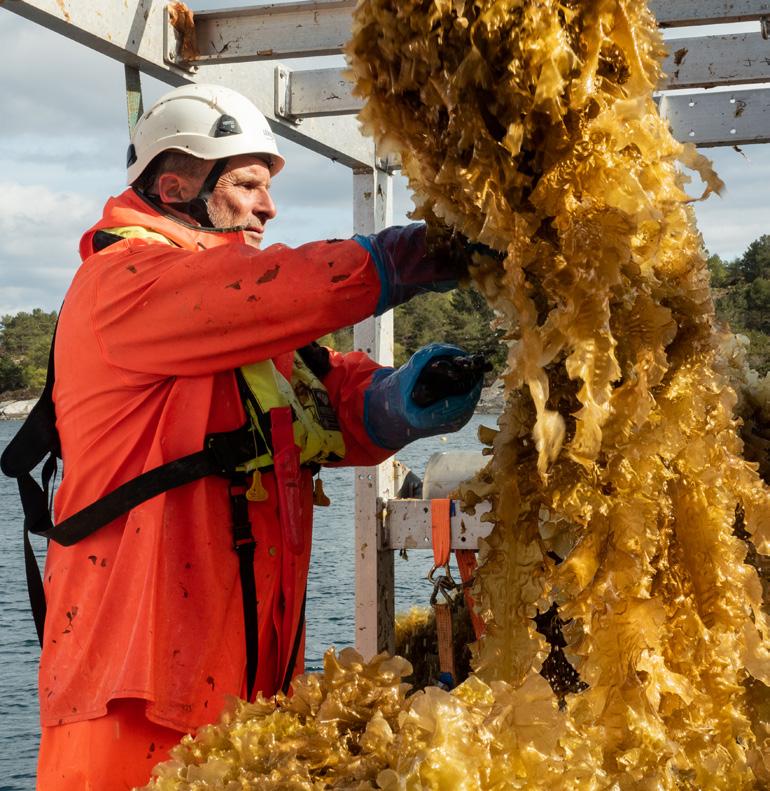
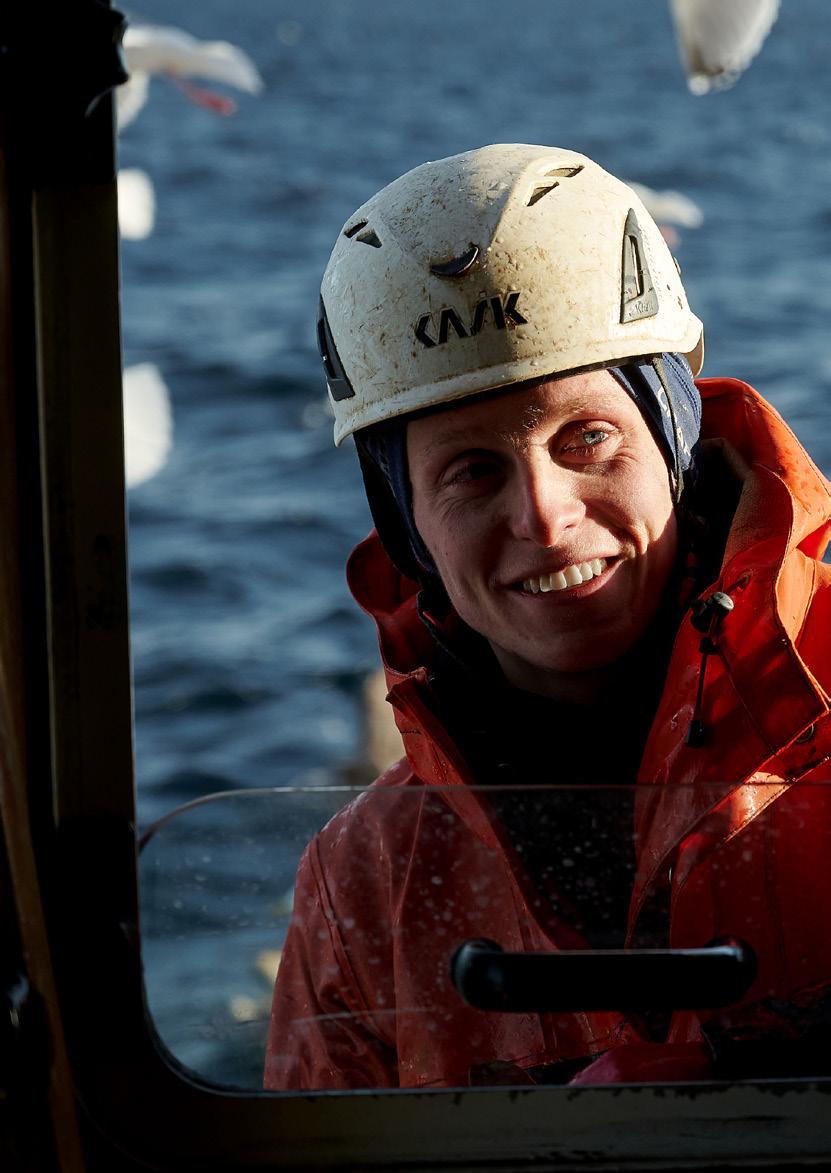
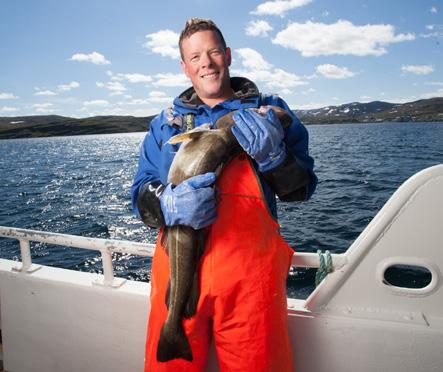
When people buy fish in the shop, they can feel confident that the fish they are going to eat is of high quality.”
- Mate Elise Kristin Gutze, fisher Lerøy Havfisk
The Group made its ambitions clear in 2002 by obtaining fish-smoking capacity in Sweden (Lerøy Smøgen). In 2005, it invested in a whitefish processing facility in Bulandet (Bulandet Fiskeindustri), to further expand the product range. In 2006, the Group expanded its high-value processing plant for trout and salmon on the island of Osterøy (Lerøy Fossen). The Group acquired 50.1% of the shares in Dutch seafood company Rode Beheer BV Group in 2012 and the remaining 49.9 % in 2016. The Group has subsequently gone on to expand capacity at all its existing plants. The new Lerøy Seafood Centre factory in Urk, the Netherlands, has a very high level of automation and technological innovation for the production of smoked and freshly packaged products and is one of Europe’s most modern factories for these types of products.
Unfortunately, the framework conditions for industrial development in Norway have steadily worsened most recently by the Norwegian government resource tax proposal. The incentives for moving production to low-cost countries are high. Lerøy has done its outmost to balance this trend, with investment in which automation plays a key role. In Lerøy Midt, a new state-of-the-art factory on the island of Jøsnøya, Hitra, launched production in 2018. In Lerøy Sjøtroll in 2023 a rebuilt and new facility will launch production at Austevoll. The Group had also initiated building of a new factory in Lerøy Aurora in 2022, but this had to be stopped following the Norwegian governments resource tax proposal in September 2022.
It`s important for me to use as much as possible of the fish to food. In that way we also get more and more sustainable.”
- Thomas Paiva, Team Leader, frozen salmon and trout
In the autumn of 2016, the Group embarked on a new and exciting journey, acquiring 100% of the shares of both trawler company Havfisk ASA (now Lerøy Havfisk ASA) and Norway Seafoods AS (now Lerøy Norway Seafoods AS). In 2017, whitefish was fully integrated into the Group’s well-established value chain, in fact, 2017 will go down as one of the most important years in the company’s long history. Since then, the Group has continued to invest in modern new trawlers and industrial facilities. Lerøy is now a fully integrated company, controlling the entire value chain for a full range of seafood products – from the sea to the consumer.
Ever since its foundation, the Group has taken a pioneering role in a number of areas in the Norwegian – and consequently, international – seafood industry. We have mainly focused on developing markets for seafood. The Group has repeatedly been the first to launch in new markets or commercialise new species. One of our goals is to be an innovator within seafood, preferably in cooperation with the end customer. This is important not only for product development but also for other areas, such as developing efficient logistics and distribution. The pioneering spirit is still very much alive within the Group.
The Group’s ambition to increase demand for seafood in the form of new products for new markets has always been the driving force behind the Group’s investments in the VAP Sales and Distribution segment. This segment not only sells its own production of salmon, trout, and whitefish products but also collaborates actively with third parties, ensuring a wide productrange within seafood.
Distributing fresh seafood requires quality throughout the entire organisation, flexibility, continuous supply, and a high level of service. To be at the forefront of the ‘revolution’ in the distribution of fresh seafood, the Group has made significant investments in factory capacity in recent years. These investments have been made in what are known as ‘fish-cuts’, processing facilities where proximity to the customer is key. Today, the Group has a number of fish-cut facilities across Europe. Lerøy Spain has achieved impressive growth in ready-to-eat meals and sushi, and over the past five years, has built factories in Madrid, Barcelona, Valencia, Alicante, and Gran Canaria. In 2021, the company opened its first factory in Italy, in Porto Viro, south of Venice. Also, in 2022, the Lerøy Seafood AB, Kungälv, centre opened just north of Gothenburg, Sweden. The Group currently sells seafood to more than eighty markets worldwide.
Every single day, all year round, our 5 972 employees contribute to the supply of Norwegian seafood, supplying 5 million meals to more than eighty different markets.
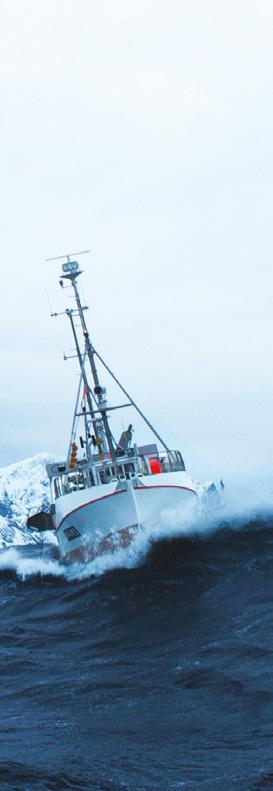
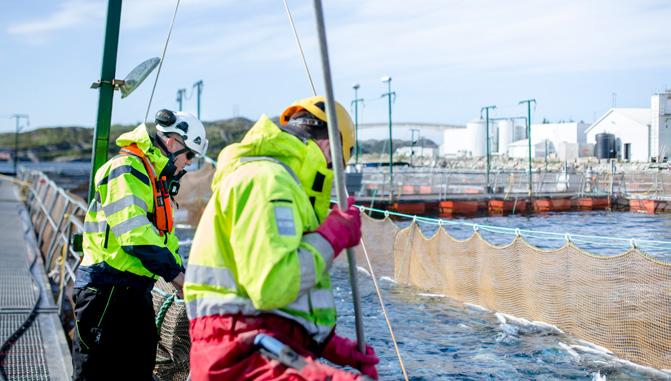
Our main office is located in Bergen, but we have fishing vessels and fish farms operating along the entire coast of Norway. Lerøy owns 10 trawlers and receives regular deliveries from more than 600 vessels fishing along the coast. These vessels make daily deliveries of whitefish to onshore
stations, where the fish is processed and packaged, while well boats transport salmon and trout from our fish farms in North Norway, Central Norway, and West Norway to packaging plants for processing. Along with our production and packaging plants in Norway, we have production and distribution in Sweden, Denmark, Finland, France, the Netherlands, Portugal, Spain, Italy and Turkey. The Group have sales offices in Japan, China, the USA and the UK.
The nineteenth-century fishermanfarmer, Ole Mikkel Lerøen, who would row to the market in Bergen to sell live fish, probably had no concept of what he was starting – a commercial enterprise that 120 years later would serve the entire world 1.8 billion seafood meals every year.
Today, Lerøy is a world-leading seafood corporation, supplying thousands of different products to shops, restaurants, canteens, and hotels worldwide.
Lerøy Hydrotech LSG's first investment (associate) in salmon production
Lerøy Sverige Investments in VAP, sales and distribution
Scottish Sea Farms Investments via 50% shareholding in Norskott Havbruk AS
Lerøy Midnor AS Farming – acquisition of 100% of the shares. Now part of Lerøy Midt AS
Lerøy Aurora AS Acquisition of 100% of the shares (Aurora Salmon AS)
Alfarm Alarko Lerøy (Associate) Partnership entered into with Alarko Holding in Turkey
Lerøy Vest AS Acquisition of 100% of the shares via business combination
Austevoll Seafood Reduces its shareholding in LSG from 74.93% to 63.74%
2000
2001 1999
2002 Stock Exchange listing and Capital injection
Lerøy Smøgen Investments in VAP, sales and distribution –smoking company
2003
2004
Lerøy Portugal Investments in VAP, Sales & Distribution. Acquisition of 60% of the shares (Portnor Lda)
2005
2006
Lerøy Hydrotech Acquisition of 100% of the shares. Currently part of Lerøy Midt AS
Lerøy Fossen AS Acquisition of 100% of the shares in Fossen AS. Investments in VAP, sales and distribution
Investments in wholesale operations (VAP, sales and distribution) resulting in nationwide distribution of fresh fish
2007
2008
2009
2010
Austevoll Seafood Increases its shareholding in LSG from 33.34% to 74.93%
Lerøy Sjøtroll AS Acquisition of 50.71% of the shares in Sjøtroll Havbruk AS
Lerøy Finland
Acquisition of 68% of the shares in Jokisen Evää OY.
Investments in VAP, sales and distribution
Lerøy Midt AS
Opening of new smolt facility in Belsvik with RAS technology in (what is now) Heim municipality, Trøndelag, with production capacity of 14 million fish per year
Expansion of production capacity for Lerøy Fossen and Lerøy Smøgen
Cleaner fish
Shareholding in Norsk oppdrettsservice AS increased from 34% to 51%
Senja Akvakultursenter AS
Acquisition of 100% of the shares in Senja Akvakultursenter AS Seistar Holding AS Acquisition of 50% of the shares in the well boat company
Lerøy Turkey Shareholding increased from 50% to 100% (former Alfarm Alakro Lerøy)
Integration of Lerøy Havfisk and Lerøy Norway Seafoods in the value chain
Rode Beheer New industrial building in Urk, the Netherlands
Lerøy Midt
Construction of new factory on Jøsnøya island, Hitra
Lerøy Norway Seafoods
Converted factory in Stamsund in Vestvågøy municipality for production of processed fish and ready-to-eat products
Lerøy Midt
Official opening of new factory on Jøsnøya island, Hitra municipality
Lerøy Sjøtroll
First release of smolt from new RAS production facility for large smolt in Kjærelva, Fitjar municipality
Lerøy Processing Spain
Opening of new factory on Gran Canaria and new, larger factory in Madrid
Lerøy Seafood Italy SRL
Opening of production facility in Porto Viro, south of Venice
Seafood Danmark
Lerøy increases shareholding in seafood group Seafood Danmark from 33% to 78%
Scottish Sea Farms
Lerøy and Salmarowned Scottish Sea Farms (SSF) acquire Grieg Seafood Hjaltland, making SSF Scotland’s second largest fish farming company
Rode Beheer BV
Shareholding in the Dutch seafood group increased to 50.1%
Lerøy Aurora AS Villa Organic AS is demerged, and Lerøy Aurora gains eight new licences for consumer products
Investment in fish-cut
Investments in new factories in Norway, Spain, France and Denmark
Lerøy Havfisk and Lerøy Norway
Seafoods
Acquisition of 100% of the shares in Havfisk ASA (now Lerøy Havfisk ASA) and Norway
Seafoods Group AS (now Lerøy Norway Seafoods)
Investments in VAP, sales and distribution of whitefish
Rode Beheer BV
Acquisition of remaining 49.9% of the shares (VAP, sales and distribution)
Lerøy Aurora AS
Opening of new smolt facility with RAS technology in Laksefjord, Lebesby municipality, Finnmark
Lerøy Havfisk
Delivery of new stern trawler (“Nordtind”) from Vard Søviknes
Lerøy Midt Production starts at new factory on Jøsnøya island, Hitra municipality
Lerøy Processing Spain
First factory in Madrid (2014) followed by opening of factories in Barcelona, Valencia and Alicante
Lerøy Havfisk
Delivery of stern trawler “Kongsfjord” from Vard Søviknes
Lerøy Aurora
Construction phase 3 and extension of production of large smolt completed at the RAS facility in Laksefjord, Lebesby municipality
Lerøy Midt
Construction start for extension of RAS facility in Belsvik, Heim municipality, for production of large smolt
Lerøy Midt
Expansion of Belsvik completed
Lerøy Sweden
Opening new seafood centre
Capital markets day
First CMD held in September
Climate
PWC announces Lerøy as one of Norway`s climate winners in 2022
Our employees are the Group’s most important resource. Together, we provide healthy and delicious highquality seafood, allowing us to make forward-looking and sustainable use of the resources in the sea. We are proud of our interaction with all our employees throughout the value chain and with our partners, and we are proud of our contributions to society.
Lerøy is part of a global industry subject to continuous developments and extremely tough competition. We are grateful to have so many talented and flexible employees on our team who are willing to learn, help us achieve our vision, reach our goals, and reinforce the ‘One Lerøy’ culture moving forward.
Earnings for Lerøy over the past five years have been good, from an historic perspective. At the same time, we know there is major room for improvement. As a fully integrated
seafood company, we have unparalleled opportunities to drive the development of our value chain and product categories, in collaboration with key end customers worldwide. The future development of our company will be determined by our ability to improve continuously, increasing efficiency, innovation, and sustainable solutions throughout the value chain. To sustain our competitive strengths in an industry exposed to global competition, we have to work extremely hard to develop our operations, keeping the customer in mind at all times and basing our activities on our values. In 2017, we started developing the Lerøy Way, a system for continuous improvement, tailored to our operations. The Lerøy Way was implemented after a year in which we reported record-high results and represents our guiding principles for how to grow together as one company – One Lerøy.
The company’s core values Lerøy Seafood Group’s core values are honest, open, responsible, and creative. These values are based on the Group’s vision of becoming the world’s leading and most profitable global supplier of sustainable quality seafood.
To ensure that every employee is familiar with the Group’s values and what these imply, we have translated our values into the local language in each country where we have operations, making sure they are easily available for all employees online, on our Intranet, and in brochures. For us, it is important that our values guide all our actions. We therefore launched the Lerøy leadership standard in 2020. We also measure the extent to which we live up to our values via an annual employee survey sent to every company in the Group.
By standardising and working more closely together as One Lerøy, the Group will be better able to utilise strategies and opportunities. This will deliver more efficient operations across the value chain, increase synergies, improve expertise sharing, increase long-term value creation, and create a winning culture.
Together, we shall create the world’s most efficient and sustainable value chain for seafood.
We shall be the leading and most profitable global supplier of sustainable highquality seafood.
Safe, sustainable, quality seafood
Environmental vision
Take action today to make a difference tomorrow
Values
Honest
Open Responsible Creative
Unique alone stronger together
Lerøy works continuously on sustainability in every part of the value chain. We prioritise:
- Environmental sustainability
- Social sustainability
- Economic sustainability
Our focus on improvements in these areas continued in 2022 , and will continue in 2023.
To address environmental sustainability, we continued to work towards the Science-Based Targets set for the whole Group in line with the 1.5-degree target: electrifying barges and boats, participating in the Green Shipping Programme, and joining projects related to air transport and fish feed. The Group was among the ten companies named “Climate winners” in PWC Norway’s 2022 Climate Index. We have also made improvements, working to reduce food waste and avoid using plastics that cannot be recycled or reused, as well as joining projects involving fish health and welfare, lice, various certification schemes, and raw materials for feed. We keep taking steps to see that we do not contribute to deforestation when producing raw materials for feed, and we invest resources to identify new alternative raw materials for fish feed.
In 2022, we carried out a number of initiatives for social sustainability. Through activities such as leadership training programmes, trainee programmes, and e-learning, we provide training and development for our employees. We have increased the range of language courses offered to our employees, which is particularly important in a multicultural working environment. Our annual employee survey - Great Place to work - which shows how our employees experience working in the Group,
indicates a positive development from the previous year and that our employees are strongly committed.
To contribute to the communities where we operate, we sponsor initiatives and sustainable activities such as sports, culture, and education. Various 2021 initiatives also continue: supplier follow-up, economic impact analyses for all our operations in Norway, digitisation, HSE projects, and platforms established for collaboration with local communities and other stakeholders. We have established a new site on our websites to inform our suppliers about any requirements we have for them. Our external whistle-blowing channel allows whistle-blowers to report anonymously on our website, leroyseafood.com.
During 2022, the Group conducted due diligence assessments internally and externally, with a special focus on the respect for fundamental human rights and decent working conditions, as part of the implementation of the Transparency Act. The results will be published on the Group’s website by 30. June 2023. The general public can contact the Group through a contact form on our web pages to request information about the Transparency Act.
Following the challenging pandemic years, 2022 saw a significant increase in demand for the Group’s key products. The Group’s business model and strategy have once again proven to be financially sustainable. On 28. September 2022, the Norwegian Government tabled a proposal to introduce resource tax in the Norwegian aquaculture industry, with a conclusion in Parliament likely before summer 2023. Such a tax would add uncertainty to our financial sustainability, as well as our ability to invest in environmental sustainability.
Through 2022 the company dealt with both peaks and troughs.
“We emerged from a pandemic straight into a new phase with an outbreak of war in Europe. A demanding situation for customers, employees and not least the logistics, which required rapid adjustment. Nevertheless, we experienced an enormous demand for our products, with the Group posting its highest-ever revenue in 2022,” says Henning Beltestad, CEO of Lerøy Seafood Group.
At the same time, the introduction of the resource tax came as a surprise, and a very challenging one. It created, and continues to create, significant uncertainty for the company, and its employees, customers and suppliers.
“It’s been an incredibly difficult situation to handle, but we’re a dynamic company, and our employees have hung in there and done everything they could under extremely challenging conditions. It’s frightening how the politicians are treating an industry that is so important to Norway.”
A lot has happened since Ole Mikkel Lerøen started selling live fish at Bergen’s fish market. He could scarcely have imagined the global seafood corporation that Lerøy would be now, around 125 years later. Today the Group has operations within both wild catch and farming, as well as a large portfolio linked to industry, processing, sales and distribution.
“When I started at Lerøy, our turnover was around a billion Norwegian kroner. Now we’re up to 27 billion, and we have big growth ambitions going forward.”
“Controlling the entire value chain gives us a unique basis for building the most efficient and sustainable value chain for seafood,” the CEO explains.
Lerøy has a fantastic launch pad for continued growth and development. Our products are healthy and tasty, and produced in a way that means they have a low climate footprint compared with other sources of animal protein.
“Our target is to achieve revenue of 50 billion kroner in 2030,” he says.
“It’s an ambitious target, but it’s important for the company to have something that drives us. This drive has been fundamental to Lerøy’s history, and it’s fundamental to its future. It has facilitated the company’s growth and its journey from family-owned to listed company.”
Henning Beltestad may have had saltwater running in his veins from a young age. In any case, he became aware of the seafood industry at an early stage, but it would take today’s CEO three attempts to get a foot in the door at Lerøy. That was 30 years ago.
As the grandson of a fisherman and son of an oceanographer, it was little surprise that the economics student’s compass pointed him towards Lerøy.
“My dissertation really opened my eyes to the salmon market and Lerøy in particular. At the time, Lerøy was a stalwart pioneer in an emerging industry,” Henning Beltestad explains from the head office at Marineholmen in Bergen.
At the third attempt, his job application was successful, and his first role involved sale of processed salmon products. Since then, both he and Lerøy have prospered, and evolved in step.
“I’m unbelievably proud to be part of Lerøy. As a Group, it’s always been evolving, wanting to innovate and grow. It’s part of our culture, and that’s
something that really motivates me.”
For Lerøy to continue to grow and evolve, it needs employees with the right skills and attitudes – people who are willing to learn and who identify with the Group’s values.
“At Lerøy we believe sharing experience and collaborating across our value chain are important. We devote significant resources to offering our employees a wide range of training, with leadership development and sharing expertise at its heart. Creating a learning organisation and developing our employees are two of the Group’s strategic priorities.”
Seven years ago, together with Bergen’s seafood cluster, Lerøy started a collaboration with the University of Bergen and the Norwegian School of Economics, launching new study programmes to provide the skills needed to work in the seafood industry.
”At the time, recruiting new employees with the right qualifications was challenging. Now we’re reaping the benefits of the long-term strategies we put in place then.”
“I’m proud that we’re considered an attractive employer for students and new graduates, and we see immense value in introducing fresh skills throughout our value chain.”
Initiatives such as apprenticeship positions, trainee programmes, internships and collaboration with educational institutions have had a positive effect, and we’re seeing more new graduates wanting to work in the industry of the future. This is an area Lerøy will continue to focus on in the future.
The silver of the sea and the gold of the coast
“We have to be able to balance both short- and long-term strategic goals. In 2022, we’ve worked hard on strategy, targets and target-oriented management in the Group, in our segments and in the individual companies. Presenting this work in an accessible way is crucial if we’re to take all our employees with us on the journey to what we as a Group want to achieve.”
Lerøy’s employees are absolutely vital to its future. Around 6,000 employees work together every day to develop the company in an eternal perspective.
“Sustainability work is strong in the organisation, and is something our stakeholders are interested in too. Our goal is to be the most sustainable participant in the seafood industry, and we’ve therefore implemented KPI `s to help us get there. To reach our goal, it’s important that we work in all parts of our value chain and establish close cooperation with our suppliers – achieving our target depends on having them onside.“
Whichever area we’re targeting, adopting a long-term perspective will be vital to our success. At the same time, offering competitive and stable framework conditions is a key premise for success.
“We have to be patient. We won’t get everything done in a week or two, but with the talented people we have at Lerøy, I’m confident that we’ll achieve the goals we set ourselves for the future. I think a lot about doing the right thing for the next generation, and about the legacy we’re creating. As a responsible participant in the seafood industry, we must ensure that the silver of the sea continues to be the gold of Norway’s coast, from north to south, in the years ahead,” says Henning Beltestad.
– At Lerøy we believe sharing experience and collaborating across our value chain are important.”
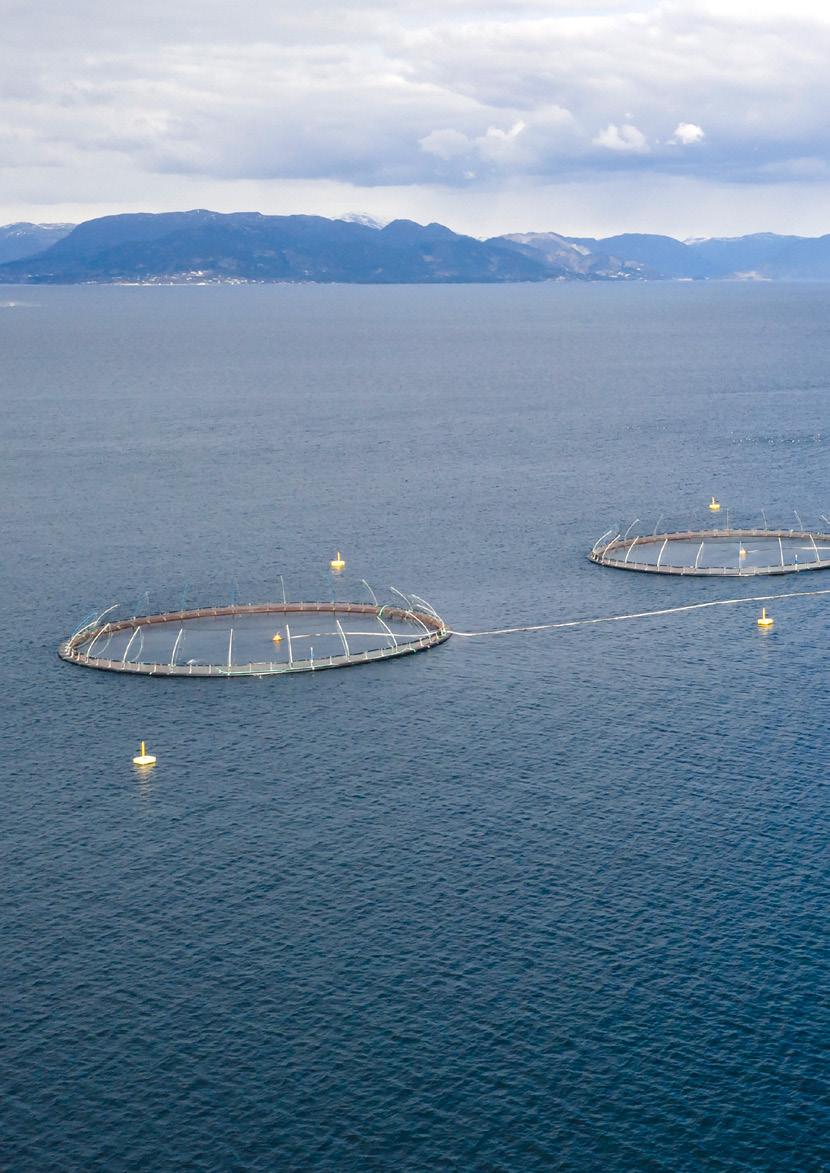
Lerøy is actively involved in every stage of the production of salmon and trout, and in the catching and processing of whitefish and shellfish. In other words, Lerøy is not only involved in fisheries and farming but packages and processes the fish in its plants and distributes thousands of different seafood products to shops, restaurants, canteens, and hotels – in more than eighty different countries worldwide.
One important element in Lerøy Seafood Group’s strategy is to be a fully integrated supplier of the Group’s key products. The business currently operates via a number of subsidiaries in Norway and abroad.
The Group reports within three segments
• Wild Catch
• Farming
• VAP, Sales and Distribution
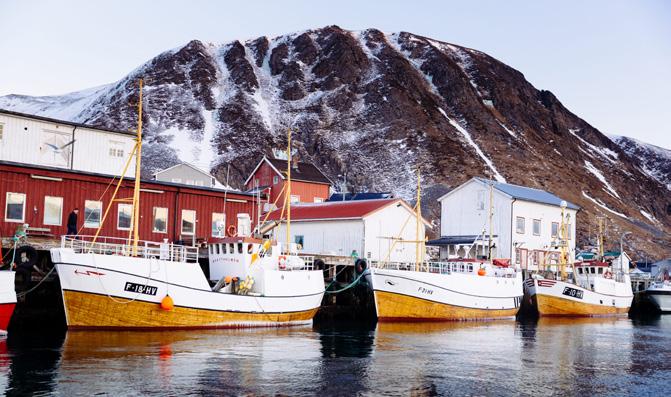
The Wild Catch segment consists of businesses acquired in 2016, when Lerøy Seafood Group became the sole owner of both Havfisk AS and Norway Seafoods Group AS. These businesses have substantial operations for the catching and processing of whitefish in Norway. Lerøy Havfisk currently has ten trawlers, while Lerøy Norway Seafoods runs factories in Berlevåg, Båtsfjord, Kjøllefjord, Melbu, Stamsund, Sørvær, and Hammerfest.
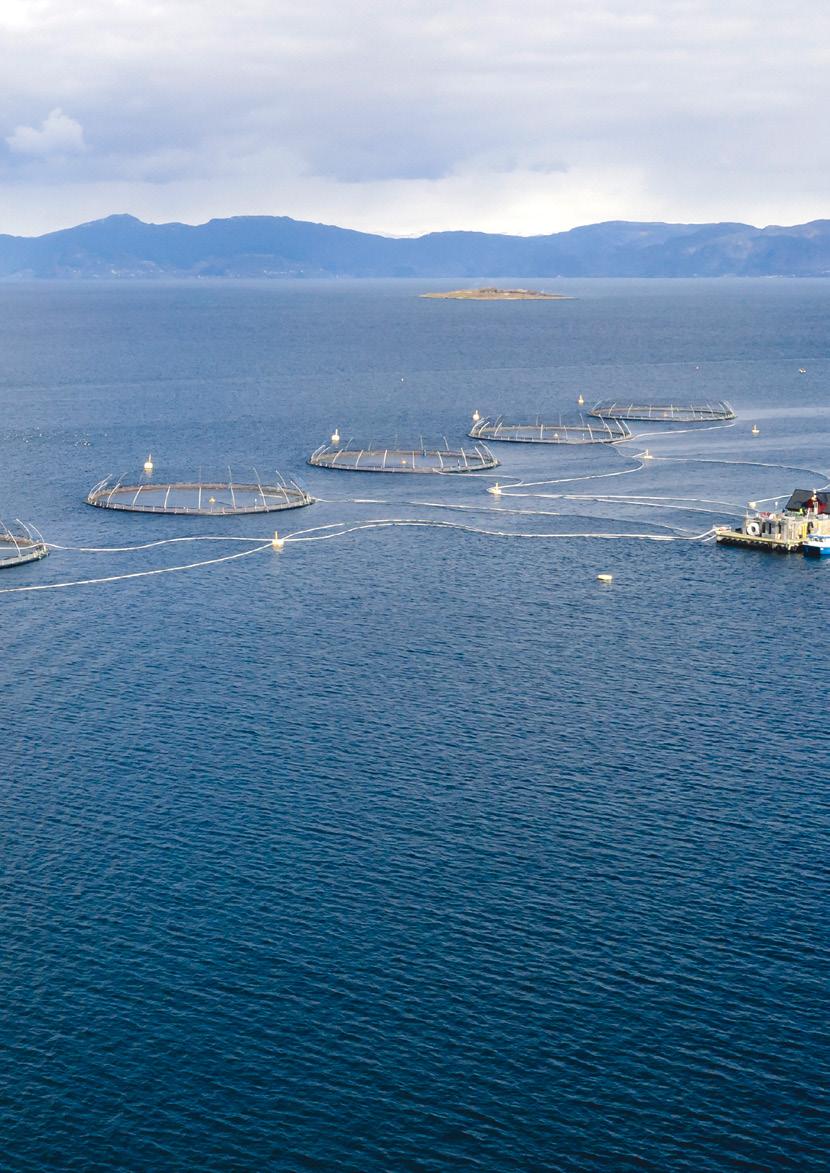
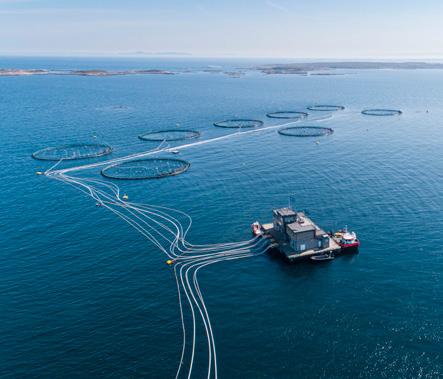
The Farming segment comprises the Group’s production of salmon, trout, and cleaner fish up to the time of harvest. The Group has three fully integrated value chains for producing salmon and trout, located in North Norway, Central Norway, and West Norway. The Group’s companies in this segment – Lerøy Aurora (North Norway), Lerøy Midt (Central Norway), and Lerøy Sjøtroll (West Norway) –are major employers along the Norwegian coastline and strive to be visible and active in all the regions in which they operate.
Lerøy has a global reach within the VAP, Sales and Distribution segment. The company works with sales, market and product development, distribution, and the value-added processing of the Group’s own raw materials and a significant volume of raw materials from partners and suppliers. Lerøy Seafood Group has wholesalers and processing facilities in a number of different markets worldwide: Norway, Sweden, Denmark, Finland, the Netherlands, Spain, France, Portugal, Italy, and Turkey. In addition, we have a sales presence in the UK, the USA, China, and Japan. The segment’s activity is increasing globally.
17.1%
17.0%
Proposed dividend in relation to profit/loss
81% 81% 70%

In 2022, Lerøy Seafood Group had more than 5 100 different suppliers nationwide.
Own activity Suppliers
Payable taxes Lerøy Seafood Group
Figures in MNOK
60 municipalities NOK 611 million

We had own operations in approx. 60 municipalities in Norway.
NOK 18.9 billion
We purchased goods and services worth NOK 18.9 billion excluding internal purchases from about 300 different Norwegian municipalities.
Our employees paid tax to different municipalities amounting to NOK 611 million.
* Turnover includes own employees, hired employees, part-time employees and temporary employees.
*
Number of managers in the Group with responsibility for personnel
460
Percentage of female managers 25.0%
Percentage of male managers 75.0%
Percentage of female managers 37.5%
Percentage of male managers 62.5%
2 555 3 273 5 289
* Some national legislations prohibit employers from asking whether an employee is in a trade union. The figure specified originates from employees who have actively chosen to deduct their trade union membership fee on their pay slip.
* In 2022, the Group has focused on increasing the reporting of safety observations and near misses in order to reduce actual injuries.
CO2e emissions for fish are in general low. When compared with other types of proteins we eat, fish is one of the proteins with the lowest footprint.
1: Use of fossile fuels
3: The suppliers use of fossile fuels and energy on goods that are delivered in our value chain
* A key change from previous year’s reporting is that a major part of well-boat and service boat activity (time chartered vessels) is moved from Scope 3 to Scope 1 tall og Farming.
Antibiotics
The use of antibiotics is almost at zero in the Norwegian fish farming industry. Lerøy Seafood Group applies a very restrictive policy when it comes to use of antibiotics, and use is only on exception and to safeguard fish health.
The company once again reported a low figure for accidental release in 2022. The figure was 10 544 fish, up 10 540 fish from 2021. 8 976 fish was linked to an incident where the well boat was responsible
Antibiotics used in sea, kg active substance
2022: 0.00
2021: 0.00
2020: 18.99*
Antibiotics used on shore, kg active substance
2022: 0.00
2021: 0.00
2020: 0.00
* Antibiotics were used at one locality for fish welfare considerations
fish
The level of fully grown lice has been relatively stable in recent years.

Long before the discovery of Norway’s black gold, the sea’s silver was the basis for a renewable industry. A legacy we manage, develop and share.
In this chapter, the Board of Directors of Lerøy Seafood Group will provide a description of its corporate governance. The Board of Directors is of the opinion that clear and effective corporate governance is decisive in sustaining and strengthening confidence in the company and contributing to optimal value creation, over time, in a sustainable manner.
The Group’s corporate governance is based on the Norwegian Code of Practice for Corporate Governance (NUES), dated 14 October 2021; see also www.nues.no. The NUES Code of Practice complies with Norwegian legislation governing limited liability companies, accounting, and securities trading, as well as issuer rules for the Oslo Stock Exchange in force as of 1 October 2021. In addition, the NUES publishes recommendations and guidelines that provide more detailed information and are more extensive than the above mentioned acts. This chapter has the same structure as the NUES code, and all items in the Code are included. Any differences are explained.
The Board of Directors of Lerøy Seafood Group prioritises effective corporate governance, with a clear division of responsibilities between shareholders, the Board of Directors, and company management. The goal for Lerøy Seafood Group is for all parts of the Group’s value chain to operate and achieve growth and development according to the Group’s strategy for long-term and sustainable value creation for shareholders, employees, customers, suppliers, and society at large.
The company’s core values
Lerøy Seafood Group’s core values –honest, open, responsible, and creative – are based on the Group’s vision to be the world’s leading and most profitable global supplier of sustainable quality seafood. The Group’s core activities comprise a vertically integrated value chain for the production of salmon and trout; catches of whitefish; the processing, purchasing, sales, and marketing and distribution of seafood; product development, and the development of strategic markets. The Group emphasises quality and
sustainability in all parts of the value chain.
According to Lerøy Seafood Group’s Articles of Association, the company’s purpose is as follows: Fisheries, fish farming, processing, sales, and distribution within the seafood industry and related industries and operations. Such activities may be performed either directly or via participation in other companies with similar or equivalent objectives, and all activities related thereto. The parent company’s Articles of Association reflect the totality of the Group’s value chain and core activities. The Group’s goals and main strategies are set out in the Group’s annual report (go to https:// www.leroyseafood.com/en/investor/ reports-and-webcast/annual-reports/) and can be summarised as follows:
The Group’s goal is to create the world’s most efficient and sustainable value chain for seafood.
The Board of Directors has a clearly defined goal for the company to create value for its shareholders, employees, and other stakeholders in a sustainable manner. In this regard, the board will take into account economic, social, and environmental factors. Both shortand long-term goals are established together with the corporate management, in addition to strategies that reflect the company’s risk profile.
The Group made a new assessment in 2022, in accordance with the requirements in the Global Reporting initiative (GRI) 2021. The purpose of the assessment is to identify significant conditions where Lerøy has an actual or potential (significant) impact on financial results, people, or the environment. This includes both an impact directly caused by Lerøy and
the impact that we have, or may have, throughout our entire value chain.
The Group is aware of its responsibility regarding ethical conduct, society at large, and the environment. In addition to its common values, Lerøy Seafood Group has prepared a Code of Conduct that aims to establish common principles and regulations for all employees within Lerøy Seafood Group, its subsidiaries, and its partners. The Code of Conduct reflects the Group’s values and helps its employees and partners choose the correct principles to apply with regard to human rights, business conduct, impartiality, conflicts of interest, political activity, entertaining customers, processing information, confidentiality, relationships with colleagues, business
partners, corruption, whistleblowing, bribes, etc. Each employee is individually responsible for practising the Code of Conduct. The Group has prepared an ethics test for employees, to help them make the right decisions.
Each year, the Board of Directors shall revise the guidelines for employees’ rights as related to diversity, working conditions, and the working environment.

During 2022, the Group carried out due diligence assessments internally and externally, with a special focus on the respect for fundamental human rights and decent working conditions, as part of implementing the Transparency Act. The results will be published on the Group`s websites before 30 June 2023.
The Group has developed a web page
for suppliers, on the Group’s global website. On this page, old and new suppliers can find information about what expectations the Group has of its suppliers. The Group has developed a new Lerøy Supplier Code of Conduct and a Lerøy Supplier Declaration Form that can be found on the supplier webpage. These documents clarify the Group’s supplier requirements and will ensure further supplier development, in a sustainable direction. In the documents, special emphasis is placed on promoting the Group’s respect for human rights and decent working conditions, as well as measures taken by the Group against corruption and money laundering.
To request information pertaining to the Transparency Act, the general public can contact the Group through a contact form on the Group’s webpages at www.leroyseafood.com.
Lerøy Seafood Group has a general rule that the Group, along with all its business partners, shall comply with legislation governing the Group’s respective locations, and with the company’s own quality systems and procedures. The Group has a principal rule that the strictest requirements shall be met. The company’s management is responsible for ensuring compliance with regulations. All employees shall have orderly working conditions, comprising a personal written employment contract, the correct salary, sufficient training, follow-up throughout employment, and the right to organise. The company focuses on equal rights for women and men and has in recent years witnessed an increase in the number of its female employees. More details regarding the Group’s work towards equality, nondiscrimination and gender pay (ARP) is included in the Group`s Equality, Non-discrimination and Gender Pay
report (ARP) in the Group`s sustainiability library.
Guidelines support the Group’s goal, which is to contribute positively and constructively to human rights, labour rights, and environmental protection, and prevent child labour, both within the Group, in relation to suppliers and subcontractors, and in relation to other trading partners. The company’s Code of Conduct is incorporated into agreements with the Group’s suppliers and subcontractors.
The Group has established a system for anonymous whistle-blowing via a thirdparty company, for employees who wish to report censurable conditions. In the event of nonconformities, measures shall be implemented to improve the situation. A whistleblowing committee has been established, covering the entire Group. The committee processes cases and implements necessary
measures. The Group has also facilitated external whistle-blowing via the Group’s website, where the whistle-blower may choose to be anonymous.
As part of the Group’s integrated reporting, the annual report contains a list of focus areas, key performance indicators, and goals related to environmental, social, and economic sustainability. We have developed a sustainability library to describe how the Group works towards social and environmental sustainability. This library is available on the Group’s website, leroyseafood.com.
The Board of Directors emphasises the importance of Lerøy Seafood Group having a clear and predictable dividend policy adapted to the company’s goals, strategy, and risk profile. Dividends should be distributed in accord with the company’s financial strength, growth, and profit performance.
The company’s dividend policy implies that, over time, dividends should lie in the region of 30-40% of profit after tax. However, care must be taken at all times to ensure that the Group has satisfactory financial contingency to be able to conduct any new and profitable investments. The goal is for financial value creation to increasingly take the form of higher share prices, rather than declared dividends. The Board of Directors is of the opinion that the distribution of dividends in previous years reflects the Group’s dividend policy.
Late in 2022, the Norwegian Government proposed the imposition of a resource tax on the Norwegian aquaculture industry. This tax will likely be made law before summer 2023
and will impact the Group’s ability to make investments and pay dividends.
The Board of Directors has recommended a dividend of NOK 2.5 per share in 2023. This recommendation reflects the Group’s solid financial position, and positive outlook. A dividend of NOK 2.50 per share was paid in 2022. Payment of the dividend was submitted for adoption at the company’s annual general meeting in May 2022.
The Group is financially sound, with a book equity of NOK 37 061 million as of 31 December 2022. This corresponds to an equity ratio of 56.7%. The number of shares outstanding in the company at 31 December 2022 was 595,773,680. All shares carry the same rights in the company. As of 31 December 2022, the company owned 297,760 treasury shares.
Ongoing structural changes in the global industry in which the company operates, taken in conjunction with the industry’s cyclical nature, demand that the company at all times maintain a satisfactory financial contingency. This in turn requires a positive relationship with the company’s shareholders and equity markets. The company has always attached great importance to maintaining the confidence of its financial partners and thus also access financing on favourable terms. The financial goals established by the board and management must be reflected in an established capital adequacy requirement and a required rate of return. The capital adequacy requirement stipulates that the Group’s equity ratio shall be at least 30% over time. The Group’s longterm goal for earnings is to maintain an annual return on the Group’s average capital employed of 18% before tax.
Mandates are granted to the Board of Directors in accordance with the Public Limited Companies Act (Norway); see in particular Chapters 9 and 10 of the Act.
At the annual general meeting on 12 May 2000, the board was authorised for the first time to purchase treasury shares. Last renewed at the annual general meeting on 23 May 2022, the mandate authorises the acquisition of up to 50,000,000 shares over a period of eighteen months from the date on which the resolution was adopted.
The Board of Directors is of the opinion that it should retain its right to purchase treasury shares. In future, situations may also emerge where the Board of Directors finds that the market price of the company’s shares does not reflect the company’s underlying intrinsic values, the company has sound equity and liquidity, and the board decides that an investment in treasury shares is an attractive prospect. In such a situation, the purchase of treasury shares may help improve return for the company’s investors. At the same time, the stock market generally views the purchase of treasury shares as positive, based on the signals this sends regarding the management’s confidence in the company’s outlook for the future. Moreover, the Board of Directors feels that a holding of treasury shares will provide the board with more leeway for growth via future acquisitions and business combinations and establishing new forms of cooperation.
Finally, the purchase of treasury shares may take place in connection with the possible establishment of a share savings programme for Group employees.
A proposal will therefore be submitted to renew the mandate at the annual general meeting on 23 May 2023.
by issuing shares for private placings for external investors, employees, and individual shareholders in Lerøy Seafood Group
The Board of Directors has a mandate to increase the share capital by up to NOK 5,000,000 by issuing up to 50,000,000 shares in Lerøy Seafood Group ASA, each with a face value of NOK 0.10, through one or more private placings with the company’s shareholders and/or external investors. This type of mandate was first established at the annual general meeting of 4 May 1999 and subsequently renewed at the annual general meeting on 23 May 2022. The Board of Directors exercised this mandate on 2 June 2016 and carried out a private placement of 5,000,000 new shares at a face value of NOK 1.00, in addition to the sale of 300,000 treasury shares. The Board of Directors believes it is appropriate to retain this mandate, including authorisation for the board to deviate from the preference rights of the shareholders. The Group expects to see continued structural changes and internationalisation in its industry. As a result, Lerøy Seafood Group will continuously assess organic growth, possible share-savings programmes for employees, possible acquisition and business combination options, and possible alliances that may lay the foundations for future profitable growth, both to capitalise on the value already created and to position the Group for future value creation.
The mandate will allow the company to achieve the requisite financial leeway to rapidly obtain the necessary liquidity and/or settlement shares that the board feels are necessary to ensure future profitable growth. A proposal
We follow and stand for Lerøy’s values, which are open, honest, responsible and creative.”
- Ami Davidsen, Area Manager Berlevåg
will therefore be made to renew this mandate at the annual general meeting on 23 May 2023. The board’s mandate is valid for a period exceeding one year and is not limited to specifically defined objectives recommended by the NUES. Principally for operational reasons, this also clearly shows that the company is growth-oriented and that shares are regarded as potential means of payment. This practice is established to ensure the company’s optimal strategic business development. However, the company has established the practice of renewing the mandates at each annual general meeting.
4. Equal treatment of shareholders
The company has only one class of shares, and each share carries one vote at the annual general meeting. Shareholder rights are governed by the Norwegian Public Limited Liability Companies Act. Lerøy Seafood Group’s Articles of Association and agreements are worded to ensure the equal treatment of shareholders.
Lerøy Seafood Group ASA has a strict policy of providing correct and open information to shareholders, potential shareholders, and other stakeholders.
5. Shares and negotiability
According to the company’s Articles of Association, there are no restrictions on the negotiability of Lerøy Seafood Group’s shares.
6. Annual general meeting
Lerøy Seafood Group holds its annual general meeting every year before the end of May. Notices of the annual general meeting and the organisation of the meeting comply with an established practice that Lerøy Seafood Group ASA has followed for many years.
On 23 May 2022, Lerøy Seafood Group ASA held its annual general meeting at the company’s head office at Lanternen, Thormøhlensgate 51 B in Bergen. The notice of the meeting and a proposed agenda, meeting slip, and proxy form were distributed to all shareholders with a registered address three weeks before the date of the event. The notice of the general meeting was formatted in accordance with the requirements of the Public Companies Act in Norway and the regulation relating to general meetings which governs the content and availability of supporting information. Pursuant to the company’s Articles of Association, all documents to be discussed at the general meeting were made available on the company’s website – leroyseafood.com – three weeks before the event.
The supporting information was sufficiently detailed and precise to allow shareholders to form a view on all matters to be considered at the meeting. Shareholders were asked to register for the annual general meeting by 20 May 2022 at 16.00. Before the notice of the general meeting was distributed, the Board of Directors and meeting chairperson performed a quality control of the procedures for registration and voting and the proxy form for participation and voting on behalf of other shareholders.
The Chairman of the Board represented the Board of Directors at the general meeting. The CEO and other members of the corporate management were also present. On agreement with the Chairperson of the Nomination Committee, the Chairman of the Board presented the committee’s recommendation.
In order to ensure independent chairing, the general meeting appoints a chairperson for the meeting and one person to co-sign the minutes of the meeting.
The Norwegian Public Limited Liability Companies Act states that the Board of Directors can choose to hold annual general meetings physically or electronically. If the annual general meeting is held electronically, shareholders can participate in and vote at the general meeting using various methods, without actually being present. Shareholders have the right to take part electronically, unless the Board of Directors finds reasonable grounds to deny this. Moreover, shareholders can vote during a period prior to the annual general meeting, if this is specified in the Articles of Association. In the notice of the general meeting, Lerøy Seafood Group allowed shareholders to vote by proxy at the general meeting. The proxy is designed to permit votes to be cast for each item discussed and for candidates up for election. The company’s procedures ensure full control and oversight of participation in and voting at general meetings. The company publishes the signed set of minutes immediately after the general meeting has been closed.
No extraordinary general meetings were held in 2022.
The Board of Directors is normally represented at general meetings by the Chairman of the Board, who currently also represents the majority shareholder in Lerøy Seafood Group. Because the capacity for other shareholders to be physically present at general meetings is very limited, it has not been deemed necessary for all board members to take part in the general meeting.
Pursuant to Article 5, paragraph 2, of the company’s Articles of Association, the company shall have a Nomination Committee consisting of three members elected by the annual general meeting for a period of two years. The company’s Nomination Committee is charged with preparing proposals for the composition of a shareholderelected Board of Directors, and with submitting recommendations to the annual general meeting for appointments to the board.
At present, the members of the Nomination Committee are Helge Singelstad (Chairman), Benedicte Schilbred Fasmer, and Morten Borge. The company has not established specific guidelines for the Nomination Committee. However, the composition of the Nomination Committee is such that the interests of the shareholders in general are taken into account, in
that the majority of the committee is independent of the board and other executive personnel, and the company’s Articles of Association also specify the framework for the Committee’s work. No board members or executive personnel in the company are members of the Nomination Committee.
The Nomination Committee makes a recommendation regarding remuneration to the members of the board. The general meeting makes the final decision regarding fees to be paid to the members of the company’s board and Nomination Committee.
Information on the members of the Nomination Committee is published at leroyseafood.com. In order to ensure the best possible basis for their assessments, the Nomination Committee will hold individual
conversations with board members and with the CEO. There is also provision for the Nomination Committee to have contact with the shareholders when recommending candidates and for shareholders to recommend candidates to the committee.
The reasoned recommendation of the Nomination Committee is included in the supporting documentation for the annual general meeting, which is published within the twenty-one-day deadline for notice of the general meeting.
Occupying a central position between owners and management, the Board of Directors’ function is to safeguard the shareholders’ interests in parallel with the company’s need for strategic governance, operational control, and diversity. The function and focus of the
Board will always vary somewhat, depending on circumstances within the company and changes to external framework conditions.
The transformation of Lerøy Seafood Group from a family company to a listed limited public company has been guided by the owners’ clear awareness of the type of board the company needs. Since the early 1990s, most board members have been independent of the Group’s management team, which protects the board’s ability to challenge management practices. In part because of the board’s composition (size, independence from management and main owners, etc.), it has so far been deemed unnecessary to establish so-called board committees, with the exception of the statutory requirement for an audit committee.
Pursuant to the Norwegian Public Companies Act, the Chief Executive Officer (CEO) is not permitted to be a board member. The Norwegian Code of Practice is also very clear in its recommendation that neither the CEO nor other executive personnel in the company should be board members. In Lerøy Seafood Group, neither the
CEO nor other executive personnel are members of the Board of Directors.
Both the Chairman of the Board and other board members are elected for a period of two years at a time. The Nomination Committee submits its recommendation to the general meeting, which appoints the Chairman of the Board and other board members.
The Group’s structure, with independent entities in different regions, is supervised through Group management’s participation in the administrative bodies of the various companies. The employees contribute to a positive development in operations as members of the board in the subsidiaries. The board has not elected a vice chairman. To date, the Chairman of the Board has always been present. In the event of his absence, the board will make satisfactory arrangements for chairing the meeting.
Encouraging the board members to own shares in the company
The majority of board members in Lerøy Seafood Group own shares in the company, either directly or indirectly.
9. The work of the Board of Directors
The Board of Directors has the ultimate responsibility for company management. This involves supervising day-to-day management and activities in general. The board’s responsibility for the management of the company includes ensuring that the company’s activities are soundly organised, drawing up plans and budgets for these activities, keeping itself informed of the company’s financial position, and subjecting the company’s activities, accounts, and asset management to adequate control. The main aim is to ensure continuous follow-up and the company’s further development.
For several years, including its twelve meetings in 2022, the board has maintained a particular focus on the connection between practical operations and strategic business development. The board works purposefully together with the company management to make the Group the most sustainable, profitable, fully integrated, and international seafood company possible. This work has for a considerable time been carried out in accordance with our public announcements. The board’s work reflects this strategy, and the results
* Independent of the Group’s largest shareholder
** In addition there has been one board meeting per circulation
It’s really been fantastic for me to have the opportunity for personal development. Courses and organized training have given me the opportunity to start on a new exciting career path within the same group.”
- Andreas Fauske, project manager IT
are shown through management implementation. Although the strategic development of the company is a continuous process and part of the work of the Board of Directors, there are also dedicated strategy meetings. Strategy meetings were held once again in 2022.
In close dialogue with the Board of Directors and the Chairman, a set of instructions has been prepared for the Board of Directors and the work of the CEO. Among other things, the instructions cover how the Board of Directors and the daily management shall handle agreements with related parties. The guidelines indicate that board members and executive personnel should notify the Board of Directors of any significant interest in an agreement signed by the company. If a company with which a board member has connections performs work for Lerøy Seafood Group’s Board of Directors, the board specifically addresses the question of independence.
Should transactions with related parties occur, they shall be documented and executed according to the arm’s length principle. An independent valuation shall be obtained for significant agreements. Exemptions may be made for agreements that represent part of the company’s normal operations and are based on normal commercial conditions and principles. Agreements with related parties shall be administered to see that these agreements are properly balanced. This is to verify that the company is aware of potential conflicts of interest and has carried out due diligence on such agreements, to prevent assets from being transferred from the company to related parties. The Board of Directors will report on
such agreements in the Annual Report.
Independent consideration
of a material character in which the Chairman of the Board, board members, or executive personnel are actively involved
The Chairman of the Board or other board members shall not process matters that are significant to their own interests or the personal interests of close associates. Such matters are dealt with by the other board members. The same applies to matters in which the CEO or other executive personnel have a personal interest.
Pursuant to section 6-41 (1) of the Norwegian Public Limited Liability Companies Act, companies listed on the Oslo Stock Exchange are obliged to establish an audit committee which prepares matters for and advises the Board of Directors. Lerøy Seafood
Group’s Audit Committee consists of Britt Kathrine Drivenes and Didrik Munch (chairperson). The Audit Committee reports to the Chairman of the Board. The audit committee conducts quality assurance for internal control and reporting. It is also responsible for the Board of Directors’ dialogue with and monitoring of the external auditor. The auditor reports on his work in writing to the company administration and the board through the Audit Committee. The Audit Committee held nine meetings during 2022. The company does not have a so-called remuneration committee.
When recruiting board members, the company’s owners follow a longstanding strategy of assessing the company’s need for varied competency, continuity, renewal, and changes in ownership structure. It will always be in the company’s interest to see that the composition of the board accords
with the demands made on the Group. The board’s evaluation of its own performance and of Group management must of course be seen in conjunction with the Group’s performance. To date, the board has not issued reports evaluating its own work; this is a conscious priority decision and must be viewed in connection with other announcements in the company’s communications to the public. Moreover, external evaluations of the board’s work are probably the most influential and are likely to remain so in the future.
The Group’s activities are varied, depending on each entity’s position in the value chain, and consequently require differentiated forms of management and follow-up. Good internal management systems are
essential for success and must be continuously developed in order to accommodate fluctuating conditions. The Group’s regional structure, with independent entities, and short-term reporting, facilitates good control and a powerful focus. Internal control is based on daily and weekly reports that are summarised into monthly reports tailored to the individual company and the Group. Uniform reporting procedures and formats are required in order to ensure correct reporting from all entities, up to an aggregate level.
As Lerøy Seafood Group is an international seafood corporation with decentralised operations and a significant volume of biological production, the company is exposed to a number of risk factors. The Board of Directors therefore works hard to ensure that the Group implements all
measures required to control risk, limit individual risk, and keep risk as a whole within acceptable constraints. Please refer to the chapter on Risk Management in the Board of Directors’ report for information on how the Group manages the different risks to which the company is exposed.
A significant share of the work of the Board of Directors is to see that the company’s management is familiar with and understands the Group’s risk areas and manages that risk with appropriate internal control. Frequent evaluations and assessments are conducted of both the management’s and the Board’s understanding of risk and internal control. The Audit Committee plays an important role in these evaluations and assessments.
Internal control within the Group is based on the recommendation from the “Committee of Sponsoring Organizations of the Treadway Commissions” (COSO) and covers the control environment, risk assessment, control activities, information and communication, and monitoring. The main purpose of the COSO framework is to identify, evaluate, and manage the company’s risk in an efficient and appropriate manner. The content of these different elements is described in detail below.
The core of an enterprise is the employees’ individual skills, ethical values, and competence, in addition to the environment in which they work.
On behalf of the CFO, the Chief Accountant for the Group provides financial reporting guidelines to entities within the Group. Similarly, the Head of ESG & Quality, on behalf of the CEO, provides guidelines to entities in the Group for reporting on society and the environment. These guidelines place requirements on both the content of and process for reporting.
The Chief Accountant for the Group reports to the CFO and is responsible for areas such as financial reporting, budgets, and the internal control of financial reporting within the Group. The Head of ESG & Quality reports to the CEO and is responsible for areas related to sustainability reporting. The directors of the reporting entities are responsible for continuous financial, social and environmental monitoring and reporting.. Each entity has management groups and
functions adapted to their organisation and business. The managers see that appropriate and efficient internal control is implemented and are responsible for compliance with requirements.
The Audit Committee shall monitor the processes related to financial and sustainability reporting and ensure that the Group’s internal control and risk management systems function efficiently. The Audit Committee shall also ensure that the Group has an independent and efficient external auditor.
The financial statements for all companies in the Group are audited by an external auditor, within the framework established in international standards for auditing and quality control.
Group management, the Chief Accountant for the Group, and the Head of ESG & Quality work with the managers of each reporting entity to identify, assess, and monitor the risk of errors in the Group’s reports.
The reporting entities are responsible for implementing sufficient control actions to prevent errors in financial and sustainability reporting.
Processes and control measures have been established for quality assurance in reporting. These measures consist of mandates, the division of work, reconciliation/documentation, IT controls, analyses, management reviews, and board representation within subsidiaries.
The Group Chief Accountant and the Head of ESG & Quality ensure that reporting takes place in accordance with current legislation, accounting
standards, established accounting policies, and the board’s guidelines.
Reporting by Group companies and segments is also assessed continuously, in conjunction with Group management. Analyses are carried out for previous periods, between different entities, and in relation to other companies within the same industry.
Review by Group management
Group management holds regular meetings to review such issues as the monthly development in key figures/ KPIs and the strategic action plan.
Reviews by the Audit Committee, Board of Directors, and annual general meeting
On a quarterly basis, the Audit Committee and the board review the Group’s reports. During these reviews, the Audit Committee has discussions with management and the external auditor. At least once a year, the board meets with the external auditor, outside the presence of the administration.
The board reviews the interim accounts per quarter and the proposal for the financial statements. The financial statements are adopted by the annual general meeting.
The Group strongly emphasises correct and open information to shareholders, potential shareholders, and other stakeholders. For details, ref. Item 13, ‘Information and communication’.
Those persons responsible for entities which issue reports shall ensure appropriate and efficient internal control in accordance with requirements and be responsible for compliance with such requirements.
Group level Group management, in cooperation with the persons responsible for reporting, review the financial and sustainability reports issued by the entities and the Group and assess any errors, omissions, and required improvements.
External auditor
The external auditor shall provide the Audit Committee with a description of the main elements of the audit from the previous financial year, particularly significant weak points identified during internal control related to the process of financial and sustainability reporting.
The board, represented by the Audit Committee, monitors the reporting process.
The remuneration of the Board of Directors is not based on results. Board members elected by the shareholders have no share options. If enterprises with which board members are associated perform work for the company’s board, the board specifically addresses the question of independence. The remuneration of the Chairman of the Board and other board members is recommended by the Nomination Committee and adopted by the general meeting. The annual general meeting on 23 May 2022 adopted annual remuneration for the Board of Directors as follows:
• Chairman of the Board
NOK 500,000
• Other board members
NOK 300,000
The Audit Committee’s remuneration for additional work performed is NOK 120,000 per year for the committee chairman and NOK 80,000
per year for other members of the committee.
The annual remuneration of the Nomination Committee totalled NOK 45,000 per member.
12. Salary and other remuneration of persons in senior positions
A renumeration report for executives is published annually, highlighting the actual remuneration, remuneration principles and framework. The guidelines regarding salary and other remuneration shall be clear and understandable and contribute to the company’s business strategy, long-term interests, and financial capacity. The schemes for salary and other remuneration shall help to align the interests of shareholders and executive personnel, and they shall be simple.
The annual general meeting shall, at minimum every four years, review and approve the board’s guidelines for stipulating salary and other remuneration of persons in senior positions according to the provisions in section 6-16 a of the Public Limited Liability Companies Act and related regulations. Furthermore, the annual general meeting shall hold an advisory vote each year on the board’s statement regarding paid and current remuneration covered by the guidelines prepared according to section 6-16 a of the Public Limited Liability Companies Act, cf. section 6-16 b of the Public Limited Liability Companies Act.
13. Information and communication Lerøy Seafood Group seeks to provide correct and open information to shareholders, potential shareholders, and other stakeholders. The company discloses inside information in accordance with section 3-1 of the Securities Trading Act, cf. the EU’s Market Abuse Regulation (596/2014)
(MAR) Article 17, cf. MAR article 7, and cf. article 2 of the Commission Regulation 2016/1055. Timely, relevant, consistent, and current information is the basis upon which all interested parties assess the value of the company’s shares. In addition to disclosing inside information pursuant to MAR, the company will also hold presentations for investors and analysts. Lerøy Seafood Group keeps its shareholders informed via the Board of Directors’ report and interim reports and presentations. In addition, press releases are sent out about important events on the company’s markets or other relevant circumstances.
Every year, Lerøy Seafood Group publishes the company’s financial calendar, showing the dates for the presentation of interim financial statements and the date of the annual general meeting. The date for the payment of dividends is decided at the annual general meeting.
The company’s website –leroyseafood.com – is updated constantly with information distributed to shareholders. No specific guidelines have been compiled for the company’s contact with shareholders outside the general meeting, because the current integrated practice within this area is deemed satisfactory.
Lerøy Seafood Group has no restrictions in its Articles of Association regarding company takeovers. As of 3 June 2002, shares in Lerøy Seafood Group have been quoted on the Oslo Stock Exchange and are freely negotiable within the provisions of Norwegian law. The company has only one class of shares, and each share carries one vote at the annual general meeting. If a takeover bid is made for the company, the Board of Directors will make a statement prior
I am extremely proud that Lerøy was named one of the climate winners in PWC’s climate index in Norway. Only 10 companies achieved this distinction in 2022.”
- Anne Hilde Midttveit, Head of ESG & Quality at Lerøy
to the expiry of the bid. The Board of Directors’ statement will also include a recommendation as to whether the shareholders should accept the bid or not. The Board of Directors will emphasise the equal treatment of shareholders and avoiding unnecessary disturbance to the company’s operations.
For a number of years, Lerøy Seafood Group has engaged the services of PwC as Group auditor. The auditor follows an auditing plan reviewed in advance with the Audit Committee and management. The auditor and Audit Committee perform an annual audit of the company’s internal control, identifying weak points and recommending improvements. The
board is informed of
of the services the administration buys from the auditor.
The auditor holds meetings with the Audit Committee and management subsequent to the interim audit and in connection with the company’s presentation of interim reports for the fourth quarter. The auditor attends board meetings where financial and sustainability statements are to be approved, and also holds a meeting about the annual report with the Board of Directors, at which the management is not present. During these meetings, the auditor reviews any significant changes to the company’s accounting policies, evaluates significant accounting estimates, and reviews all material
aspects on which the auditor and management disagree. To date, there has been no such disagreement.
To reinforce the board’s work on financial and sustainability reporting as well as with internal control, according to the auditing regulations, the auditor shall present an annual supplementary report to the Audit Committee, in which the auditor declares his/her independence and explains the results of the statutory audit, with information on the audit. The auditor shall also provide written information to the Audit Committee on any services provided other than the statutory audit. The auditing company utilised is a large company and practises internal rotation, in compliance with the requirement for independence.
Moreover, at the board’s discretion, the auditor is available for questions and comments on financial statements and other matters.
Fees invoiced by the auditor are presented in a note separate from the financial statements. The company’s annual general meeting is also notified of the auditor’s remuneration.
permission to make use of an auditor for services other than auditing
The Audit Committee is continuously informed of the main aspects of the services purchased by the management from the auditor. In addition, services with an estimated total cost exceeding NOK 1 million must be preapproved by the Audit Committee.
Chair of the Board
Arne Møgster (1975) was elected to the board at the annual general meeting on 26 May 2009. He holds a Master of Science (MSc) in International Shipping and a Bachelor degree in Business and Administration.
Arne Møgster is the CEO of Austevoll Seafoood ASA, and a board member for a number of companies in the Austevoll Seafood Group. Prior to joining Austevoll Seafood ASA in 2006. Arne Møgster earned himself versatile experience working within fishing, shipbuilding and the offshore supply market. He was the Managing Director of Norskan AS for 3 years, with one year based in Brazil.
Through his position as CEO and board member in listed companies for more than a decade Arne has extensive knowledge of a broad range of subjects including wide experience in working with ESG.
Austevoll Seafood is the majority owner in Lerøy Seafood Group, and the majority owner in Austevoll Seafood is Laco AS. Arne Møgster is a shareholder and boardmember in Laco AS, and indirectly holds shares in Lerøy Seafood Group ASA. There are some transactions between companies in the Austevoll Seafood Group and Lerøy. Such transactions take place according to the arm’s length principle and are described in the company’s annual report.
Board member
Siri Lill Mannes (1970) was elected to the board at the annual general meeting on 23 May 2018. Siri Lill holds a Master degree in history, and has also studied Russian and political science. She also completed the Armed Forces’ course in Russian (officer’s training school) and studied political science in Georgia, USA, on a one-year Rotary Club scholarship. In 2017, she completed the Senior Executive course at the Norwegian Defence University College, (Sjefskurset ved Forsvarets Høyskole). Having worked as a TV host and entrepreneur, Siri Lill Mannes has an extensive background in journalism. She started working for TV2 in 1992, when the channel was founded. Since 2010, she has been director of the communications company SpeakLab AS, where she is also a partner and founder.
Through her positions and experience Siri has extensive knowledge within among others international politics and communication. Siri Lill regularly moderates conferences on security, digitalisation and cybersecurity. Since 2015, she has been moderator for the National Security Conference by the Norwegian National Security Authority (NSM).
Siri Lill Mannes is an independent director in the board. She owned no shares in the company as of 31 December 2022.
Board member
Didrik Munch (1956) was elected to the Board at the annual general meeting on 23 May 2012. He has a law degree from the University of Bergen. Didrik Munch qualified as a police officer at the Norwegian Police College in Oslo and held a number of positions within the Norwegian police force (1977–1986). From 1986 to 1997, he worked in finance, primarily in the DNB system, where he ultimately joined corporate management as Director for the DnB Corporate Customer division. From 1997 to 2008, Didrik Munch was CEO of Bergens Tidende AS. He was CEO of Schibsted Norge AS (formerly Media Norge AS) from 2008 to 2018 and is currently selfemployed. Didrik Munch has sat on the boards of a number of companies, both as chairman and an ordinary member. He is currently Chairman of the Board for Storebrand ASA, Sh Holding AS, NWT Media AS and a board member for Grieg Maritime Group AS.
Didrik Munch is currently chair of the audit committee in Lerøy Seafood Group ASA. He has far-reaching knowledge also within ESG and innovation, through his extensive experience from both the management and board of some of Norway’s largest and most innovative companies.
Didrik Munch is an independent director in the board. He owned no shares in the company as of 31 December 2022.

Board member
Britt Kathrine Drivenes (1963) was elected to the board at the annual general meeting on 20 May 2008. She holds a Bachelor of Business Administration from the Norwegian School of Management (BI) and a Master of Business Administration in Strategic Management from the Norwegian School of Economics (NHH). She is CFO of Austevoll Seafood ASA and also a board member in a number of companies in the Austevoll Seafood Group. She has also been part of the Board in Norwegian Seafood Research Fund, FHF – since 2019. FHF’s goal is to create added value to the Seafood industry through industrybased research and development.
Britt Kathrine Drivenes has extensive experience from the fish industry as well as financing, accounting and ESG. She is the board`s designated resource related to ESG. Through her position as a board member in an IT company, she also has knowledge within IT and cybersecurity. She owns shares indirectly in Lerøy Seafood Group ASA, as a shareholder in Austevoll Seafood ASA.
Board member
Karoline Møgster (1980) was elected to the board at the annual general meeting on 23 May 2017. Karoline Møgster has a law degree from the University of Bergen (Candidata juris). She also has a Master of Science in Accounting and Auditing (MRR) from the Norwegian School of Economics. She has experience as a lawyer with Advokatfirmaet Thommessen AS and is now employed as a lawyer in Møgster Management AS in the Laco Group.
Karoline has extensive experience within Corporate Governance and corporate law as well as accounting and financing.
She is a board member for Laco AS and has board experience from other listed companies. Laco AS is the ultimate parent company of Lerøy Seafood Group. She is also a board member for Fiskebåt Sør. Karoline Møgster indirectly owns shares in Lerøy Seafood Group ASA as a shareholder of Laco AS.
Board member
Hans Petter Vestre (1966) was elected employees’ representative to the board at the annual general meeting on 24 April 1995. Hans Petter Vestre is a graduate of the Norwegian College of Fishery, University of Tromsø. He started as a sales manager at Hallvard Lerøy AS in 1992, he is today a team manager at Lerøy Seafood AS. Hans Petter Vestre owns 1,200 shares in the company as of 31 December 2022.
Hans Petter is a board member in Bergen CK (Cycle club), and has received training within both ESG and IT security as an employee in Lerøy.
The Group’s development is closely linked to its ability to recruit and retain talented senior executives. The Group’s guidelines for stipulating salaries and other remuneration of senior executives are attached. The company has followed the guidelines for 2022.
Adopted at the annual general meeting of Lerøy Seafood Group ASA on 26 May 2021.
1 General These guidelines have been prepared by the Board of Directors of Lerøy Seafood Group ASA (“the company” or “Lerøy”) in accordance with section 6-16 a of the Public Limited Liability Companies Act and regulations governing guidelines and reports on remuneration of persons in senior positions.
Executive salaries are a key instrument in harmonising the Group’s interests with those of persons in senior positions. The shareholders therefore have an influence over executive salaries in the company via the disclosure and approval of these guidelines. The main principles for executive salaries are that they shall be appropriate in order to attract and retain skilled managers without the Group being wage leaders in the industry, and without the variable element of salary representing such a large share of the total salary that this may result in unfortunate incentives and short-term perspectives. The company’s salary system shall be easy to understand and acceptable.
Lerøy’s values – open, honest, responsible and creative – shall lay the foundations for the Group’s daily operations, but also for the perpetual, strategic business development required to achieve the Group’s vision of being the leading and most profitable global supplier of sustainable, quality seafood. This long-term focus is also reflected in the company’s financial capacity.
Being a leading player in a global industry and safeguarding the company’s long-term interests are closely linked to the company’s ability to recruit, develop and retain executive personnel. Lerøy’s employees are the most important resource for the Group. Lerøy shall be a respected and attractive employer in the seafood industry, with the capacity to attract employees with the appropriate competencies, succeeding in building a learning and dynamic organisation where employees are happy, can develop and work together to meet our customers’ requirements and future challenges.
3 Scope
These guidelines apply to persons in senior positions in Lerøy, as defined in section 6-16 a of the Public Limited Liability Companies Act. For Lerøy, this includes the Group’s management group (“executive personnel”) and
members of the Group’s Board of Directors. Remuneration of other employees than executive personnel is not covered by these guidelines.
Lerøy has established a remuneration scheme to stimulate, in general, achievement of goals and at the same time promote good risk management, counteract excessive risks and help prevent conflicts of interest. The Group’s long-term interests and financial capacity shall be safeguarded. One general requirement for the remuneration scheme is that it shall be based on equal salaries for male and female employees for equal work or work of equal value. The company’s remuneration shall be competitive, but the company shall not be a wage leader in the industry. The company conducts annual reviews of application of the remuneration scheme, and the company’s written report is reviewed by independent control functions.
4 Detailed information on remuneration that can be paid to or received by persons in senior positions
4.1 Remuneration of members of the Board of Directors
Remuneration of the board members is proposed by the company’s nomination committee and adopted by the annual general meeting in accordance with section 6-10 of the Public Limited Liability Companies Act. The board members do not have a scheme for allocation of options for
the purchase of shares in the company.
Regarding remuneration of executive personnel, the company mainly focuses on fixed salary as an instrument, and only uses variable remuneration to a limited degree. Executive salary shall be competitive, so that the company is able to attract and retain the most skilled managers. The fixed remuneration of executive personnel shall include:
Base salary
Base salary is established on the basis of the responsibilities, complexity, competencies and length of service for the position. The base salary is normally the main element of executive personnel salaries.
Bonus scheme
In principle, bonuses are a form of profit sharing, where members of management are remunerated for their contribution to the company’s long-term earnings and development. The purpose of Lerøy’s bonus scheme is to stimulate continuous development of Lerøy’s value creation, growth and results, as defined in the company strategy.
Bonus payments are assessed and stipulated every year based on a comprehensive evaluation of five components: the executive’s value creation, efforts, results, values, and attitudes and conduct, all in relation to the defined goals, tasks and available resources implied in the position.
At the end of the measurement period, a decision is made as to the extent to which the criteria for a bonus payment have been met. This evaluation shall be based on an assessment of the criteria as described above and in the bonus schemes for
executive personnel. See also more detailed information in paragraph 4.3.
Bonus payments to persons in senior positions may comprise up to one year’s salary.
The company does not have any scheme for repayment of variable remuneration. The Board of Directors has the right to make changes to or terminate the bonus scheme on a yearly basis.
Other remuneration
Pension schemes
Lerøy Seafood Group ASA has a defined-contribution pension scheme according to the Act relating to mandatory occupational pensions. The base for premium payments is capped at maximum 12 G (G is the national insurance base amount) per year. Executive personnel in the Group are members of the company’s collective pension scheme up to retirement age, which is 70, and do not have separate agreements that include early retirement or supplementary pensions. The company may, however, enter into such agreements in the future.
Severance pay
In principle, the company does not make use of severance pay apart from salary during the period of notice for the number of months stipulated in the provisions of the Working Environment Act. Severance pay may, however, be a good alternative in some situations for all parties involved. Severance pay can therefore be utilised in extraordinary circumstances, albeit capped at two annual salaries.
Other special remuneration
Executive personnel may receive other special remuneration that is normal for comparable positions, such as free telephone, PC at home, free
broadband, newspapers, company car/car scheme and parking.
Options and other types of remuneration linked to shares or developments in share prices:
The company does not currently provide any other type of remuneration to persons in senior positions in the form of options or linked to shares in the company or the share price.
Share purchase programmes
Lerøy is entitled to assess a sharesavings programme for all employees, where the employees have the right to subscribe to a limited number of shares at a discounted price.
4.3 Stipulation of remuneration and allocation of variable benefits
Remuneration of the Group CEO is determined annually by the Chairman of the Board according to a mandate issued by the Board. Remuneration of the individual members of the corporate management group is determined by the CEO in consultation with the Chairman of the Board. The Board of Directors shall be subsequently informed of the decision.
General schemes for payment of variable benefits, including bonus schemes, are established by the Board of Directors. The Group CEO allocates incentive schemes and other benefits to the Group’s executive personnel within the boundaries of the schemes established by the Board.
The company does not have a dedicated remuneration committee.
Lerøy Seafood Group companies shall comply with the main principles of the Group’s executive salary policy and the salary system. The Group aims to coordinate the Group’ salary policy
and the schemes utilised for variable benefits.
The company aims to retain the current scheme for terms of employment and salary for executive personnel. This is taken into account when preparing guidelines, so that the guidelines largely describe the current terms of employment and salary for executive personnel.
For each financial year, the Board shall ensure that a statement regarding salary is prepared that provides an overview of paid and current remuneration covered by these guidelines.
Prior to the Statement regarding salary being discussed by the annual general meeting, the auditor shall check that it contains the information required according to prevailing regulations. The annual general meeting shall hold an advisory vote
on the Statement regarding salary. The Statement regarding salary in the subsequent year shall explain how the result of the previous annual general meeting’s vote has been taken into consideration.
6 Deviations from the guidelines
In extraordinary circumstances when significant events require executive personnel to make extraordinary efforts, the Board may decide to deviate from these guidelines. Reasonable grounds for such deviation must be stated in relation to the shareholders’ shared interest in retaining and incentivising key personnel in extraordinary situations.
Deviations must be assessed by the Board as necessary in the situation in question and for the executive employee in question. The grounds for any deviations shall be specified in writing and be included in the annual Statement regarding salary presented to the annual general meeting, for an advisory vote in the

following year. The Board is not entitled to deviate from the guidelines in relation to remuneration of Board members. If necessary, such deviations shall be proposed and presented to the annual general meeting for a general vote.
7
Any significant changes to the guidelines shall be described in new and updated guidelines that are submitted to the annual general meeting for approval. In the event of such changes, the company shall take into account the shareholders’ views and votes on the guidelines. The guidelines shall be presented to the annual general meeting for approval minimum every four years.
8 Disclosure
These guidelines shall be dated on the day they are approved by the annual general meeting, and shall be made available on the company’s website along with the results of the vote.
Bergen, 26 May 2021
Arne Møgster Chair of the Board Britt Kathrine Drivenes Board member Didrik Munch Board member Karoline Møgster Board member Hans Petter Vestre Board member Siri Lill Mannes Board member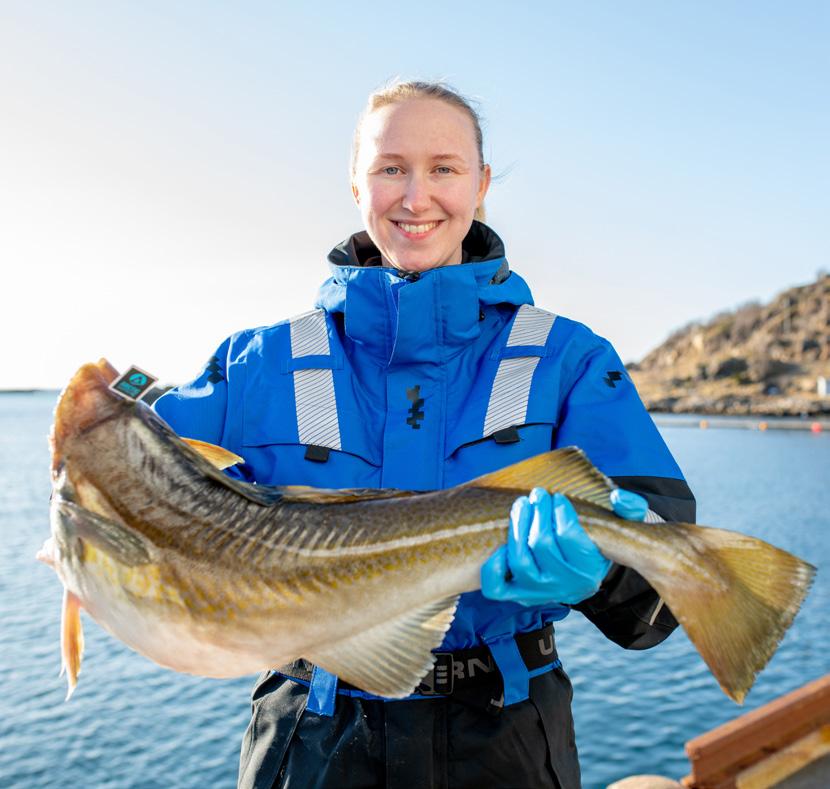
My colleagues do their best to make sure I am happy. My experience is all positive!”
- Gro Glorvigen, temporary provisions assistant in Båtsfjord
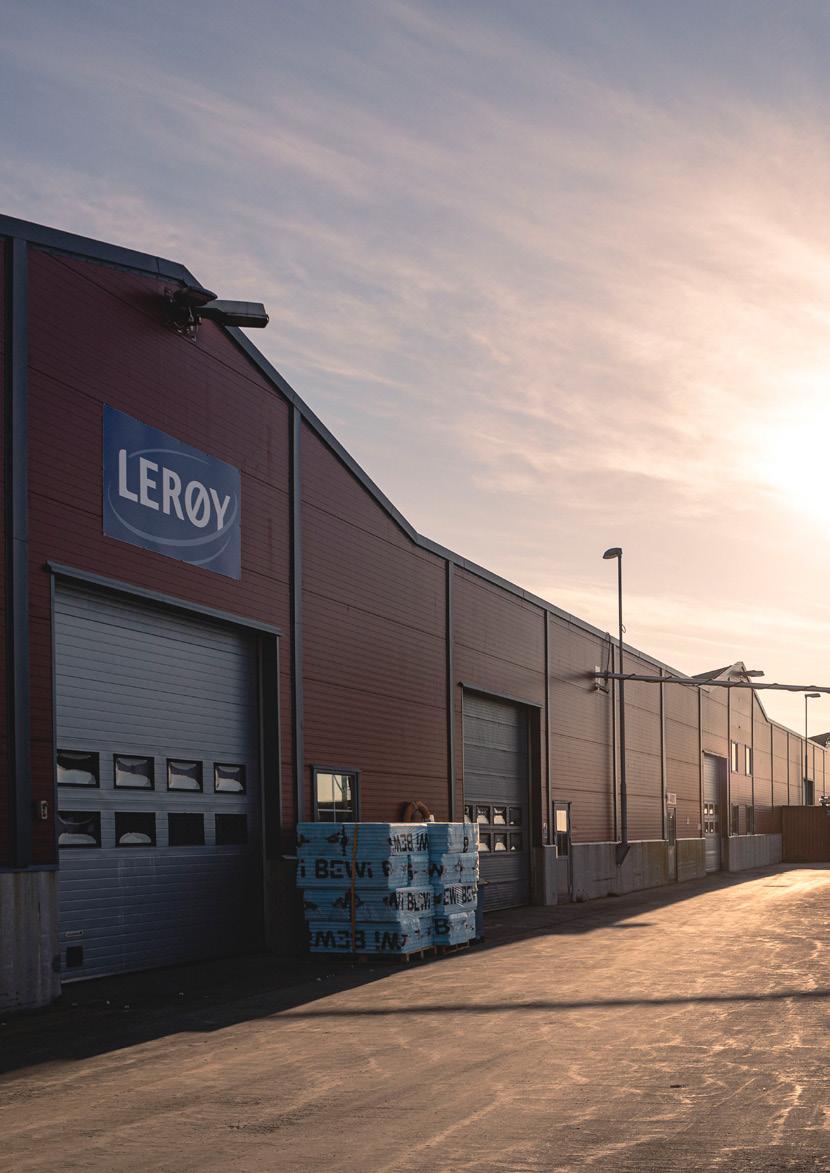
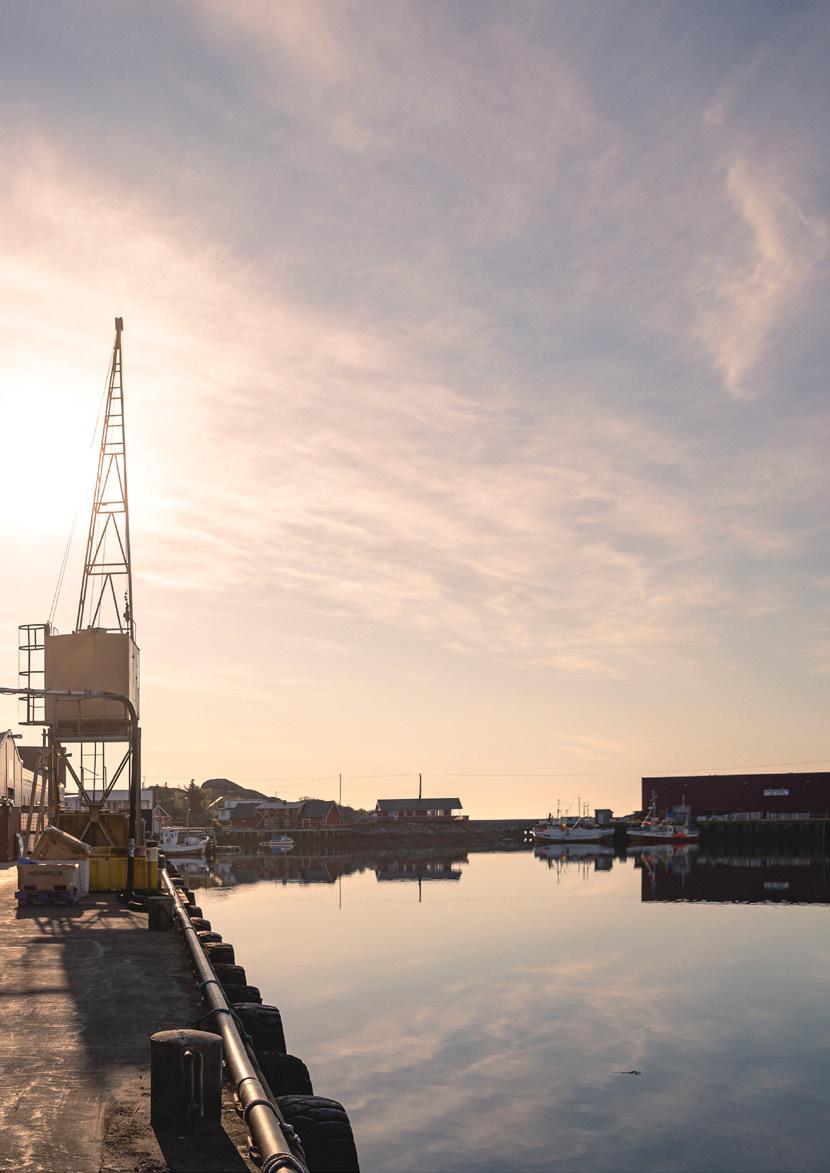
In its long history, the seafood business has been a global industry. Yet, it remains very fragmented, with complex value chains. Our strategy for the last thirty years has been based on a belief that such complex value chains are incompatible with the requirements of customers and consumers, such as food safety, cost efficiency, traceability, stability, and with time, increasingly, sustainability.
Thus, we have always been a customer-centric company, and our vision requires us to keep developing to become a preferred supplier of seafood on a global scale. Our customers are predominantly within retail and food service, but our aim, through an efficient and sustainable value chain with a large product range and integration with our customers, is to develop activities and products to increase end customers’ satisfaction and willingness to pay. In turn, this will help our customers gain new market shares.
Therefore, as we have grown, we have focused on securing access to raw materials that are fully traceable and governable, and we have gradually developed an integrated value chain for seafood. We believe value is created in value chains and in business in value chains that form a network of competitive processes for their customers. Lerøy’s goal is to create the world’s most efficient and sustainable value chain for seafood. This involves developing long-term customer relationships and in-depth understanding of the customer’s requirements, continuously improving the processes in the Group’s own value chain, and developing strong alliances with suppliers.
Throughout our history, we have always maintained the belief that value creation is dependent on access to both knowledge and capital. Our employees are the Group’s most important resource. We are, and will remain, an attractive employer, with the capacity to attract employees who have the appropriate and attitudes, building an organisation where employees are in high spirits and work together to meet our customers’ needs. We have focused on a governance model with substantial local decisionmaking authority, but we are increasing our focus on sharing best practices across the value chain.
Our Group’s existence and growth depend on the confidence of the capital markets and our access to capital. The Group’s financial strength and financial structure have been and will be adapted to our operation and framework conditions, including our understanding that we are operating in an industry which, historically, has been highly cyclical. Our level of capitalisation and business model must reflect this, and although cyclicality can be challenging, it has afforded us substantial opportunities
and will continue to do so. The Group’s balance sheet will therefore typically be strong during good periods, while including a strategy to exploit this for acquisitions in challenging times.
Entering 2023, Lerøy has a unique value chain for seafood, with access to high-quality sustainable resources sourced both internally and externally. To an increasing extent, we control the process all the way to the large retailers and food service providers, and we are seeing that sustainability is becoming an increasing competitive opportunity. For retailers and food service providers to reach their own ESG targets (Scope 3, through the value chain), they depend on committed suppliers to help them reach their targets.
Lerøy is in a distinctive position to create the world’s most efficient and sustainable value chain for seafood, but there is still work to be done, as highlighted in the strategic framework and project list. We must continuously develop our value chain, from raw material to end product.
Within farming, we have in recent years increased our harvest volume, following large investments in RAS smolt facilities, but the growth in 2022 was below our expectations. However, we have made significant efforts to improve our processes and know we have room for further improvement, both in sharing and developing best practices, and in ensuring that we are gathering internal and external data and knowledge to improve our processes. Already in 2022, we believe we have taken significant steps which will yield gradual and continuous improvements in the years to come.
Within the Wild Catch segment, falling quotas are a challenge for utilisation for the trawling fleet, but even more so, together with the typically corresponding higher prices for the land industry. We must continue to work on reducing seasonal fluctuations for the land-based industry, continuously improve our operations, and build a more efficient value chain for whitefish, better connecting the raw material and our processing capabilities to our downstream network.
Within VAP, Sales and Distribution, following positive development in 2021, 2022 proved a challenging year, with surprisingly high raw material prices and supply chain turmoil and cost inflation during the surge in demand following the lifting of COVID-19 restrictions. During 2022, we have adjusted and improved, and we are well set for continuous improvement toward our objective of building the world’s most efficient and sustainable value chain for seafood.
VALUE CHAIN
We care!
Creating the world’s most efficient and sustainable value chain for seafood
In the last few years, we have performed a larger review of the Group’s strategic framework, which is now continuously in development through our yearly plan for strategic activities. For these strategic processes, we conduct internal and external analysis of key trends that impact our operations and opportunities. These analysis cover areas such as value drivers in our
operations, our competitors, the markets we operate in, potential new markets, and potential macro risks that could influence our operations. Furthermore we have made an assessment to identify conditions where Lerøy has an actual or potential significant impact on financial results, people, or the environment. This includes both an impact directly caused by Lerøy and the impact that we have, or may have, throughout our entire value chain. Our materiality
assessment is further described in the ESG section of the Group’s annual report. These analyses are used to improve our strategic decisionmaking, which enables us to define our strategy, as shown below, to define our shortand long-term goals, and to define our strategic initiatives.
The following table outlines the Group’s strategy on one page. Cascaded and similar exists for each of our business segments.
Strengthen core
• Increase sales volume to strategic customers
• Strengthen sales and production planning
• Utilise raw material in own value chain
• Increase and stabilise biological production and catch
• Leading position within sustainability
Develop core
• Accelerate digital transformation and automation
• New coastal farming technology
• Take positions with new strategic customers
• Volume growth in the whole value chain
New growth platforms
• Offer and produce new species based on market needs
• Position for volume growth in farming through new technologies
• Take positions in attractive new markets
• Utilise other marine resources through Lerøy Ocean Harvest
The Group’s values – open, honest, responsible, and creative – underlie all of our activities. They lay the foundation for our efforts to create the world’s most efficient and sustainable value chain for seafood and our vision to be the leading and most profitable global supplier of high-quality, sustainable seafood. These are our priorities:
Lerøy succeeds when our customers succeed. We shall meet our customers’ expectations in terms of delivery, sustainability, quality, and costs and create growth in existing and new markets via forward-looking and innovative solutions. Value is created in value chains, and in businesses in value chains, which form a network with competitive processes for their customers. Lerøy aims to build longterm relationships with customers and suppliers. Strategic business development will also play a decisive role in future developments for the Group.
The future development of the company will depend on our ability to achieve continuous improvements and increased operational efficiency.
The Lerøy Way, which comprises guiding principles and methods, is our most important tool in improving our operational efficiency and reducing risk. We use this established method to continuously improve our work processes in each entity, across the value chain.
For Lerøy, developments shall be based on a perspective of perpetuality. To achieve this, the Board of Directors, management, and employees must maintain a high focus on sustainability. By continuously improving our processes, we shall reduce the footprint from our own value chain. We monitor a number of sustainability variables and shall continue to do so during operations.
Our future growth will depend on our capacity for innovation, development, and learning. With a fully integrated value chain for seafood, it will be essential to have a culture based on cooperation, sharing expertise and trust in every part of the value chain – ‘One Lerøy’. This is ensured by means of positive interaction, information flow, more standardised systems, and clearly defined expectations and goals. Lerøy aims to facilitate increased competencies and an exchange of experience and shall have a sharp focus on strategic competency management within the Group.
We shall be a leading player in a global industry in which changes in framework conditions require flexible employees who are dynamic and willing to learn. Our employees are the Group’s most important resource. We aim to attract, retain, and develop our talented employees by offering formal and informal courses and training, and by encouraging an increase in internal mobility by allowing employees to explore in-house career opportunities. We shall help our managers develop, with confidence that they will be positive role models and live up to a standard of leadership based on the Group’s values.
Lerøy provides a world of opportunities for those who want them. I’m a good example of how hard work provides plenty of opportunities.”
- Dovydas Lidzius, Production Controller
The Group has developed a set of objectives and KPIs which are reviewed annually and followed up on least monthly. This balanced set of KPIs includes ESG variables and is broken down from the Group level at
least to the business-unit level. These KPIs are monitored together with project and action lists to ensure development in the desired direction.
Lerøy has developed a significant sustainability library (available at
www.leroyseafood.com) which highlights our key policies and also gives more in-depth information on status and targets.
Key Group objectives going forward to 2025, as communicated on Lerøy’s capital markets day in September 2022, include
bn NOK in revenue by 2030
EBIT/kg for farming and VAPS&D by 2025
1.25
bn NOK in EBIT for VAPS&D by 2025
46% reduction in total GHG emissions by 2030 (baseline 2019)
500 mill NOK in EBIT for Wild catch by 2025
205 000
tonnes harvested in 2025 (Norway)
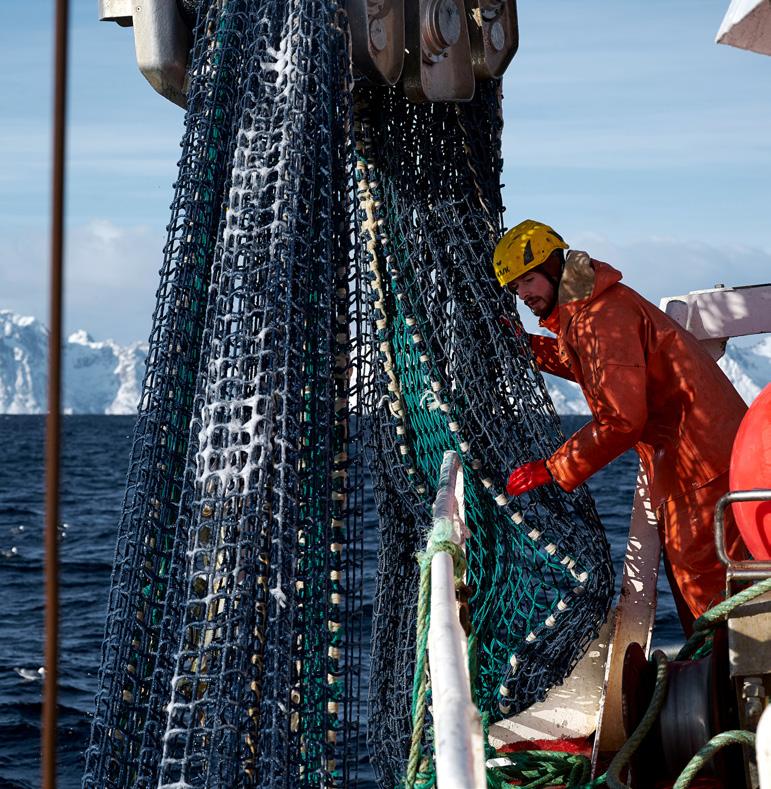
Beyond highlighting where we are going, these KPI’s and their continuous monitoring highlight where we have gaps, related to both our short-term and long-term ambitions. These gaps provide valuable information about where we need to focus our efforts, both in terms of short-term action lists and longer-term initiatives, typically in the form of projects.
Such action lists and processes, with clear roles and responsibilities, are present on the Group and segment levels, and also at least on the business-unit level, and are part of the continuous review of our operations.
While nowhere near a complete list of such initiatives in the Group, the following provides an overview of some of the key strategic projects on the Group and segment levels at the start of 2023. All strategic projects we perform require clear mandates with targets and plans for realizing operational and economic gain, as defined in our standards for project methodology.
Group Digital transformation
HR/ Payroll / IAM
Sustainability in daily operations
Feed strategy
Lerøy Ocean Harvest
Implementing
Lerøy Way
Farming Process improvement land
Improved sea lice control
New production technologies
Wild Catch Raw material strategy
• Access to good data and efficent processes supported by technology and systems are essential for Lerøy to reach its target of becoming the world's mot efficent and sustaiable value chain for seafood. Program to develop more joint systems and processes
• Implementation of a joint HR and payroll system for all the Norwegian subsidiaries in the Group. Standardisation of master data and processes, and sharing of best practices. Establishing HR operational model.
• Sustainability is key to reaching our vision and objectives. Project for increasing knowledge through organisation and ensuring ESG variables are included in all operational meetings
• For the Group's GHG footprint (Scope 3), feed is the most important contributor. Project to ensure we meet our operational targets as well as the target of reducing GHG emissions by 46% in 2030
• Production of low trophic species, like seaweed, are very sustainable. Since 2013, Lerøy has been working with Bellona to industrialise production of low trophic species. Project with aim to scale Lerøy's production of seaweed to 100,000 tonnes in 2030
• Implementing the Group's business system, the Lerøy Way, to ensure continous improvement in our value chain. Implementing principles for how we solve our problems and improve together to reach the target of satisfied customers.
• Lerøy has made significant investments in RAS post-smolt facilities. These are highly complex facilities, where most growth parameters may be controlled. Program to gather and develop knowledge implementing improvements in the process of land-based production, to ensure a robust and well-performing smolt.
• Sea lice pose a core challenge to the efficiency of our farming operations. Project to gather, develop and implement knowledge and improvements within sea lice control
• Reviewing and developing technologies which may reduce sea lice pressure; improving key KPIs for the Farming segment
• There are numerous regulations in the Whitefish industry, and our access to raw material comes from both the trawling and coastal fleets. We have signficant obligations in our land-based industry. Project with aim to better utilise our resource base and increase utilisation in the land based industry
Floating trawl
Green shipping programme
VAP, S&D Higher value creation on 100% of fish
Sustainable logistics
• While restricted by regulations, bottom trawling for several species may be replaced by a floating trawl. Lerøy's aim is to be at the forefront of this development
• Energy needs in the trawling fleet are currently met by fossil fuels. While it will take time, Lerøy is participating in developing alternatives means of propulsion
• From both an environmental and a financial perspective, it makes sense to use as much of the fish as possible, for high-value utilisation. Project with aim to increasing the value of all of the raw material
• To reach our GHG targets (scope 3), we must ensure that our logistics are as efficient as possible. Project to develop larger and smaller improvements wich are both environmentally and financially attractive
The status of our operations is more thoroughly described in the Board of Directors report for 2022, a year in which the Group did not meet all of its targets. However, we are confident that the measures taken, and the way we work, will gradually improve our results in the coming years.
Strategic projects – examples
Strategic program:
Digital transformation
The strategic program Digital Transformation will help realise Lerøy’s strategy and targets by working towards achieving data-driven production, comprehensive and datadriven management of the value chain, datafocused organisation, and further developing digital employees.
• Data-driven production will contribute to better utilisation of available data in production processes and further contribute to stabilising production and making it more efficient through more informed decision-making processes. The use of data to continuously evaluate and scale new and innovative technology will be crucial to realising our growth strategy and to further developing coastal and offshore production.
• Comprehensive and data-driven management of the value chain will ensure that raw material is processed optimally at all stages and that products are priced and routed correctly. Comprehensive insight into customers and markets will enable us further to develop our strategic partnerships and positions in existing and new markets, increase sales volume, and contribute to the development of an attractive and profitable product portfolio.
• A data-focused organisation has the ability to establish and further develop a learning and digital culture, which is crucial to success within the digital transformation program and Lerøy’s strategy. A digital culture requires structured training, good communication, and the promotion of data and digital solutions as an integral part of all business processes and roles.

• Further developing digital employees is at the centre of a forward-looking Lerøy, where the digital employee actively contributes to value creation and innovation through the right competence and tools adapted to their everyday working life.

Strategic program: New production technologies
Lerøy is working in a structured way to adopt new production technologies. The coastal production technology program consists of a number of projects intended to adopt new and improved production technologies within coastal aquaculture. The motivation is to run existing production in an even more sustainable way and to enable the company to exploit new growth opportunities. The program’s purpose is to help strengthen important value drivers of the segment.
• Developing and testing new conceptual solutions to protect the biomass towards lice and at the same time safeguard the environment is an area of great focus in the program. These technologies are aimed at locations that have particular challenges with lice. The program has made a separate strategy for how this focus area is to be carried out, and which technologies should be chosen for different locations. Lerøy collaborates with a selection of suppliers to further develop existing and new technologies and to test these technologies in actual commercial conditions.
• Another focus area is to shield the environment around our localities, for example, localities with poor water replacement in the depths of the sea. Lerøy, together with suppliers, has developed a well-functioning concept to reduce the footprint of production by means of collecting the sludge beneath the cages. This technology has been tested on a full scale through several production cycles in Western Norway, where the sludge is collected and further treated.
• A third important area of focus is to operate more on a factual basis. Thus, we have a project that helps capture the necessary data at our localities. The project focuses on standardising data collection across our localities, as well as testing and implementing new sensor technology. One example is testing biological monitoring of the fish with the use of underwater cameras and AI-technology.
Bjarne Reinert COO Farming Lerøy Seafood Group Sjur S. Malm CFO Lerøy Seafood Group Siren Grønhaug CHRO Lerøy Seafood Group Ivar Wulff COO Sales & Distribution Lerøy Seafood Group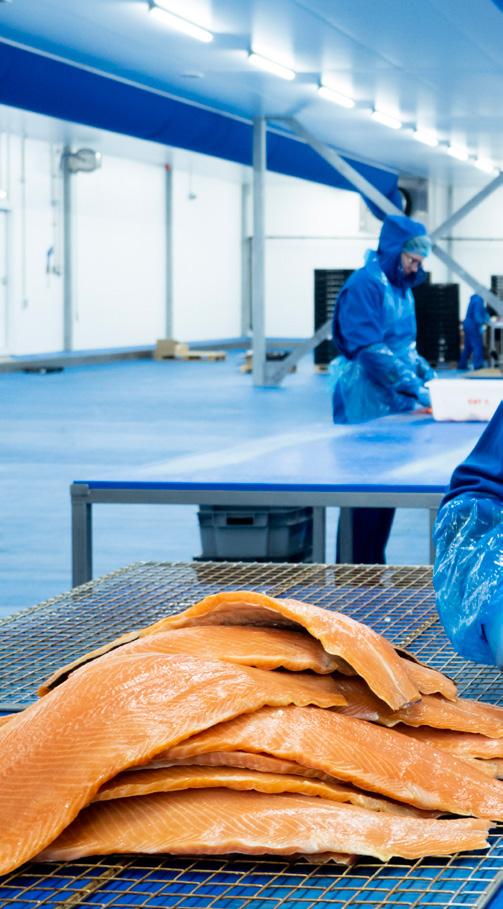
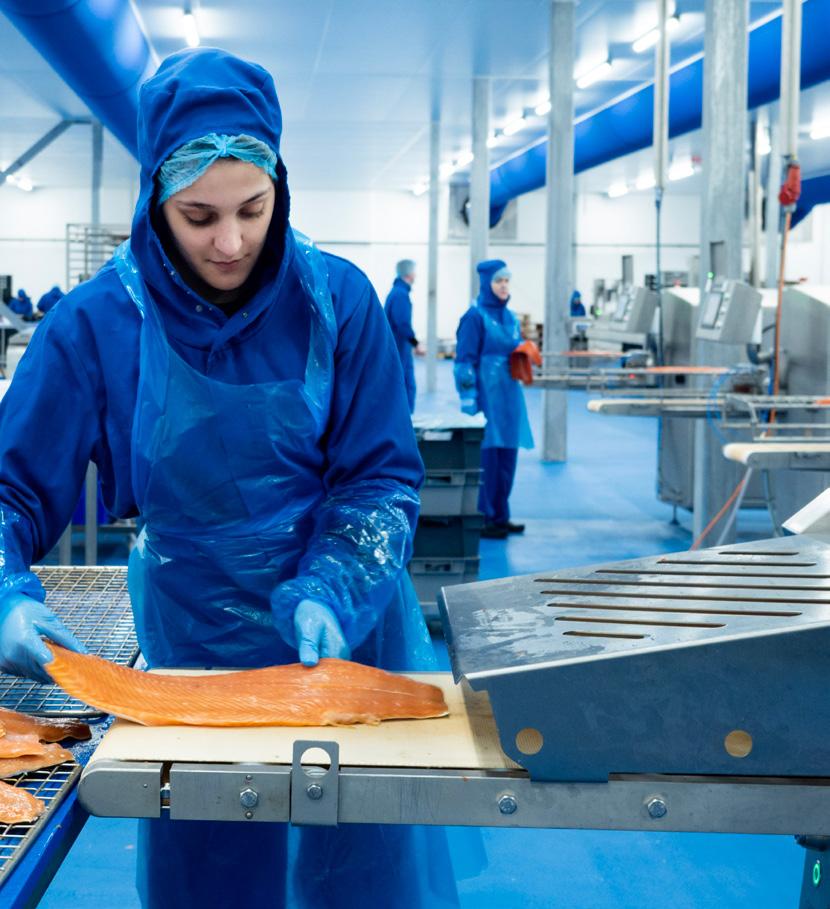
The sea gave Norway jobs. Creating value along its coastline, from north to south. The basis of Norway’s export adventure.
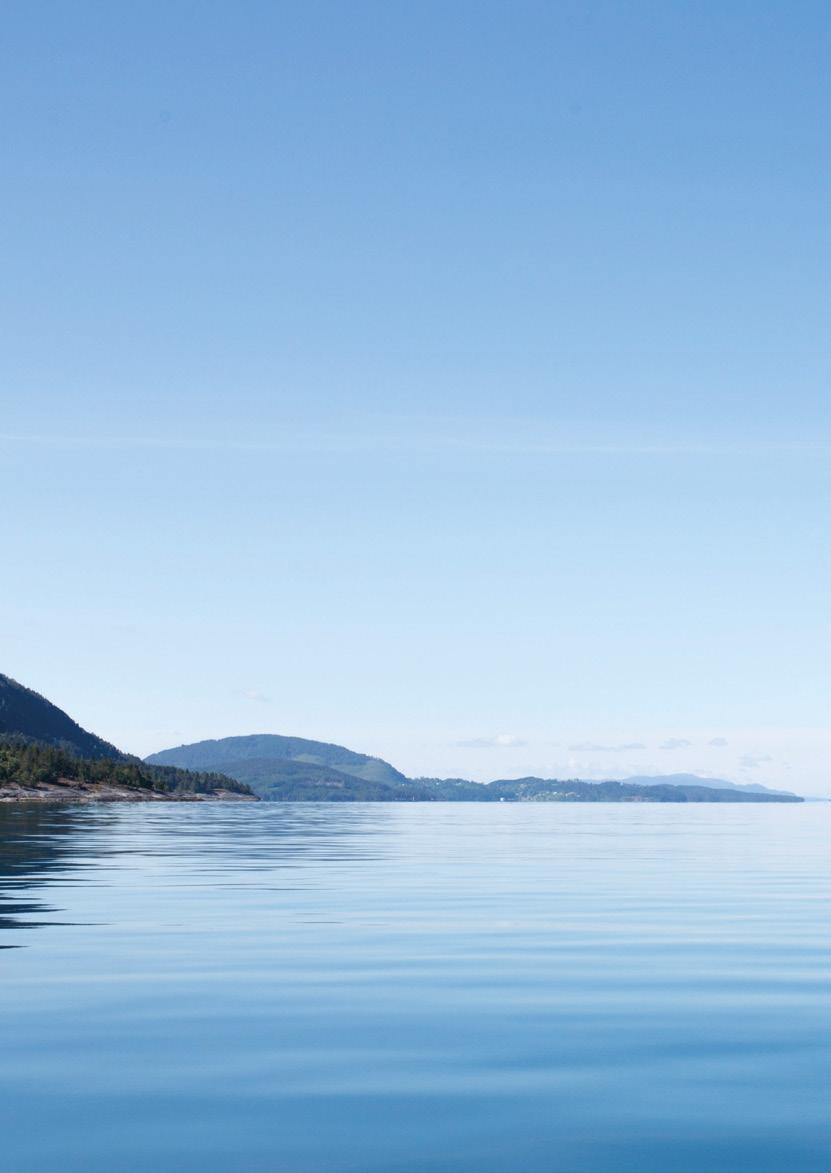
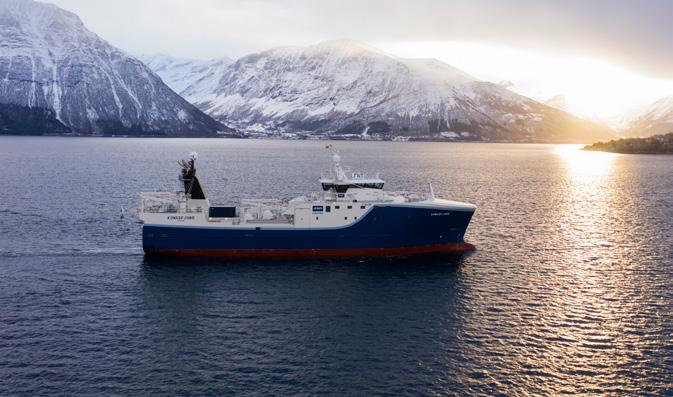
Honest, Open, Responsible and Creative Vision
To be the leading and most profitable global supplier of sustainable high-quality seafood
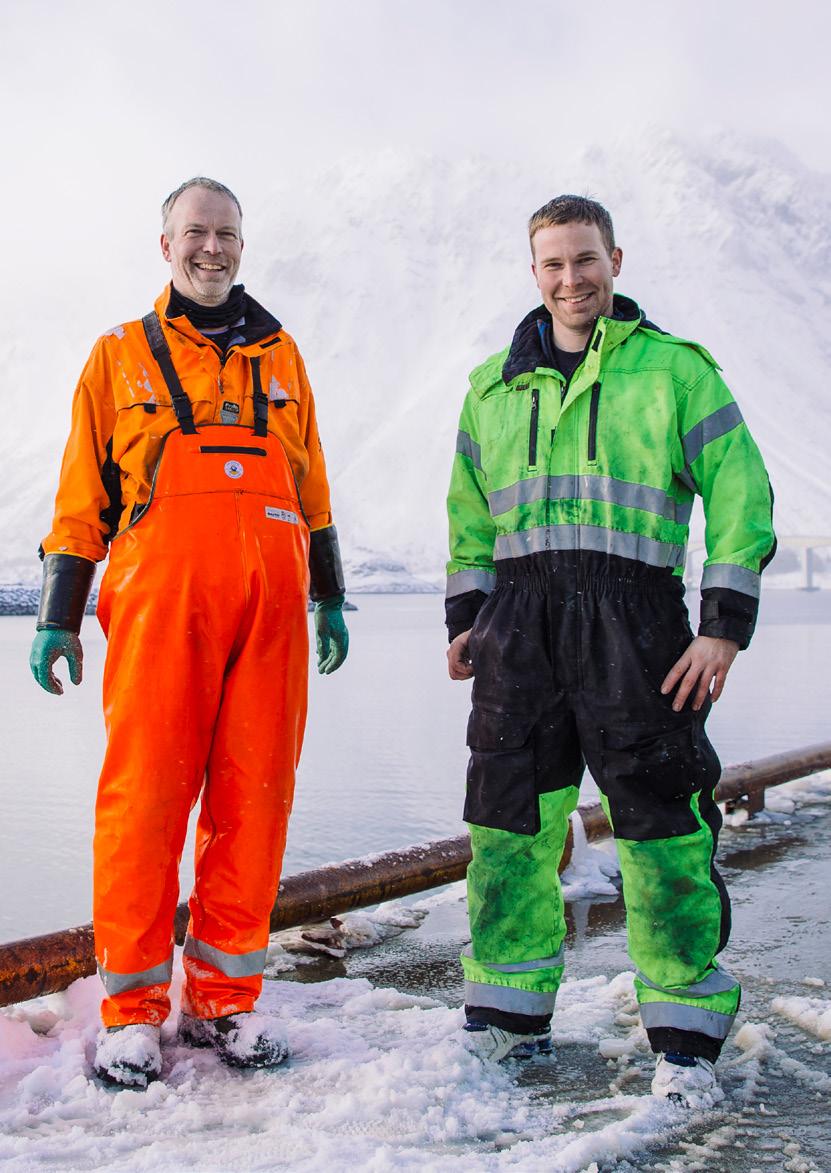
Lerøy Seafood Group currently has a fully vertically integrated value chain within both redfish and whitefish. It is the leading Norwegian seafood company and, therefore, one of the world’s leading seafood corporations. The Group has a clear ambition to further develop this position in the years to come.
The Group’s earnings in 2022 were stronger than in 2021. The past year was impacted by the surge in demand following the lifting of COVID-19 restrictions, which resulted in high and volatile raw material prices and cost increases across the value chain. Compared to 2021, revenue was up 15%, to a record high NOK 26.6 billion. This is in line with the Group’s strategy for growth. The operating profit before biomass adjustments was up from NOK 2,519 million in 2021 to NOK 3,195 million in 2022.
Our associates represent substantial value for the Group. The operating profit from associates, before a fair value adjustment related to biological assets, was NOK 54 million in 2022, compared to NOK 115 million in 2021. The decline was driven by challenging biological conditions in the Group’s associated company, Norskott Havbruk AS, which is the secondlargest farming company in the UK. The Group’s net financial items for 2022 totalled NOK -282 million, compared to NOK -194 million in 2021.
Profit in 2022, before taxes and a fair value adjustment related to biological assets, was NOK 2,967 million, compared to NOK 2,440 million in 2021. Earnings per share, before a fair value adjustment related to biological assets, were NOK 3.59 per share in 2022, compared to NOK 3.08 per share in 2021. At the annual general meeting, the Board of Directors will recommend a dividend payment of NOK 2.50 per share in 2023.
The company’s dividend policy reflects the strategy that dividends should lie in the vicinity of 30% to 40% of profit after tax, over time, while ensuring that the Group has sufficient liquidity to undertake potential new and profitable investments. The board’s dividend recommendation reflects the Group’s solid statement of financial position, satisfactory financing, and positive outlook.
As further commented in “Market and outlook” the Norwegian government proposed to impose a resource tax on the Norwegian aquaculture industry. This tax will likely be put in to law before summer 2023, and will impact the Group’s ability to make investments and pay dividends.
In 2022, the return on the Group’s capital employed, before a fair value adjustment related to biological assets, was 14.5%, compared to 12.4% in 2021.
The Group is financially sound, with a book equity of NOK 21,024 million, equivalent to an equity ratio of 56.7%. In 2022, the cash flow from operating activities totalled NOK 2,275 million, compared to NOK 3,740 million in 2021. While the Group released a significant amount of working capital in 2021, the activity and price increase after the lifting COVID-19 restrictions has provided a significant working capital build in 2022. Net interest-bearing debt was increased from NOK 3,297 million at year-end 2021 to NOK 4,346 million at year-end 2022.
The net cash flow from investing activities for 2022 was negative, at NOK 908 million, compared to a negative figure of NOK 1,440 million in 2021. Please note that investments in right-of-use assets are not included in the cash flow from investing activities, as these investments, naturally, do not generate any initial cash impact. The total investments in own assets, fixed assets leased from credit institutions and intangible assets totalled NOK 1,116 million in 2022, compared to NOK 1,182 million in 2021. The largest single investment in 2022 was to complete the post-smolt facility at Lerøy Midt.
In 2022, the Group paid dividends of NOK 1,560 million, of which NOK 1,489 million were from the parent company to the shareholders of Lerøy Seafood Group ASA. The
Development in return on capital employed and profit/loss before tax and fair value adjustment for fish in the sea
corresponding figures for 2021 were NOK 1,202 million and NOK 1,192 million, respectively. In a rating process in 2021, the Group was classified as ‘investment grade’ and issued its first bond loan, totalling NOK 1.5 billion, divided into three tranches. These mature five, six, and ten years after issue, respectively.
Early in the third quarter of 2022, the Group’s ‘investment grade’ credit rating was lifted from BBB to BBB+. In April 2023 Lerøy issued new green bonds, this is further descibed in Note 26 Events after balance sheet date.
The Group’s statement of financial position totalled NOK 37,062 million as of 31 December 2022, compared to NOK 34,194 million as of 31 December 2021. Over the past twenty years, the Group has based its growth on several factors, including financial flexibility. The Board of Directors is of the opinion that such financial flexibility is important to enable the Group to generate further profitable, organic growth, carry out strategic acquisitions, establish alliances, and continue the company’s dividend policy. This satisfactory financial position supports the Group’s ambition to be the leading Norwegian seafood company and one of the world’s leading seafood corporations in the future.
The Group compiles its financial reports in accordance with the International Financial Reporting Standards (IFRS).
The Wild Catch segment
Wholly owned subsidiary Lerøy Havfisk carries out the Group’s Wild Catch operations. Lerøy Havfisk has licence rights to harvest just above 10% of the total Norwegian cod quotas in the zone north of 62 degrees latitude, corresponding to around 30% of the total quota allocated to the trawler fleet. Lerøy Havfisk also owns several processing plants, which are mainly leased on long-term contracts to its sister company, Lerøy Norway Seafoods (LNWS). Lerøy Havfisk’s fishing/trawler licences stipulate an operational obligation for these processing plants.
The Lerøy Havfisk catch was about 72,000 tonnes in 2022, which is basically in line with 2021.
The quota for cod was reduced by around 20% for 2022, compared to 2021, and the reduction of cod volumes was replaced by higher catches of redfish. Redfish is a lower-value species, but with strong demand for seafood since the lifting of restrictions related to COVID-19, there has been a significant price increase. Despite a mix of lowervalue species, the average price realisation per kilo increased by around 26%. With even volumes and higher prices, the catch value was substantially higher than in 2021 and at record levels. The high catch value was off-weighted by increased in the cost of labour and fuel. For the year, the cost of labour was up around NOK 130 million, and the cost of fuel was up around NOK 170 million.
LNWS’s primary business is processing wild-caught whitefish. The company has the use of twelve processing plants and purchasing stations in Norway, five of which are leased from Lerøy Havfisk. For several years, processing whitefish in Norway has been extremely challenging. Also, in 2022, the onshore industry took a loss, and with the market dynamics of increasing prices and lower quotas, this loss was higher than in 2021, despite continued signs of improvement in operational KPIs.
The Group’s focus on improving the competitiveness of the whitefish industry is a long-term project and continues undiminished. The objective is to increase profitability to NOK 500 million by 2025 and ensure sufficient profitability to continue to develop this part of the value chain, which is also capital intensive. For 2022 in total, the segment contributed an operating profit of NOK 348 million, compared to NOK 340 million in 2021.
The Farming segment
The Farming segment is divided into three regions: North Norway, with Lerøy Aurora in Troms and Finnmark; Central Norway, with Lerøy Midt in Nordmøre and Trøndelag; and West Norway, with Lerøy Sjøtroll.
In recent years, the Group has made substantial investments to increase smolt capacity and implemented a number of improvements. This has
yielded growth, but in 2022, the Group experienced a setback. From a harvest volume of 187,000 tonnes in 2021, the Group’s harvest volume of salmon and trout fell 6%, to 175,000 tonnes, in 2022. While the Group was able to reduce mortalities in 2021 compared to 2020, this trend was reversed in 2022. Several projects and actions are in motion to reduce mortality, increase growth speed, and reach the Group’s targeted harvest volume of 205,000 tonnes in 2025. Given the long growth cycles of salmon and trout, the results of these initiatives will be seen only gradually, but the Group is confident they will materialize.
The COVID-19 pandemic significantly impacted demand in recent years. In 2022, most restrictions related to this pandemic were lifted, which led to a surge in demand for seafood – including salmon and trout – probably driven by the return of hotels, restaurants, and catering (HoReCa), with retailers fighting for their market share. These dynamics caused a significant increase in spot prices. The spot price for salmon increased from NOK 57 in 2021 to NOK 79 in 2022, and at some points in the year, the price was significantly higher than that. This price increase was significantly higher than Lerøy had estimated, and a contract share of close to 40% for the year significantly impacted price realisation. The price realisation for salmon in the Farming segment increased by NOK 11 per kilo in 2022 compared to 2021, however, given the increase in trout prices, the overall price realization was up around NOK 15 per kilo.
The economic inflation in prices since the lifting of pandemic-era restrictions has also taken its toll, driving up costs in general. In 2022, the Farming
segment experienced significant cost increases: overall, costs rose approximately NOK 6 per kilo, compared to 2021. Feed was the most dominant cost driver, but energy costs also had an impact on among others fuel cost to well boats as well as EPS boxes used for transportation of the fish. For 2023, we expect further cost increases, driven predominantly by feed costs.
In sum, this gave the Farming segment earnings before interest and taxes, EBIT, per kilo of harvested salmon and trout of NOK 18.0, an increase from NOK 9.5 in 2021. Thus, with lower volume and a higher margin, the Farming segment’s operating profit before fair value adjustment was NOK 3,145 million in 2022, compared to NOK 1,768 million in 2021.
With a fully integrated and costefficient value chain for seafood, including salmon, trout, whitefish, and shellfish, Lerøy Seafood Group offers products customised to consumer preferences. Proximity to key markets and knowledge of the customer’s needs are therefore of decisive importance, if the Group is to develop demand for its main products. Lerøy distributes a wide range of seafood products to more than eighty different markets. In addition, the Group processes and distributes a number of market-specific seafood products in local markets where Lerøy has operations. The Group’s value chain shall be developed further, to satisfy and increase the consumer’s demand for seafood.
In 2020 and 2021, seafood markets were negatively impacted by the COVID-19 pandemic, which affected demand patterns. A higher share of
the flow of goods shifted to the retail sector, while the HoReCa segment in many core markets was practically closed down for long spells. Since the second half of 2021, with the gradual lifting of restrictions related to the pandemic, the demand for seafood has returned to record-high levels, driven by continued strong retail demand and a positive development in the HoReCa segment.
In its 2021 annual report, Lerøy wrote, ‘The Group foresees very strong growth in demand for seafood’. This proved correct, and demand growth was well beyond these high expectations. In 2022, the VAP,S&D segment reported weak earnings driven by contract positions, as well as the significant supply chain turmoil seen in the aftermath of the pandemic , and dramatic implications on energy prices and adjacent factors caused by the tragic Russian invasion of Ukraine, with significant increases in transportation cost and manufacturing cost globally.
Thus, following 2021, a year in which operations and financial results in the Groups improved, 2022 yielded revenue growth but a clear setback in profitability. Revenue was up from NOK 21,972 million, in 2021, to NOK 25,504 million, in 2022, while the operating profit before biomass adjustments fell from NOK 630 million, in 2021, to NOK 156 million, in 2022.
2022 was a challenging year for our downstream operations, with financial performance well below expectations. We have strong belief 2023 will bring significant improvements.
The Group’s joint ventures and associates represent substantial value. The most important are Norskott
Havbruk AS (50.0%) and Seistar Holding AS (50.0%).
Norskott Havbruk AS owns 100% of the shares in Scottish Sea Farms Ltd. (SSF). SSF is one of the largest aquaculture companies in the UK. In 2022, SSF harvested 36,000 tonnes of salmon, up from 32,000 tonnes in 2021. The operating profit, before fair value adjustment related to biological assets,
fell from NOK 244 million, in 2021, to NOK 214 million, in 2022. The biological conditions in the UK and for this operation in 2022, particularly in the second half of the year, were very challenging. This challenging biological situation also had an impact on the harvest volume. In 2023, SSF plans to increase its harvest volume to 37,000 tonnes.
Well boat shipping company Seistar Holding AS is an important supplier of services to Lerøy Seafood Group and other aquaculture businesses, primarily in the West Norway region. The company reported an operating profit of NOK 53 million in 2022, consistent with NOK 50 million in operating profit in 2021. Seistar Holding AS has two new wellboats in the pipeline for delivery in 2023/2024.
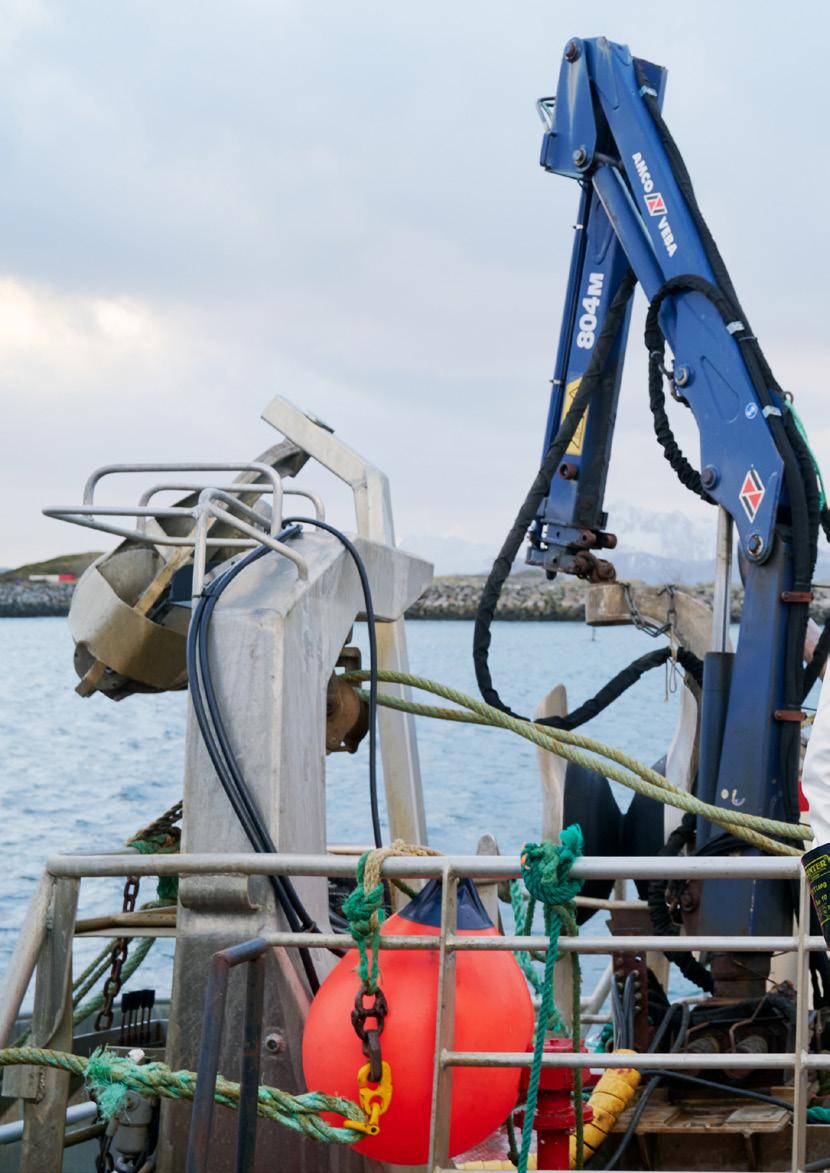
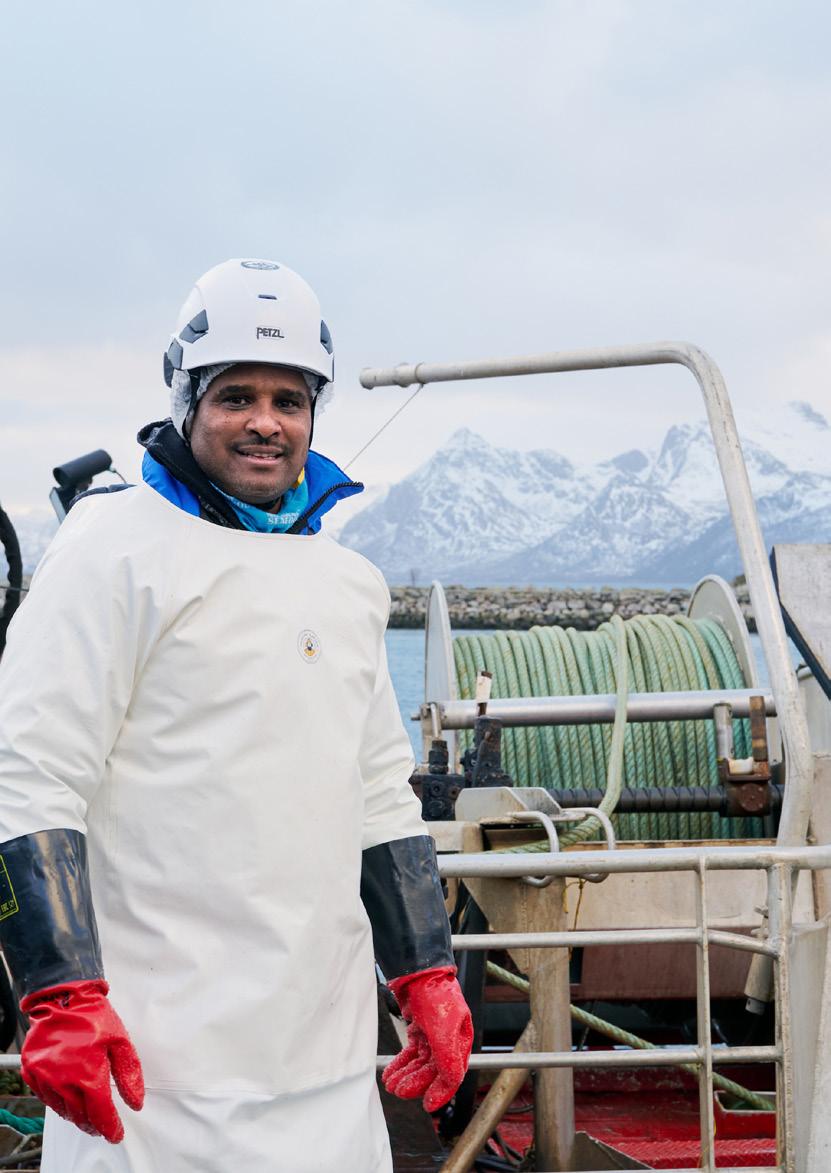
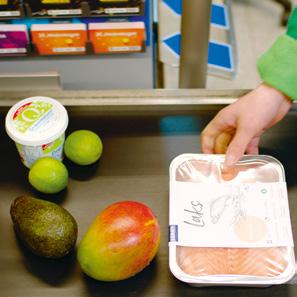
We strive to work as sustainably as possible in every part of our value chain. This allows us to guarantee efficiency, quality and food safety at every part of the value chain, so that you can enjoy safe and delicious seafood.
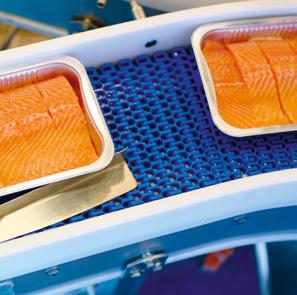
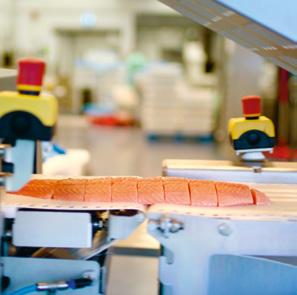
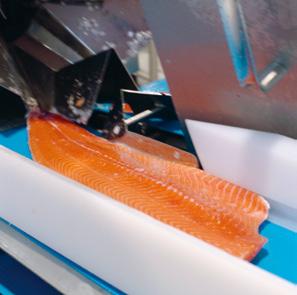
Good risk management is of decisive importance if the Group is to successfully achieve its vision of being the leading and most profitable global supplier of sustainable, high quality seafood. Our ability to understand
risk is crucial, both preventively but also to ensure that we are in a position to create new opportunities and innovative solutions. Risk management is an integral part of our corporate governance, and is performed at various levels in the Group.
A thorough risk analysis comprising descriptions of strategic (S), financial ( F ) and operational (O) risk lays the foundations for our strategic efforts.
Below is a list of the most significant risk factors for Lerøy Seafood Group.
FINANCIALLY RELATED RISKS
Changes in consumer preferences
O Consumer preferences may change rapidly, causing a reduction in demand for our products – such as a trend towards vegetarianism or veganism
The consumers choose products that are not in our product range, having an impact on our profitability
Predict, identify and accommodate changes in consumer preferences
Adapt products to the consumers’ preferences
Innovation: Update and renew the product range
Ensure sustainability and reduce reputation risk related to e.g., fish welfare
Competition and new technology
S+O The seafood industry is international
This means global competition and a highly dynamic industry
One premise for Lerøy’s survival is that we are the most successful business, over time, in solving our customers’ problems
Competitive strengths are absolutely essential for the Group
Lerøy takes a structured and consistent approach to delivering the best, most efficient, sustainable and innovative solutions to our customers
Lerøy works actively to implement our “Lerøy Way” business system, to ensure we continue to succeed in finding efficient solutions to our customers’ problems
We take a structured approach to technology, staying up-to-date with developments and being ready to make use of new technology when it is available
Credit risk F+O A sale is not complete until the customer has made payment
Good control of credit risk is essential for profitability
Good sales routines, including approval of customers and credit routines, play a decisive role in minimising credit risk
Close cooperation with various credit insurance companies and use of various tools to minimise risk related to credit
All new customers undergo credit rating
Currency risk F The Group is an international corporation and will be affected by currency exchange rate fluctuations
Customer risk O The Group’s activities rely on customers
Changes in exchange rates can result in significant changes in the Group’s competitiveness and earnings
At Lerøy, we create value via our customers, and customers are absolutely essential for our value creation
The Group has clearly defined routines and a long and successful history in managing risk related to currency
The Group works actively to build long-term, strategic customer relationships in which values for both parties are created over time
The Group has and shall have a wide range of customers in order to minimise risk related to individual customers
Financial risk F The Group relies on access to capital in order to operate If the Group loses the confidence of investors on financial markets, it will not be able to finance either new or existing operations
The Group’s comprehensive set of routines and processes for risk management are key in minimising financial risk
Continuous and compliant reports and information describing the Group’s development are essential in sustaining and developing confidence
Interest rate risk F The company has debts with floating interest terms
The company is partly financed by loans with floating interest rates, which may result in an increase in interest expenses
Use of different fixed-interest instruments, and loans in different currencies
A strong financial position comprised to allow management of fluctuations in interest rates and market conditions
Key suppliers O
The Group does not produce its own feed and relies on third party suppliers for feed and well boat services for our farming segment.
If a supplier terminates a contract before the expiration date at short notice, the Group might have to locate alternatives driving up costs in the short term.
Close collaboration with key suppliers on long-term contracts with termination clauses to ensure a steady feed supply.
Liquidity risk F+O
The Group has exposure as part of an industry with a high level of volatility affecting earnings and liquidity. Examples, but not an exhaustive list, are:
Fluctuations in the prices for salmon, trout and whitefish
Fluctuations in production and harvest volumes
Changes in feed prices. Feed costs are impacted by price developments for marine raw materials and agricultural products
Market risk O The Group’s results are closely linked to developments in the markets for seafood. One key factor here is the prices for Atlantic salmon, trout and cod
Poor or insufficient liquidity
A financial position suited to our operations
High expertise relating to the markets where we have operations
Good systems for risk control
Pricing is determined in the balance between supply and demand. Major imbalances here will have a substantial impact on Group earnings. The COVID-19 pandemic is one example of a significant change in demand. The Group’s earnings will continue to be affected by developments in both supply and demand in the future. Price reductions will also bring about a reduction in the value of the standing biomass
RISKS RELATED TO OUR SUPPLY CHAIN AND PRODUCTION
Biological risk
O Disease and lice can entail increased costs for the company
Norwegian authorities have set upper limits for the number of lice on each fish
Active efforts to increase demand for the Group’s core products by means of innovative, sustainable and competitive solutions for the end consumer, in close cooperation with strategic customers. This will help increase demand over time. A specific share of revenue as contract sales
Corruption O
The Group operates in regions with an elevated risk of corruption and must actively promote ethical business culture and anti-corruption measures as an integral part of our corporate responsibility to protect our reputation and stakeholder interests.
A breach of the limit values for lice could result in sanctions from the authorities
If measures are not taken quickly to combat lice and other diseases, expensive treatments may be necessary, with reduced fish welfare and increased costs
Corruption poses a risk to the Group, as it may incur legal sanctions, reputational damage, loss of business opportunities, and decreased employee morale.
Clear and continuously developed lice strategy
Internal control system designed to minimise risk
Improvements to monitoring (via R&D) in order to detect lice and disease more rapidly
Zero-tolerance policy towards corruption.
Committed to conducting business in accordance with our Business Code of Conduct, applicable laws, regulations, and international guidelines on anti-corruption.
Business relations that don’t comply with the Business Code of Conduct or policy will be terminated.
Employees are trained on ethical business conduct and how to handle ethical dilemmas they may encounter.
Concerns about corruption can be reported through independent internal or external channels, including anonymous reporting.
Feed quality O Optimal nutritional composition is essential to ensure good animal welfare, growth performance of our fish and quality of our products.
Suboptimal feed composition may result in nutrient deficiencies and reduced growth.
Poor feed quality may result in low levels of essential nutrients like vitamins, minerals, and fatty acids in finished products. Presence of undetected harmful contaminants may pose a health risk for fish or worst case for humans, leading to liability claims.
Close collaboration with feed manufacturers to tailor feed composition to our specifications
Continuous monitoring and testing of feed ingredients and certification of raw materials.
Food safety, product quality, customer satisfaction
O The Group sells seafood to consumers. The seafood we sell must be safe for consumers to eat
The Group’s sales are reliant on full confidence in food safety. Such confidence is a prerequisite for demand for the Group’s products, and thereby profitability
Any decline in food safety or product quality could have negative repercussions and result in lower customer satisfaction. Publications with a negative message may also affect customer satisfaction
The Group has comprehensive processes and routines to ensure and verify food safety and a culture for food safety
By using the Lerøy brand on packaging, the Group communicates a focus on quality and food safety throughout the entire value chain
Frequent tests and quality verification to confirm the required level of product quality
Make demands on the suppliers relating to the quality of raw materials/input factors in our products
HSE
O Safety first. The Group shall have safe working conditions for its employees, ensuring that operations can be performed without any risk. This has highest priority
Higher number of accidents involving injuries and, in the worst case scenario, fatalities
High focus on training, guidance, mentoring and compliance with procedures
Continuous evaluation and analysis of HSE measurements
HSE review as an integral part of continuous operational follow-up
Group HSE Lead
Leadership development
Human rights violations
IT security risk
S+F Lerøy has a very complex value chain where many people are involved in many different countries.
O+S
Breach of our Supplier Code of Conduct and human rights.
See the Group`s Sustainability library for closer comments.
Smolt strategy/ smolt production
Vulnerable IT infrastructure, digital dependence and unsatisfactory cyber security combined with complex and unknown problems
Potential threats to the company’s finances, reputation, theft of critical business information
Focus on preventive IT security work
Stringent regime for security updates
Continuous monitoring of specific parts of ICT systems
Plans detailing how the company shall take action during and after a cyber attack
Training and information campaigns
Sabotage
The Group has invested heavily in top modern technology and facilities to produce bigger, more robust smolt to shorten the production time in the sea phase of salmon and trout.
Given that some environmental organisations aim to eliminate fish farming or animal production, the risk of sabotage cannot be completely dismissed.
Failing to shorten the sea phase or producing robust fish will lead to increased costs related to treatments, delousing and increased mortality.
Depending on the form, sabotage may negatively affect fish welfare, lead to escapes, or threaten the safety of our employees.
R&D efforts with industry partners and academia to optimize rearing conditions, biological factors, and production strategies.
Continuous dialogue with stakeholders.
Safety measures at all our farming facilities include video surveillance and regular visual control of net pens to avoid escape incidents.
Traceability
O The Group must ensure full traceability for its products in order to ensure reliability, confidence and food safety
Without traceability, the Group will not have control and will be in breach of regulatory requirements
Continue to build upon internal requirements, carry out audits and further develop the Group’s electronic traceability systems
Fishtrack (online tracking system) with extended tracking solutions for customers (blockchain etc.)
Certification requirements
S+O
The consumers appreciate products with certificates, and the grocery chains etc. are increasingly demanding certification
Loss of market share if Lerøy is not able to offer certification as requested or will be requested
The customers will choose other products with the correct certification
Take a leading role in terms of existing and new potential certification
Implement stringent requirements for own production and verify this with own certification/requirements (STP 86 Salmo Salar)
Change in allowable biomass/licence conditions
O The traffic light scheme may result in reductions to maximum allowable biomass in certain geographical (vulnerable) areas
Reduced biomass will result in lower production and lower profit
High operational focus to ensure compliance with framework conditions laid down by authorities
Close dialogue with authorities
Testing and documentation of seabed conditions and other environmental factors around the cages to clearly communicate no/low impact on environment
Continue strategy for onshore smolt/ post-smolt facilities to reduce the period of time the fish are in open cages
EU competition authoritie
F On 20 February 2019, the EU competition authorities (”the EU Commission”) started an investigation into suspected anticompetitive practices in the salmon market. Lerøy Seafood Group ASA is one of the companies named in the case.
See the Board of Directors’ report for further comments
See the Board of Directors’ report for further comments
Resource tax
S+F+O The Norwegian government has proposed increased ground rent tax on aquaculture of salmon and trout in Norway.
Substantial reduction in the Group’s capital base which is a prerequisite for future development.
See the Group’s “høringssvar” for more information: https:// www.leroyseafood.com/ globalassets/leroy-seafood/ about-leroy/news/norgetaper/220401-leroyhoringssvar.pdf
Ensure policy makers have access to the right information, where consequences of regulatory changes are made clear.
Limitations for production in open cages
O+S In general, stronger focus on reduced environmental impact around cages
Canada has introduced a prohibition against open cages in certain areas
Requirement for closed cages will entail significant investments
May make onshore farming more attractive
Restrictions in terms of locations, sill fjords, prohibitions, distance from river mouths etc.
Close dialogue with authorities
Testing and documentation of seabed conditions and other environmental factors around the cages to clearly communicate no/low impact on environment
Technological developments
Create strategy and plan for onshore smolt/post-smolt facilities and/or closed/ semi-closed facilities
More stringent requirements on bottom trawling
O Some interest groups may be critical to bottom trawling
Bottom trawling can have a negative impact on seabed conditions, which may result in restrictions on use
Clear guidelines for trawling areas
Protection of vulnerable areas
R&D and skills development
Assess use of other fishing equipment
Negative media coverage
S+O+F Both fish farming companies and wild fisheries are subject to criticism from NGOs, research communities and other stakeholders.
Widespread criticism of our operations may negatively affect the public’s view of our production and lower the demand for our products or inspire restrictive legislation affecting our business.
Communication with stakeholders through meetings, annual reporting, and environmental reporting through initiatives such as GRI and CDP.
New regulations, compliance with legislation and regulations
Political risk
O Breach of legislation and regulations, including code of conduct
Implementation of new regulations
O The Group is a significant owner of farming licences in Norway and the UK, and of wild catch quotas in Norway
Sanctions, penalties, negative impact on the company and earnings
Continuous training, information campaigns
Close contact with legislative bodies
Monitoring, control and audit
Requirement for low/zero emissions from service boats
O The Government’s climate plan 2021-2030 includes a requirement for low or zero emissions from service boats in the aquaculture industry, and will be introduced stepwise from 2024
Sustainable change S+O+F Uncertainties involving a successful strategy for achieving sustainable change to low emissions society
Changes in framework conditions, including lack of predictability, may inhibit long-term investments and impair competitiveness for the industry and the Group over time
True to the Group’s objectives, Lerøy is a major contributor to the communities where we have operations
Providing information on our industry and operations, and a long-term perspective in the Group’s investments and decisions, are premises for a mutual understanding of what it takes to succeed in a global and competitive industry
Changeover to battery/ hydrogen propulsion for service boats
Closely follow developments to allow the changeover from fossil fuels to alternatives with a lower environmental footprint
Trade barriers
O The seafood industry is international. The Group’s operations relating to raw materials mainly take place in Norway, and Norway is a significant exporter of seafood
Not possible to achieve necessary cuts in greenhouse gas emissions
The company is not able to satisfy investment requirements
The company does not qualify for the terms and conditions provided by the banks for green loans
Trade barriers have been and will remain a considerable risk factor for the industry
Trade barriers have had and are likely in the future to have an impact on demand for and, consequently, pricing of the Group’s products
Detailed sustainability strategy with specific ambitions, goals and measures
Continuous and comparable sustainability reporting that is relevant to decisions
Strategic investments in innovative and sustainable solutions
By ensuring sales to a large number of markets, the Group is less reliant on individual markets, thereby reducing risk
Climate transition risk S+O+F Increased focus on climate change may drive forward new legislation affecting our operations through carbon taxes, emission caps, green financing etc.
Increased operational costs and loss of future business opportunities if we fail to successfully transition according to new expectations and regulations.
Failure to qualify for green loans.
Understand, measure and create plans and strategies for further improvements to environmental sustainability Form alliances, enter into new R&D partnerships and boost existing ones
Finance green and sustainable innovation projects/research and invest in sustainable and innovative technologies, which are a key element in the transition to a low-emissions society
“Ghost fishing” and loss of equipment/ plastic in the sea
O Lerøy fishes with trawls, and the level of loss of fishing equipment with this method is low. Other catch methods than those used by the Group are vulnerable to ghost fishing. This is when lost fishing equipment continues to catch fish after it has been lost in the sea
We work actively with our suppliers to avoid loss of equipment
Marine pollution O Our fish farming facilities use open net pens and are therefore vulnerable to potential pollutants present in the marine environment, this also applies for our wild catch segment which sources raw material from the sea.
Physical climate risk
S+O+F Extreme weather events and temperature rise is expected to increase due to global warming and climate change.
Can damage biodiversity and impair the company’s reputation
The Group’s fisheries are carried out by a fleet of trawlers, where loss of equipment is a minimal risk. If any equipment is lost, active steps are taken to locate and recover it
Good routines and processes to prevent loss of fishing gear
Incidents such as oil spills and chemical leaks may severely affect the health and performance of our fish and may ultimately affect our products making them unsafe for human consumption.
Extreme weather may damage equipment, lead to escapes, or otherwise obstruct our operations, thus driving up operational costs.
Rising sea temperatures may affect fish welfare or cause favourable conditions for harmful algae blooms.
Each company in our value chain has its own Quality Department with expert personnel who continuously monitor potentially harmful substances and pollutants in all our products.
All farming sites have updated plans and trained personnel in case of emergencies such as local marine pollution.
Thorough assessments prior to selection of plant and equipment in order to ensure they are appropriate for our operating environments. All farming sites regularly undergo maintenance and supervision to safeguard our facilities from extreme weather conditions.
Good understanding of risks to ensure appropriate insurance
Environmental factors such as oxygen concentration and temperature are constantly monitored during feeding and other operations.
Risk-based algae monitoring in cooperation with authorities and other parties.
Emergency plans to reduce consequences.
See TCFD report for closer comments.
Raw material availability/ Feed availability / Feed prices
O+F Availability and prices of raw materials such as fish oil, fish meal, soybean concentrate and other cereal used in feed fluctuate with a range of factors such as harvest volumes, weather phenomena, and global events and are likely to be affected by a changing climate.
Global aquaculture production is growing, and increased demand and lower supply of ingredients will increase feed prices and in turn affect our profitability.
R&D efforts and strategic partnerships to develop new alternative feed ingredients.
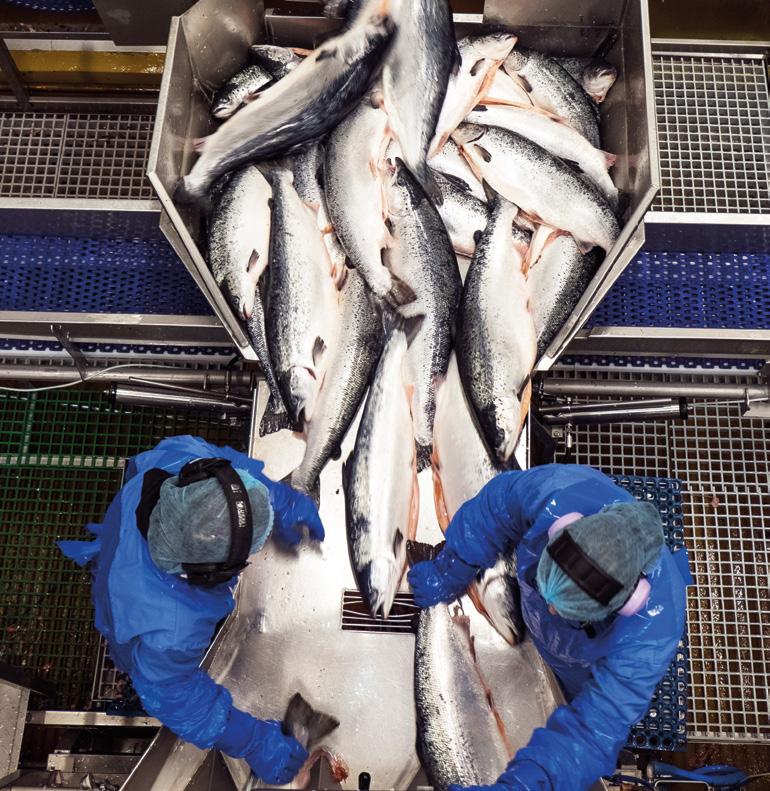
The Group aims to generate lasting value through its activities. For this reason, stringent requirements are imposed on risk management and the ability to plan for the long term in developing sustainable strategic business processes.
Through organic growth and a series of acquisitions carried out since its stock exchange listing on 3 June 2002, the Group is now one of the world’s largest producers of Atlantic salmon and trout. The acquisitions in 2016 of Havfisk ASA and Norway Seafood Group AS have made the Group the largest supplier of whitefish in Norway and a major supplier worldwide. In recent years, the Group has also developed and consolidated its position as a central actor in the distribution of seafood in Norway and other major international markets. The Group plays an active role in developing the value chain for seafood, with an increasingly wide global reach. The Group’s goal in the medium term is to create the world’s most efficient and sustainable value chain for seafood. Our dialogue based on trust with various authorities, collaboration with suppliers and strategic customers, and focus on efficiency in our own value chain allow us to create solutions that are both cost-efficient and innovative for our end customers.
Lerøy Seafood Group invests in the Norwegian whitefish sector from an industrial and eternal perspective. The industrial facilities are based on, and reliant on, raw materials both from the Group’s own trawlers and
from suppliers in the coastal fleet. The symbiosis between the onshore industry and the coastal fleet is strong and represents a high level of mutual dependency. Appropriate framework conditions, including predictability, are absolutely decisive in allowing us to play our part successfully as a responsible industrial organisation. The whitefish sector, which is highly capital-intensive, is subject to seasonal fluctuations. We firmly believe that we will only be able to build a sustainable industry and create attractive jobs if we have appropriate framework conditions, investment capacity, product development, and access to the global market.
In recent years, the Group has made major investments in facilities for smolt production, to ensure the Group’s global competitiveness from a longterm perspective. These investments demonstrate not only the capital requirements but also the level of knowledge demanded by advanced food production. To succeed, the Group needs a competent organisation, capital, market access, and globally competitive framework conditions.
The Board of Directors believes that going forward, the Group’s many years of investing in vertical integration, building alliances, developing highquality products and new markets, quality-assuring its value chain, and building its brand will help it to continue to create value. The Group will continue its work to deliver sustainable value creation via strategic business development, operational efficiency improvements, management training, and ongoing employee development. This work will generate growth and, based on customer preferences,
ensure a continuity of supply, quality, and cost efficiency, with scope for increased profitability. Improving operational efficiency at all stages of the value chain is an ongoing process aimed at further strengthening the Group’s financial and environmental competitiveness both nationally and internationally.
The Group’s financial position is very strong, and it is important for the Board of Directors that the Group, through its operations, retain the confidence of participants in the various capital markets. This confidence was recently affirmed, and reinforced, when the company was awarded a credit rating and issued bond loans. Its strong statement of financial position and current earnings support the Group’s clear ambition to remain a leading participant in value-creating structural changes in the seafood industry, both nationally and globally. Lerøy Seafood Group will continue to selectively consider possible opportunities for investments, business combinations, and alliances that could strengthen the basis for further profitable growth and sustainable value creation. This includes investment opportunities both upstream and downstream. In the coming years, the Group will continue its growth strategy, most recently demonstrated by the integration of Seafood Danmark. This requires the Group to continuously develop and improve its performance in all segments throughout the value chain.
On 31 December 2022, Lerøy Seafood Group ASA had 22,698 shareholders, compared to 19,056 on 31 December 2021.
Price developments per quarter, week 1-2013 to week 12 -2023, fresh Atlantic salmon FCA Oslo (Superior quality)
Lerøy Seafood Group vs. Oslo Seafood Index and OSEBX in 2022
The company had 595,773,680 shares outstanding on 31 December 2022. All shares carry the same rights in the company. Austevoll Seafood ASA is the company’s largest shareholder and owns 313,942,810 shares. This corresponds to a shareholding of 52.7%. The company’s twenty largest shareholders owned 76.3% of the shares in the company on 31 December 2022. Lerøy Seafood Group ASA owns a total of 297,760 (0.05%) treasury shares.
The share price for Lerøy Seafood Group ASA fluctuated between NOK 38.8 and NOK 89.3 in 2022. The closing price was NOK 69 at the start of the year and NOK 55.2 at the end of the year.
At the company’s annual general meeting in May 2023, the Board of Directors intends to recommend a dividend payment for 2022 of NOK 2.5 per share. The dividend of NOK 2.5 per share for 2021 was paid out in June 2022.
Insurance policies have been taken out for the members of the Board of Directors and senior executives to cover their personal liability for compensation for economic loss in connection with exercising their duties (Directors’ and management liability). These insurance policies have been subscribed to at market terms with a highly rated international insurance company.
Employees
Parent company Lerøy Seafood Group ASA has its head office in Bergen, Norway. In 2022, the Group had 5,972 employees, of which 3,641 were men and 2,331 women. Of these, 2,379 are outside Norway. In 2022, the percentage of female employees was 39.0 %, up slightly from 2021.
In its recruitment policy and salary systems, the Group has always emphasised the importance of individual skills, performance, and responsibility. The company has at all times aimed to ensure equal opportunities and rights for all employees and prevent discrimination based on gender, national origin, ethnicity, skin colour, language, religion, or personal philosophy. One of our goals is to provide a workplace where there is no discrimination arising from disability. For employees or work applicants with disabilities, the company will arrange for individually adapted workplaces and tasks where possible.
The company is a player in a global industry, and the company’s working environment changes continuously. This requires employees who are willing to adapt and learn.
Recent years have been demanding, with restrictions related to the COVID-19 pandemic requiring major changes to the normal workday for our employees. Its position in the food supply chain means that Lerøy Seafood Group part of a critical sector in Norway. The Group was able to keep its value chain open throughout the pandemic, thanks to professional systems and the hard work of our employees and their willingness to embrace change.
Special situations require extraordinary measures and test an organisation’s capacities. The Board of Directors would like to take this opportunity to praise all the employees for their efforts, creativity, and adaptability in recent years.
The Group maintains a strong focus on procedures and compliance with them, insisting on measures to protect all employees. This is a perpetual process moving us forwards to our vision of zero injuries. In 2022, the total sick leave registered for the Group was 6.68 %, up from 5.85 % in 2021. Sick leave consists of 3.70 % long-term leave and 2.98 % short-term leave. The board is pleased to observe that the Group, together with employee representatives, will continue to work actively and systematically to reduce sick leave. The organisations in the individual subsidiaries are continuously being developed to ensure that they can deal with new challenges and changes in framework conditions. The working environment and cooperative atmosphere are good.
The Group issues reports in accordance with its statutory obligations in terms of operations and reporting. Please refer to the appendix on gender balance in this report and the comments provided in the Group’s sustainability library published at leroyseafood.com. In addition, please refer to the sustainability library for information on the Group’s routines in the areas of health, safety, and the environment.
All food production has a carbon footprint, and the process of developing the world’s most efficient value chain for seafood all the way to the consumer affords Lerøy close interaction with end customers. While this interaction has always been important, the Group finds it has become more important than ever, given the increased focus on sustainability in most areas.
In my mind, one of the best things about Lerøy is that it’s a company with plants and facilities spread all along the coast of Norway. We create local jobs in every little bay and village on Norway’s coast. I’m really proud of that!”
- Astrid Brattebø Fadnes, Production Manager in Stamsund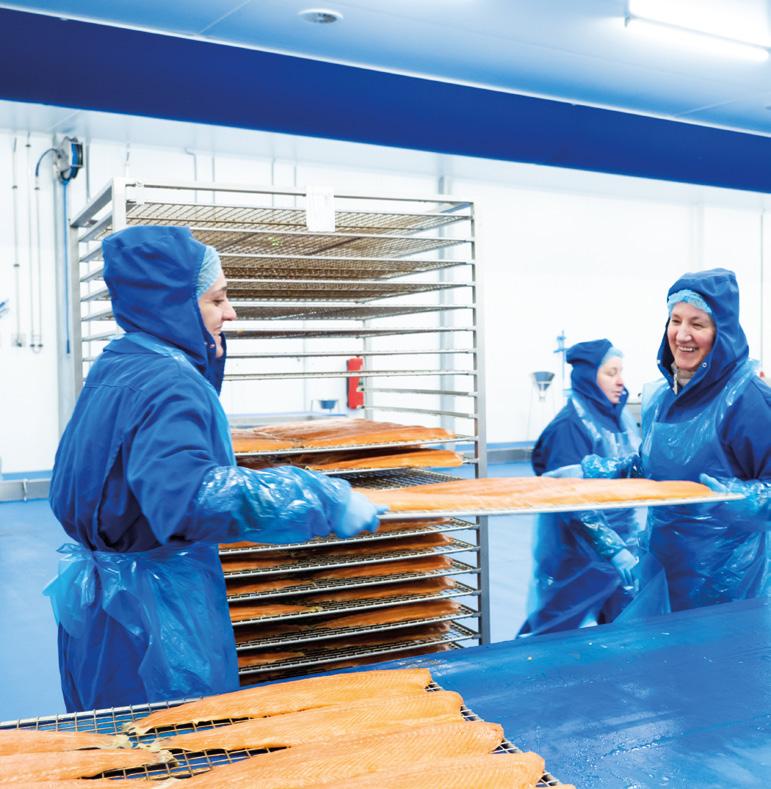
In recent years, a clear shift has developed in many markets. The general requirements for environmental and climate-related sustainability have become even more important to the consumer’s decision about which products to buy. Early on, the Group established a strong position for this development. Lerøy’s vertically integrated value chain affords a unique opportunity to highlight this kind of sustainability as a global competitive advantage. An increased consumer focus on sustainability represents a significant opportunity for Lerøy, the seafood industry, and Norway as a whole. Food production from Norwegian aquaculture is globally competitive in terms of the environment and climate and is therefore part of the ‘solution’ to finding ways to feed the growing worldwide population. In this context, businesses and political authorities both bear a huge responsibility to exploit such opportunities. Doing so calls for common sense and knowledge to prevail in the years to come and, not least, correct information to be communicated to consumers.
The Group’s operations are based on resources produced in freshwater and the sea. Significant climate change along the Norwegian coastline and in the North Atlantic could potentially affect the Group’s operations and earnings. The Group’s marine fish farms are located in areas where temperatures and currents could change. However, as long as the Gulf Stream remains the same, the Norwegian coast will probably remain highly suitable for seafood production in the coming decades. In relation to the Group’s whitefish catches, a change in sea temperature could change catch volumes.
CO2 taxation will have an impact on all types of food production in the years to come. Focusing on the environment and climate will be particularly important moving forwards. Lerøy will strive to cut greenhouse gas emissions by taking responsibility for its own emissions throughout the value chain and also by working together with suppliers. Lerøy has therefore established ambitious science-based climate targets. The Group aims to reduce its greenhouse gas emissions by 46% by 2030, as measured against the 2019 baseline. To be able to meet its goals, the Group will mainly focus on:
• Fish feed
• Alternative fuel sources
• Airfreight
The Group`s ambition is to become climate neutral by 2050. Lerøy has taken the necessary measures to meet the increased requirements for reporting greenhouse gas emissions in future and is also actively involved in helping our customers achieve their goals in this area. If the world is to succeed in its goal to reduce greenhouse gas emissions, we have to rely on one another and adopt a global mindset. For more climate-related information, please see our Task Force on Climate-Related Financial Disclosures (TCFD) report at leroyseafood.com.
With its production of Atlantic salmon and trout, the Group is a globally competitive food producer in terms of economics, the environment, and climate – something very rare. The board and management are of the opinion that operations in 2022 were sustainable and were conducted with a competitive footprint. This is supported not only by the Group’s comprehensive sustainability reporting, available in the Group’s sustainability library at leroyseafood.com, but also by national and international reports, such as the Coller FAIRR Protein Producer Index.
The Group operates from a perspective of perpetuality, invests in minimising its impact on the external environment, and works continuously to encourage both the management and employees to maintain sound attitudes towards the environment.
In December 2021, the EU adopted a new taxonomy regulation with the aim to classify sustainable activities. The regulations are based on selected sectors with associated economic activities. Lerøy Seafood Group meets the threshold values for the taxonomy and is thus obliged to report. The new regulation was incorporated into Norwegian legislation on 1 January 2023, so the first reports must be issued in 2023.
LSG has decided to establish a project group with a mandate to facilitate reporting in line with the taxonomy. The work of the project group shall help build knowledge and systems in the organization and understanding of the process.
The project has mapped the economic activities in the Group that are covered by the EU taxonomy.
These activities are:
• Energy
• Construction and real estate
• Transport
The Group’s core activities, aquaculture and fisheries, are not yet covered by the EU taxonomy, but technical screening criteria have been proposed for fisheries and are awaiting approval. The Group also expects to see the development of technical screening criteria for aquaculture in due course.
The EU taxonomy requires the Group to report on the proportion of CapEx, OpEx and turnover that is sustainable or not. A qualitative report will be drawn up that explains the assumptions on which the analysis is based, and otherwise meets the formal requirements in the delegated act on reporting requirements.
Our vision is to become the leading and most profitable global supplier of sustainable quality seafood. Eventually, the taxonomy can become an important management tool to achieve this goal.
On 20 February 2019, the EU competition authorities (”the EU Commission”) started an investigation into suspected anti-competitive practices in the salmon market. Lerøy Seafood Group ASA is one of the companies named in the case. It is unclear precisely what form the EU Commission believes any collusion may have taken, when it may have occurred and what negative consequences it may have had. Lerøy Seafood Group ASA is providing the authorities with every assistance in the case. Procedures in this type of case normally continue for several years, and it is as yet too early to say whether the case may lead to sanctions or other negative consequences for the companies involved. As regards the investigation opened by the US Department of Justice (DOJ) into the Norwegian salmon industry in November 2019, Lerøy Seafood Group ASA was informed in January 2023 that the investigation has been closed.
In the wake of the EU Commission’s ongoing investigations, several Norwegian-owned aquaculture companies, including companies in Lerøy Seafood Group, have been sued by customers in the USA and Canada. The Group believes these claims to be groundless, but due to factors such as significant litigation costs in the USA and commercial reasons, the Group chose to settle the two US class actions in 2022. The settlements in no way represent any admission of liability or wrongdoing. Reference is also made to stock exchange notice made on 25 May 2022 and the quarterly report for the second quarter of 2022.
Financial statements for the company and the Group are submitted on assumption of going concern. In 2022, Lerøy Seafood Group ASA reported an annual profit after tax of NOK 321 million, against NOK 1.425 million in 2021. The board will propose the following allocation of the 2022 annual profit (MNOK): A figure of NOK 2.50 per share to be allocated for dividend payment, totalling NOK 1,489 million. From other equity: NOK 1.168 million Total allocations: NOK 321 million
The Group’s parent company has a strong financial position, with a book equity ratio of 72.9%. The parent company has access to satisfactory financing and liquidity, conforming to the Group’s strategy and operating plans.
The Group found its collaboration with public bodies to be mostly positive throughout the difficult situation we experienced in 2020 and 2021. This led us to hope, and believe, that we could further develop our cooperation based on accountability and knowledge-based facts, focusing on employment and value creation in the decades ahead.
Unfortunately, this is not how things turned out. In their rent resource proposal of 28 September 2022, the Norwegian government and Ministry of Finance reveal a lack of insight into the industry’s value chain and value creation, and hence of the consequences the proposal will have. It is important that the government understand the industry’s value chain, including its level of activity and key role in Norway’s coastal communities.
The proposal betrays a lack of understanding of the industry’s complexity and its importance to the nation and coastal communities. This has been commented on in depth in the Group’s consultation response. Industrial developments and employment in capital-intensive activities exposed to global competition, such as fish farming, fisheries, and related industries, represent challenges and require predictability. In turn, predictability of this kind requires businesses and, not least, politicians at the national level to implement a reasonable longterm business policy. Regrettably, the resource rent proposal is an example of political risk of the kind we have not experienced in recent times in Norway. The proposal conflicts with
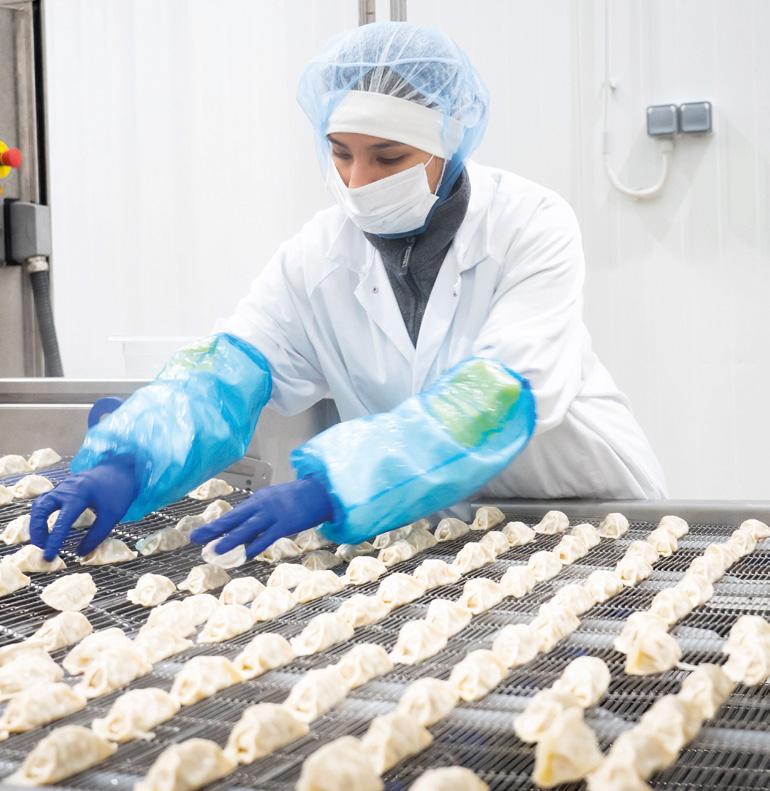
the government’s own declaration, which states ‘The government will execute a predictable and responsible tax policy for business and industry’. It is further worth noting that the proposal conflicts with the governing parties’ own party platform.
The seafood companies must retain capital in line with other comparable industries if they are not to lose ground in international competition. One distinctive feature of the aquaculture industry is the dominance of Norwegian private capital. This capital – the foundation of non-urban Norway – pays corporation tax and charges like other industries, but also already contributes billions in production fees, export duties, and tax on growth. Because the industry owes its existence to Norwegian private capital, the dividend tax and wealth tax mean that the industry’s capital is the most heavily taxed of all capital.
The Storting, the Norwegian parliament, is expected to reach a decision before the summer, and this resolution will be of crucial importance to how the industry develops in Norway and to the country’s ability to maintain our unique position as a globally competitive food producer, from both a financial and an environmental/climate perspective.
The cod quota is down 15% and the haddock quota up 8% compared to 2022. For saithe caught north of 62 degrees, the quota has been increased by 11%, while the quota for saithe in the North Sea is up 19%. The quotas for other species such as redfish and Greenland halibut are unchanged from 2022. A reduction of around 20% in cod quotas is expected for the trawler fleet, compared to 2022. For haddock, the reduction is around 5%. An increase of 15% on 2022 levels is
expected for saithe north of 62 degrees, and the quotas for saithe in the North Sea are up 15%. The quotas for other species, such as redfish and Greenland halibut, are roughly the same as in 2022.
The Group is not satisfied with the growth in the Farming segment in the second half of 2022, and we have implemented a raft of measures throughout the segment’s value chain. These measures are expected gradually to generate positive effects. At the same time, cost inflation for input factors will continue to manifest itself in 2023, and release from stock costs for the year are expected to be higher than in 2022. For its consolidated operations, Lerøy Seafood Group (LSG) currently expects to harvest around 175,000 thousand tonnes in 2023. The Group’s share from the joint venture is forecast to be approximately 18,500 thousand tonnes. LSG’s total harvest volume in 2023 is expected to be in the vicinity of 198,500 tonnes.
Lerøy works to develop an efficient and sustainable value chain for seafood. This not only provides cost-efficient solutions but also quality, availability, a high level of service, traceability, and competitive climate-related and environmental solutions. Investments – leading to good, full-year jobs – in downstream entities in recent years, including in a new industrial facility for Lerøy Midt, a new factory in Stamsund, and new factories in Spain, the Netherlands, and Italy, are expected to make a positive contribution going forwards. The political risk for Lerøy’s value chain has increased, but the Group has a clear ambition for earnings in this segment to grow in the years ahead. Earnings in this part of the value chain were weak in 2022, as impacted by a number of factors previously described.
At the start of 2023, we are seeing that general economic developments are negatively affecting the demand for seafood in some market segments. Historically, the demand for seafood products has held up relatively well during economic downturns. The Group’s products are healthy and tasty. Our production is sustainable from financial, climate, and environmental perspectives, and the Group expects significantly higher earnings in its downstream operations in 2023 than in 2022.
Lerøy’s Board of Directors and employees hope to see accountability in framework conditions, so that the industry can continue to develop.
The Board of Directors and Group management would like to thank all the Group’s employees for their valuable work in 2022.
Arne Møgster Chair of the Board
Britt Kathrine Drivenes Board member
Didrik Munch Board member
Karoline Møgster Board member
Hans Petter Vestre Board member
Siri Lill Mannes Board member
Bergen, 28 April 2023
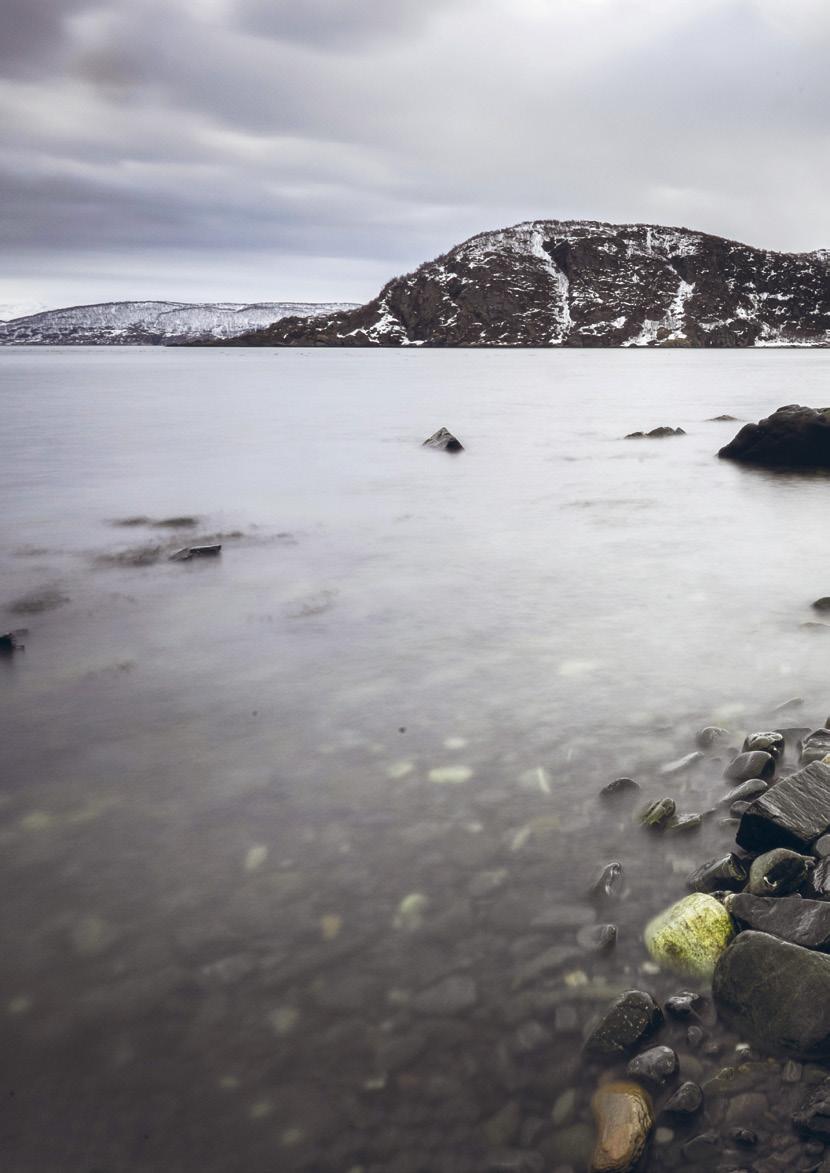
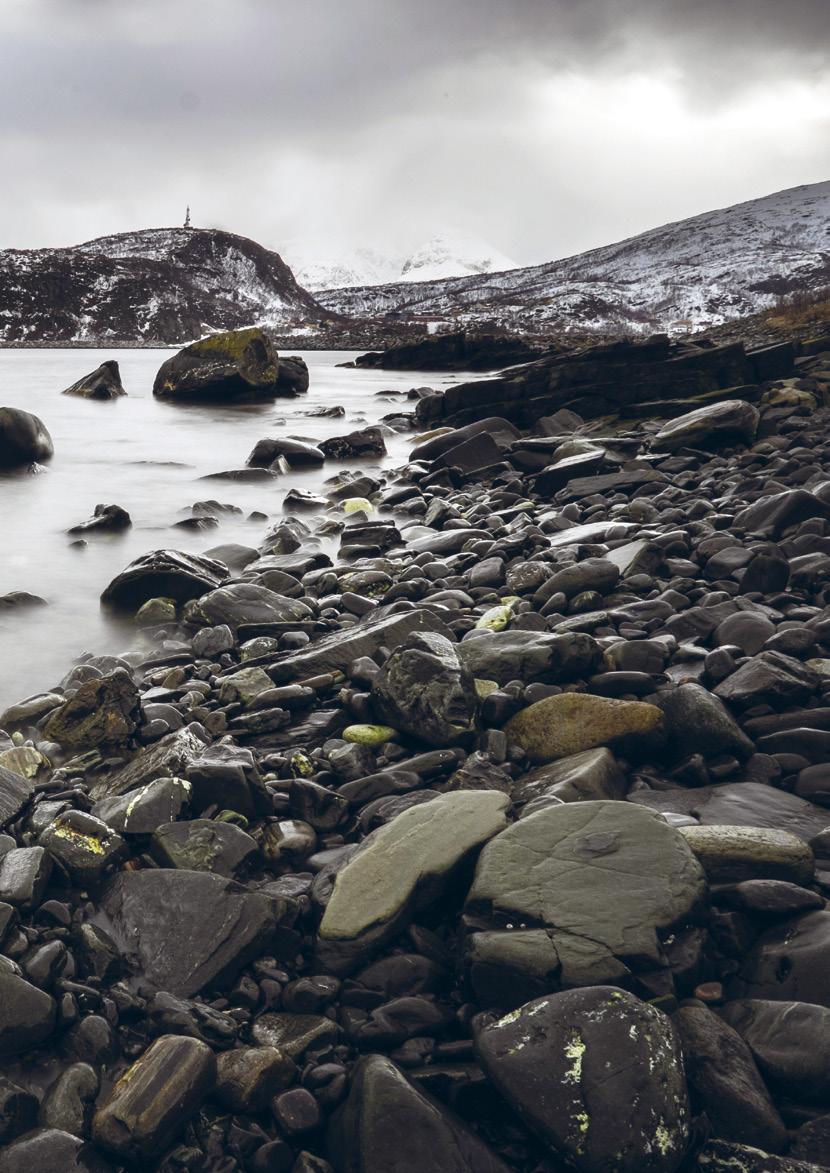
Consolidated financial statements consist of Key figures
Income statement Statement of comprehensive income Statement of financial positions Statement of cash flows
Statement of changes in equity Notes to the consolidated financial statements Overview of notes to the consolidated financial statements
Accounting policies
Alternative performance measures
Significant accounting estimates and assessments
Consolidated companies and allocation to operating segment
Operating revenue and segment information
Business combinations and transactions with non-controlling interests
Intangible assets
Leases
Fixed assets
Shares in joint ventures, associates and other investments
Biological assets
Other inventories
Receivables
Financial instruments
Loans, mortgages and guarantees
Pensions
Taxation
Other short-term debt
Earnings per share
Dividend per share
Share capital and shareholder information
Payroll costs, number of employees, remuneration, loans to staff, etc.
Items that are combined in the financial statements
Currency translation differences
Related parties Events after balance sheet date Investigation by the competition authorities
Climate risk
All figures in NOK 1 000
All figures in NOK 1 000 (period 1.1 - 31.12)
All figures in NOK 1 000 (period 1.1 - 31.12)
The items included in comprehensive income are after tax
Notes 1-28 are an integral part of the consolidated financial statements
All figures in NOK 1 000
Notes 1-28 are an integral part of the consolidated financial statements
Notes 1-28 are an integral part of the consolidated financial statements

Bergen, 28 April 2023
Board of Directors of Lerøy Seafood Group ASA
All figures in NOK 1 000
* Non-controlling interests. Other components of equity are allocated to Lerøy Seafood Group`s shareholders.
Lerøy Seafood Group ASA owns 297,760 treasury shares of a total number of 595,773,680 shares. The ratio of treasury shares is 0.05%. The purchase price paid for treasury shares is split into two different categories, where the nominal value of treasury shares is included in paid-in capital (NOK -30 thousand), and the purchase price exceeding nominal value of treasury shares (NOK -2,389 thousand) is included in retained earnings. The average purchase price for treasury shares is NOK 8.12 per share.
All figures in NOK 1 000 (period 1.1 - 31.12)
This section presents consolidated accounting policies and notes for Lerøy Seafood Group ASA. Accounting policies and notes for Lerøy Seafood Group ASA (parent company) are presented separately after the notes to the consolidated financial statements. This separation is necessary in that the Group submits financial statements in accordance with IFRS (International Financial Reporting Standards), while the parent company’s financial statements are drawn up in accordance with NGAAP (Norwegian Generally Accepted Accounting Principles).
Lerøy Seafood Group ASA is registered in Norway and is listed on the Oslo Stock Exchange. The company’s consolidated financial statements for the financial year 2022 include the company and its subsidiaries (collectively referred to as “the Group”) and the Group’s share in associates.
Lerøy Seafood Group ASA is a subsidiary of Austevoll Seafood ASA (52.69%), which in turn is owned (55.55%) by Laco AS. Laco AS is the ultimate parent company.
The financial statements were submitted by the Board of Directors on 28 April 2023.
(A) Declaration confirming that the financial statements have been drawn up in accordance with IFRS
The consolidated financial statements are submitted in accordance with international standards for financial reporting (IFRS) and interpretations established by the International Accounting Standards Board (IASB) and adopted by the EU.
The financial statements are presented in NOK and figures are rounded off to the nearest thousand. They are prepared on the basis of the historical cost principle, with the exception of the following assets and liabilities which are carried in the balance sheet at fair value: Biological assets and financial derivatives.
Preparation of financial statements in accordance with IFRS demands that the administration makes assessments, estimates and assumptions that influence the application of accounting policies and the book values of assets and liabilities, revenue and costs. Estimates and their associated assumptions are based on historical experience and other factors seen as reasonable under the circumstances. These calculations form the basis for measurement of carrying amounts for assets and liabilities that are not readily available from other sources. The actual result may deviate from these estimates.
Estimates and underlying assumptions are under constant review. Changes in the accountingrelated estimates are recognised in the periods in which they occur, provided they apply only to that period. If changes also apply to future periods, the effect is distributed over current and future periods.
Assessments that are made by the administration when applying the IFRS standards and that have a significant effect on the financial statements and estimates with a considerable risk of significant adjustments in the next financial year, are described in note about significant accounting estimates and assessments.
The accounting policies discussed below have been consistently applied for all periods presented in the consolidated financial statements.
The consolidated financial statements are drawn up in accordance with IFRS, while the financial statements for the Norwegian subsidiaries are prepared according to Norwegian Generally Accepted Accounting Principles (NGAAP). Accounts for the foreign subsidiaries are prepared according to accepted accounting policies in the respective countries.
The consolidated financial statements are prepared under the assumption that Lerøy Seafood Group will continue as a going concern.
Subsidiaries are all units where the Group has control of the unit’s financial and operational strategy, normally through ownership of more than half of all equity with voting rights. Subsidiaries are consolidated from the moment control is obtained and are excluded from consolidation when such control ceases. Transactions, intercompany accounts and unrealised gains or losses between the Group companies are eliminated.
For each business combination after 2009, the group has measured components of non controlling interests in the acquiree at fair value at the acquisition date. This implies that goodwill is recognised also on noncontrolling interests proportionate share of the entity`s net assets.
The companies that are part of the Group are specified in the note on consolidated companies.
Non-controlling interests are measured at acquisition date either to fair value or their proportionate share of net identified assets, with an option to choose for each acquisition. Non-controlling interests’ share of the profit or loss for the year after taxes is shown as a separate item after the annual profit/loss for the Group. The non-controlling interests’ share of equity is shown as a separate item under consolidated equity. Transactions with non-controlling interests in subsidiaries are booked as equity transactions. In the event of the purchase or sale of shares from non-controlling interests, the difference between the consideration and the shares’ proportional share of the carrying amount for the net assets in the subsidiary against the parent company owners’ equity is booked to controlling shareholder’s equity.
Operating revenue is recognised at a point in time when control is passed to the customer. Control is generally passed when delivered to the
customer according to the agreed upon Incoterms (contractual terms).
Expected volume discounts are deducted from operating revenue and presented as current provisions. Taxes and duties are also deducted from operating revenue.
The Group records provisions (sales reduction) for quality deviations and returns based on historical numbers and specific information regarding the respective deliveries. The Group delivers, to a large degree, fresh food and returns will therefore usually be registered shortly after the customer has received the goods.
Segments are reported at a more aggregated level than for internal reporting to the corporate management due to similar economic characteristics, organisational structure and commercial risk. The Group’s reportable segments comprise the following: (1) Wild catch, (2) Farming and (3) Value-added Processing (VAP), sales and distribution. The last segment is also named VAPS&D or VAPSD for short. Please refer to the note on the consolidated companies and division into operating segments for a complete description of the companies in the different segments, both directly and via indirect ownership.
Wild catch is reported as one segment. The unit comprises the two sub-groups Lerøy Havfisk AS and Lerøy Norway
Seafoods AS. The Lerøy Havfisk Group, owner of the licenses, is subject to a so-called "industrial obligation" in Stamsund, Melbu, Hammerfest, Båtsfjord, Honningsvåg and Kjøllefjord. This implies that the license is linked to operation of the facilities in the respective locations. Lerøy Havfisk has leased out the facilities in these locations to Lerøy Norway Seafoods AS. The lessor is responsible for sustaining operations. However, if the lessor terminates operations, the license terms oblige Lerøy Havfisk to sustain operations in the specified locations. The two companies, including their
subsidiaries, are so heavily integrated with each other, that they are regarded as one operating segment, which also is reflected in the internal reporting.
Farming is reported as one segment but specified on three operating segments. These are:
(1) the North Norway region, comprising the Lerøy Aurora AS and Lerøy Aurora 2 AS
(2) the Central Norway region, comprising Lerøy Midt AS and Lerøy Midt 2 AS
(3) the West Norway region (also known as Lerøy Sjøtroll), comprising Lerøy Vest AS, Lerøy Vest 2 AS, Lerøy Vest Kraft AS, Sjøtroll Havbruk AS, Sjøtroll Havbruk 2 AS, Lerøy Kjærelva AS, Lerøy Årskog AS, Norsk Oppdrettsservice AS and Lerøy Ocean Harvest AS.
These units all operate in the same branch, have the same customers, similar commercial risk and similar processes. Their only distinguishing factor is geography. It has therefore been deemed appropriate to merge these into one operating segment.
Value-added Processing (VAP), sales and distribution is the third segment. This segment comprises several subgroups and individual entities. These are merged into one reporting segment due to similarities such as same branch, commercial risk and uniform processes.
The Norwegian units are: Lerøy Seafood AS, Lerøy Fossen AS, Lerøy Bulandet AS, Lerøy Sjømatgruppen AS, Lerøy Norge AS, Sirevåg AS, Lerøy Nord AS, Dragøy Grossist AS, Sjømathuset AS, Lerøy Quality Group AS, Lerøy & Strudshavn AS and Wannebo International AS.
The foreign units consist of the Dutch sub-group Lerøy Seafood Holding B.V., that also includes Lerøy Germany GmbH, the Swedish sub-group Lerøy Sverige AB, the Danish sub-group Lerøy Seafood Denmark A/S, the French sub-group SAS Lerøy Seafood France, the Spanish sub-group Lerøy
Processing Spain S.L, in addition to Lerøy Seafood USA Inc, Lerøy Portugal Lda, Lerøy Finland OY, Lerøy Turkey, Leroy Seafood Italy Srl and Lerøy Seafood UK Ltd.
The Norwegian entities Lerøy Seafood Group ASA and Preline Fishfarming System AS are not assigned to any of the segments.
The consolidated financial statements are presented in NOK, the functional currency for the parent company and the Norwegian subsidiaries. Cash items in foreign currency are valued at the respective rates of exchange at the end of the financial year. Gains and losses on foreign currency related to the purchase and sale of goods are presented as part of the accounting line for "Purchases". See also item (V) on derivatives, including currency forward contracts utilised to control currency risk.
Goodwill
Goodwill represents the residual value that cannot be assigned to other assets or liabilities on acquisition of a company or other assets. Deferred tax at date of acquisition on licenses with unlimited lifetime, increases goodwill. Goodwill in respect of the acquisition of subsidiaries is included in intangible assets, while goodwill in connection with the acquisition of associates is included in the item “Shares in associates”. From each business combination goodwill is allocated to a cash generating unit (CGU). Goodwill is not amortised (after 1 January 2004), but is reviewed annually for any impairment and carried on the balance sheet at cost price less accumulated write-downs. When assessing the need to write down the value of goodwill, this is allocated to applicable cashgenerating units.
The Group’s licenses can be split into two main groups: (1) Licences related to farming and (2) licenses related to wild catches (fishing rights). In
All figures in NOK 1 000
addition, the Group has some intellectual property rights.
Licences related to farming are not amortised. Licences are carried at cost price less any accumulated write-downs. Licences are tested annually for impairment. An overview of the different licenses involved in this operating segment, in terms of type, number and volume, is provided in the note on intangible assets. A more detailed explanation supporting the assessment that the assets have an indefinite useful life is provided in item (X) at the end of the description of accounting policies.
Fishing rights (the licenses) are valued at acquisition cost minus any accumulated amortisation and impairment loss. The licenses comprise basic quotas with no time limit and structural quotas with a time limit of 20 and 25 years respectively. The structural quotas have a definite useful life and are amortised over the length of the structural period. The basic quotas have an indefinite useful life and are not amortised, but they are tested annually for impairment. The structural quotas are amortised over the remaining life of the quota until the value is zero, as there is no active market for the rights or any commitment from a third party to acquire the right once its useful life is over. Pursuant to White Paper no. 21 (2006-2007) (Structural policy for the fishing fleet), the structural quotas with pre-specified time limits after expiry of the allocation period will be redistributed among the "cod trawler" group of vessels, thereby becoming part of the vessels’ basic quota. This implies that if a vessel has structures that are in accordance with the average for the group of vessels, a vessel will be able to maintain practically the same catch volume once the period for the structural quotas has expired. More detailed information on licenses/fishing rights is provided in note on intangible assets.
The major share of other intangible assets comprises water rights within farming (smolt production). The Group
distinguishes between time-limited water rights, which are amortised over their lifetime, and water rights with no time limit, which are not amortised but are tested annually for impairment. Other intangible assets comprise rights that are amortised over their lifetime (contractual period).
(H) Fixed assets and right-of-use assets
Fixed assets
Fixed assets are measured at acquisition costs less accumulated depreciation and any accumulated impairment loss. The depreciation on fixed assets is allocated linearly over estimated useful life (depreciation period). Significant parts of fixed assets that have different depreciation periods are decomposed and depreciated separately. The estimated average useful life of fixed assets, when decomposed, is estimated as:
• Land: Lasting value
• Buildings and real estate: 20-25 years
• Machinery and production equipment: 5-15 years
• Vessels: 25 years
• Fixtures and other equipment etc. 2.5-5 years
Right-of-use assets
Leases are measured as the present value of the remaining lease payments, discounted using the Group’s incremental borrowing rate, and recognised from the date the leasing agreement starts. Options for extension periods are included in the leasing calculation when they are reasonably certain to be exercised. At time of initial recognition, the associated right-of use asset is measured at an amount equal to the lease liability, adjusted by the amount of any prepaid or accrued lease payments. The right-of-use asset is depreciated linearly from the commencement date to the earlier of the end of the useful life of the right-ofuse asset or the end of the lease term.
For contracts containing both lease and non-lease components, the Group
allocates the consideration in the contract to the lease and the nonlease components based on their relative stand-alone prices. This mainly applies to the Group’s time charter rental agreements of wellboats, where the service element of the contracts is a significant non-lease component. The non-lease component is excluded from the lease accounting and expensed directly in the income statement.
The Group has applied the lease recognition exemptions for short term lease contracts and low-value assets. Short terms leases represent lease agreements shorter than 12 months from the date of the contract. Low value assets represent lease agreements that are lower than fifty thousand Norwegian krones. Rent paid on non-recognised leases are presented in the note on leases.
The Group distinguishes between leases with credit institutions and leases with others. The distinction is shown in note on leases. Acquisition of right-of-use assets from leases with credit institutions is considered to be investments in new assets, while acquisition of right-of-use assets from others than credit institutions is not. This distinction is also applied on the debt side, and in the definition of NIBD. See note on APMs for further information.
The Group’s biological assets comprise live fish, mainly salmon and trout, at all stages of the life cycle. The fish are divided into two main groups, depending on the stage of the life cycle. At the earliest stage of the life cycle, the fish are classified in group (1) roe, fry and juvenile fish. During this stage, the fish are kept on shore. When the fish are large enough for release to sea, they are classified in group (2) fish in sea. The group for fish in sea also comprises the subgroup for parent fish, utilized to produce roe. As this subgroup is immaterial, it is dealt with in the same way as other fish in sea.
The stock of fish, in addition to salmon and trout, also comprises cleaner fish. This species of fish is utilized during production of salmon and trout as a means of eliminating salmon lice. Despite the significant number of cleaner fish produced by the Group, both the volume and value of this species are relatively low and are immaterial for the consolidated financial statements. To simplify accounting, this species is therefore grouped with roe, fry and juvenile fish.
Biological assets are regulated by IAS 41 Agriculture. The main rule is that biological assets shall be measured at fair value minus sales costs unless fair value cannot be reliably measured. Measurement of fair value is regulated by IFRS 13. ‘Fair value’ refers to the price that would have been achieved on sale of the asset in an orderly transaction between market participants at the measurement date under the prevailing market conditions.
For roe, fry and juvenile fish, in addition to cleaner fish, historical cost is deemed a reasonable approach to fair value, as there is little biological transformation (IAS 41.24). This assessment must be seen in light of the fact that smolt are currently released to sea at a stage when their weight is still relatively low. At the same time, this group still comprises a limited share of the Group’s biological assets measured in terms of both volume and value. If changes emerge in the future implying that the smolt produced are significantly larger when released to sea, a new assessment will be required.
For fish in sea , the fair value is calculated by applying a cash flow based present value model at level three in the fair value hierarchy in IFRS 13. In line with IFRS 13, the highest and best use of the biological assets is applied for the valuation. In accordance with the principle for highest and best use, the Group considers that the fish have optimal weight for harvest when they have a live weight corresponding to 4 kg gutted weight. For information on
recalculation factor from gutted weight to live weight, see note on biological assets. As of 31.12 this corresponds to a live weight of 4.65 kg for salmon and 4.76 kg for trout. Fish with a live weight equal to this or more, are classified as ready for slaughter (mature fish), while fish that have still not achieved this weight are classified as not ready for harvest (immature fish). For fish ready for harvest, the highest and best use is defined as harvesting and selling the fish as quickly as possible in the month following the balance sheet date. For fish not yet ready for harvest, the highest and best use is in principle defined as growing the fish to optimal weight for harvest, then harvesting and selling the fish. The harvest date applied in the valuation may however be brought forward if required by situations at a specific locality. Such situations may involve biological challenges (disease, salmon lice infestation etc.).
The cash flow-based present value model does not rely on historical and company-specific factors. On a hypothetical market with perfect competition, a hypothetical buyer of live fish would be willing to pay as a maximum the present value of the estimated future profit from the sale of the fish when it is ready for harvest. The estimated future profit, taking into account all price adjustments and payable fees for completion, constitutes the cash flow.
Incoming cash flow is calculated as a function of estimated volume multiplied by estimated price. For fish not ready for harvest, a deduction is made to cover estimated residual costs to grow the fish to the optimal weight for harvest. The cash flow is discounted monthly by a discount rate. The discount rate comprises three main components: (1) the risk of incidents that have an effect on cash flow, (2) hypothetical license lease and (3) the time value of money. Please refer to the note on significant accounting estimates and assessments for more detailed information on discounts, and sensitivity analysis.
Estimated biomass (volume) is based on the actual number of individuals in the sea on the balance sheet date, adjusted to cover projected mortality up to harvest date and multiplied by the estimated weight per individual at the time of harvest. The measurement unit is the individual fish. However, for practical reasons, these estimates are carried out per locality. The live weight of fish in the sea is translated to gutted weight in order to arrive at the same measurement unit as for pricing.
Pricing is based on the Fish Pool forward prices. The reason for this is that the observable forward prices at Fish Pool are recognised as the best approach to a hypothetical price of salmon. The volume of trout sales in Norway is significantly lower, and there are no corresponding observable market prices. Historically, however, trout prices have been closely correlated to salmon prices. The forward prices for salmon are therefore applied as a starting point for estimates of the fair value of trout. The forward price for the month in which the fish is expected to be harvested is applied in order to estimate cash flow. The price stipulated by Fish Pool is adjusted to take into account export costs and clearing costs, and represents the reference price. This price is then adjusted to account for estimated harvest cost (well boat, slaughter and boxing) and transport to Oslo. Adjustments are also made for any estimated differences in size and quality. The adjustments to the reference price are made per locality. Joint regional parameters are applied, unless factors specific to an individual locality require otherwise.
Changes to estimated fair value for biological assets, according to IAS 41, are recorded through profit or loss and presented on the line for fair value adjustments related to biological assets. The accounting line for fair value adjustments related to biological assets in the income statement comprises three elements; (1) change in fair value adjustment of stock of fish in sea, (2) change in fair value of
onerous contracts and (3) change in fair value of unrealised gain/loss related to financial purchase and sale contracts for fish in Fish Pool, recognised as value-hedges.
Onerous contracts are contracts where the expenses of fulfilling the contracts are higher than the economic yield the company expects to gain by fulfilling the contracts. The Group enters into contracts related to future deliveries of salmon and trout. As biological assets are recognised at fair value, this fair value will be included in the estimated expenses required to fulfil the contract. As a result, physical delivery contracts where the contractual price is lower than the price on which fair value estimation of the biological assets was based will be defined as onerous contracts according to IAS 37, even if the contractual price is higher than the production costs for the products. The provision is classified as other short-term debt.
As the financial statements also present production costs for the stock of live fish, the reporting of mortality is of significance. Costs related to abnormal mortality are immediately recognised through profit or loss and presented on the line for changes in inventory, while normal waste is classified as part of production costs. Fair value of biological assets is not affected by the principle for reporting mortality costs. The extent to which mortality is normal or abnormal requires assessment. The Group makes use of a common indicator and threshold for all farming units. If in one month mortality at a locality exceeds 1.5% of the incoming number of fish at the locality, this is classified as an indication of abnormal mortality.
A more detailed assessment is then carried out to establish whether mortality is abnormal. These assessments take into account the cause of mortality and the size of the fish. Please refer to the note on biological assets for a more detailed description of mortality costs and incidents that have caused abnormal mortality.
(J) Inventory
Inventories of purchased goods are valued at the lower of acquisition cost and estimated sales value less sales costs. In-house-produced finished goods and semi-finished goods are valued at full production cost. Writedowns are made for quantifiable obsolescence.
(K) Trade receivables and trade payables
Trade receivables and other receivables are carried on the balance sheet at nominal amount after deduction of provision for estimated losses. The Group measures expected credit losses by estimating a lifetime expected loss allowance for all trade receivables. Loans and receivables are classified as short-term debt or current assets unless they mature more than 12 months after the balance sheet date. In that case, they are classified as fixed assets or long-term debt.
(L) Associates and joint ventures Associates are units where the Group has significant influence but not control, normally between 20% and 50% of voting equity. Joint ventures are investments in companies where the Group has control together with other parties. Cooperation is based on a contractual agreement governing central cooperative factors. Investments in associates and joint ventures are recognised according to the equity method. The investment is capitalised at acquisition cost at the time of purchase. The Group’s share of the profit/loss after tax, as well as depreciation/amortisation and write-downs of any added value, are recognised on the income statement and added to the carrying amount of the investment together with the respective share of changes in equity not booked in the income statement, such as dividend. In the income statement, the Group’s respective share of profit is shown as a separate financial item, while the assets are shown in the balance sheet as an individual non-current asset. The Group’s share of unrealised intercompany profit on transactions between the Group and the respective
company is eliminated. Accounting policies for associates and joint ventures are changed whenever necessary to ensure consistency with the accounting policies applied for the Group (IFRS).
Liquid assets consist of cash in hand and bank deposits and are valued at the exchange rates on the balance sheet date. In the Cash Flow Statement it is specified how much that is restricted funds.
The Group mainly has defined contribution plans, but also a few remaining defined benefit plans that are now closed. In general, the pension plans are financed via payments to insurance companies or pension funds based on periodical actuarial calculations.
A defined contribution plan is a pension plan where the Group pays a fixed amount to a separate legal entity. The Group has no statutory or other obligation to pay additional contributions.
A defined benefit pension plan is one that is not contributory. A typical defined benefit pension plan defines a pension payment that the employee will receive upon retirement. The payment is typically dependent on factors such as age, number of years in the company and wage level.
The capitalised commitment associated with defined benefit plans is the present value of the defined benefits on the balance sheet date less fair value of the pension. Pension liability is calculated annually by an independent actuary according to the straight-line accrual method. The present value of defined benefits is found by discounting estimated future payments by the interest rate on a bond issued by a company with a high credit rating in the same currency as the benefits will be paid, and with a maturity approximately equal to the duration of the associated pension liability. In countries that do not have
a liquid market for long-term bonds issued by companies with a high credit rating, the market interest rate for governmental bonds is applied.
Tax cost in the income statement includes both the tax payable for the period and changes in deferred tax. Deferred tax is calculated at a rate of 22% (or local rates in other countries) on the basis of the temporary differences that exist between accounting and taxable values, as well as the tax loss carryforward at the end of the financial year. Temporary tax-increasing and tax-decreasing differences which reverse or may reverse the figures in the same period and within the same tax regime are offset and booked at net value.
Deferred tax has been calculated on the difference between taxable and accounting values of licenses. Deferred tax is calculated at the nominal tax rate.
Loans are booked at fair value when the loan is paid out, less transaction costs. In subsequent periods loans are booked at amortised cost calculated by applying the effective interest rate, and any differences between acquisition cost and redemption value are incorporated over the loan period by using the effective interest rate method.
Next year’s instalments are classified as short-term debt.
Dividends are booked when adopted by the shareholders’ meeting. See also note on dividend per share.
Provisions are carried on the balance sheet when the Group has an existing legal obligation or implied duty in consequence of an earlier event, and it is probable that a flow of economic resources from the enterprise will be required in order to fulfil such obligation. If the effect is significant, the provision is determined by discounting estimated future cash
flows by a discounting rate before tax, which reflects market pricing of the time value of money and the risks specifically associated with the obligation.
(S) Share capital and share premium
Ordinary shares are classified as equity. Expenses directly associated with issuing new shares or options, less tax, are booked under equity as reductions in proceeds received.
When buying back treasury shares, the purchase amount, inclusive of directly ascribable costs, is entered as a change in equity. Treasury shares are presented as a reduction in equity.
The consolidated statement of cash flows shows the total consolidated cash flows broken down by operating, investing and financing activities. Acquisitions of subsidiaries are considered an investing activity. Cash and cash equivalents in the company acquired is deducted. The statement shows how the various activities affect cash reserves. For cash flows in foreign currency, the average rate of exchange is used in the statement. To the extent that changes in the balance sheet figures between financial years do not match the corresponding figures in the statement of cash flow, this is a result of translation differences linked to changes in rates of exchange.
Through its activities, the Group is exposed to different types of financial risk: market risk (including currency risk, interest risk, price risk and liquidity risk) as well as credit risk. A further description follows below, describing the Group’s financial risk, as well as how it is managed, including use of hedges.
The Group has international operations requiring several different currencies and is thus exposed to currency risk. Forward contracts are used to hedge against the currency risk on trade receivables and agreed upon sales contracts. The forwards
contracts are designated as fair value hedges in the financial statements. The hedged items are primarily binding sales contracts in foreign currency, net foreign currency bank deposits, and net trade receivables in foreign currency. The hedged items are adjusted with the change in fair value of the hedged risk. The hedging instruments are the forward contracts, which are also measured at fair value on the balance sheet date. Gains and losses due to change in fair value are presented through profit or loss. An overview of the effect of forward contracts can be found in the note on financial instruments.
The Group’s long-term debt is mainly based upon agreements for floating rates of interest, representing exposure to increases in the market interest rate. However, the Group has made use of long-term interest rate swaps to reduce the floating interest rate risk for a share of the Group’s long-term debt. The Group receives a floating interest rate and pays a fixed rate through the swap agreements. The interest rate swaps are reported as cash flow hedges. Gains and losses from the effective part of the hedge (the part of the hedge that qualifies for cash flow hedge accounting) are recognised in other comprehensive income. The Group does also use fixed interest loans (bond loan with fixed interests). An overview of the effects in terms of exposure of the Group`s borrowings to interest rate changes is provided in the note on loans, mortgages and guarantees.
The developments in global salmon and trout prices have a considerable impact on the results achieved by the Group. In order to reduce the price risk, a varying share of the revenue / purchase cost is hedged through purchase and sale forward contracts for salmon (Fish Pool contracts). The changes in fair value of the contracts are recognized in the income statement line item "fair value adjustments related to biological assets". An overview of the effect of the Fish Pool
contracts is provided in the note on financial instruments.
The Group is also exposed to fluctuations in the bunker price. This risk is reduced through entering into forward agreements to purchase bunker (bunker derivatives). Gains and losses from the effective part of the hedge (the part of the hedge that qualifies for cash flow hedge accounting) are recognised in other comprehensive income. An overview of the effect of bunker derivatives is provided in the note on financial instruments.
Cash flow prognoses are established for the different operating segments in the Group and are aggregated by the Group’s Financial Department. The Financial Department monitors prognoses of the Group’s liquidity requirements in order to ensure that the Group has sufficient cash equivalents to fulfil operating commitments while sustaining a sufficient level of flexibility in the form of unutilised, binding loan facilities at all times so that the Group is not in breach of the limits or specified terms and conditions for the Group’s loans. Such prognoses take into account the Group’s scheduled new loans, compliance with terms and conditions of loans, compliance with in-house objectives for balance sheet figures and, if relevant, external regulatory or legal requirements.
Any excess cash in the Group companies, in addition to what constitutes necessary working capital, is transferred annually to the parent company via Group contributions and dividends. The Group’s Financial Department deposits excess cash mainly as bank deposits at special terms with appropriate maturities in order to provide sufficient security and flexibility in relation to the company’s growth strategy and dividend policy. For information on cash and cash equivalents together with undrawn credit facilities available to the Group as liquidity buffers to manage liquidity risk, please refer to the statement of
cash flow.
The table in note on debt, mortgages and guarantee liability specifies the Group’s financial covenants that are not derivatives, and derivative covenants with net settlement, classified in relation to the downpayment schedule. This classification is made in accordance with the contractual maturity date. Derivative covenants are included in the analysis when the contractual maturity date is significant for an understanding of the accrual of cash flows. The figures in the table are non-discounted contractual cash flows.
Credit risk
Credit risk occurs in transactions involving derivatives, deposits with banks and financial institutions in addition to transactions with wholesalers and customers, including outstanding receivables and fixed agreements. As virtually all the Group’s sales to end customers are credit sales, procedures have been established to ensure that the Group companies only sell products to customers with satisfactory credit rating. A credit assessment is performed based on the customer’s financial position, history and any other factors of relevance. Individual limits are set for risk exposure, based on internal and external assessments of creditworthiness and guidelines from the Board of Directors. The Group’s compliance on these procedures is regularly monitored. Furthermore, almost all of the Group’s trade receivables are covered by credit insurance securing about 90% of nominal amounts. The counterparties to derivative contracts and financial placements may only be financial institutions with a high credit rating and other parties who can provide reliable security. See note on receivables for further information on credit risk.
The company seeks to hedge against currency fluctuations and changes in interest rate by means of derivatives, respectively currency forward
contracts, interest rate swaps and bunker derivatives.
Derivatives are carried at fair value at the time of contract and are subsequently adjusted to fair value. The recognition of the associated losses and gains depends on whether the derivative is designated as a hedging instrument and, if so, the type of hedging. Derivatives which are not designated as hedging instruments are recognised at fair value through profit or loss.
Fair value of derivatives is shown in the note on financial instruments. Fair values of derivatives are classified as fixed assets or long-term debt if the hedging object matures in more than 12 months, and as current assets or short-term debt if the hedging object matures in less than 12 months.
The Group documents the relationship between the hedging instrument and the hedged items, including expected hedging efficiency, when entering into hedging derivatives. The Group further documents its risk management strategies related to transactions that are risk hedges.
Changes in fair value of derivatives qualifying for fair value hedging are recognised in the income statement together with the change in fair value of the associated hedged asset or liability. The Group uses fair value hedging to hedge net receivables in foreign currency, net deposits on currency accounts and signed sales contracts in foreign currency. Gains and losses on foreign currency are included in the income statement line "Cost of materials".
The effective share of the change in fair value of derivatives that qualify as hedging instruments for cash flow hedging is recognised through other comprehensive income. Hedging gains or losses recognised through other comprehensive income and accumulated in equity are re-classified to the income statement during the period in which the hedging object impacts the income statement. The
Group makes use of cash flow hedging related to interest rate swaps and bunker derivates. If the hedge comes to an end, and the expected future transaction is no longer likely, gains and losses are recognised in the income statement under net financial items.
The Group’s objectives for capital management are to enable the Group to continue as a going concern in order to guarantee returns for the owners and other stakeholders and to sustain an optimal capital structure to allow the Group to reduce capital expenses. Ongoing structural changes in the global industry in which the company operates, seen in conjunction with the cyclical nature of the industry, demand that the company at all times must maintain a satisfactory financial contingency. This in turn requires a close relationship with the company’s shareholders and equity markets. The Group has always stressed the importance of maintaining the confidence of its financial partners and thus also access to necessary loan capital on favorable terms.
The Group’s financial goals are reflected in quantified parameters for financial adequacy and returns. The requirement for financial adequacy stipulates that the Group’s equity ratio, defined as equity/total assets, should be at least 30% over time. The Group’s long-term goal for earnings is to generate an annual return on the Group’s average capital employed of 18% before tax.
The company’s dividend policy implies that, over time, dividends should lie in the region of 30% to 40% of profit after tax. However, care must be taken at all times to ensure that the Group operates in line with satisfactory financial contingency for new and profitable investments. In the long run, value generation will increasingly be in the form of higher share prices rather than in declared dividends. See note on dividend per share for more information.
Below is a detailed description of the Group’s assessments in situations where the Group has established that an asset has an indefinite useful life, cf. IAS 38.122. Intangible assets with an indefinite useful life are not amortised but tested for impairment once a year as a minimum. Please refer to the note on intangible assets for information on the impairment test.
The license scheme for production of salmon and trout in Norway was introduced by the Storting (the Norwegian Parliament) and adopted in the Norwegian Act relating to aquaculture (Aquaculture Act). The Ministry of Trade, Industry and Fisheries is responsible for allocation of aquaculture permits (licenses). All activities involving aquaculture require a license. It is prohibited to farm salmon/trout without a license from the authorities, cf. section 4 of the Aquaculture Act. All licenses are governed by the same regulations (the current Aquaculture Act with provisions) irrespective of when the license was allocated.
LSG’s aquaculture permit entitles the Group to produce salmon and trout in delimited geographic areas (localities), according to the prevailing limitations established at any given time regarding the scope of the permit. The Ministry may prescribe detailed provisions relating to the content of the aquaculture licenses by administrative decision or regulations.
The Aquaculture Act is administered centrally by the Ministry of Trade, Industry and Fisheries, and the Directorate of Fisheries is the supervisory authority. Regionally, there are a number of sector authorities that together represent a complete administrative and supervisory authority within the area governed by the Aquaculture Act. The individual county is the regional administrative body, and the Directorate of Fisheries is the appellate body for issues involving localities and licenses.
Since January 2005, the limitations on production established for aquaculture licenses for salmon and trout have been governed according to a scheme known as Maximum Allowable Biomass (MAB). This specifies the maximum biomass in the sea that a license holder can have at any given time. The Group has a sufficient number of localities (locality MAB) in the different regions to achieve a satisfactory exploitation of the Group’s total MAB. All commercial licenses for production of salmon and trout in sea are currently operational. The following regulations regarding production limitations apply to the different types of licenses held by the Group:
Grow-out licenses are limited in number, i.e. the enterprises are only granted new licenses or more production volume subsequent to politically adopted allocation rounds. The maximum allowable biomass (MAB) has previously been 780 tonnes of salmon or trout per license. The maximum allowable biomass (MAB) for the counties of Troms and Finnmark (North Norway) has previously been 945 tonnes of salmon or trout per license. Following the political decision taken in 2017 that it should be possible to allocate percentage growth per license based on various conditions, a fixed maximum allowable biomass per license is no longer specified. The system has been named the "traffic light system". The traffic light system is meant as a permanent framework for mitigating growth in Norwegian aquaculture. In this system the Norwegian coastline was divided into 13 different production areas. With a frequency of 2 years, the different areas are colored red, yellow, or green, based on certain criteria. In areas colored red the maximum production volumes are reduced. In yellow areas there is no change. In green areas, it is opened for growth. A certain portion of the growth are offered to the farmers at a fixed price, while the remaining portion are offered at auction. The farmers are free to choose to purchase
All figures in NOK 1 000
the offered growth or not. See note on intangibles, section licenses, for further information about present year`s changes.
Green farming licenses are licenses that were awarded in 2015 via a dedicated licensing round. Special conditions were attached to these licenses, mainly concerning environmental improvement measures. The licenses were awarded via open auctions or competitively, based on environmentally focused technology and operating concepts.
Demonstration licenses are licenses defined for special purposes.
Demonstration licenses are granted to enterprises in order to share knowledge of the aquaculture industry. Such licenses are often operated in cooperation with a non-commercial entity.
Teaching licenses are another kind of special-purpose license and are allocated to disseminate knowledge of the fish farming industry. The licenses are linked to specific educational institutions and are thus regulated by the county.
Research and development licenses are licenses awarded in connection with research and development projects in the industry, where dedicated licenses are required to carry out the R&D activity.
Slaughter cage licenses are allocated for the use of sea cages for live fish for slaughter. These licenses are linked to a specific location, which is the Group’s slaughtering plant for salmon and trout.
Parent fish licenses are also licenses defined for special purposes. Parent fish licenses are granted for the production of salmon roe utilised to produce juvenile fish.
Juvenile fish licenses are licenses to produce juvenile salmon and trout in fresh water that in total authorise the license holder to produce a specific number of juvenile salmon and trout.
There are certain limitations on the size of juvenile fish that may be produced according to the individual license. Licences are granted on the basis of a discharge permit for a certain number of fish/biomass with a maximum allowable feed consumption per year. In situations where the water source is owned by a third party, an agreement is also required governing the right to utilise the water source.
Duration and renewal
Section 5, second paragraph of the Aquaculture Act reads: "The Ministry may prescribe detailed provisions relating to the content of the aquaculture licenses, including the scope, time limitations, etc., by administrative decision or regulations."
In the legislative background to the Aquaculture Act, White Paper no. 61 2004-2005, the following statement can be found on page 59: "It will remain the case that licenses are normally allocated without any specific time limitation. Implementation of such limitations should be reserved for those issues where a time limitation, based on the specific situation, provides for a more complete fulfilment of the Act than if the license were to be allocated without a time limitation."
The duration of licenses is also specified by the Aquaculture Act, which in its most recent revision underlined ownership of licenses by allowing the licenses to be mortgaged to the benefit of the lender.
There are no time limitations specified in LSG’s terms for grow-out and juvenile licenses, and they are therefore deemed to be time-indefinite production rights according to the prevailing regulations. This also applies to green licenses.
As the licenses are not bound by a time-limited period, there is no need to apply for their renewal. The licenses are deemed to be valid pursuant to the Aquaculture Act, unless they are revoked in accordance with the Act. Section 9 of the Aquaculture Act describes the grounds for revocation
of a license. Section 9 states that licenses may be revoked due to gross contravention of the provisions of the Act. We can confirm that no operative licenses for salmon and trout have been revoked in Norway.
Research and development licenses are time-limited and apply in general for the duration of the project. They are often linked to the life cycle of the salmon, i.e. three years. R&D licenses are managed in close cooperation with research groups, and an application to extend them for a new three-year period can be made after the project has ended.
The parent fish licenses are granted for 15 years at a time, and applications have to be submitted for their renewal, provided that the license holder is still involved in production of parent fish for salmon or trout. Parent fish production is an integral part of LSG’s value chain (parent fish production takes place before production of roe and juvenile fish in the value chain) and is therefore closely linked to the breeding system for salmon and trout. The Group’s applications for renewal of parent fish licenses have always been approved, in line with the prevailing practice in the industry.
The licenses for slaughter cages are allocated for 10 years at a time. Applications can be submitted for renewal of such licenses provided that they are linked to an approved slaughtering plant and only utilised to keep fish ready for slaughter in immediate proximity to the slaughtering plant.
The Group’s demonstration licenses are allocated for a period of 10 years. Applications can be submitted for renewal of demonstration licenses provided that the terms for the license are met pursuant to the Aquaculture Act.
The Group’s teaching licenses have been allocated for 10 years. Applications can be submitted for renewal of teaching licenses provided that the terms for the
license are met pursuant to the Aquaculture Act.
Regulations relating to right of use: transfer, lease, moving etc.
All licenses can be transferred pursuant to section 19 of the Aquaculture Act, and can be mortgaged pursuant to section 20 of the Act. An aquaculture register is kept of all aquaculture licenses where transfers and mortgaging are registered. The leasing of aquaculture licenses or license capacity is not permitted. Grow-out licenses and parent fish licenses can be linked to different locations, but there are certain limitations on moving of licenses between the regions defined by the Directorate of Fisheries. In practice, this means that licenses cannot be moved between defined regions, which typically follow county borders. Juvenile fish licenses are attached to one locality – the locality for which the license applies.
Costs related to licenses
Payment has been required for new licenses granted during more recent allocation rounds. The amount of the payment depends on the allocation criteria, including for example a fixed price versus the auction principle. Given that there is no requirement to apply for renewal of licenses, then there are no costs involved in license renewal.
The costs of maintaining aquaculture licenses in Norway are insignificant. There are no annual fees or other types of duties linked to the actual license. However, there are certain fees to be paid for inspection and control of the licenses. Fees also have to be paid to establish new localities and/or to extend/amend localities. As a main rule, an amount of twelve thousand Norwegian krones is paid per license covered by an application for amendment at locality level, cf. section 2 of the Regulation relating to fees and duties for aquaculture activities. All fees and costs are immediately recognised as an operating expense.
According to past and present legislation and the general interpretation and practice in the industry, Norwegian fish farming licenses are not a time-limited right, and licenses should therefore not be subject to amortisation. Where timelimited R&D licenses, demonstration licenses and educational licenses are concerned, these are awarded free of charge, so amortisation is normally not relevant. However, in cases where related acquiring or renewing costs are capitalised, they will be subjected to depreciation over the economic life.
The following factors played a key role in the assessment of whether licenses have an indefinite useful life, with reference to the description of the license types above:
(1) No time limitation on the licenses
(2) Insignificant expenditure involved in maintaining the licenses
(3) High threshold for revocation of licenses; this has never happened in Norway
It has also been noted that the licenses are registered in the public aquaculture register as being without time limitation.
On this basis, the economic life is assessed to be indefinite for the grow-out licenses and juvenile fish licenses, in accordance with IAS 38.90.
As mentioned above, these licenses are granted for 15 years at a time, and applications can be submitted for renewal. In 2007, the duration of parent fish licenses was amended from 10 years to 15 years (amendment to regulation dated 14 August 2007 no. 986). In the consultation document dated 7 June 2007, the Ministry stated the following regarding time limitation for parent fish licenses in item 3.3: "The recommendation implies that the licenses shall be time-limited for a period (...) with clearly defined predictability for extension of new periods. Time-limited licenses may
however result in less predictability for the entities than licenses without time limitations. Predictability is key as breeding and parent fish production is a time-consuming and resourceintensive activity, but this is provided for by (...) a fixed-term period with clearly defined predictability for extension."
IAS 38.94 states that if the contractual or legal rights are assigned for a limited period of time that can be renewed, the useful life of the intangible asset should include the renewal period(s) only if there is documented evidence to support that the cost of the renewal for the entity is not significant. IAS 38.96 provides guidelines describing factors that can be included in this assessment. The following factors have been central to LSG’s assessment of indefinite useful life for the parent fish licenses:
a) the entity’s licenses have always been renewed. Renewal does not require third-party consent, but is based on factors that are under the control of the entity, i.e. the terms of the license are met and an application for renewal has been submitted before the expiry of the 15-year period. The main condition for renewal is that parent fish production is carried out in connection with a breeding system. Parent fish production will continue to be an integral part of LSG’s value chain, and as such this requirement will be met.
b) the entity can document fulfilment of the license conditions,
c) the cost to the entity for renewal is not significant, when compared with the future economic benefits expected to flow to the entity from renewal.
The Group’s demonstration licenses are allocated for a period of 10 years. Applications can be submitted for renewal of demonstration licenses provided that the terms for the license are met pursuant to the Aquaculture Act. As with parent fish licenses, this type of license is defined as being for
special purposes. Both parent fish and demonstration licenses are a type of activity without any clear time limitation. In principle, the same factors as for parent fish licenses will apply to demonstration licenses.
With one exception, the Group’s teaching licenses have been allocated for 10 years. Applications can be submitted for renewal of teaching licenses provided that the terms for the license are met pursuant to the Aquaculture Act. The Group has also taken over one teaching license pursuant to an open-ended agreement with an educational institution. Since the agreement has a limited undefined useful life, its duration has been estimated at one year.
New standards implemented in 2022
IASB and EU have not implemented any new standards that have been mandatory to adopt in 2022.
Certain new accounting standards and interpretations have been published that are not mandatory for 2022 reporting periods and have not been early adopted by the group. These standards and interpretations are not expected to have a material impact on the group in the future reporting periods and on foreseeable future transactions.
All figures in NOK 1 000
Lerøy Seafood Group’s accounts are submitted in accordance with international standards for financial reporting (IFRS) and interpretations established by the International Accounting Standards Board (IASB) and adopted by the EU. In addition, the Board and management have chosen to present certain alternative performance measures (APMs) to make the Group’s developments simpler to understand. The Board and management are of the opinion that these performance measures are in demand and utilised by investors, analysts, credit institutions and other stakeholders. The alternative performance measures are derived from the performance measures defined in IFRS. The figures are defined below. They are consistently calculated and presented in addition to other performance measures, in line with the Guidelines on Alternative
Performance Measures from the European Securities and Markets Authority (ESMA).
EBIT before fair value adjustments is an APM utilised by the Group. Pursuant to IFRS, biological assets (fish in the sea) shall be measured at fair value in the statement of financial position (IAS 41). Estimates of fair value require various assumptions about the future, including price developments. Changes in the market’s price expectations may therefore result in major changes in carried value. As this change in value is included in the operating profit or loss (EBIT) as defined in IFRS, this figure alone is not sufficient to illustrate the Group’s performance during the period. The same applies to other items on the statement of financial position related to biological assets, onerous contracts (IFRS 37) and
financial fish-pool contracts (IFRS 9). The Group has therefore elected to present operating profit as it would be presented before recognition of the above-mentioned fair value adjustments, as an alternative performance measure. By presenting
(1) EBIT before fair value adjustments,
(2) fair value adjustments in the period and
(3) EBIT after fair value adjustments, the user of the financial statements will easily be able to identify how much of the operating profit comprises changes in fair value (fair value adjustments) and thereby compare performance with other companies in the same industry. The note on biological assets contains a detailed description of how fair value adjustment is calculated and the figures for each component. The following components are included:
Fair value adjustments consists of
1. Change in fair value adjustment on fish in sea
2. Change in fair value adjustment on roe, fry and cleaning fish*
3. Change in fair value adjustment on onerous contracts (salmon and trout)
4. Change in fair value adjustment on Fish Pool contracts (financial contracts on salmon), not regarded as hedges
* For this group historical cost provides the best estimate of fair value.
See note on biological assets for more details.
The APM is used in the income statement, in note 5 on segments and in the calculation of some key figures. It is also referred to in the Board of Director`s report.
EBITDA before fair value adjustments is an APM. Calculation is identical as the calculation of «EBIT before fair value adjustments» (above).
The APM is used in the income statement.
Profit before tax and fair value adjustments is an APM utilised by the Group. Pursuant to IFRS, biological assets (fish in the sea) shall be measured at fair value in the
statement of financial position (IAS 41). The APM demonstrates how the result would have been if IAS 41 not had been applied. This implies that the FV adjustment on fish in sea are reversed (eliminated). This includes both the group`s own FV adjustment
It is referred to this APM in the Board of Director`s Report.
Controlling interests (CI`s) share of annual profit (after tax) before fair value adjustments is an APM utilised by the Group. Pursuant to IFRS, biological assets (fish in the sea) shall be measured at fair value in the
statement of financial position (IAS 41). The APM demonstrates how the share of annual profit after tax to LSG`s shareholders would have been if IAS 41 not had been applied. This implies that the CI`s proportional share of FV adjustment on fish in sea are reversed (eliminated). This
and also the FV adjustments included in the income from associated companies (AC) also applying IAS 41, following the equity method. The components included are:
includes both the group`s own FV adjustment and also the FV adjustments included in the income from associated companies (AC) also applying IAS 41, following the equity method. The components included are:
This APM is used in note 19 on earnings per share, for calculation of the key figure earnings per share before fair value adjustments.
NIBD is an APM utilized by the Group. The figure shows how much capital the Group employs and is an important key figure for stakeholders who are planning to grant financing to the Group and for stakeholders who want to value the company. NIBD is defined as interest-bearing commitments, both short-term and long-term, to persons or institutions with the main purpose of providing financing and/or credit, minus interestbearing cash or cash equivalents.
Since NIBD is an APM, with no common definition from IFRS, different
definitions and versions of this APM exist today in the reporting from the companies. The most important difference relates to the recognition of lease liabilities. Some companies include all lease liabilities in NIBD. Other companies exclude all lease liabilities from their NIBD. And some use a combination. Therefore, it is important to be aware of this difference when comparing between companies. Lerøy Seafood Group use a combination, with an approach that distinct between lease liabilities derived from a financing purpose and lease liabilities that are not.
In practice, this distinction is based on what kind of party the company has made the leasing agreement with. On the date of implementation of IFRS 16, the Group`s financial leasing liabilities was almost only with credit institutions, with the main purpose of providing the Group financing. These agreements shared the principle that the duration of the lease period covered most of the economic lifetime of the asset involved. When it comes to the operational leasing liabilities, these agreements did nearly only concern rentals for well-boats and buildings, from shipping companies and real estate developers, where
financing was not the purpose, and where the rental period was much shorter than the economic lifetime of the asset involved.
In the Group`s communication to the capital market about how much cash the Group has spent on investments, and how this is financed, this distinction is of relevance. Therefore, this distinction between leases with credit institutions and leases with others than credit institutions is established and included in the Group`s
definition of NIBD.
Lease liabilities to credit institutions are included in NIBD and the Group`s communication of changes in NIBD, while lease liabilities to others than credit institutions are not included. The corresponding right-of-use assets from leases with credit institutions are included in the Group`s communication of investments, while right-of-use assets from leases with others than credit institutions are not included.
Thus, the definition ensures symmetry between what`s reported as the Group`s investments and the accompanying information on how this has been financed. The Group`s NIBD is therefore not impacted from the type of financing, in terms of loans versus leases. This approach also ensures an NIBD basically unimpacted from the implementation of IFRS 16 in 2019. This implies that the Group`s key financial figures that includes NIBD in the calculation, still are comparable over time.
See note on debt, mortgages and guarantees for an overview of flows in the period. It is referred to this APM in the Board of Director`s Report, in key figures and in the note on loans, mortgages and guarantees.
3 different definitions of NIBD, and LSG`s position within these alternatives
When comparing NIBD between companies based on annual accounts, it is important to be aware that the presented NIBD figure is dependent
on if lease liabilities is included, partly included, or not included at all. As of today there is no uniform definition among the reporting entities about
how this figures should be calculated and presented.
Estimates and assessments are reviewed continuously and are based on historical experience and other factors, including expectations of future events that seem probable in view of present circumstances.
The Group draws up estimates and makes assumptions regarding future events. The accounting estimates from this process will, by definition, rarely be in exact agreement with the final results. Estimates and assumptions with a high risk of significant changes in capitalised values of assets and liabilities during the next financial year are discussed below.
Biological assets comprise the stock of roe, fry, juvenile fish, cleaner fish and fish in sea. Biological assets are measured at fair value less costs to sell. For a more detailed description of the accounting policies applied, please refer to the description provided under accounting policies and in the note on biological assets.
Valuation is based on a number of different premises, many of which are non-observable. The premises can be categorised in four different groups: (1) Price, (2) Cost, (3) Volume and (4) Discount rate. Figures for the important premises are specifed in the note on biological assets.
For fish ready for harvest on the balance sheet date, uncertainty mainly involves realised prices and volume. For fish not ready for harvest, the level of uncertainty is higher. In addition to uncertainty related to price and volume, there will also be uncertainty related to remaining production costs, remaining biological transformation and remaining mortality up to harvest date for this fish.
One important premise in the valuation of fish both ready for harvest and not yet ready for harvest is the projected market price. This is also the premise that historically shows the highest
fluctuations. In order to estimate the projected price, the forward prices for superior Norwegian salmon weighing 3-6 kg gutted weight from Fish Pool are applied. In the Group’s opinion, the use of observable prices makes price estimates more reliable and comparable. For fish ready for harvest, the forward price for the following month is applied. For fish not ready for harvest, the forward price for the month when the fish is expected to achieve optimal weight for harvest, is applied. If it is probable on the balance sheet date that the fish will be harvested before it reaches its optimal harvest weight, for example due to biological challenges, an extra price adjustment is required. Such a price adjustment takes into account the fact that the market price per kilo for small fish is lower than for normalsize fish. The price is subsequently adjusted for exporter margins and clearing costs. This applies to fish both ready for harvest and not ready for harvest. Further adjustments are necessary for harvest costs (well boat, slaughtering and packaging services), transport costs to Oslo and quality diffeences. Adjustments are also made for price differences between salmon and trout, and any other price premium such as for Ecological produced salmon or ASC-certified fish. The adjustments for exporter margin and clearing costs are items estimated by Fish Pool. The adjustment for harvest costs, transport costs and quality differences is based on the Group’s historical costs per region and historical quality distribution, while the other adjustments are based on an assessment using historical data and the Group’s view of future market developments.
For fish not ready for harvest, an adjustment is also required for the costs necessary to grow the fish to optimal harvest weight. Estimates related to future costs are based on the Group’s prognoses per locality. There is some uncertainty regarding both future feed prices, other costs and biological development (growth, feed factor and mortality). If the
estimated costs are higher than expected by a normal enterprise on the market, for example due to longterm agreements previously signed with subcontractors resulting in costs that deviate substantially from the market price, the cost estimates shall be adjusted to reflect the costs expected by a rational enterprise on the market.
Projected harvest volume is calculated on the basis of the estimated number of fish (individuals) on the balance sheet date minus estimated future mortality, multiplied by the estimated harvest weight. There is some uncertainty involving both the number of fish in the sea on the balance sheet date, remaining mortality and estimated harvest weight. The actual harvest volume may therefore differ from the estimated harvest volume either as a result of changes in biological developments or due to special events, such as abnormal mortality. The estimate for number of fish on the balance sheet date is based on the number of smolt released to sea. The number of smolt is adjusted to take into account uncertainties during counting and actual registered mortality related to release. The normal estimated harvest weight (optimal harvest weight) is assessed to be the live weight of fish that results in a gutted weight of 4 kg, unless specific conditions exist on the balance sheet date to indicate that the fish have to be harvested before they reach this weight. If this is the case, the estimated harvest weight is adjusted. Projected mortality during the period from the balance sheet date to the date when the fish reach harvest weight is estimated to be 0.5% to 2.5% of the number of incoming fish per month, depending on species and region. For recalculation factor from gutted weight to live weight, see note on biological assets.
Every time a fish is harvested and sold, this generates a positive cash flow. In order to simplify matters, all the remaining expenses are allocated
to the same period as the income, so there is only one cash flow per locality. The cash flow is allocated to the month when harvest is estimated to take place. The sum of the cash flows from all the localities where the Group has fish in the sea will then be distributed over the entire period of time it takes to farm the fish in the sea on the balance sheet date. With the current size of the smolt released and the frequency of the smolt releases, this period of time may be up to 18 months. The estimated future cash flow is discounted monthly. The level of discount rate applied has a major impact on the estimate of fair value. The discount rate shall take into account a number of factors. The discount factor comprises three main elements: (1) Risk adjustment, (2) License lease and (3) Time value.
The risk adjustment shall reflect the price discount a hypothetical buyer would demand as compensation for the risk assumed by investing in live fish rather than a different investment. The longer it takes to reach harvest date, the higher the risk that something may occur to affect cash flow. Three significant factors could have an impact on cash flow. Volume could change, costs could change and prices could change. The one thing all three factors have in common is that the sample space is unsymmetrical.
Salmon and trout farming is not a market with free competition and no barriers to entry. Due to limited access to licenses for farming fish for consumers, such licenses currently have a very high value. For a hypothetical buyer of live fish to take over and continue to farm the fish, he/she would need a license, locality and other permits required for such production. At the time of writing, leasing of licenses is not permitted. However, on a hypothetical market for the purchase and sale of live fish, it has to be assumed that this would be possible. In such a scenario, a hypothetical buyer would claim a significant discount in order to
allocate a sufficient share of the returns to the buyer’s own licenses or to cover the lease costs for leased licenses. It is difficult to create a model that would allow a hypothetical annual lease cost to be derived from prices for sold licenses, as the curve in the model would be based on projections of future profit performance in the industry. Moreover, it is a complex process to derive a lease price per shorter unit of time and, in the last instance, per volume, when the license limitations are measured at different levels (location, region and company).
Finally, a discount must be made for the time value of the tied-up capital linked to the share of the present value of the cash flow allocated to the biomass. It has to be assumed that a hypothetical buyer would claim compensation for the alternative cost of investing funds in live fish rather than some other type of investment. The production cycle for salmon in the sea currently takes up to 18 months. The cash flow will therefore extend over a similar period. Assuming a constant sales price throughout the period, the cash flow would decrease for each month, as costs are incurred to farm the fish to slaughter weight. The costs increase for every month the fish are in the sea. As such, the effect of deferred cash flow is lower than would be the case if the cash flow had been constant. This component is however deemed important due to the major values the stock of fish represents.
At year end 2022 a 4% monthly discount rate has been applied. The discount rate previous year was also 4%. In the sensitivity analysis below, it is demonstrated how a change in discount rate would impact the value on fish in sea. The change is a result from a periodic review.
As mentioned above, the hypothetical license lease is one of the main elements when setting the discount rate. In the hypothetical license lease
price the future expected margin is an important parameter. The margin is calculated as the difference between price and cost in future periods. Thus, the forward price on salmon together with expectations regarding future cost level have a significant impact on the future expected margin. The higher the expectations to the future margins are, the higher a hypothetical license lease price will be. This is explained with the fact that higher margins will increase the fair value on the licenses. If the expectations to the margins drops, this will over time lead to lower hypothetical lease rent, and fair value on the licenses.
How the change in the expectations regarding future margins occurs, has also significance. It is assumed that an unexpected lower (higher) price at date for measurement will not lead to a simultaneously reduction (increase) in hypothetical license lease price for fish in sea, but instead a step by step reduction (increase) in future lease price for new smolt releases. This is explained with the fact that it must be assumed that the lease price for the fish in sea is already negotiated for the period until harvest. When it comes to the production costs it is assumed that changes in expected future cost level will not impact the value of the biological assets directly, but indirectly as a consequence of the fact that the future hypothetical license lease price will be based on expectations on future margins.
The Group considers that four components are key for valuation. These are:
(1) weighted average price,
(2) projected optimal harvest weight,
(3) monthly discount rate and
(4) estimated number of fish.
The tables on the next page show a simulated sensitivity to changes in fair value of the biological assets in the event of changes in these parameters:
All figures in NOK 1 000
The table shows changes in estimated fair value (present value) before provision for loss-making contracts for the parameters price per kg and projected harvest weight per kg gutted weight. For projected harvest
weight, the table shows changes in fair value when there is an increase in projected harvest weight of 250 and 500 grams respectively, and for a corresponding reduction, without any change in remaining cost. For
price, the change is per NOK gutted weight after adjustment for slaughtering cost, packaging cost, transport cost to Oslo, quality, size and exporter margin.
Sensitivity analysis for weighted average price and monthly discount rate applied
The table shows changes in estimated fair value (present value) before provision for loss-making
contracts for the parameters price per kg and monthly discount rate. For the monthly discount rate, the table
simulates an absolute change of +/1% and +/- 2% (100 and 200 points) respectively.
Sensitivity analysis for weighted average price and number of fish in stock
The table shows changes in estimated fair value (present value) before provision for loss-making contracts for the parameters price per kg and
estimated number of fish in stock on the balance sheet date. For the number of fish in stock, the table simulates a change of +/- 2% and +/-
5% in the number of fish per locality for all localities with fish in stock.
Sensitivity analysis for number of fish in stock and monthly discount rate applied
The table shows changes in estimated fair value (present value) before provision for loss-making contracts for the parameters monthly discount rate and estimated
number of fish in stock on the date of the statement of financial position. For the monthly discount rate, the table simulates an absolute change of +/- 1% and 2% (100 and 200 points)
respectively. For the number of fish in stock, the table simulates a change of +/- 1%, 2% and 5% in the number of fish per locality for all localities with fish in stock.
The list below shows which companies are included in the consolidated financial statements, and how these are allocated to
business area and operating segment. It also shows changes in ownership through the year.
Reference is made to the note on
subsidiaries in Lerøy Seafood Group ASA’s financial statements for more detailed information, including book values.
Comments on changes
1) Transactions with non-controlling interests
2) Change in owership within the group
3) Foundation of new company
4) Business combination - Change from associated company to subsidiary
5) Business combination - New company acquired
6) Parent–subsidiary merger
7) Sale of company
8) Liquidation of company
* Foundation date. The companies were part of «the old Lerøy group» before Lerøy Seafood Group ASA was founded in 1995
** The company has changed its name this year. See below for details.
Overview of companies that have changed their names in 2022
New name Old name Country
Lerøy Norge AS Laks- & Vildtcentralen AS Norway
Lerøy Seafood Denmark A/S Seafood Danmark A/S Denmark
All figures in NOK 1 000
The gain is mainly concerning the step-by-step business combination with the previous associated company
Segments
The Group has the following segments:
(1) Wild catch
(2) Farming
(3) Value-added processing (VAP), sales and distribution (VAPSD)
Lerøy Seafood Group ASA and Preline Fishfarming System AS are not allocated to any of these segments, and are included in the elimination segment. Farming is divided into three individual regions:
(A) North (Lerøy Aurora AS and Lerøy Aurora 2 AS)
(B) Central (Lerøy Midt AS and Lerøy Midt 2 AS)
(C) West (Lerøy Vest AS, Lerøy Vest 2 AS, Sjøtroll Havbruk AS, Sjøtroll Havbruk 2 AS, Lerøy Sjøtroll Kjærelva AS, Lerøy Årskog AS, Lerøy Ocean Harvest AS and Norsk Oppdrettsservice AS). Region West are also referred to as "Lerøy Sjøtroll".
Further details regarding the different companies in the groups, allocation to segment and level of aggregation are presented in note on consolidated companies. The aggregation level for reporting by region is described in the note on accounting principles.
All figures in NOK 1 000
* Fair value adjustments related to biological assets
** Including effect from changes in stock and corresponding elimination for internal profit.
*** Net investments consist of net addition for (1) fixed assets. (2) intangibles and (3) right-of-use assets from credit institutions. Net investment is total purchase price paid for new assets minus sale price for disposed assets. Right-of-use assets derived from leases with other than credit institutions are not considered to be investments. and are therefore not included.
Specification per region within Farming
* GWT = Gutted weight in tonnes
** Before fair value adjustments related to biological assets
All figures in NOK 1 000
Information on currency
Operating revenue in NOK by currency
Sales in foreign currency from Group companies in Norway normally take place at an approximate transaction rate (week rates). However, contractual sales are hedged and the sales revenue is adjusted with the effect from the currency forward contracts. Sales from foreign Group companies in foreign currency are in principle translated to NOK on the basis of the accumulated monthly average exchange rate in the accounting period.
Information on geographic areas
Sales are allocated to the customers’ home country. Assets and investments are distributed according to geographical location.
* Most of the trade receivables in the subsidiary Lerøy Seafood AS are from customers abroad. At year-end (year end previous year) this amounted to NOK 1,137,881 out of NOK 1,378,330 (NOK 988,595 out of NOK 1,130,311). Most of the trade receivables are covered by credit insurance.
All figures in NOK 1 000
Business combinations and transactions with non-controlling interests in 2022
Lerøy Vest Kraft AS
Lerøy Vest AS acquired 100% of the shares in a small local power plant on Fitjar, producing power from a local river. It was paid NOK 9.775 for
the shares. The plant will contribute with own-produced electrisity to the smolt facility owned by Lerøy Sjøtroll Kjærelva AS.
Lerøy Seafood Denmark A/S
In 2022 the Group settled the remaining part of the consideration
agreed upon for the shares in Lerøy Seafood Denmark A/S (previously named Seafood Danmark A/S) that the Group acquired in 2021. The consideration accrued for in the balance sheet last year. The paid amount was the same as accrued for, and totalled NOK 49 millions.
Lerøy Vest Kraft AS
All figures in NOK 1 000
The Group increased its ownership in Dragøy Grossist AS from 34% to 51% 1 January 2021. The acquisition is recognised as a step-by-step acquisition, with a new measurement and calculation of gain/losses on the shares that was previously acquired. Until transaction date the previously acquired shares have been recognised and booked as an associated company, following the equity method. The shares are held by Lerøy Nord AS. The acquired company is a wholesaler in Tromsø.
The Group increased its ownership in Sørøya Isanlegg AS from 33.3% to 100% 1 January 2021. The acquisition is recognised as a step-by-step acquisition, with a new measurement and calculation of gain/losses on the shares that was previously acquired. Until transaction date the previously acquired shares have been recognised and booked as an associated company, following the equity method. The shares are held by Lerøy Norway Seafoods AS. The acquired company is a service provider for the white fish industry. The company operates from Hasvik.
The Group acquired 100% of FMV Eiendom AS 31 March 2021. The name of the acquired company was changed to Lerøy Årskog AS. The acquisition was recognised at fair value. The company was purchased from the ultimate parent company of the group, Laco AS, and is therefore identified as a related party transaction. An external valuation of the company was required and used as the basis for the purchase price. The shares are held by Lerøy Seafood Group ASA. The acquired company owns land areas regulated and approved for production of smolt, salmon and trout on land, with a total maximum volume of 10 thousand MTB. The land area is in Fitjar. Groundwork related to buildings and installments has been started.
The Group increased its ownership in Seafood Danmark A/S from 33.3% to 77.6% 1 April 2021. The acquisition is recognised as a step-by-step acquisition, with a new measurement and calculation of gain/losses on the shares that was previously acquired. Accumulated currency exchange differences until date of business combination, previously recognised in other comprehensive income, is recycled over profit and loss, and included in the calculated gain. Until transaction date the previously acquired shares have been recognised and booked as an associated company, following the equity method.
The shares are held by Lerøy Seafood Group ASA. The business in the acquired company is VAP, sales and distribution in Danmark. The company owns and operate several production facilities in Denmark.
The non-controlling interests in the company named Wannebo International AS was redeemed 1 July 2021. As the company is a group company, owned through Seafood Danmark A/S, the redemption amount has been recognised as an equity transaction. The company`s business purpose is purchasing seafood in Norway and exporting it from Norway to Seafood Danmark A/S.
The Group has also participated indirectly in the acquisition of Grieg Seafood Hjaltland UK Ltd through the 50% owned associated company Norskott Havbruk AS. The acquiring legal entity was Scottish Seafarms Ltd, a fully owned subsidiary of Norskott Havbruk AS. The name of the acquired company was changed to SSF Hjaltland Ltd right after the date of control, 15 December 2021. This transaction is not included in business combinations of the Group, according to IFRS 3, which are summarized below. For this transaction, it is referred to the note on associated companies for further details.
All figures in NOK 1 000
All figures in NOK 1 000
Specification of intangible assets per acquisition, per segment
1) Consists of the Midnor acquisition from 2003 and the Hydrotech acquisition from 2006. The companies are now merged.
2) Consists of the Aurora acquisition from 2005, the Villa acquisition from 2014, in addition to paid amount for increased volume in 2017, 2018 and 2020
3) Rights with a definite useful life and are subject to amortisation.
4) The change in goodwill comes mainly from currency translation differences related to foreign subsidiaries to NOK (IAS 21)
5) A certain part of the total value has a definite useful life, and is subject to amortisation.
6) Consists of initial costs related to R&D licence granted to LSG ASA, and in process of being accepted. Will be operated by Lerøy Vest AS
7) Increase is related to acquisition of water fall rights to a power plant, with undefinite lifetime
All figures in NOK 1 000
Licences
Licences in the Farming segment
The net book value of licences in the Farming segment is NOK 2 484 676
including the capitalized costs related to the renewal of the R&D licence in Lerøy Seafood Group ASA. Below is a list of the licences owned
by LSG at the end of the financial year according to type, number and volume. The list is based on data registered in the Aquaculture Register.
1) The commercial grown-out licences are described further below.
2) The R&D licences are time-limited with a duration of three years, from time of project start. The licences have zero purchase price, and therefore no depreciation. The R&D licence allocated to Lerøy Aurora in the table above legally belongs to Akvaplan Niva (third party), but is operated by Lerøy Aurora.
3) The teaching licences are considered time-limited with a duration of 10 years. The licences have zero purchase price, and therefore no depreciation. The teaching licence allocated to Lerøy Aurora in the table above legally belongs to Troms- og Finnmark Fylkeskommune (third party), but is operated by Lerøy Aurora.
4) One of the parent fish licence owned by Lerøy Midt, is operated by Lerøy Aurora.
5) The land-based grow-out licence is owned by Lerøy Årskog AS. The licence permits production of land-based salmon or trout or juvenile fish or a combination, for a total volume of 10,000 tonnes. Theoretically the authorities may withdraw this licence if the production has not started within two years after reward date. The licences was awarded the 25th of March 2019. The risk for withdrawal is considered as low, since the ground work for the plant is started.
For a more detailed explanation of why farming licences are deemed to have an indefinite useful life and are therefore not subject to amortisation, please see item (X) in the note on accounting policies.
The colors relate to the «traffic light system». The traffic light system is described in the note on accounting principles under section about licences. Red area: Temporary reduction in volume of 6% in PO 3 and PO 4, which equals a reduction of 2.641 tons. This is the second time PO 4 has expe
rienced a reduction in production capacy. The color will be subjected to a new evaluation in 2024. Yellow area : No changes in volume. The color will be subjected to a new evaluation in 2024. Green area: Is opened for growth. The Group did not buy any growth offered in 2022. The color will be subjected to a new evaluation in
The Group has also licences to cultivate seaweed in Vestland county. These are located in the same geographical area as the licences for salmon farming. The licences alows a cultivation of a total of 1013 decares. Furthermore, the Group have two seaweed licences totalling 830 decares under process of approval. These licences have normally indefinite lifetime. The licences are awarded after an application process, and have no purchase price.
All figures in NOK 1 000
The Wild catch segment comprises the two sub-groups, Lerøy Havfisk AS and Lerøy Norway Seafoods AS. Lerøy Havfisk AS is a shipowning company, with trawlers involved in wild catches. Lerøy Norway Seafoods AS is involved in the receipt and processing of wild caught whitefish.
The licences in this segment are owned by the sub-group, Lerøy Havfisk AS (vessel owning subsidiaries). The licences are governed by an obligation to supply products to the regions where the licences are located, i.e. Finnmark and Nordland. This implies that buyers in those regions have priority over other buyers of fish. The details of the supply obligation are stipulated in the licence terms for the individual licence unit. This may be a region but could also be a specific buyer. The principle for pricing is the average price realised for the species of fish in question over the past two weeks, taking into account condition, size and quality. Lerøy Havfisk AS is also subject to a so-called «industrial obligation» (obligation to keep the business going) in Stamsund, Melbu, Hammerfest, Båtsfjord, Honningsvåg and Kjøllefjord. This implies that the licence is linked to operation of the facilities in the respective locations. Lerøy Havfisk AS has however leased out the facilities in these locations. The lessee is Lerøy Norway Seafoods AS. The lessee is responsible for sustaining operations. If the lessee terminates operations, the licence terms oblige Lerøy Havfisk AS to sustain operations in the specified locations.
At the end of the financial year, the Lerøy Havfisk group owned 29.6 cod and haddock trawling licences, 31.9 saithe trawling licences, 8 shrimp
trawling licences and 2 greater silver licences in Norway. These licences are owned via the subsidiaries Nordland Havfiske AS, Finnmark Havfiske AS and Hammerfest Industrifiske AS. It has not been acquired or sold quotas/licences in 2022.
A licence for cod, haddock and saithe is a licence that entitles the holder to trawl for whitefish in the zone north of 62 degrees latitude and in the North Sea at certain times of the year. Correspondingly, a licence for shrimp and greater silver entitles the holder to fish for shrimp and greater silver. In 2022 (2021), each vessel was permitted up to four (four) quota units, including the quota connected to the vessel. The volume of fish allowed per licence unit is stipulated annually by the Norwegian Ministry of Trade, Industry and Fisheries. Moreover, transfers may be made between the different groups of vessels throughout the year, in the event that one group of vessels is not able to fish its share of the quota. This is known as «re-allocation». As of end of year 2022 (2021), one cod licence entitled the holder to fish for an annual volume of 1,154 (1,404) tonnes of cod, 465 (579) tonnes of haddock and 531 (514) tonnes of saithe in the zone north of 62 degrees latitude. When compared with the final volumes per quota, after re-allocations, in 2022 (2021), this is a change of -18% (+17%) for cod, -20% (+17%) for haddock and +3% (+22%) for saithe. During the year, the quota for both haddock and saithe was increased and some quotas were re-allocated for these species. The shrimp and greater silver licences have no limit in terms of volume.
In order to boost profitability for fisheries and reduce the number of
vessels in operation, the fisheries authorities have implemented schemes allowing for companies to merge several quota units per vessel in return for the permanent removal of vessels that have handed over their quotas from the registry of fisheries. Each vessel has one cod trawling permit, a so-called basic quota. Vessels can also have so-called structural quotas for cod trawling. In total, one vessel cannot have more than four quotas per fish species. The structural quotas have a limited duration according to the scheme in place when the quota was structured. In principle, there are two schemes for structural quotas, comprising 20 and 25 years’ duration. The new scheme for structural quotas was introduced in 2007. Structural quotas allocated before 2007 have a duration of 25 years starting in 2008, while quotas allocated after 2008 have a duration of 20 years.
The main purpose of the structure schemes is to reduce the number of vessels participating in individual fisheries, thereby facilitating improved profitability for the remaining vessels – i.e. improving efficiency within a regulated framework. Moreover, the schemes are intended to adapt fleet capacity to the basic resources. At the end of the duration of 20 and 25 years respectively, the structural quotas are no longer valid and the total quotas will be distributed among all parties in the regulation group in question, as basic quotas. Basic quotas do not have any time limits.
Lerøy Havfisk AS – and Lerøy Norway Seafoods AS to a limited extent – is involved in fishing in Norway pursuant to the provisions in inter alia the Act
relating to the right to participate in fishing and catches (Participant Act). Lerøy Havfisk AS has been given an extemption from the requirement stating that the controlling interest must be an active fisherman. The Participant Act and supporting legislation stipulate inter alia that any changes to ownership of a company that directly or indirectly owns fishing vessels requires approval by the relevant authorities. The Ministry of Trade, Industry and Fisheries’ approval of Lerøy Seafood Group ASA’s acquisition of the majority shareholding in Lerøy Havfisk AS was granted on the basis of Lerøy Seafood Group ASA’s ownership on the date of the approval. The approval also states that no new applications are required for future changes in ownership of Lerøy Havfisk AS, Lerøy Seafood Group ASA and Austevoll Seafood ASA provided that Lerøy Seafood Group ASA continues to own
minimum 60% of the shares in Lerøy Havfisk AS and that Austevoll Seafood ASA continues to own minimum 50% of the shares in Lerøy Seafood Group ASA. However, the approval does not allow for changes in ownership that result in Laco AS directly owning less than 55.55% of the shares in Austevoll Seafood ASA. Any significant changes in ownership in Laco AS also require approval. The approval also requires continuation of the prevailing terms related to permits for the vessels and structural quotas, in addition to compliance with the nationality requirement in section 5 of the Participant Act. Pursuant to the nationality requirement in section 5 of the Participant Act, operating permits can only be granted to parties that are Norwegian citizens or have status that equals Norwegian citizenship. According to the second paragraph letra a) of the provision, limited companies, public limited companies
and other companies with limited liability have equal status to Norwegian citizens when the company’s head office and Board of Directors are located in Norway, when the majority of the Board members, including the Chairman of the Board, are Norwegian citizens resident in Norway and who have lived in Norway for the last two years, and when Norwegian citizens own shares or stocks corresponding to minimum 6/10 of the company’s capital and have voting rights in the company with minimum 6/10 of the votes. Lerøy Havfisk AS, Lerøy Seafood Group ASA and Austevoll Seafood ASA are obliged to submit an overview twice a year detailing the company’s shareholders, including specification of the shares held by foreign shareholders. Ultimately, a breach of the above-mentioned licence provisions could result in Lerøy Havfisk AS losing its licence rights.
In addition to goodwill and licences, intangible assets also comprise other rights. These rights comprise the following subcategories in each segment:
All figures in NOK 1 000
With each acquisition or purchase of assets, goodwill, licences and rights are allocated to the different cashgenerating units. Each legal unit in the Group in principle comprises one cash-generating unit. Goodwill and intangible assets with an indefinite useful life are not amortised, but shall be tested for impairment at least once a year and written down if their value can no longer be justified. The management assesses the carrying value of goodwill and intangible assets with an indefinite useful life per CGU at least once a year, and more frequently if there are indications of impairment. Useful life is utilised when establishing recoverable amount.
The Group`s farming regions share the same top management, the same internal customer, and a joint optimalisation plan of i.e. slaughter plans. Further on harvest to fullfill the Groups contract sale, is done across the regions. Due to this, the Groups farming business in Norway is regarded as one CGU. The cash generating unit Farming comprises region of Northern Norway, which consists of Lerøy Aurora AS and Lerøy Aurora 2 AS, the region of Central Norway which consists of
Lerøy Midt AS and Lerøy Midt 2 AS, and the region for Western Norway which consists of the 9 companies Lerøy Vest AS, Lerøy Vest 2 AS, Lerøy Vest Kraft AS, Sjøtroll Havbruk AS, Sjøtroll Havbruk 2 AS, Lerøy Sjøtroll Kjærelva AS, Lerøy Årskog AS, Norsk Oppdrettsservice AS and Lerøy Ocean Harvest AS. The development costs related to the Pipefarm concept, capitalized in Lerøy Seafood Group ASA, a concept that the Group has been offered some licence volume on, but that the Group not yet has accepted, is also included in this CGU.
In the sub-group Lerøy Havfisk AS, each vessel with its quotas is defined as one cash-generating unit. Despite this, Lerøy Seafood Group classifies the two sub-groups, Lerøy Havfisk AS and Lerøy Norway Seafoods AS, as one joint cash-generating unit. This is justified in that, primarily, quotas are transferred between vessels via the so-called «re-allocations». Secondly, the two sub-groups are mutually dependent with a view to the industrial obligation mentioned above. In addition, the supply obligation has an impact on the two units’ codependence. On this basis, the two subgroups are assessed as one joint
cash-generating unit.
For the Group to succeed in being the first choice of the largest and most well-recognised customers, it is important to be present in the end market. Through local presence the Group can supply the freshest products, portions and packaging adjusted to local requirements and demand, and developing the seafood category even further together with the customers. The Group must also build up enough capacity to supply the volumes that the customer will need. The group has established several fish-cuts in the end markets. A fish-cut means a relatively simple processing activity in addition to the sale office, that perform some specialized value-added processing based on specification set by the customer. The fish-cuts are an integrated part of the value chain, and an important tool for efficient global sale.
The table below displays the distribution of goodwill and intangible assets with an indefinite useful life per CGU, and their sub-units. Impairment tests of goodwill and intangible assets with an indefinite useful life have been summarised below for each CGU in the segment.
The impairment test for cashgenerating units is based on estimated present values of future cash flows. The present value is compared with the book value per cash-generating unit. The present value is calculated on the basis of discounted cash flows over the next five or ten years. And for the period thereafter, a terminal value is estimated. The Gordon growth model is applied to estimate terminal value. The cash flows in the the impairment test are after tax.
The impairment test did not produce grounds for write-down of goodwill or intangible assets with an indefinite useful life in 2022. The management's calculations, were risks and opportunities within environmental sustainability are included, show that this conclusion is robust in the face of reasonable changes in conditions in the future. The critical value for the required rate of return on total assets after tax is between 8.7% and 30.5%.
The cash-generating unit (CGU) Wild catch, which was acquired in 2016, is naturally pulling down the critical value due to the fact that the assumptions that the acquisition were
based upon, have not changed much in the period from the purchase date and the date for testing. The most significant premises in the test are estimated future volume of catches per species, estimated future prices per species and required rate of return.
In farming it has historically until 2012 been a significant production growth per licence in Norway. But from 2012 and until today, there has been very limited growth. The model applied is based on actual production plans for the period until 2024. And after that an assumption of 2% growth in volume until 2027 has been applied. It is assumed no growth in the terminal value.
For the cash-generating unit Farming, the critical value for the required rate of return on total assets after tax is 18.0%. The Farming segment requires an EBIT in the terminal element of an amount of NOK 1.6 per kg. This amount is well below what`s historically achieved. The management has also carried out tests of sensitivity related to price, cost and volume. With the implemented WACC and best estimate for the terminal element, the tests show that this value is also robust in the face of changes in these parameters.
28 September 2022 the Norwegian Government proposed a new ground rent tax on farming. In the latest proposal the tax rate is35%. It is supposed to be applicable on the activity in sea. This tax will be added to the regular tax rate of 22%. However, this new additional tax has not yet been approved. But it is likely that it will be approved by the Norwegian Storting when they summon before summer 2023. This gives rise to significant uncertainty about the future. It is impossible to perform detailed impairment tests before the applicable laws and regulations are agreed upon and ready. Thus, the Group has performed tests on a more overall level, with increased tax rate. Non of these tests did indicate any impairment on intangibles in the Farming segment. This is explained by the fact that most of the Group`s intangibles has been acquired long time ago, to relative low values, seen with the eyes of today.
For the cash-generating unit VAP, Sales & Distribution, the book values are almost totally justified by the estimated profit/loss for the next five years. It is required a 0.3% EBIT margin in the terminal element, which is very low.
The book value tested below is the share of the carrying value that is not subject to amortisation.
5) The terminal value for farming is a NOK amount estimated on the basis of EBIT/kg after an explicit period (the terminal component) that gives a total value in use simular to net book value.
6) Development licences in process of beeing granted will be operated by Lerøy Vest.
7) The terminal value for VAPSD is a percentage calculated on the basis of the profit margin, after an explicit period (the terminal component) that gives a total value in use simular to net book value.
8) For Wild catch segment it is not calculated a critical value in the terminal element.
With effect from 1 January 2019, the Group implemented IFRS 16 Leases. This new standard, that replaced IAS 17, requires carrying of practically all lease agreements, as operating and financial lease agreements for the lessee are no longer to be differentiated. According to IFRS 16, the asset (right of use) and the obligation to pay lease are recognised in the financial statements.
The Group applied the modified, retrospective method for implementation on 1 January 2019. This implies that the value of the lease liability and the right of use are the same at the time of implementation. The new right-of-use assets and lease liabilities are valued at the current value of the future lease payments. For leases where the interest rate implicit for the lease can be readily determined, this rate is applied. Otherwise, the lease payments are discounted by the Group’s incremental borrowing rate, estimated to 4%. This rate is deemed as representative of all leases in the Group, as the majority are in NOK, and the Group principally makes use of the same credit institutions, which provide relatively similar terms. For leases previously classified as financial leasing according to IAS 17, the carried book value of the
right-of-use assets and lease liabilities were retained on the implementation date for IFRS 16 (1 January 2019).
The right-of-use assets are depreciated on a straight-line basis from the date of commissioning until the end of the useful life of the rightof-use asset or the end of the lease period, whatever comes first. Any extension options that may, with reasonable certainty, be exercised, are included.
The lease payments are divided into two parts: instalment and interest. The interest on the lease liability in each accounting period of the lease period shall be the amount that provides a constant periodic interest rate for the remaining balance of the lease liability (annuity principle). In the statement of financial position, the Group has chosen to present the right-of-use assets on a separate line. The lease liabilities are classified as long-term and short-term. In addition, the lease liabilities are divided into (1) lease liabilities to credit institutions and (2) lease liabilities to others. Only the lease liabilities to credit institutions are included in the calculation of the alternative performance measurements for net interest-bearing debt (NIBD). A more
detailed explanation of this classification is provided in the note relating to alternative performance measurements. The long-term share of the lease liabilities is shown on separate lines in the statement of financial position. The short-term share of the lease liabilities is included in the first-year instalment on longterm liabilities and shown on a separate line in the statement of financial position. The short-term share of longterm liabilities is specified in more detail in the note on long-term liabilities. The interest expense related to the liability is presented under net financial expense. This is specified in more detail in the note on combined items in the financial statements.
Lease costs that were previously presented as commodities and other operating expenses are now presented in the income statement as depreciation and interest expense.
In the statement of cash flows, cash payments for the lease liability’s principal (instalment) and cash payments for the lease liability’s interest are presented under financing activities. The transaction related to signing new leases has no initial effect on cash.
Right-of-use assets by groups in the notes and agreement partners
* Including translation differences
All figures in NOK 1 000
Lease liabilities
Lease liabilities is devided into long-term and short-term, and by lessor category
Instalments paid, to both credit institutions and to others, are included in downpayments of long-term debt under financing activities in the cash flow statement.
See note 15 for reconciliation.
All figures in NOK 1 000
Fixed assets
For prepayments to suppliers, the right of property is transferred to the Group on time of completion For projects in progress, the right of property is transferred to the Group based on progress
Information on estimated useful life for fixed assets is provided in paragraph (H) in the note on accounting policies. Information on mortgages for fixed assets is provided in note on loans, mortgages and guarantees. Leased assets are from 1 January 2019 included in the new group «right-of-use assets». See note on leases.
All figures in NOK 1 000
Classification
The joint ventures and associated companies in the group are listed in the table below, and each company
is allocated to operating segment. Changes during the year are also included. Net book value is recognised according to the equity method.
The companies defined as joint ventures (from 2022) are classified as material. The remaining companies are defined as associates, and they are classified as not material.
* VAPSD is short for VAP, sales & distribution (VAP = Value Added Processing)
1) Purchase of shares
2) Sale of shares
* Currency translation differences relate to translation for the sub-group Scottish Seafarms, owned by Norskott Havbruk AS, where functional and reporting currency is GBP.
All figures in NOK 1 000
Other information on joint ventures and associates considered material to the Group Information on material transactions
It has not been any material transactions with joint ventures or associates in 2022.
Information on subsidiaries
* Dormant subsidiaries are not included in this table
The accounting figures for associates, as shown below, are prepared in accordance with IFRS. The figures are based on priliminary annual accounts, as the final annual accounts are not submitted.
Information on biological assets
Norskott Havbruk AS (group) has farming operations in Scotland, and therefore has biological assets on the balance sheet. The key figures for inventory of fish in the sea for Norskott Havbruk AS group are as follows:
* Alternative performance measures (APM), presented as "pre-tax profit before fair value adjustments related to biological
are adjusted with this amount.
Considering the immaterial value of the assets, historic cost has been applied as the best estimate for fair value.
The Group recognises and measures biological assets (fish in sea) at fair value. For salmon and trout, including parent fish, a present value model is applied to estimate fair value. For roe, fry, smolt and cleaner fish, which has a limited value compared with the total stock, historical cost provides the best estimate of fair value.
The fair value of fish in the sea is estimated as a function of the estimated biomass at the time of harvest, multiplied by the estimated sales price at the same time. For fish not ready for harvest, a deduction is made to cover estimated residual costs to grow the fish to optimal harvest weight. The cash flow is discounted monthly by a discount rate. Please refer to note (I) on accounting policies for more detailed information.
Fair value adjustment recognised in the period related to biological assets comprises: (1) Change in fair value adjustment of biological assets, (2) change in fair value of onerous contracts (loss-making contracts) and (3) change in unrealised gain/ loss of financial sale and purchase contracts (derivatives) for fish in Fishpool. The last mentioned adjustment does only include Fish Pool contrants included in the balance sheet at the beginning of the year. For contracts entered into from 2020 the effective portion of change in fair value are recognized as other comprehensive income (OCI) due to cash flow hedging.
The Group enters into contracts related to future deliveries of salmon and trout. As biological assets are recognised at fair value, the fair value
adjustment of the biological assets will be included in the estimated expenses required to fulfil the contract. This implies that the Group may experience loss-making (onerous) contracts according to IAS 37 even if the contract price for physical delivery contracts is higher than the actual production cost for the products. In such a scenario, a provision is made for the estimated negative value. The provision is classified in the financial statements as other short-term liabilities. The Group also enters into Fish Pool contracts to hedge prices. The number of such contracts is limited. When utilised, the Fish Pool contracts are recorded as financial instruments on the balance sheet (derivatives), where unrealised gain is classified as other short-term receivables and unrealised loss as other short-term liabilities.
The balance sheet item is included in biological assets. The accounting line is further specified below
financial instruments. Fair value of Fish Pool contracts recognised in OCI are presented in note on financial instruments
Carrying amount of biological assets consist of
* Historical cost minus expensed mortality
Reconciliation of carrying amount of biological assets
Reconciliation of volume for stock of fish in sea in LWT (live weight in
The table below shows how the total volume for fish in the sea, live weight measured in tonnes, is distributed by weight
Deductions are also made for well boat services, slaughtering and packaging (primary processing), and transport to Oslo from the locality being measured.
Based on the above parameters, an estimated net price is calculated for
each locality, and is then included in the cash flow calculation in relation to the assessment of fair value. In connection with the sensitivity analysis conducted in the note on significant accounting estimates and assessments, an estimated average net price is applied to all sizes. This is
calculated by dividing the total estimated net sales revenue per locality by the total estimated volume (measured as slaughter weight), based on projected weight on the the date of harvest.
Description of significant cost items originating from an incident, disease or other factor related to biological assets
Accidental release in 2022
For the Group, all accidental release is taken seriously, and the Group’s target is zero accidental release. Accidental release may however occur randomly due to unforeseen incidents. All accidental releases are reported to the Directorate of Fisheries, irrespective of the scope of the accident. This applies even if only one individual has escaped. The Group has not experienced any accidental release of economic significance in 2022. The Group had 1 escape incident at Lerøy Sjøtroll where 1,560 fish escaped, and 4 incidents in connections with lice counting, where totally 8 fish escaped into the sea. In total only 1 568 individuals escaped from a total stock
of approximately 53 million individuals. In addition Lerøy Midt was involved in an incident where a well boat was the cause of an escape incident, where 8,976 fish escaped. Regardless of size, all incidents are described in the sustainability report, available at www.leroyseafood.com.
The Group defines mortality as abnormal when more than a certain percentage of the total number of fish die in the space of one month. In region West this limit is 2.5% for salmon, and otherwise 1.5%. For more detailed information, see the note on biological assets (I).
Abnormal mortality is defined as incident-based mortality, and is charged to the income statement in
the period in which it occurs. As in 2021 most of the incident-based mortality in 2022 has been caused by sea lice treatment. However, some mortality has been caused by diseases, like gill disease and CMS, together with weakness from winter wounds.
Fish health, including minimising mortality, is the cornerstone of the Group’s strategy. There positive trend in the number of sea lice treatments and related mortality, continued during first half of 2022. But in the second half of 2022, the number of sea lice treatments have increased, as well as the mortality following the treatments. The Group works continously with actions and technology to solve this challenge.
All figures in NOK 1 000
All figures in NOK 1 000
Non-current receivables
(see note 14)
Trade receivables
The Group normally invoices the agreed transaction price upon delivery of the goods. Payment is typically due within 30 - 60 days. The Group arranges for third parties to distribute the goods to the customers and carries the incurred distribution costs itself. The customers cover these costs through the agreed transaction price.
All but an insignificant part of the Group’s trade receivables are covered by credit insurance or other forms of surety. The loss deductible on credit insured trade receivables is 10%.
By the end of February 2023 94.3% of trade receivables (nominal value) had been collected, compared with 94.6% in the previous year. This represents 95.6% of book value, which is the same as previous year.
All figures in NOK 1 000
The Group has international operations and is exposed to currency risk in several currencies. Receivables are recognised at market rate on balance sheet date. Forward contracts are utilised to the greatest extent possible to eliminate currency risk related to outstanding trade receivables. See the note on financial instruments.
Other current receivables
Other current receivables are due within a year, and are classified as current assets.
31.12 by
All figures in NOK 1 000
The following principles have been used for the subsequent measurement of financial instruments in the balance sheet:
All figures in NOK 1 000
The table below shows financial instruments at 31.12 at fair value (before tax) according to valuation method. The different levels are defined as follows:
Level 1: Listed price on an active market for an identical asset or liability
Level 2: Valuation based on observable factors other than listed price (used in level 1), either direct (price) or indirect (derived from prices) for the asset or liability
Level 3: Valuation based on factors that are not sourced from observable markets (non-observable premises)
Change in fair value on financial intruments included in receivables, debt, profit and loss and OCI
The table below presents the accounting of financial instruments included in receivables and debt. The financial instruments are recognised at fair value. Depending on type of hedge, the change in fair value is booked either through PL or OCI. Each type of financial instruments is further explained below the table.
* Non-recognised hedge objects consist of binding sales contracts that are hedged (value hedges). Change in fair value on hedged risk in the hedged period is recognised through profit or loss. The change in fair value on the hedging instrument will have its opposite equal value as a short term receivable or as other short term debt, depending on positive or negative value on the instrument. Information on this will be included in either the note on receivables or other short-term debt, depending on positive or negative value in the instrument.
The value of the Norwegian krone is one of many parameters that have an effect on the Group’s competitiveness. The Group has at all times a substantial biomass in the sea that represents future sales. A significant share of the Group’s revenue is generated in currencies other than NOK. Revenue by currency is presented in the note on operating segments, and trade receivables by currency is presented in the note on receivables.
In order to minimize the currency risk the Group uses currency forward contracts to hedge both net receivables and signed sales contracts in foreign currency. The majority of the contracts have this purpose. Thus the Group recognises these currency forward contracts as fair value hedging, also for the signed sales contracts, which are off-balance items. The change in fair value on currency forward contracts and hedged foreign exchange gain/loss on firm commitments is recognized as foreign exchange gain/loss classified as cost of materials in the income statement, as it relates to the inventory cycle.
Some currency forward contracts are acquired by foreign VAPS&D entities with the purpose of reducing the currency risk related to external purchases in NOK. The Group recognize these currency forward contracts for purchase contracts as a cash flow hedge. The effective share of the change in value of the derivatives is recorded through other comprehensive income. The gross asset or liability carried is a taxable temporary difference. The change in deferred tax caused by the change in gross carrying amount is also recorded through other comprehensive income, and is therefore not included in the tax cost for the year in the income statement. When realised, the effect is charged to cost of goods.
Hedge accounting is applied for the financial purchase and sales contracts
for salmon (Fish Pool contracts). Normally, the contracts expire within one year. The fair value of the Fish Pool derivatives (gross before tax) is carried under the item for «other current receivables» when positive and other short-term liabilities when negative. The effective share of the change in value of the derivatives is recorded through other comprehensive income (cash flow hedging). The gross asset or liability carried is a taxable temporary difference. The change in deferred tax caused by the change in gross carrying amount is also recorded through other comprehensive income, and is therefore not included in the tax cost for the year in the income statement. When realised, the effect is charged to cost of goods.
Hedge accounting is applied for the financial purchase contracts for bunkers (bunker derivatives). Normally, the contracts expire within one year. The fair value of the bunker derivatives (gross before tax) is carried under the item for «other current receivables» when positive and other short-term liabilities when negative. The effective share of the change in value of the derivatives is recorded through other comprehensive income (cash flow hedging). The gross asset or liability carried is a taxable temporary difference. The change in deferred tax caused by the change in gross carrying amount is also recorded through other comprehensive income, and is therefore not included in the tax cost for the year in the income statement. When realised, the effect is charged to bunker cost, which is included in other operating expenses.
Hedge accounting is applied for interest rate swaps. Normally, the contracts expire later than one year. The fair value of interest rate swaps (gross before tax) is carried as a noncurrent asset under the accounting item for «non-current receivables» if positive, and under the accounting item for «other long term liabilities» if negative. If the agreement has a
remaining duration of less than one year, the value is entered under «other current receivables» if positive, and under «other short term liabilities» if negative. The effective share of the change in value of the interest rate swap is recorded through other comprehensive income (cash flow hedging). The gross asset or liability carried is a taxable temporary difference. The change in deferred tax caused by the change in gross carrying amount is also recorded through other comprehensive income, and is therefore not included in the tax cost for the year in the income statement.
At year-end, the Group had the following interest rate swaps
Agreement from 2020
NOK 323.438, Start 15 April 2020.
Duration 7 years, Terminates 15 April 2027, Interest rate 1.438%, in Lerøy Havfisk AS.
Agreement from 2020
NOK 323.438, Start 15 April 2020.
Duration 7 years, Terminates 15 April 2027, Interest rate 1.440%, in Lerøy Havfisk AS.
Initial hedged amount on each of the two agreements in Lerøy Havfisk AS was NOK 370,313. The amount on the interest rate swap decreases during the life time to reflect the instalments paid on the hedged debt.
The periodic interest payments related to the hedging instrument (interest rate swaps) are calculated as the difference between fixed and floating interest rate multiplied with the nominal value of the agreement. The fixed rate, expectations about the future floating rate, and the remaining life time to expiry, are the most important parameters in the calculation of the fair value. The periodic interest payments related to the hedged item (the long term loans) are calculated as the floating rate plus margin multiplied with the nominal value of the loan.
All figures in NOK 1 000
All figures in NOK 1 000
Debt is split on short-term and longterm debt. Payments that matures within 12 months from balance sheet date is presented as short-term debt.
Both short-term and long-term debt consist of interest bearing and noninterest bearing debt. Interest bearing debt is an alternaltive performance measure (APM). The figure consists of debt with the main purpose of providing financing to the group,
together with equity. The items included are specified below. It is also further described in the section about net interest bearing debt (NIBD) in the note on alternative performance measures.
For further description of the basis for classifying debt as interest bearing, see note on alternative performance measures.
Pension liabilities is considered to be long-term only, and is further described in note on pension liabilities.
Deferred tax is considered to be long-term only, and is further described in note on tax
Lease liabilities is further described in note on leases. Payment profile is described below.
Bond loans is described below.
Loans from credit institutions is described below.
Other long-term loans are loans from suppliers.
Other long-term liabilities concerns mainly non-interest bearing long term credit with supplier.
In the table below also current interest bearing debt are included.
Total interest bearing debt consists
of both long-term and short-term items. Total interest bearing debt is specified by currency below. Bank deposits are interest bearing. Net interest bearing debt (NIBD) is
defined as interest bearing debt minus bank deposits. Changes in NIBD during the year is presented in a table below. NIBD is explained in more detail in note on APMs.
The Group established 3 bond loans, each amounting to NOK 500 million, in the bond market 17 September 2021. The bonds are so called green bonds. This implies that the group have established a green financing framework which covers how the proceeds from the bond loans can be used. The framework is published on the Group`s homepage on internet.
At year end the Group has qualifying green investments that are significantly higher than the proceeds from the loan. Thus, the Group has already fulfilled it`s obligations concerning type of investments.
All three bond loans have no instalments during the duration of the loan. The loans have a duration of 5, 6 and 10 years. The loans with
duration of 5 and 6 years have floating interest rate, with 4 termins each year. The loan with a duration of 10 years, has a fixed interest rate, with one annual termin. The bond loans are measured at amortized cost. The bond loans are unsecured. Fair value is approximately the same as net book value as of 31.12.
All figures in NOK 1 000
The Group’s financial liabilities are classified according to payment profile. Classification is based on contractually agreed date of maturity. The financial liability from the interest rate swap defined as cash flow hedge is included in the estimated interest costs on the hedged item.
The book value of long-term debt approximates fair value. There are no significant new loan charges that are not amortised over the life of the loan.
The Group's main borrowing conditions ("covenants") in the different loan agreements are to maintain an equity ratio of at least 25% and at least 30%. When calculating the equity ratio,
the balance sheet value is adjusted for bank deposits and deferred tax associated with licences. There are also some capital adequacy requirements in some of the subsidiaries that are all 30% or lower. Finally, there are requirements regarding a so-called "borrowing base" in Lerøy Midt AS, Lerøy Vest AS and Sjøtroll Havbruk AS for the short-term overdraft facilities. More specifically, this means that the utilisation of the facility must not
exceed a certain level of one or more accounting lines. In this case the relevant accounting lines are inventory, trade receivables and other receivables.
None of the Group companies has entered into a position where they have become in breach of their covenants in 2022.
All figures in NOK 1 000
As an alternative to direct investment, the Group has in some few cases accepted to guarantee on behalf of third party liabilities. The specific guarantees are on behalf of fishermen, that deliver Wild catches to the Group.
All figures in NOK 1 000
All the Norwegian companies in the Group satisfy the requirements in the Act relating to mandatory occupational pensions (Norwegian: OTP). The schemes are mainly established as defined contribution pension schemes. Most of the benefit shemes have been replaced with
contribution shemes together with a paid-up-policy to the previous members. The remaining net liabilities are calculated based on common actuarial assumptions. In addition some companies within the group have some small unsecured schemes which are financed by
operations. These schemes are considered to be immaterial regarding further disclosure in the notes. Information on the pension cost for the year is also provided in the note on payroll costs.
All figures in NOK 1 000
Tax on the Group's pre-tax profit deviates from what it would have been if the Group's weighted average tax rate had been applied. The difference is determined as follows:
* Negative temporary differences that cannot be eliminated against positive temporary differences. Deferred tax asset is presented as a negative amount.
Capitalised deferred tax assets derive mainly from loss carry forwards in foreign entities where the loss is expected to be able to be utilised within a reasonable time. The applicable tax rates vary from 21% to 44%. Capitalised deferred tax liabilities derive mainly from Norwegian entities, where a rate of 22% has been applied.
The Norwegian government has proposed introducing a resource rent tax of 35%, on top of ordinary tax, on the Norwegian aquaculture operations in sea. As of today’s date, the proposal has not been passed. It is expected to be passed before the summer, but the final rules are unclear. The final rules could affect the allocation
between deferred tax and tax payable as of 31 December 2022, in the Group`s Norwegian tax entities with aquaculture operations in sea.
All figures in NOK 1 000
Accrued other expenses includes freight, claims, treatment expenses on fish in sea, clean up costs for closed sites, bonuses and various other operational and inventory related costs. Accrued freight on products sold is the the largest single item.
All figures in NOK 1 000, with exception of earnings per share
Earnings per share since the date of listing
* The amounts are adjusted with the LSG`s shareholders (controlling interests) share of fair value adjustment related to biological assets. The adjustment is after tax. Included in the adjustment is also the Groups’ share of such adjustments from associates (after tax). Earnings per share before fair value adjustment is an Alternative Performance Measure. For calculation see note on APM`s.
All figures in NOK 1 000, with exception of dividend per share
Distributed dividend in current financial year
Distributed dividend in 2022, based on 2021 profit, was NOK 2.50 per share. This amounts to NOK 1 489 434.
Recommended dividend
Based on the 2022 profit, a corresponding dividend of NOK 2.50 per share is recommended for distribution in 2023. This amounts to NOK 1 489 434. A final decision will be made by the general meeting on 23 May 2023.
Dividend per share since the date of listing
The share capital consists of
Lerøy Seafood Group ASA had 22,698 shareholders at 31 December 2022. The corresponding number at year end 2021 was 19,056. All shares confer the same rights in the company. End of 2022 it was 604 foreign shareholders. The corresponding number at year end 2021 was 566. End of 2022 foreign shareholders owned 139,783,088 shares in total, representing 23.4% of the total capital. Corresponding numbers at year end 2021 was 181,781,544 shares, representing 30.5% of the total capital.
All figures in NOK 1 000
Shares owned by members of the Board and their related parties
Chairman of the Board Arne Møgster and Board members Britt Kathrine Drivenes and Karoline Møgster have indirect ownership in Lerøy Seafood Group ASA through the parent company Austevoll Seafood ASA. Arne Møgster and Karoline Møgster own their shares through the ultimate parent company Laco AS.
Board member (employees’ representative) Hans Petter Vestre owns 1,200 shares in Lerøy Seafood Group ASA at year end, which is the same number as the previous year.
Shares owned by the Executive Management and their related parties
The Chief Operating Officer for VAPSD has also indirect ownership in Lerøy Seafood Group ASA through the parent company Austevoll Seafood ASA, where he owns 552 shares.
All figures in NOK 1 000
Remuneration of board members totalled NOK 1 567 in 2022 (equally distributed). The remuneration in 2021 was NOK 1 250. The number of Board members has been reduced from 7 to 6 persons during 2022.
Remuneration of the nomination committee is unchanged compared
to the previous year, and amounts to NOK 135 in 2022. As for the members of the Board, the remuneration per member is equally distributed.
Remuneration of the audit committee is increased compared to the previous year, and amounts to NOK 230 in 2022, compared to NOK 170
in 2021. The remuneration per member is equally distributed.
A description of the main principles for the company`s salary policy is included in the Board of Directors’ statement regarding salary and other remuneration of executive personnel.
All figures in NOK 1 000
Mandates are granted to the Board of Directors in accordance with the Public Limited Companies Act (Norway), cf. in particular chapters 8, 9 and 10 of the Act.
The first time the Board was authorised to acquire the company’s own shares was at the ordinary general meeting on 12 May 2000. This mandate has been replaced with a new mandate at the ordinary general meeting on 23 May 2022. The mandate remains valid for 18 months from the date on which the resolution was adopted. The Board has authority to acquire up to 50 million shares, each with a face value of NOK 0.1. The lowest price to be paid is NOK 1 per share, and the highest price per share is NOK 100. The mandate has not been exercised in 2022. Renewal of the mandate will be recommended to the general meeting on 23 May 2023.
The Board has authority to increase the share capital by up to NOK
5,000,000 by issuing up to 50,000,000 shares in Lerøy Seafood Group ASA, each with a nominal value of NOK 0.1, through one or more private placings with external investors, employees and some of the company’s shareholders. This type of mandate was first established by the ordinary general meeting of 4 May 1999 and subsequently renewed by the ordinary general meeting on 23 May 2022, and is to remain valid for 24 months from the date on which the resolution was adopted. The mandate was not exercised in 2022. It will be recommended that an equivalent mandate be approved by the ordinary general meeting on 23 May 2023.
The Board’s powers to distribute shares has a maximum validity exceeding a year, and are not limited to only certain expressed purposes as recommended in the NUES. This is mainly for operational reasons, but also in order to clearly show that the company is growth oriented and that shares are regarded as an important means of payment. This practice is established
to ensure an optimum strategic business development for the company. However the Board has established the practice of having the mandates renewed at each ordinary general meeting.
No loans have been granted to the CEO, Chairman of the Board or other related parties. No single loan or guarantee to employees has been granted for more than 5% of the company’s equity.
Auditor
The Group auditor is PricewaterhouseCoopers AS. Fees invoiced from the Group auditor also include the law firm PricewaterhouseCoopers AS and other PricewaterhouseCoopers companies abroad. The auditing fee for the Group’s auditor specified below is the agreed fee for the audit of the present year. Other fees concern services received during 2022, and have been as follows:
Other services paid to group auditor for other services in 2022 consists of, among others, ESG related audits,
various legal and tecnical advice, HR related services, assistance related to establishment of framework for
ESG reporting, and other.
All figures in NOK 1 000
Net financial items
* Currency gains and losses related to purchases and sales are presented as a part of the accounting line for cost of materials.
Net currency gain in 2022 is NOK 58.0 million. In 2021, net gain was NOK 75.2 million.
Assets and liabilities in foreign enterprises are converted to Norwegian krone according to the exchange rate on balance sheet date. Revenues and expenses from foreign enterprises are converted to Norwegian krone according to the average exchange rate. Translation differences are charged to comprehensive income.
In the event of a disposal of a foreign enterprise, the relevant accumulated translation differences allocated to the parent company’s owners are reversed over the income statement. The disposal of a foreign enterprise may take the form either of a whole or partial sale of a subsidiary, joint venture or associate. When selling shares in a subsidiary without losing
control, the relative share of the translation difference is transferred to non-controlling interests in the equity statement. For other sale of shares without the loss of joint control or significant influence, the relative share of the accumulated translation difference is reversed over profit or loss.
Lerøy Seafood Group ASA is a subsidiary of Austevoll Seafood ASA, which in turn is a subsidiary of Laco AS. Laco AS is the ultimate parent company. Transactions and intercompany accounts with other Group companies in the Laco AS corporation, not covered by Lerøy Seafood Group ASA, are classified as transactions and intercompany
accounts with related parties. The same applies to associates of the above.
Associates owned by Lerøy Seafood Group, and non-controlling interests in subsidiaries, are also classified as related parties.
In addition, any companies owned by
employees, in particular senior executives, are classified as related parties. No transactions of significance between such companies have been identified.
and intercompany accounts with associates and other identified related parties of Lerøy Seafood Group ASA are as follows:
NCI means "non controlling interests"
Dividend received from associated companies is specified in the note on associated companies
The capital in the associated company Norskott Havbruk AS has been increased with NOK 305.5 million. See note on associates in annual financial statements for the group.
Lerøy Seafood Group ASA acquired Lerøy Årskog AS from the ultimate parent company Laco AS for NOK 38.9 million. The transaction was carried out after arm lenght principle.
The transaction is further described in the Group note on acquisitions.
All figures in NOK 1 000
NCI means "non controlling interests"
Dividend received from associated companies is specified in the note on associated companies
Lerøy Seafood Group (Lerøy Vest AS) leases wellboats from Seistar Holding. The leases are recognised in the accounts according to IFRS 16, where leases with a lease period more than one year, is capitalised. The net book value of the right-to-use assets as of 31 December 2022 (2021) is NOK 242.5 million (NOK 287.0 million). The net book value on the lease liability is NOK 257.7 million (NOK 299.4 million). These amounts are not included in the table above. Repayment and interests on capitalized leases with Seistar Holding amounted to NOK 180.8 million (NOK 153.0 million), and are incuded in the table above as purchases.
On 28 September 2022 the Norwegian government published a consultation draft concerning the introduction of resource rent tax on Norway’s aquaculture industry. Lerøy Seafood Group submitted its consultation response ahead of the deadline on 4 January. Approx. 400 stakeholders submitted consultation responses, a significant majority of which took a negative view of the proposal. The government showed little inclination to listen to the responses and on 28 March 2023 published Proposition to the Storting 78 LS – Resource rent tax on
aquaculture, which proposes introducing a resource rent tax of 35%. This would be in addition to ordinary corporation tax of 22% and would apply to the Norwegian aquaculture operations in sea. The government’s resource rent tax proposal is expected to be passed by the Storting by July 2023. It is difficult to comment on a proposal that is the subject of political negotiations and has not yet been finally adopted. If the proposal is passed, it will affect the Group’s profit after tax and cash flow for 2023. Lower cash flow will impair the Group’s investment capacity and long-term development potential.
The 19 April 2023 Lerøy Seafood Group ASA completed 3 new senior unsecured green bond issues. The three bonds, each of NOK 500 million, has tenors of 5, 7 and 10 years, respectively. The bonds have coupons of 3m NIBOR + 1.50% p.a for the 5 year tranche, fixed rate of 5.10% p.a for the 7 year tranche and a fixed rate of 5.315% p.a for the 10 year tranche.
On 20 February 2019, the EU competition authorities (“the EU Commission”) started an investigation into suspected anti-competitive practices in the salmon market. Lerøy Seafood Group ASA is one of the companies named in the case. It is unclear precisely what form the EU Commission believes any collusion may have taken, when it may have occurred and what negative consequences it may have had. Lerøy Seafood Group ASA is providing the authorities with every assistance in the case.Procedures in this type of case normally continue for several
years, and it is as yet too early to say whether the case may lead to sanctions or other negative consequences for the companies involved. As regards the investigation opened by the US Department of Justice (DOJ) into the Norwegian salmon industry in November 2019, Lerøy Seafood Group ASA was informed in January 2023 that the investigation has been closed.
In the wake of the EU Commission’s ongoing investigations, several Norwegian-owned aquaculture companies, including companies in the Lerøy Seafood Group, have been sued by customers in the USA and
Canada. The Group believes these claims to be groundless, but due to factors such as significant litigation costs in the USA and commercial reasons, the Group chose to settle the two US class actions in 2022. The settlements in no way represent any admission of liability or wrongdoing. Lerøy Seafood Group has expensed NOK 209 million as litigation costs in 2022. This amount includes fees to lawyers. Most of the amount has been settled and paid as of 31 December 2022. Reference is also made to stock exchange notice made on 25 May 2022 and the quarterly report for the second quarter of 2022.
Increased requirements for information on non-financial matters were included in the EU Accounting Directive by means of an amendment directive adopted by the EU in 2014, referred to as the “Non-Financial Reporting Directive” (NFRD). The NFRD requires large corporations to prepare a statement providing consistent and comparable information on sustainability, comprising the environment, social factors and working conditions, respect for human rights and efforts to combat bribery and corruption. The first set of guidelines for enterprises for how to implement the NFRD were published in 2017. In 2019, the EU also adopted and published guidelines for reporting of climate-related information. These guidelines were incorporated into the recommendation for reporting of climate-related risk from the “Task Force on Climate-related Financial Disclosures” (TCFD), as a supplement to the guidelines from 2017. The TCFD recommends that enterprises and investors report their methods for taking climate-related risk into account in strategy processes, and how risk is identified, measured and controlled. The NFRD is now incorporated in Norwegian legislation via the Statement of Social Responsibility, where the TCFD is a part of the reporting requirement. The Group complies with the above.
Our planet will soon be home to eight billion people, and they need food every day. Not all food can be harvested from nature’s own resources. Most food products today require some form of production. And we all know that production, including food production, has a certain climate footprint. In our efforts to reduce the risk of global warming bringing temperatures in excess of that which our planet can tolerate, it is essential to keep our climate footprint to an absolute minimum. This is a shared responsibility, and every person and company must evaluate possible measures they can take, then adapt their behaviour accordingly – if we are to achieve our goal of reducing rising temperatures to a minimum.
These measures may be voluntary or mandatory. The authorities have a certain extent of control over the speed of the change-over to a low-emissions society, and do so by implementing regulations. However, which measures can be implemented and when will be determined by available technology and economy. In an effort to prevent economic factors from obstructing developments, the authorities have introduced a number of regulatory measures, including fees. The scope of these regulatory measures and fees related to greenhouse gas emissions is expected to increase in the future.
The transition to a low-emissions society will come at a cost. The development of and investments in low-emissions technology will require significant capital. At the same time, failing to adapt will also come at a cost and could, in the long term, make it impossible to continue operations. A company's ability to adapt in this context will become similar to a “licence to operate”.
Climate risk implies a financial risk in two areas. Firstly, climate risk involves uncertainties surrounding physical climate change (physical risk) caused by global warming. Secondly, climate risk involves the transition to a lowemissions society, to be achieved via measures and technological developments (transition risk). The company will be affected by both the above. Both the consequences of global warming and mandatory measures to limit climate change will represent a cost for the company.
Not only will there be a major focus on how the Group's operations affect the climate, it is also essential that the Group understands how climate change may affect Group operations, including the financial impact on Group income, costs and investments. Having a strategy adapted to identified climate risks will help us reduce these costs. At the same time, the transition to a low-emissions society could bring new opportunities for earnings.
The Group has therefore invested significant efforts in this area in recent years. The Group has established efficient processes for the identification, management and monitoring of climate risk. This process has been fully adopted by both the Board of Directors and management. The Group’s goal is to be the world’s most efficient value chain for sustainable seafood. The Board of Directors has therefore committed to this process by establishing ambitious environmental goals, which are also incorporated into the company’s strategy, for a reduction of 46% in greenhouse gas emissions from the Group's value chain by 2030. The Group also aims to achieve climate neutrality by 2050. This requires making sound decisions with a view to the environment in daily operations and investment decisions. The Group has introduced several projects involving internal communications, acceptance and training to ensure that all employees are aware of how each of us can help reduce greenhouse gas emissions from daily operations. Suppliers are also required to contribute to the reduction of their emissions, if they want to continue as suppliers to the Group. This process will naturally take some time as the Group has numerous suppliers, and will require charting and changes in agreements before any quantifiable results are achieved. The Group has already agreed on commitments with many suppliers regarding reductions in emissions. When selecting new suppliers, environmental factors are a critical parameter in agreements.
The Group's impact on the environment and climate is continuously monitored and periodically reported, both internally and externally. For more detailed information and figures showing the Group’s impact on the environment and climate, please refer to the Group's sustainability library at www.leroyseafood.com. The Group's TCFD report includes a detailed risk analysis. The TCFD report is updated once a year, and new updates are expected to be completed and published at the end
of May 2023. The main conclusions are summarised below, in total and per segment.
The Group has assessed its climate risk involved in operations, in terms of both physical risk and transition risk. The Group has not incurred any significant costs in 2022 as a result of the impact of climate change. Neither has the Group identified climaterelated incidents in 2022 or risk indicating the need to re-estimate the service life or residual value of the Group's assets. For a detailed assessment, please refer to the Group's TCFD report. The main conclusions are summarised below.
The Group's fisheries are mainly conducted in Norway’s northernmost waters. Extreme weather is primarily the greatest physical risk involved in this activity. If the weather is too extreme, the Group's fishing vessels may not be able to carry out fisheries. If this were to occur during the high season, the vessels might not be able to catch their full quota for certain fish species within the quota season. This would have a knock-on effect on the processing industry on shore. Extreme weather would imply that the shore-based industry would not receive delivery of the raw materials required for production of finished goods, in turn negatively affecting earnings throughout the entire value chain. The risk of extreme weather significantly impairing Group earnings is assessed as low. Changes in temperature are also thought to represent a physical risk. Research supports the claim that an increase in ocean temperatures can bring changes in both migration routes and spawning patterns for different fish species, resulting in changes in where we can fish for the different species. This could complicate the processes of establishing and distributing quotas between fishery nations. In the Group's assessment, the risk of significantly impaired earnings caused by the above is low in the short to medium term. In the
long term, this risk could increase and must be monitored carefully. Transition risk has also been identified for this segment. The transition from fossil energy carriers to renewable energy may cause a fall in the value of capital stock, in turn affecting the Group economically. This value impairment could occur via increased fees for the use of the trawler fleet, regulatory requirements on the types of propulsion systems permitted and, to a certain degree, reputation risk associated with the use of fossil fuels. The Group takes active efforts to reduce greenhouse gas emissions by making use of the best technology available and making contributions to technological developments. The Group participates in DnV’s Green Shipping Programme, where participants have a common goal to uncover new environmentally friendly technology. Among the projects under assessment are use of nitrogen and ammonia, with the potential to reduce greenhouse gas emissions from the largest vessels. There currently remains a high level of uncertainty about the use of these types of fuel in relation to the safety of persons onboard and the lack of available capacity for bunkering of these fuel types along the coast. For the time being, we have a wait-and-see approach with regards our choice of technologies. We do, however, feel confident that good solutions will be available in the relatively short term. In the short and medium term, there are therefore no alternative propulsion systems that can be used for commercial fisheries in the north. Based on the estimated remaining service life of our fleet, and the Group's depreciation plans, the Group has not identified any indications of impairment of either licences nor fixed assets. Consumers are expected to increasingly demand food with a lower carbon footprint in the future. Wild-caught whitefish already has a low carbon footprint. The Group has implemented several measures to reduce this even further. These comprise an increase in freezer capacity on-board, so that the fleet can spend more time at sea fishing,
with fewer trips to and from shore. Also delivery to Norwegian stations help reducing pollution when compared with transporting raw materials to low-cost countries for further processing. Based on these measures, the Group is of the opinion that reputation risk in this segment is low. In the Group's assessment, the risk of a fall in demand for our products, resulting in value impairment of our stock, is very low. Neither has the Group identified any climate risk for trade receivables.
The Group’s farming operations take place along the coast of Norway and are divided into three regions: West, Central and North Norway. For the Farming segment, extreme weather is also seen as the greatest physical risk. Most of the segment’s operations take place offshore, and extreme weather could make work on the facilities difficult and increase the risk of damage to production equipment. The risk of damage could also increase the risk of escapes. Extreme weather could also have an indirect impact. Around 70% of current raw materials for fish feed are vegetable. If temperatures change, the conditions for cultivating these raw materials may change, and this could become critical if alternatives are not found. Scenario analyses also indicate that rising sea temperatures are a longterm risk that requires monitoring. Although the rise in temperatures is slow, it could have negative economic consequences in the longer term. The Group does expect an increase in biological challenges involving lice infestation, disease, algae and possible new foreign species. Measures required to protect the Group against such changes represent an increase in costs. Rising sea temperatures are also expected to result in more extreme weather. The physical risk associated with aquaculture is still seen as low both in the short, medium and long term. Transition risk for this segment is also assessed as low. Raw materials for fish feed are the largest source of greenhouse gas emissions for this
segment. Around 80% of our emissions originate from fish feed. The Group collaborates with the fish feed suppliers with a view to developing new ingredients that can be used as raw materials for feed, in turn reducing emissions. The segment has also made considerable investments in recent years in green technology, most notably the transition from fossil fuel to electric propulsion for their work and service boats. The same applies to the feed barges, now more and more powered by land-based power. A new land based power station for well boats has recently been installed at Lerøy Midt`s facility at Jøsnøya. As a result, the risk of the Group having new climate-related measures imposed with substantial economic significance is seen as low. Licences, the Group's largest asset and which do not depreciate, are assessed for impairment every year. This assessment implicitly takes climate risk into account. The value of licences depends on having a certain amount of cash flow. Both volume and price are very important parameters in this model. The greatest risk involves prices. A fall in the customer’s willingness to pay, due for example to loss of reputation, could represent a challenge for values. As with wild catches and whitefish, the reputation risk related to the climate is considered to be low, as aquaculture has a very low carbon footprint per kg produced food when compared with other sources of protein. The same assessment is carried out for fixed assets and inventories.
The VAPS&D segment comprises processing, sales and transport. Extreme weather in the form of strong winds, substantial rainfall, flooding, drought and fires could cause damage to both factories and key infrastructure. This could potentially have a major impact directly on Group operations, but also indirectly via our supplier chain, as successful logistics are essential in order to maintain normal operations. The Group's factories are located in areas that, to date, have not been seen as particularly exposed to physical climate risk. There are no
indications that this situation has changed. In terms of transport, the Group makes use of external suppliers. As the Group’s main market is the EU, most products are transported by road. The Group therefore has a high degree of flexibility in terms of any adaptations required as a result of climate-related incidents, such as flooding or fires.
Transition risk for this segment is, in total, seen as low. However, transition risk is higher within certain areas for this segment. Our second largest source of CO2 emissions is currently air transport to overseas markets. Emissions from road transport are relatively low. The risk of new regulations relating to air transport is therefore higher. Increased fees or, in the worst-case scenario, a ban on air transport, would have major consequences for sales to these markets. Nonetheless, the Group's main markets are in Europe, and products for these markets are transported by road. The Group collaborates with transport suppliers to reduce greenhouse gas emissions, from both air transport and road transport. The Group has introduced transport of fillets of fish instead of whole fish, providing a significant reduction in pollution per kg of finished product transported, and is working on different refrigeration solutions for transport. In recent years, the Group has also made substantial investments in measures to reduce energy consumption in its factories. Moreover, the Group has facilitated logistics solutions that will allow sea transport to Europe as an alternative to road transport. In the future, this could possibly be extended to cover overseas markets. The risk of changes in regulations, bringing requirements for substantial new investments in this area, or that would have a significant economic impact on the Group, is therefore seen as low. Practically all the Group's transport services are outsourced. The Group therefore has no means of transport on their balance sheet that could be subject to impairment. When it comes to factories, the Group is of
the assessment that they are in relatively safe locations. Given the fact that the Group has already made good headway with measures to save on energy consumption, the transition risk for this segment is seen as low. In relation to reputation risk for this segment, the same assessments as for other segments are applied.
Parent company financial statements consist of Income statement
Balance sheet
Statement of cash flows
Notes to the parent company financial statements
Overview of the notes to the parent company financial statements
Note 1
Note 2
Note 3
Note 4
Note 5
Note 6
Note 7
Note 8
Note 9
Note 10
Note 11
Note 12
Note 13
Accounting policies
Equity
Transactions and balances with subsidiaries and associates
Intangibles and fixed assets
Shares in subsidiaries
Shares in joint ventures, associates and others
Other receivables
Loans, mortgages and guarantees
Interest rate swaps
Taxation
Payroll costs, number of employees, remuneration, loans to staff, etc.
Items that are combined in the financial statements
Related parties
All figures in NOK 1 000
All figures in NOK 1 000
Bergen, 28 April 2023
Board of Directors of Lerøy Seafood Group ASA
The financial statements have been prepared according to the regulations of the Accounting Act of 1998 and good accounting practice. All figures in the notes to the accounts are in NOK 1,000.
Revenue is booked when earned. Sales of goods and services are therefore normally booked at the time of delivery. The operating revenues derives from fees from shared services delivered to group companies.
Current assets and short-term debt comprise normal items due for payment within one year after balance sheet date, and items related to the circulation of goods. Other items are classified as fixed assets/long-term debt.
Current assets are valued at the lowest of acquisition cost and fair value. Short-term debt is carried at nominal amount at the time it is established.
Fixed assets are valued at acquisition cost, but are written down to fair value when the fall in value is not expected to be temporary. Long-term debt is carried at nominal amount at the time it is established.
Trade receivables and other receivables are carried on the balance sheet at nominal amount after deduction of provision for bad debts. Provision for bad debts is made according to individual assessments of the individual receivables.
Short-term investments (shares and units classified as current assets) are valued at the lower of average acquisition cost and fair value on the balance sheet date. Dividends and other distributions received from the companies are booked as Other financial revenues.
Long-term investments (shares and units classified as fixed assets) are booked in the balance sheet at acquisition cost. The investments are written down to fair value if a decline in value is not considered to be temporary. Dividends and other distributions received from the companies are booked as Other financial revenues.
Subsidiaries are companies in which the Group holds an controlling interest. This is the case for companies in which the Group holds an interest above 50%. In the company financial statements, the subsidiaries are valued according to the cost method.
Associates are companies in which the Group holds an interest of 20-50%, and where the investment is longterm and strategic. In the company financial statements, the associate are valued according to the cost method.
Fixed assets are booked in the financial statements at acquisition cost less accumulated depreciation. This depreciation is distributed linearly over assumed economic life. Similar policies apply to intangible assets.
(I)
Tax payable in the income statement includes both the tax payable during the period and changes in deferred tax. Deferred tax is calculated at a rate of 22% on the basis of the provisional differences that exist between accounting and taxable values, as well as the assessed deficit to be carried forward at the end of the financial year. Temporary tax-increasing and tax-decreasing differences, which reverse or may reverse the figures in the same period, have been offset and booked at net value.
Hedge accounting has not been applied on the interest rate swaps in Lerøy Seafood Group ASA. The interest rate swaps are measured at fair value, and the change in value is recognised in the profit and loss statement as a financial item.
(F)
The financial statements are presented in NOK, the functional currency for the company. Cash items in foreign currency are valued at the respective rates of exchange at the end of the financial year. See also item (V) in the consolidated accounts on derivatives, including currency forward contracts utilised to control currency risk.
All figures in NOK 1 000
Dividend
The Board of Directors will propose that the Annual General Meeting adopts a dividend payment of NOK 2.50 per share.
Number of shareholders
Lerøy Seafood Group ASA had 22.698 shareholders as per 31 Desember 2022. All shares confer the same rights in
the company. An overview of share capital and the 20 largest shareholders are shown in the note on shareholders for the Group.
Treasury shares
Lerøy Seafood Group ASA owns 297,760 treasury shares of a total number of 595,773,680 shares. The ratio of treasury shares is 0.05%. The
purchase price paid for treasury shares is split into two different categories, where nominal value of treasury shares is included in “paid in capital” (- NOK 30,000), and the purchase price exceeding nominal value of treasury shares (- NOK 2,389,000) is included in “other equity”. The average purchase price of own shares is NOK 8,12 per share.
All figures in NOK 1 000
Intragroup contributions received from subsidiaries
For specification see table above in this note under headline Income from investments in subsidiaries
All figures in NOK 1 000
The intangible assets consists of capitalized expenses related to development-licences based on the concept "Pipefarm". The project, and Lerøy Seafood Group ASA, has been awarded with a volume of 1350 MTB. The company is still in the process of deciding on whether the awarded volume should be accepted or not,
and the project should be developed further. The development-licences have a definite life time of 5 years from date of acceptance, but on expiry date it will be subjected to renewal and tranformation to an ordinary grow-out licence on request, for a fee amounting to NOK 10 million per licence equivalent (780 MTB). Depreciation
will start after the award process is completed.
Due to the fact that the project is still not completed, and some uncertainty attached to the project, the management has decided to expense further project costs until the project is finally completed.
Leases not recognised in the balance sheet
beginning December 2018, with an option for additional 10 years. Annual expensed rent amounts to NOK 12 million. Financial information 207
Leases wiht other than credit institutions are regarded as
All figures in NOK 1 000
Changes in subsidiaries and ownership during the period
* These companies have been merged into Lerøy Norge AS in 2022
** The date for establishment. The companies were a part of the "old Lerøy-group" before LSG ASA was established in 1995
Companies that has changed its name in 2022
Laks- & Vildtcentralen AS has changed its name to Lerøy Norge AS
Seafood Danmark A/S has changed its name to Lerøy Seafood Denmark A/S
Shares in subsidiaries are valued based on the cost method. As a consequence subsidiaries with weak performance, receiving group contributions or increased equity, will obtain a higher net book value. Over
time this may result in net book values (before impairments) higher than it would have been by adapting the equity method. Due to this, all shares in subsidiaries that had a higher value (based on the cost method)
compared with the equity method, have been impaired. The impairment will be reversed in a later period when the reason for the impairment is no longer present.
All figures in NOK 1 000
Norskott Havbruk AS and Seistar Holding AS are joint ventures. The other companies are associates. For further information about joint ventures and associates, and value according to equity method, see note on joint ventures and associates in the consolidated financial statements.
Lerøy Seafood Group ASA has committed a total of NOK 10 million related to the investment in DNB Private Equity.
All figures in NOK 1 000
Loans to others are mainly to the company Fiizk Digital AS (previously named Infront-X Solutions AS), amounting to NOK 19,715. The loan, which originally should have been settled, has been extended, and it is currently worked with a new plan for
repayment. Due to this the loan has been reclassified to non-current assets. The debitor is a R&D company within programming, whitch currently is developing a software that Lerøy Seafood Group finds interesting. Lerøy Seafood Group
consider the company to be well positioned for future profits. The value of the loan is considered to be existent. The loan is convertable, and can fully or partly be converted to shares at a later stage.
All figures in NOK 1 000
The Group established 3 bond loans, each amounting to NOK 500 million, in the bond market the 17 September 2021. The bonds are so called green bonds. This implies that the group have established a green financing framework which covers how the proceeds from the bond loans can be used. The framework is published on
the Group`s homepage on internet. At year end the Group has qualifying green investments that are significantly higher than the proceeds from the loan. Thus, the Group has already fulfilled it`s obligations concerning type of investments.
All three bond loans have no installments during the duration of
the loan. The loans have a duration of 5, 6 and 10 years. The loans with duration of 5 and 6 years have floating interest rate, with 4 termins each year. The loan with a duration of 10 years, has a fixed interest rate, with one annual termin. The bond loans are measured at amortized cost. The bond loans are unsecured.
Lerøy Seafood Group ASA issued 3 bond loans in 2021. At year end these loans were the only loans in the in
the parent company. These loans are unsecured, and they have a financial covenant were the issuer shall ensure that the Group, on a consolidated
basis, maintains an equity ratio of minimum 30%. Lerøy Seafood Group ASA has the same type of covenant on the undrawn liquidity reserves.
The mortgage loans to credit institutions are settled. But the pledged assets are still pledged as security for the overdraft loan facility. The overdraft facility is undrawn, and there is no debt to the credit institution at year end.
Lerøy Seafood Group ASA has posted a guarantee of NOK 30,000 for Lerøy Aurora AS in favour of Innovasjon
Norge. Lerøy Seafood Group ASA has also posted a guarantee of NOK 2,100 in favour of VPS/Nordea.
Lerøy Seafood Group ASA also has joint and several liability for outstanding VAT together with Lerøy Seafood AS, which is included in the joint VAT registration.
Other commitments
Lerøy Seafood Group ASA has entered into a 10 year rental agreement for
the office facilities, which started to run from November 2018, with an option for aditional 10 years. Annual minimum rent is approximately NOK 12,000. Lerøy Seafood Group ASA has also committed a total of NOK 10,000 related to the investment in DnB Private Equity.
Restricted funds included in bank deposits equals to NOK 6,002.
NOTE 9
Interest rate swaps
applied as fair value. Fair value is basically the difference between floating rate and fixed rate, that will be paid from 31 December and until expiry date. Notes 214 All figures in NOK 1 000
the second swap expired in 2022. There are no remaining interest rate swaps as of 31 December 2022. The market to market value on the interest swap agreements as of 31 December that comes from DNB, has been Interest rate swaps Agreement 1 Agreement 2 Total Nominal amount 500 000 500 000 1 000 000 Start date 17.11.2011 17.01.2012 Expiry date 16.11.2021 16.01.2022 Duration 10 years 10 years Agreed fixed/average interest rate 3.55 % 3.29 % 3.42 % Book value 01.01.2021 Fair value of interest rate swaps as of 01.01 -14 014 -15 279 -29 293 Deferred tax related to the interest rate swaps, 22% 3 083 3 361 6 444 Net (negative) value after tax, as of 31.12 -10 931 -11 917 -22 848 Changes in 2021 booked through profit and loss Change in fair value of interest rate swaps in 2021 14 014 14 702 28 716 Change in deferred tax related to the value change in the period, 22% -3 083 -3 234 -6 317 Changes booked through profit and loss 10 931 11 467 22 398 Book value 31.12.2021 Fair value of interest rate swaps as of 31.12 0 -577 -577 Deferred tax related to the interest rate swaps, 22% 0 127 127 Net (negative) value after tax, as of 31.12 0 -450 -450 Interests on interest swap agreements 2021 Floating rate interests 1 470 2 019 3 489 Fixed rate interests 15 610 16 450 32 060 Net paid 14 140 14 431 28 571 Changes in 2022 booked through profit and loss Change in fair value of interest rate swaps in 2022 577 577 Change in deferred tax related to the value change in the period, 22% 0 -127 -127 Changes booked through profit and loss 0 450 450 Book value 31.12.2022 Fair value of interest rate swaps as of 31.12 0 0 0 Deferred tax related to the interest rate swaps, 22% 0 0 0 Net (negative) value after tax, as of 31.12 0 0 0 Interests on interest swap agreements 2022 Floating rate interests 0 188 188 Fixed rate interests 0 766 766 Net paid 0 578 578 Lerøy Seafood Group I Annual report 2022
All figures in NOK 1 000
All figures in NOK 1 000
All figures in NOK 1 000
For a specification of remuneration of senior executives in Lerøy Seafood Group ASA, see note on payroll expenses in the consolidated financial statements. The Chairman of the Board was until 23rd of May 2023, in addition to the role as Chairman of the Board, also hired as a consultant from Laco AS. Lerøy Seafood Group ASA has been invoiced by Laco AS for
the role as Chairman of the Board and for the role as a consultant. In 2022 NOK 0.5 million of the total invoiced amount of NOK 3.3 million concerns approved remuneration for the role as Chairman of the Board. In 2021 NOK 0.4 million of the total invoiced amount of NOK 5.1 million concerns approved remuneration for the role as Chairman of the Board.
Auditor Fees from the Group auditor PricewaterhouseCoopers AS, the law firm PricewaterhouseCoopers AS and other foreign PriceWaterhouseCoopers firms, were as follows:
Other services paid to group auditor for other services in 2022 consists of, among others, ESG related audits, various legal and technical advice, HR related services, assistance related to establishment of framework for ESG reporting, and other.
Payroll costs, number of employees, remuneration, loans to staff, etc.
Lerøy Seafood Group ASA is a subsidiary of Austevoll Seafood ASA, which in turn is a subsidiary of Laco AS. Laco AS is the ultimate parent company.
Transactions and intercompany accounts with other Group companies in the Laco AS corporation, not covered by Lerøy Seafood Group ASA, are classified as transactions and intercompany accounts with related
parties. The same applies to joint ventures and associates of the above.
Joint ventures and associates owned by Lerøy Seafood Group, together with non-controlling interests in subsidiaries, are also classified as related parties.
In addition, any companies owned by employees, in particular senior
executives, are classified as related parties. No transactions of significance between such companies have been identified.
Transactions and intercompany accounts with identified related parties of Lerøy Seafood Group ASA, and subsidiaries, are as follows:
All figures in NOK 1 000
Comments on transactions in 2021
Dividends received from associated companies are specified in note 3. Group contributions current year are also specified in note 3. The capital in the joint venture Norskott Havbruk AS has been increased with NOK 305,5
million. See note on joint ventures and associates in annual financial statements for the group for details. Lerøy Seafood Group ASA acquired Lerøy Årskog AS from the ultimate parent company Laco AS for NOK 38,9 million. The transaction was carried out after
arm lenght principle. The transaction is further described in the Group note on acquisitions. Lerøy Seafood Group ASA has an interest income from subsidiaries totalling NOK 25.786 from internal loans to subsidiaries. The loan balances are presented in note 3.
Comments on transactions in 2022
Dividends received from associated companies are specified in note 3. Group contributions current year are also specified in note 3. Lerøy Seafood Group ASA has an interest income from subsidiaries totalling NOK 25.037 from internal loans to subsidiaries. The loan balances are specified in note 3.
We declare, to the best of our knowledge, that the financial statements for the period 1 January to 31 December 2022 are prepared in conformance with current, applicable accounting standards, and give a
good and fair view of the company’s and the Group’s assets, liabilities, financial position and profit or loss as a whole. We also declare that the annual report gives a fair view of the company’s and the Group’s
development and position, together with a description of the principle risks and uncertainties facing the entity and the Group.
Arne Møgster Chair of the Board Britt Kathrine Drivenes Board member Didrik Munch Board member Karoline Møgster Board member Hans Petter Vestre Board member Siri Lill Mannes Board member Bergen, 28 April 2023We have audited the financial statements of Lerøy Seafood Group ASA, which comprise:
• the financial statements of the parent company Lerøy Seafood Group ASA (the Company), which comprise the balance sheet as at 31 December 2022, the income statement and statement of cash flows for the year then ended, and notes to the financial statements, including a summary of significant accounting policies, and
• the consolidated financial statements of Lerøy Seafood Group ASA and its subsidiaries (the Group), which comprise the statement of financial posit ion as at 31 December 202 2, the income statement, statement of comprehensive income, statement of changes in equity and statement of cash flows for the year then ended, and notes to the financial statements, including a summary of significant accounting po licies.
In our opinion
• the financial statements comply with applicable statutory requirements,

• the financial statements give a true and fair view of the financial position of the Company as at 31 December 2022, and its financial performance and its cash flows for the year then ended in accordance with Norwegian Accounting Act and accounting standard s and practices generally accepted in Norway, and
• the consolidated financial statements give a true and fair view of the financial position of the Group as at 31 December 2022, and its financial performance and its cash flows for the year then ended in accordance with International Financial Reporting Sta ndards as adopted by the EU.
Our opinion is consistent with our additional report to the Audit Committee.
We conducted our audit in accordance with International Standards on Auditing (ISAs). Our responsibilities under those standards ar e further described in the Auditor’s Responsibilities for the Audit of the Financial Statements section of our report. We are independent of the Company and the Group as required by relevant laws and regulations in Norway and the International Ethics Stand ards Board for Accountants’ International Code of Ethics for Professional Accountants (including International Independence Standards) (IESBA Code), and we have fulfilled our other ethical responsibilities in accordance with these requirements. We believe that the audit evidence we have obtained is sufficient and appropriate to provide a basis for our opinion.
To the best of our knowledge and belief, no prohibited non-audit services referred to in the Audit Regulation (537/2014) Article 5.1 have been provid ed.
We have been the auditor of the Company for 29 years from the election by the general meeting of the shareholders on 20 May 1994 for the accounting year 1994
Key audit matters are those matters that, in our professional judgment, were of most significance in our audit of the financial statements of the current period. These matters were addressed in the context of our audit of the financial statements as a whole, and in forming our opinion thereon, and we do not provide a separate opinion on these matters. The Group’s business activities are largely unchanged compared to last year. Measurement of the quantity and valuation of biological assets contain approximately the same complexity and risks as previous year and have been in focus for the audit also this year.
As described in the financial statement, Lerøy Seafood Group ASA measures biological assets to their fair value according to IAS 41. At the balance sheet date, the fair value of biological assets was TNOK 7 617 593, of which TNOK 5 109 448 is historical cost and TNOK 2 508 145 is adjustment to fair value.
Biological assets comprise inventory of ova (eggs), juveniles, cleaner fish, brood stock and fish held for harvesting purposes (on growing stage) and relate to the Farming segment Measured in book value, biological assets constitute approximately 21 % of the balance sheet on 31 December 2022.
We focused on measurement of biological assets (biomass), emphasizing live fish held for harvesting purposes, because it constitutes a major part of the Group’s biological assets. Furthermore, there is an inherent risk of error in the measurement of both number of fish and biomass, as the biological assets, by nature, are difficult to count, observe and measure due to lack of sufficiently accurate measuring techniques that at the same time do not affect fish health. As a result, there is some uncertainty related to the number of fish and biomass in the sea. The Group has established control procedures for measurement of both number of fish and biomass.
See note 1 Accounting policies part I and note 11 Biological assets to the consolidated financial statement for further information on measurement of biological assets.
For audit of significant inventories, the International Audit Standards (ISAs) require that we participate at inventory counts, provided that it is practicable. Due to the nature of the biological assets and the described difficulty related to counting, observing, and measuring the fish and the biomass, we have performed alternative audit procedures to obtain sufficient appropriate audit evidence regarding the inventory’s existence and condition
The Group’s biomass system includes information about number of fish, average weight and biomass per site. We reconciled the movement in the inventory of fish held for harvesting purposes (in number and biomass) for the farming units in the period. The movement in number of fish is the total of smolt stocked, mortality, other loss and harvested fish, whereas the movement in biomass is the total of stocked biomass, net growth in the period and harvested biomass. We focused particularly on number of smolt stocked and net growth in kilo as this has the most significant impact on the measurement at the balance sheet date.
We reviewed the Group’s routines related to recording of number of smolt stocked. To test the accuracy of the number of fish registered in the biomass system, we tested a selection of recorded smolt stocked against the number of fish according to supporting documentation. Examples of supporting documentation were invoice from smolt supplier, vaccination report or well boat count. We also reviewed and tested the Group’s routines for continuous registration of mortality.
The fluctuations in fair value estimate that arise for instance due to change in market prices may have a significant impact on the operating result for the period. Lerøy Seafood Group ASA therefore presents the effect of value adjustments connected to biological assets as a separate line item before the operating result. We focused on valuation of biological assets due to the size of the amount, the complexity and the judgement involved in the calculation, and the impact of the value adjustment on the result for the year.
The period’s net growth corresponds to the feed used in the period divided by the feed conversion rate. The feed consumption is closely related to the purchase of feed in the period. To assess the feed consumption and the feed purchase in the period, we reviewed the Group’s routines for reconciliation of feed inventory and tested a sample of feed purchases throughout the year against incoming invoices from feed suppliers. We also assessed the accumulated feed conversion rate of the inventory against our expectation based on historic figures for the individual region. Where the feed conversion rate was significantly higher or lower than expected, we obtained further documentation and explanations. Our work substantiated that the net growth had been reasonably assessed. To challenge the historical accuracy of the Group’s biomass estimates, we reviewed the harvest deviation for the period. Harvest deviation is defined as the difference between harvested biomass (in kilos and numbers) and estimated biomass according to the Group’s biomass systems. We also reviewed harvest deviation after the balance sheet date to assess the correctness of fish ready to be harvested on 31 December 2022. We found the deviations overall to be limited and in accordance with expectations
We assessed whether the disclosures in relevant notes were in accordance with the requirements in the accounting standards
We reviewed the Group’s calculation model for valuation of biological assets by comparing it against the criteria in IAS 41 and IFRS 13 and found no obvious deviations.
We examined whether the biomass and number of fish used in the Group’s model for calculation of fair value of biological assets corresponded with the Group’s biomass systems and tested if the model made mathematic calculations as intended.
After having tested if these basic elements were in place, we assessed whether the assumptions used by management in the model, were
See further information on valuation of biological assets in note 1 about accounting policies part I, note 3 about significant accounting estimates and assessments and note 11 about biological assets.
reasonable. We did this by discussing the assumptions with management and comparing them to among other things, historical data, available industry data and observable prices. We found the assumptions to be reasonable.
We assessed whether the disclosures in the notes appropriately explained the methods for valuation of biological assets, and if the information was in accordance with the requirements in the accounting standards
The Board of Directors and the Managing Director (management) are responsible for the information in the Board of Directors’ report and the other information accompanying the financial statements. The other information comprises information in the annual report , but does not include the financial statements and our auditor’s report thereon. Our opinion on the financial statements does not cover the information in the Board of Directors’ report nor the other information accompanying the financial statements.
In connection with our audit of the financial statements, our responsibility is to read the Board of Directors’ report and the other information accompanying the financial statements. The purpose is to consider if there is material inconsistency between the Board of Directors’ report and the other information accompanying the financial statements and the financial statements or our knowledge obtained in the audit, or whether the Board of Directors’ report and the other information accompanying the financial statements otherwise appear to be m aterially misstated. We are required to report if there is a material misstatement in the Board of Directors’ report or the other information accompanying the financial statements. We have nothing to report in this regard.
Based on our knowledge obtained in the audit, it is our opinion that the Board of Directors’ report
• is consistent with the financial statements and
• contains the information required by applicable statutory requirements.
Our opinion on the Board of Director’s report applies correspondin gly to the statements on Corporate Governance and Corporate Social Responsibility.
Management is responsible for the preparation of financial statements that give a true and fair view in accordance with the Norwegian Accounting Act and accounting standards and practices generally accepted in Norway, and for the preparation and true and fair view of the consolidated financial statements of the Group in accordance with International Financia l Reporting Standards as adopted by the EU, and for such internal control as management determines is necessary to enable the preparation of financial statements that are free from material misstatement, whether due to fraud or error.
In preparing the financial statements, management is responsible for assessing the Company’s and the Group’s ability to continue as a going concern, disclosing, as applicable, matters related to going concern. The financial statements of the Company use the going concern basis of accounting insofar as it is not likely that the enterprise will cease operations. The consolidated financial statements of the
Group use the going concern basis of accounting unless management either intends to liquidate the Group or to cease operations, or has no realistic alternative but to do so.
Our objectives are to obtain reasonable assurance about whether the financial statements as a whole are free from material misstatement, whether due to fraud or error, and to issue an auditor’s report that includes our opinion. Reasonable assurance is a high level of assurance, but is not a guarantee that an audit conducted in accordance with ISAs will always detect a material misstatement w hen it exists. Misstatements can arise from fraud or error and are considered material if, individually or in aggregate, they could reasonably be expected to influence the economic decisions of users taken on the basis of these financial statements.
As part of an audit in accordance with ISAs, we exercise professional judgment and maintain professional scepticism throughout the audit. We also:
• identify and assess the risks of material misstatement of the financial statements, whether due to fraud or error. We design and perform audit procedures responsive to those risks, and obtain audit evidence that is sufficient and appropriate to provide a basis for our opinion. The risk of not detecting a material misstatement resulting from fraud is higher than for one resulting from error, as fraud may involve collusion, forgery, intentional omissions, misrepresentations, or the override of internal control.
• obtain an understanding of internal control relevant to the audit in order to design audit procedures that are appropriate in the circumstances, but not for the purpose of expressing an opinion on the effectiveness of the Company's and the Group's internal control.
• evaluate the appropriateness of accounting policies used and the reasonableness of accounting estimates and related disclosures made by management.
• conclude on the appropriateness of management’s use of the going concern basis of accounting and, based on the audit evidence obtained, whether a material uncertainty exists related to events or conditions that may cast significant doubt on the Company's and the Group's ability to continue as a going concern. If we conclude that a material uncertainty exists, we are required to draw attention in our auditor’s report to the related disclosures in the financial statements or, if such disclosures are inadequate, to modify our opinion. Our conclusions are based on the audit evidence obtained up to the date of our auditor’s report. However, future events or conditions may cause the Company and the Group to cease to continue as a going concern.
• evaluate the overall presentation, structure and content of the financial statements, including the disclosures, and whether the financial statements represent the underlying transactions and events in a manner that achieves a true and fair view.
• obtain sufficient appropriate audit evidence regarding the financial information of the entities or business activities within the Group to express an opinion on the consolidated financial statements. We are responsible for the direc tion, supervision and performance of the group audit. We remain solely responsible for our audit opinion.
We communicate with the Board of Directors regarding, among other matters, the planned scope and timing of the audit and significant audit findings, including any significant deficiencies in internal control that we identify during our audit.
We also provide the Audit Committee with a statement that we have complied with relevant ethical requirements regarding independence, and to communicate with them all relationships and other matters that may reasonably be thought to bear on our independence, and where applicable, related safeguards.
From the matters communicated with the Board of Directors, we determine those matters that were of most significance in the audit of the financial statements of the current period and are therefore the key audit matters. We describe these matters in our auditor’s report unless law or regulation precludes public disclosure about the matter or when, in extremely rare circu mstances, we determine that a matter should not be communicated in our report because the adverse consequences of doing so would reasonably be expected to outweigh the public interest benefits of such communication.
Report on Compliance with Requirement on European Single Electronic Format (ESEF)
Opinion
As part of the audit of the financial statements of Lerøy Seafood Group ASA, we have performed an assurance engagement to obtain reasonable assurance abo ut whether the financial statements included in the annual report, with the file name “5967007LIEEXZXJ2JK50-2022-12-31-en.zip“ have been prepared, in all material respects, in compliance with the requirements of the Commission Delegated Regulation (EU) 2019/815 on the European Single Electronic Format (ESEF Regulation) and regulation pursuant to Section 5-5 of the Norwegian Securities Trading Act, which includes requirements related to the preparation of the annual report in XHTML format, and iXBRL tagging of the consolidated financial statements.
In our opinion, the financial statements, included in the annual report, have been pr epared, in all material respects, in compliance with the ESEF regulation.
Management’s Responsibilities
Management is responsible for the preparation of the annual report in compliance with the ESEF regulation. This responsibility comprises an adequate pr ocess and such internal control as management determines is necessary.
Auditor’s Responsibilities
For a description of the auditor’s responsibilities when performing an assurance engagement of the ESEF reporting, see: https://revisorforeningen.no/revisjonsberetninger
Bergen, 28 April 2023
PricewaterhouseCoopers AS
Hallvard Aarø State Authorised Public Accountant
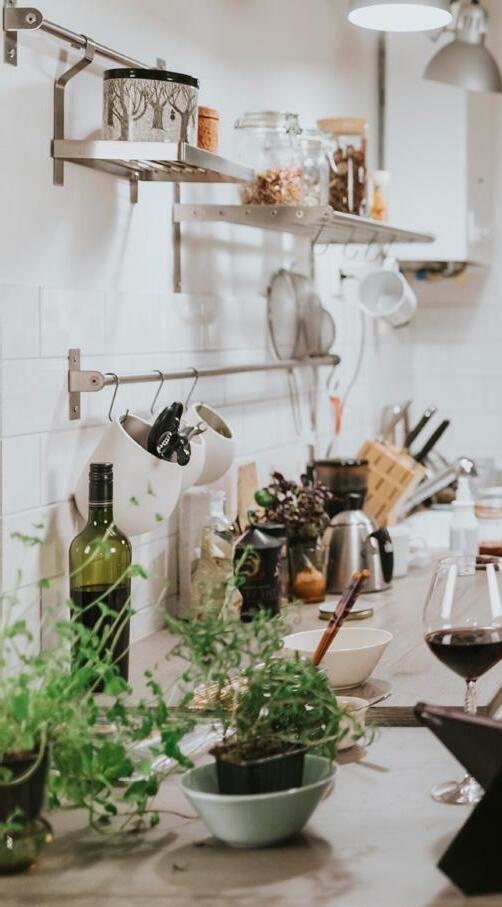
The sea provides natural, locally sourced food. The basis of good health, and a sustainable future. Provided we treat it with care and respect.
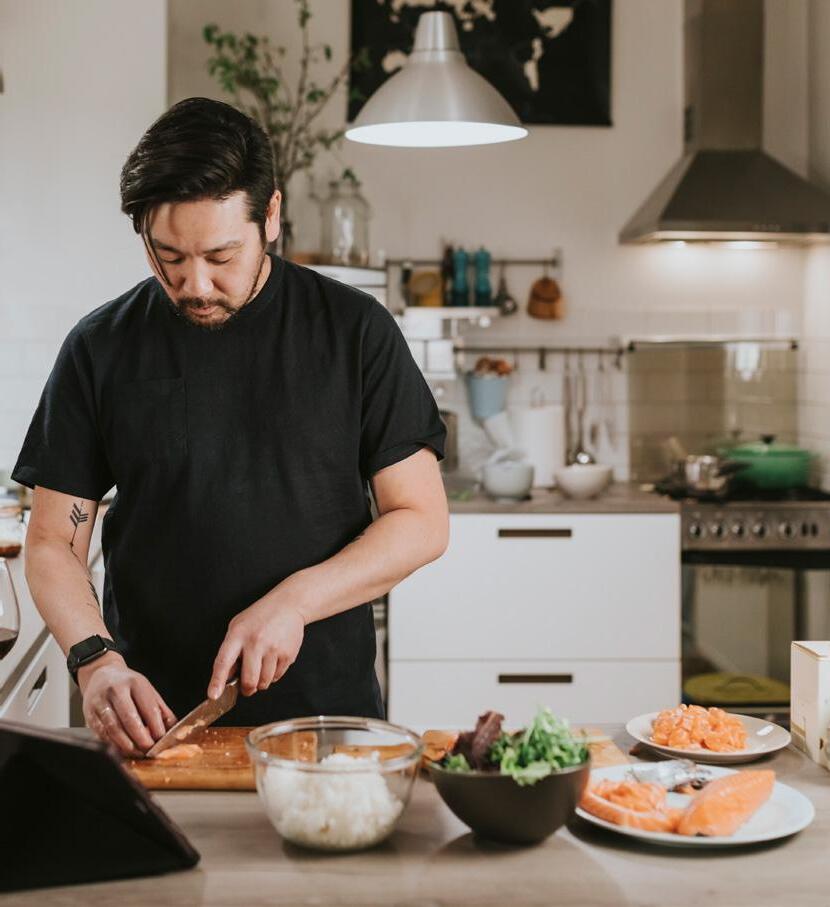
Local employment and expertise (number of employees 5 972, number of full-time equivalents 5 060)
Working environment and rights
Diversity and anti-discrimination
Water use: 88 963 964 m3
Emissions from electricity
Emissions from liquid oxygen
Fish density / mortality
Area efficiency
Health and safety
Working environment and rights
Local employment and expertise
Diversity and anti-discrimination
Emissions from transport of feed and liquid oxygen
Biodiversity is affected by fish oil and fishmeal in feed (feed factor approx. 1.3)
Biodiversity is affected by soy and other materials in feed Greenhouse gas emissions from feed production (approx. 42%, and total 509 759 tCO2e, (2022))
Fish welfare (survival rate 92.5% (2022))
Emissions of chemicals (detergents, antifouling, delousing agents, medicines, microplastics)
Nutrient salts, fish waste/sludge incl. loss of phosphorus
Impact of lice on wild salmon (0.18/fish), disease (0 kg antibiotics) and escapes of fish (10 544 fish) (2022)
Feed wastage
Unwanted catches/ death
Overfishing
Fossil fuels
111 967 tCO2e (2022)
Ghost fishing
Loss of equipment and plastic in the sea
Trawlers may harm vulnerable benthic environments
Local employment and expertise
Working environment and rights
Diversity and anti-discrimination
Local employment and expertise
Working environment and rights
Diversity and anti-discrimination
Local employment and expertise
Working environment and rights
Diversity and anti-discrimination
Traffic safety (deaths/ injuries related to transport)
Emissions from electricity (Farming, 3 855.30 tCO2e, (2022))
Consumption of fossil fuels, Farming 54 091 tCO2 (2022)*
Waste from fish cuttings, fish on floor, byproducts, wastage
Waste (plastic, cardboard and polystyrene)
Area efficiency
Material for packaging
Transport of fish to processing plant
Waste from fish cuttings, fish on floor, byproducts, wastage
Combined transport
Waste (plastic, cardboard and polystyrene)
Area efficiency
Transport of products to consumers (76% of emissioons from air transport, 321 360 tCO2e (2022)
Emissions from electricity 2022: 4 464.6 tCO2e for VAP, Sales & Distribution
Transport of products – emissions from sea transport (approx. 4 758.9 tCO2e, (2022)) and road transport (approx. 91 324 tCO2e, (2022))
Change road transport to sea transport (CO2, microplastics, space)
Food safety
Improved diets
Tax contribution, employees and company: NOK 1 138 million (2022)
Sponsorship
Data security and personal data
Food wastage (packaging and shelf life)
Impact of packaging on environment after consumption
More climate-friendly alternative to red meat
Information for customers
Food wastage/food waste
* A key change from previous year’s reporting is that a major part of well-boat and service boat activity (time chartered vessels) is moved from Scope 3 to Scope 1
for the period 1 January to 31 December
for the period 1 January to 31 December
breaches
legislation and regulations related to the environment
* A key change from previous year’s reporting is that a major part of well-boat and service boat activity (time chartered vessels) is moved from Scope 3 to Scope 1
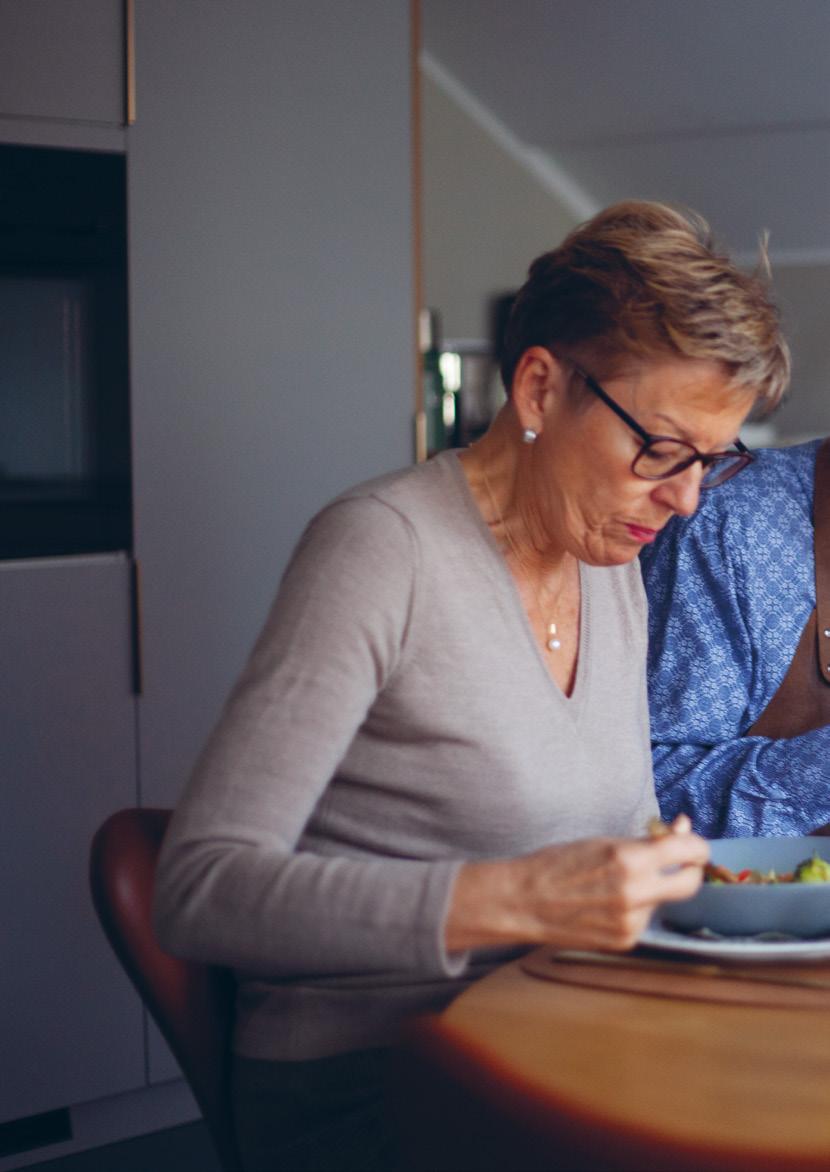
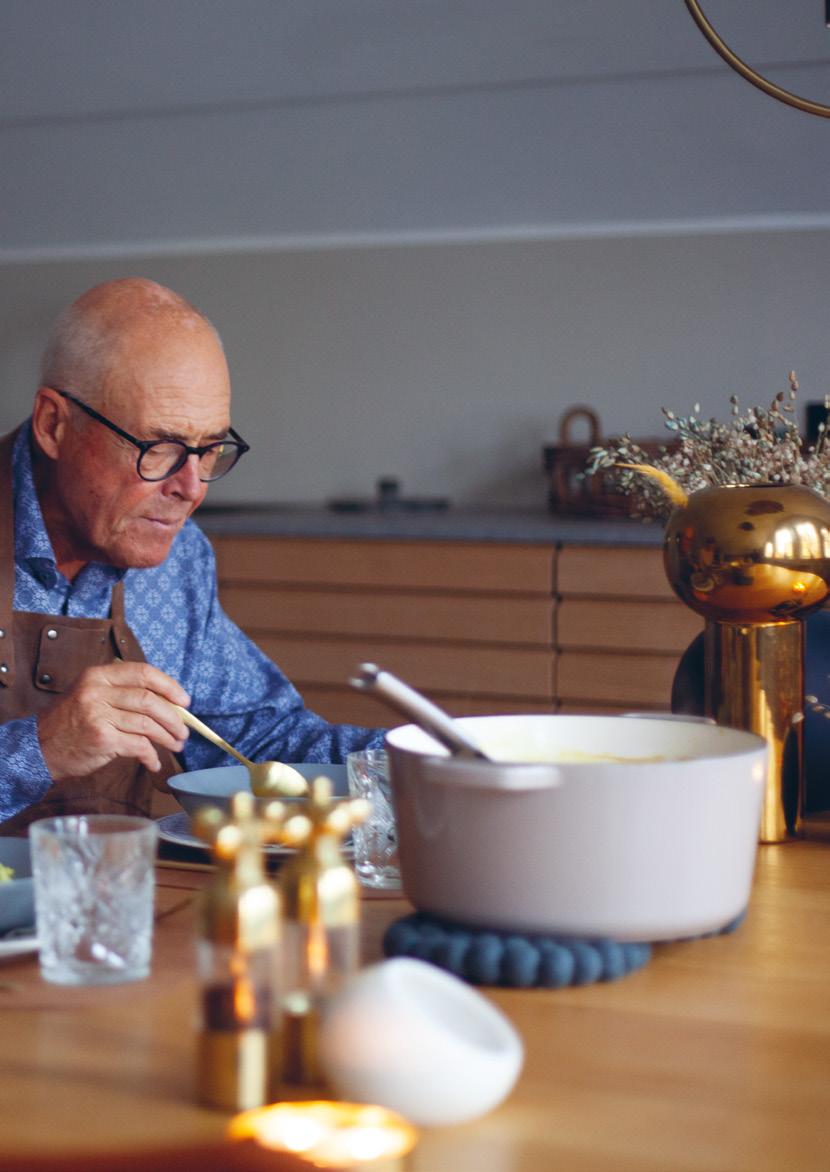
Lerøy Seafood Group carried out its first materiality assessment in 2016, with updates in 2020. In the autumn of 2022, the Group made a completely new materiality assessment. This new assessment is in accordance with the requirements in the GRI Standards 2021. The purpose of the assessment is to identify significant conditions where Lerøy has an actual or potential (significant) impact on financial results, people, or the environment. This includes both an impact directly caused by the Group and the impact that we have, or may have, throughout our entire value chain. The impact can be negative or positive. We have also assessed whether there are any topics in our value chain where we must have a special focus on human rights. In order to identify the significant
areas where we have an impact today or where we can have an impact in the future, we have taken our value chain and the operations we carry out as a starting point.
We have completed a survey to different stakeholders to get their opinion on significant topics. Through dialogue with various stakeholders over many years, we formed a list with topics that we know they are concerned with. In addition to this list we added the different topics that are listed in the new sector standard GRI 13, which pertains to fisheries and aquaculture, among other sectors. The list was linked to the survey were we asked the stakeholders to mark the areas where they think we had/could have an impact either economically,
environmentally, or on people in the short or long term. We also asked them what topics were important to them. In addition a third-party company conducted around 30 in-depth interviews with some of the stakeholders. A supplementary list of stakeholders is presented in the Group`s sustainability library on leroyseafood.com.
Different stakeholders from different categories were asked in the survey.
• Authorities
• Business organizations
• Banking and finance
• Suppliers
• Owners
• Employees
• Customers
• NGO`s
Biodiversity
Water and effluents
Waste
Fish health and welfare
Climate emissions
Raw materials fish feed
Health, safety and environment
Food safety
Food security
The topic has been included in Lerøy’s ESG reporting in previous reporting period. Fish Escapes, Sea bed conditions was material topics in 2021 but is now included in biodiversity.
New material topic in 2022
New material topic in 2022, however the company chose to include GRI 306 “Waste” (2020) in its reporting for 2021
The topic has been included in Lerøy’s ESG reporting in previous reporting period. Sea Lice, Use of Drugs and Chemicals, was material topics in 2021 but is now included in fish health and welfare.
The topic has been included in Lerøy’s ESG reporting in previous reporting period; In the previous reporting period the name of the topic was “Emissions”
The topic has been included in Lerøy’s ESG reporting in previous reporting period. Deforestation was a material topic in 2021 but is now included in raw materials fish feed.
The topic has been included in Lerøy’s ESG reporting in previous reporting period; In the previous reporting period the name of the topic was “Health, Safety and Environment (HSE)”
New material topic in 2022
New material topic in 2022 We reported food waste in 2021
Results The topic has been included in Lerøy’s ESG reporting in previous reporting period; In the previous reporting period the name of the topic was “Earnings and Returns for Owners”
Supplier management
Customer perspective
Compliance
Anti- corruption
Learning and organisational development
The topic has been included in Lerøy’s ESG reporting in previous reporting period
New material topic in 2022
The topic has been included in Lerøy’s ESG reporting in previous reporting period; In the previous reporting period the name of the topic was “Compliance and Business Code of Conduct”
New material topic in 2022, however the topic was partly reported on under “Compliance and Business Code of Conduct”
New material topic in 2022
Internally, we assessed the following topics:
• How grave is the impact?
• How widespread is the impact?
• How hard is it to counteract or remedy the resulting harm?
Based on this assessment, we have concluded on material topics for reporting.
Based on the materiality analysis and risk assessment discussed above, we have prioritized a number of topics
Topics which we reported on in 2021 that are not included in 2022 reporting
• Plastic Management
• Certifications
where we have an impact. Significant impacts are listed in the table to the left. The material topics are approved by the Group’s management and audit committee.
RESULTS AND PROCESS
LERØY´S ACTIVITIES CUSTOMERS PERSPECTIVE FISH
LEARNING AND ORGANIZATIONAL DEVELOPMENT
Lerøy Seafood Group has chosen to report its sustainability efforts in accordance with the Global Reporting Initiative (GRI). The GRI sets the leading standard for sustainability reporting, comprising principles, guidelines, and performance indicators that companies can use to measure and report on different impacts. The GRI Standards enable an organisation to report information about its most significant impacts on the economy, environment, and people (including impacts on their human rights) and how it manages these impacts. As an international standard widely used in relation to sustainability, it will be familiar to many of our stakeholders.
GRI standards are organised hierarchically, in three main categories:
1. Universal standards
2. Sector standards
3. Topic-specific standards
- Series 200: Economic
- Series 300: Environmental
- Series 400: Social
impact. GRI 13 is a sector standard for Agriculture, Aquaculture, and Fishing sectors. From 2024 the Group is required to use this standard when determining its material topics and when determining what information to report for the material topics. For 2022, the Group has chosen to partially report in accordance with this new standard and has therefore partially used GRI 13 in this year’s GRI reporting.
The UN’s 17 Sustainable Development Goals (SDGs) have boosted sustainable development, particularly in recent years. Like many other businesses, the Group takes an active approach towards sustainability and is a member of the UN Global Compact, Norway.
Our GRI reporting includes all active companies with associated employees in the Group.
The information on the GRI table is sourced from our various business systems for reporting figures in the areas of finance, society, and the environment. Information sourced from external sources is identified as such.
The GRI table is reviewed in house and presented to the Audit Committee and Board of Directors of Lerøy Seafood Group. The Group has contracted with a third-party company to review andattest our reporting, to confirm that it is correct and complies with the GRI standard. We have engaged PwC, who are also the Group’s independent auditors, to conduct this review.
• Sick leave (%)
• Near misses (number)
• Safety observations (number)
• LTI-H value
• Escapes of fish (number)
• Average number of fully grown lice per fish in LSG farming (number)
• Antibiotics used in seawater (kg active substance)
• Antibiotics used on shore (kg active substance)
• Volume of delousing agents used via bath (kg active substance)
• Volume of delousing agents used via feed (kg active substance)
• Survival at sea (%)
• Survival on shore (%)
• Average density per cage in the sea (kg/m3)
• Percentage of certified marine species caught (%)
• Average MOM B score
• FFDRm, salmon
• FFDRo, salmon
• Share of deforestation-free soy protein concentrate from Brazil with traceability (%)
• Percentage of marine raw materials certified ( MSC+IFFO/ Marine trust including FIP) (%)
• Percentage of new suppliers screened using environmental criteria (%)
• Percentage of new suppliers screened using social criteria (%)
• GHG accounting: Scope 1, 2 and 3
Universal standards are obligatory, sector standards provide information especially for the sector representing the organisation, and topic-specific standards are selected according to the nature of the business and its
A selcetion of our ESG indicators is included in Inedpendent Auditor’s assurence (External Assurance). These indicators are:
Lerøy Seafood Group’s vision is: “We shall be the leading and most profitable global supplier of sustainable, high-quality seafood.” Through GRI reporting, we can demonstrate our economic, environmental, and social sustainability efforts. By establishing specific targets within these areas, we can continue to improve, forging a clear path towards our goals and vision.
Linkages between the material topics and SDF’s
Biodiversity
Water and effluents
Waste
Fish Health and Welfare
Climate emissions
Raw Materials Fish Feed
Health, Safety and Environment
Food safety
Food security
Results
Supplier Management
Customer perspective
Compliance
Anti-corruption
Learning and Organisational Development
Lerøy’s values are open, honest, responsible and creative. It is therefore very important for us to maintain positive and open dialogue with all our stakeholders. As such, Lerøy obtains knowledge of and familiarity with those areas of interest to our stakeholders and can communicate how we work on the different areas. By maintaining regular and positive dialogue, we work together on improvements within individual areas, which also strengthens expertise in the individual company. Dialogue with stakeholders is important and helps Lerøy make progress towards its goal of being the most sustainable supplier of high-quality seafood.
In the last few years, there has been an explosion of interest from different stakeholder groups, particularly regarding sustainability reporting. We respond to questions and take part in dialogue several times a week with different stakeholder groups. This is an ongoing process, where dialogue with different stakeholder groups is continuously updated through the year. We believe that our daily activities provide us with a good overview of the concerns of our most important stakeholders.
Our overview of stakeholders are based on our own experience over several years, gained from various
types of dialogue with stakeholders. This includes collaboration projects, meetings, conferences, lectures, dialogue via different media, research by IPSOS on behalf of Lerøy, audits and other platforms. The different stakeholders are selected on the basis of the impact they have on our operations and the economic, environmental and social impact Lerøy has on the stakeholders. In order to fulfil the requirements made by the different stakeholders for reporting, we have implemented indicators for the different areas. These are referred to in the GRI index.
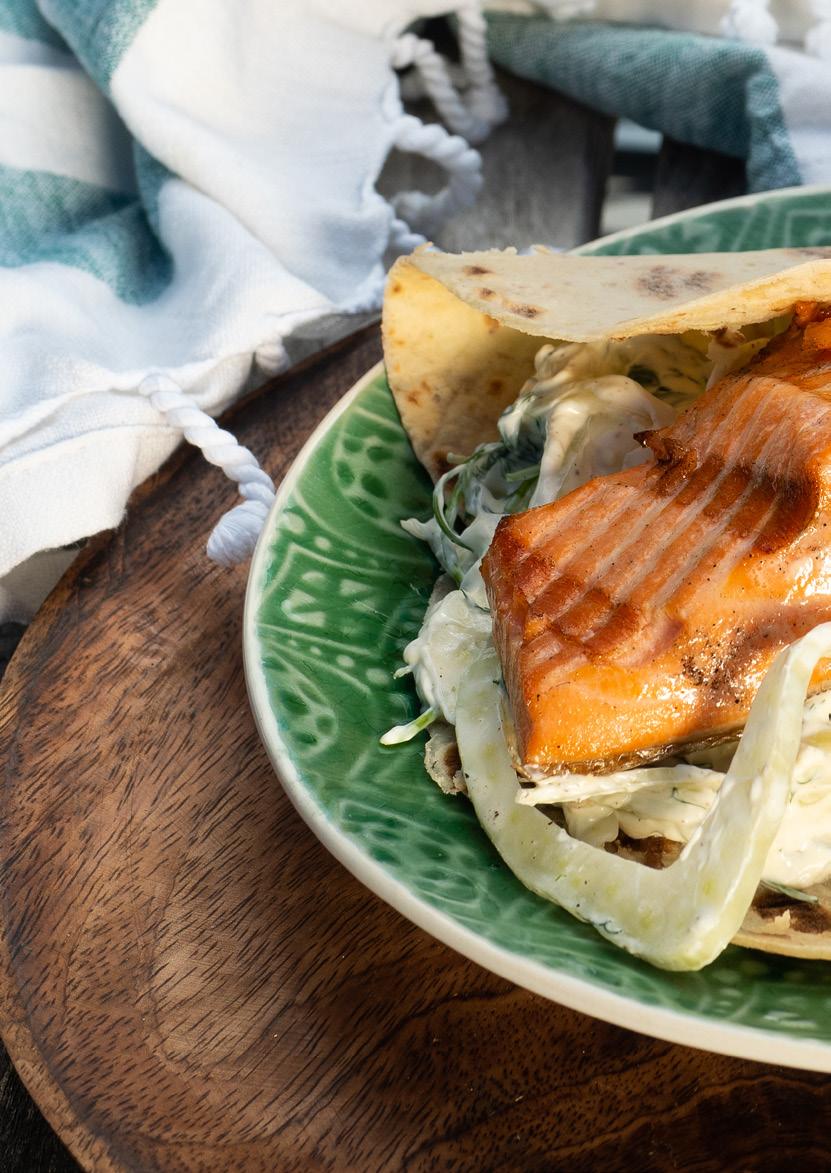
Disclosure
GRI 2: General disclosures (2021)
Response
THE ORGANIZATION AND ITS REPORTING PRACTICES
2-1 Organizational details
https://www.leroyseafood.com/en/about-us/ about-leroy/
Comment
Information: Lerøy Seafood Group ASA, Bergen, Norway
Lerøy Seafood Group ASA is privately owned company listed on Oslo Stock Exchange. The Group has its operations in Norway, Sweden, Denmark, Finland, France, the Netherlands, Portugal, Spain, Italy, Turkey and the United Kingdom. The Company has sales offices in China, Japan and the United States
2-2 Entities included in the organization’s sustainability reporting
2-3 Reporting period, frequency and contact point
Sustainability library 2022 - GovernanceAbout Lerøy - Group Management
Information: ESG reporting is consolidated on Group level. Companies without employees or active operations do not report ESG related information
Information: Annual reporting for both sustainability and financial reporting. (01.01.22-31.12.22)
Publication date for report: 4/28/2023
Contact point: Anne Hilde Midttveit, Head of ESG & Quality (anne.hilde.midttveit@leroy.no)
2-4 Restatements of information
2-5 External assurance Annual report - ESG information - Global reporting Initiative Index, 2022 - External Assurance, Auditor`s Statement
ACTIVITY AND WORKERS
2-6 Activities- value chain and other business relationships
https://www.leroyseafood.com/en/about-us/ value-chain/
Sustainability library 2022 - GovernanceSupplier Management
Sustainability library 2022 - GovernanceAbout Lerøy - Customer perspective
Sustainability library 2022 - GovernanceAbout Lerøy - Membership of interests groups and associations
2-7 Employees Sustainability library 2022 – Social - People - Our Employees
2-8 Workers who are not employees
GOVERNANCE
2-9 Governance structure and composition
2-10 Nomination and selection of the highest governance body
2-11 Chair of the highest governance body
2-12 Role of the highest governance body in overseeing the management of impacts
Sustainability library 2022 – Social - People - Our Employees
No restatements of information
Sustainability library 2022 - Governance- About Lerøy - Governance Structure and Composition
Sustainability library 2022 - Governance- About Lerøy - Governance Structure and Composition - Nomination Committee
Sustainability library 2022 - Governance- About Lerøy - Governance Structure and Composition
Sustainability library 2022 - Governance- About Lerøy - Governance Structure and CompositionRole of the highest governance body in overseeing the management of impacts
Information: No significant changes compared to previous reporting periods
Disclosure
2-13 Delegation of responsibility for managing impacts
2-14 Role of the highest governance body in sustainability reporting
2-15 Conflict of interest
2-16 Communication of critical concerns
Response
Sustainability library 2022 - Governance- About Lerøy - Governance Structure and CompositionDelegation of responsibility for managing impacts
Sustainability library 2022 - Governance- About Lerøy - Governance Structure and CompositionRole of the highest governance body in sustainability reporting
Sustainability library 2022 - Governance- About Lerøy - Governance Structure and CompositionConflict of interest
Sustainability library 2022- GovernanceBusiness ethics - Compliance - Reporting of Critical Concerns
Sustainability library 2022- GovernanceBusiness ethics - Whistleblowing - Internal whistleblowing cases in 2022
Comment
2-17 Collective knowledge of the highest governance body
2-18 Evaluation of the performance of the highest governance body
2-19 Remuneration policies
Sustainability library 2022 - Governance- About Lerøy - Governance Structure and CompositionCollective knowledge of the highest governance body
Sustainability library 2022 - Governance - About Lerøy - Governance structure and CompositionEvaluation of the performance of the highest governance body
Sustainability library 2022 - Governance- About Lerøy - Governance Structure and CompositionRemuneration PoliciesSalary and other remuneration of persons in senior positions - Remuneration report 2022
2-20 Process to determine remuneration
2-21 Annual total compensation ratio
Sustainability library 2022 - Governance - About Lerøy - Governance Structure and CompositionRemuneration Policies - Salary and other remuneration of persons in senior positions
Omission: Information for 2-21 (a-c) incomplete - The company has developed Equality, Non-discrimination and Gender Pay Report which includes information on all Norwegian companies that have more than 50 employees. The Group is currently implementing a project the aim om which is to establish a single payroll system which would allow us to gather information on annual compensation ratio for the whole Group. Annual total compensation ration information for 2022 is not available at this point.
2-22 Statement on sustainable devel-opment strategy
2-23 Policy commitments
Annual report 2022-About the GroupStatement from the CEO
Sustainability library 2022 - Policies - Human rights
Sustainability library 2022- Social- PeopleHuman rights Sustainability library 2022 - GovernanceBusiness ethics - Compliance - Lerøy’s Business Code of Conduct
https://www.leroyseafood.com/en/about-us/ code-of-conduct/
2-24 Embedding policy commitments
2-25 Processes to remediate negative impacts
2-26 Mechanisms for seeking advice and raising concerns
Sustainability library 2022 - GovernanceBusiness Ethics - Compliance - Lerøy's Business Code of Conduct, Supplier Code of conduct
Sustainability library 2022 - GovernanceBusiness ethics - Whistleblowing
Sustainability library 2022 - GovernanceBusiness ethics - Whistleblowing
Disclosure
2-27 Compliance with laws and regulations
2-28 Membership associations
Response
Sustainability library 2022 - Governance- Business ethics - Compliance - Compliance reporting
Sustainability library 2022 - Governance- Business ethics - Whistleblowing
Sustainability library 2022 - Governance- About Lerøy - Membership of interest groups and associations
Comment
Omission: Information incomplete: Lerøy commenced collecting information regarding fines for instances of non-compliance in 2022. However, information regarding number of fines for 2021 is not available.
2-29 Approach to stakeholder en-gagement
2-30 Collective bargaining agree-ments
GRI 3: Material topics (2021)
3-1 Process to determine material topics
Sustainability library 2022 - Governance- About Lerøy - Stakeholders
Sustainability library 2022 - Social- PeopleFair Working Conditions
Sustainability library 2022 - GovernanceAbout Lerøy- Material Topics
Annual report 2022 - ESG information
-Materiality Assessment
3-2 List of material topics Annual report 2022 - ESG information -Materiality Assessment
Sustainability library 2022 - Governance - About Lerøy- Material Topics
GRI 3: Material topics (2021)
3-3 Management of material topics
Sustainability library 2022- EnvironmentBiodiversity Sustainability library 2022-Policies:-Marine ecosystems and biodiversity, Control of salmon lice, Use of medication, Use of antimicrobial agents-Escapes
GRI 304: Biodiversity (2016)
304-2 Significant impacts of activities- products- and services on biodiversity
Lerøy KPIs
Average MOM B score
Average fallow period (number of days)
Percentage of certified marine species caught (%)
Escapes (number)
Average density per cage (kg/m3)
WATER AND EFFLUENTS
GRI 3: Material topics (2021)
3-3 Management of material topics
Sustainability library 2022 - EnvironmentBiodiversity - How we work in the area
Sustainability library 2022 - EnvironmentBiodiversity - Seabed Conditions
Sustainability library 2022 - EnvironmentBiodiversity - Seabed Conditions
Sustainability library 2022 - EnvironmentCertifications and Licenses- Certification Fisheries
Sustainability library 2022 – Environment
-Biodiversity - Escapes
Sustainability library 2022 - EnvironmentBiodiversity - Seabed Conditions
KPI definition: Average result of the last MOM B survey on locations in operation in 2022
KPI definition: Average number of fallow days
KPI definition: Percentage of MSC certified species caught in 2022
KPI definition: Total number of fish escaped
KPI definition: Kilo of salmon per cubic meter of seawater in one cage
Sustainability library 2022 - EnvironmentWater and Waste Management - Water and Effluent Management
Sustainability library 2022 - Policies –Freshwater Use
Disclosure Response
GRI 303: Water and Effluents (2018)
303-1 Interactions with water as a shared resource
303-2 Management of water discharge-related impacts
Sustainability library 2022 - EnvironmentWater and Waste Management - Water and Effluent Management
Sustainability library 2022 - EnvironmentWater and Waste Management - Water and Effluent Management
303-3 Water withdrawal Sustainability library 2022 - EnvironmentWater and Waste Management - Water and Effluent Management, Table 2, Table 3, Table 4 ,Table 5
303-4 Water discharge Sustainability library 2022 - EnvironmentWater and Waste Management - Water and Effluent Management, Table 2, Table 3, Table 4, Table 5
303-5 Water consumption Sustainability library 2022 - EnvironmentWater and Waste Management - Water and Effluent Management, Table 4
WASTE
GRI 3: Material topics (2021)
3-3 Management of material topics Sustainability library 2022 - EnvironmentWater and Waste Management - Waste Management
Sustainability library 2022- Policies - Waste management and sorting policy
Comment
GRI 306: Waste (2020)
306-1 Waste generation and significant waste-related impacts Sustainability library 2022 - EnvironmentWater and waste management - Waste Management
306-2 Management of significant waste-related impacts Sustainability library 2022 - EnvironmentWater and waste management - Waste Management
306-3 Waste generated Sustainability library 2022 - EnvironmentWater and waste management - Waste Management, Table 2
306-4 Waste diverted from disposal Sustainability library 2022 - EnvironmentWater and waste management - Waste Man-agement, Table2, Table 3, Table 4
306-5 Waste directed to disposal Sustainability library 2022 - EnvironmentWaste and waste management - Waste Management, Table 2, table 5, table 6
Lerøy KPIs
Volume of plastic purchased (kg) Sustainability library 2022 - EnvironmentWater and Waste Management - Food Waste – Plastic Waste - Targets and Results
FISH HEALTH AND WELFARE
GRI 3: Material topics (2021)
3-3 Management of material topics
Sustainability library 2022 – Environment - Fish Health and Fish Welfare
Sustainability library 2022 – Environment - Fish Health and Fish Welfare – How We Work in the Area
Sustainability library 2022 - Policies - Fish Health and Fish Welfare, Algae Monitoring, Cleaner Fish, Use of Antimicrobial Agents, Control of Salmon Lice
Omission - Missing information/data. Seawater was not reported for all units in 2022 - We have included reporting on withdrawal and discharge of seawater in our 2023 reporting. Will be included in reporting from 2023
Omission - information unavailable/incomplete. We report total discharge, but we are unable to separate between fresh water and other water as other water is negligible (if any). We plan to investigate if it is possible to find a solution in 2023. Discharge with seawater as source is not included. Will be included from 2023 reporting.
Lerøy KPIs
Survival in sea (%)
Sustainability library 2022 - Environment - Fish health and fish welfare - Survival rate
KPI definition: (1-12 months rolling mortality)*100 12 months rolling mortality= (total number of mortalities in sea last 12 month - total number of culled fish due to illness or similar and not in harvest figures)/ (closing number of fish in sea + total number of mortalities in last 12 months + total number harvested fish in last 12 months + total number of culled fish in sea)
Survival on land (%)
Sustainability library 2022 - Environment - Fish health and fish welfare - Survival rate
KPI definition: (number of mortalities in fresh water (excluding number of culled fish due to illness or similar in fresh water) )/( number of mortalities in fresh water (including number of culled fish due to illness or similar in fresh water)+ number of fish in fresh water sold + number of outgoing stock of fish in fresh water)
Number of cages treated (for sea lice)
Average number of fully grown lice per fish in LSG Farming
Antibiotics used in sea (kg active substance)
Antibiotics used on land (kg active substance)
Volume of delousing agents used via bath (kg active substance)
Volume of delousing agents via feed (kg active substance)
CLIMATE EMISSIONS
GRI 3: Material topics (2021)
Sustainability library 2022-Environment-Fish health and fish welfare-Sea lice-Target and results
Sustainability library 2022 - Environment - Fish Health and Fish Welfare, Sea Lice, Targets and Results
Sustainability library 2022 - Environment - Fish Health and Fish Welfare, Antibiotics, Targets and Results
Sustainability library 2022 - Environment - Fish Health and Fish Welfare, Antibiotics, Targets and Results
Sustainability library 2022-Environment-Fish health and fish welfare-Sea lice-Target and results
Sustainability library 2022-Environment-Fish health and fish welfare-Sea lice-Target and results
KPI definition: Total number of cages treated for lice in 2022
KPI definition: Average result of all counting’s of adult female lice per fish, in all companies
KPI definition: Antibiotics used in sea (kg active substance)
KPI definition: Antibiotics used on land (kg active substance)
KPI definition: Amount of (kg), active substance used as delousing agent via bath
KPI definition: Amount of (kg), active substance used as delousing agent in feed
3-3 Management of material topics Sustainability library 2022 - Environment - Climate
GRI 305: Emissions (2018)
305-1 Direct (Scope 1) GHG emissions
305-2 Energy indirect (Scope 2)
GHG emissions
305-3 Other indirect (Scope 3)
GHG emissions
305-4 GHG emissions intensity
305-5 Reduction of GHG emissions
RAW MATERIALS FISH FEED
GRI 3: Material topics (2021)
3-3 Management of material topics
Lerøy KPIs
Percentage of certified marine raw materials (%)
Total percentage of certified raw materials (%)
FFDRm- salmon
Sustainability library 2022 - EnvironmentClimate - Greenhouse Gas Emissions
Sustainability library 2022 - EnvironmentGreenhouse Gas Emissions
Sustainability library 2022 - EnvironmentGreenhouse Gas Emissions
Sustainability library 2022 - EnvironmentGreenhouse Gas Emissions
Sustainability library 2022- Environment –Climate – Greenhouse Gas Emissions
Sustainability library 2022 – Environment - Fish Feed
Sustainability library 2022 – Policies - Fish Feed
Sustainability library 2022 - Environment - Fish Feed - Targets and Results
Sustainability library 2022 - Environment - Fish Feed - Targets and Results
Sustainability library 2022 - Environment - Fish Feed - Targets and Results
KPI definition: Share of IFFO standard certified marine raw materials used in feed in 2022
KPI definition: Total share of certified raw materials in feed
KPI definition: FFDRm= (%fishmeal in feed from forage fisheries) * (eFCR)/24
Disclosure
Response
FFDRo- salmon Sustainability library 2022 - Environment - Fish Feed - Targets and Results
Share of deforestation free soy protein concentrate from Brazil with traceability (%)
GRI 3: Material topics (2021)
3-3 Management of material topics
Sustainability library 2022 - Environment - Fish Feed - Targets and Results
Comment
KPI definition: FFDRo= (% fishoil in feed from forage fisheries) * ( eFCR)/ 5,0 or 7,0 depending on the species
KPI definition: Share of deforestation free soy protein concentrate from Brazil, with traceability out of total volume of soy protein concentrate purchased from Brazil (%)
Sustainability Library 2022 - PeopleOccupational Health and Safety - Positive and Negative Impacts of the Material Topic, Health and Safety Policy, Health and Safety Culture, Health and Safety Management, Occupational Health and Safety Performance Indicators 2022
GRI 403: Occupational Health and Safety (2018)
403-1 Occupational health and safety management system
403-2 Hazard identificationrisk assessment- and incident investigation
403-3 Occupational health services
403-4 Worker participationconsultation- and communication on occupational health and safety
403-5 Worker training on occupational health and safety
403-6 Promotion of worker health
403-7 Prevention and mitigation of occupational health and safety impacts directly linked by business relationships
403-8 Workers covered by an occupational health and safety management system
Lerøy KPIs
Sick leave (%)
Near misses (number)
Safety observations (number)
LTI - H Value
Sustainability Library 2022 - People - Occupational Health and Safety- Health and Safety Culture, Health and Safety Management, Occupational Health and Safety related Compliance
Sustainability Library 2022 - PeopleOccupational Health and Safety - Quality Management, Incident Reporting and Risk Management
Sustainability library – Policies- Policy: HSE
Sustainability Library 2022 - PeopleOccupational Health and Safety - Occupational Health and Promotion of Employees’ and Workers’ Health
Sustainability Library 2022 - PeopleOccupational Health and Safety - Employee and Worker Participation
Sustainability Library 2022 - PeopleOccupational Health and Safety - Incident Reporting and Risk Management
Sustainability Library 2022 - PeopleOccupational Health and Safety - Occupational Health and Promotion of Employees’ and Workers’ Health
Sustainability Library 2022 - PeopleOccupational Health and Safety - Incident Reporting and Risk Management
Sustainability Library 2022 - PeopleOccupational Health and Safety - Health and Safety Management, Incident Reporting and Risk management
Sustainability Library 2022 - People - Occupational Health and Safety - Occupational Health and Safety Performance Indicators 2022
Sustainability Library 2022 - People - Occupational Health and Safety - Occupational Health and Safety Performance Indicators 2022
Sustainability Library 2022 - People - Occupational Health and Safety - Occupational Health and Safety Performance Indicators 2022
Sustainability Library 2022 - People - Occupational Health and Safety - Occupational Health and Safety Performance Indicators 2022
KPI definition: Sick leave percentage – number of sick days x 100/number of possible working days
KPI definition: Number of all registered near misses in Lerøy QMS (Qualitymanagement system)
KPI definition: Number of all registered safety observations in Lerøy QMS (Quality management system)
Frequency of Injuries LTI-H = Number of Injuries with absence x 1 000 000/Total number of working hours
FOOD SAFETY
GRI 3: Material topics (2021)
3-3 Management of material topics
Sustainability Library 2022 - Social - ProductsFood safety
Sustainability Library 2022 - Social - ProductsPreparedness and recall of products
Sustainability Library 2022 - ProductsTraceability
GRI 416: Customer health and safety (2016)
416-1 Assessment of the health and safety impacts of products and ser-vices categories
416-2 Incidents of non-compliance concerning the health and safety impacts of products and services
Lerøy KPIs
Product recalls (number)
Percentage of locations with Global Gap/ASC certificate (%)
Percentage of factories with GFSI certificate (%)
Traceability tests conducted for production facilities
FOOD SECURITY
GRI 3: Material topics (2021)
3-3 Management of material topics
Lerøy KPIs
Increase production of oil- meal and ensilage (kg)
Reduction in fish on floor and unsold products (kg)
GRI 3: Material topics (2021)
3-3 Management of material topics
Sustainability Library 2022 - Products - Healthy products -Surveillance of undesirable substances and fatty acid profile
Sustainability Library 2022 - Social - Products - Preparedness and recall of products - how we measure our impact
Sustainability Library 2022 - Social - ProductsPreparedness and recall of products
Sustainability Library 2022 - Social - Group quality system - Internal audit and certifications
Sustainability Library 2022 - Social - Group quality system - Internal audit and certifications
Sustainability Library 2022 - Social - Products - Traceability
Sustainability library 2022 - EnvironmentWater and waste management - Food waste/ Food security
Sustainability Library 2022 - Policies - Food waste
Sustainability library 2022 - EnvironmentWater and waste management - Food waste/ Food security
Sustainability library 2022 - EnvironmentWater and waste management - Food waste/ Food security
Sustainability library 2022 - Governance - Results
GRI 201: Economic Performance (2016)
201-1 Direct economic value generated and distributed
Lerøy KPIs
ROCE (%)
Revenue (NOK bn)
Sustainability library 2022- Governance – Results
Sustainability library 2022- Social- Local value creation- Involvement of local communities
Sustainability library 2022 - GovernanceFinance - Targets and results
Sustainability library 2022 - GovernanceFinance - Targets and results
Disclosure
SUPPLIER MANAGEMENT
GRI 3: Material topics (2021)
3-3 Management of material topics
Response
Sustainability library 2022 - GovernanceSupplier Management
Sustainability Library 2022 - PoliciesProcurement
GRI 308: Supplier Environmental Assessment (2016)
308-1 New suppliers that were screened using environmental criteria (%)
Sustainability library 2022 - GovernanceSupplier Management - Target per KPI and results per KPI
GRI 414: Supplier Social Assessment (2016)
414-1 New suppliers that were screened using social criteria (%)
CUSTOMER PERSPECTIVE
GRI 3: Material topics (2021)
3-3 Management of material topics
Lerøy KPIs
Share of sales revenue from strategic customers
COMPLIANCE
GRI 3: Material topics (2021)
3-3 Management of material topics
GRI 206: Anti-competitive behavior
206-1 Legal actions for anticompetitive behaviour- anti-trustand monopoly practices
ANTI-CORRUPTION
GRI 3: Material topics (2021)
3-3 Management of material topics
Sustainability library 2022 - GovernanceSupplier Management - Target per KPI and results per KPI
Comment
GRI 205: Anti-Corruption (2016)
205-3 Confirmed incidents of corrup-tion and actions taken
Sustainability library 2022 - Governance-About Lerøy - Customer perspective
Sustainability library 2022 - Governance-About Lerøy - Customer perspective
Sustainability library 2022-GovernanceBusiness ethics - Compliance
Sustainability library 2022-GovernanceBusiness ethics - Compliance -Compliance Reporting
Sustainability library 2022-GovernanceBusiness ethics - Anti-Corruption
Sustainability Library 2022 - PoliciesAnti-corruption
Sustainability library 2022 – GovernanceBusiness ethics – Compliance, Compliance Reporting
Sustainability library 2022-GovernanceBusiness ethics - Anti-Corruption
LEARNING AND ORGANIZATIONAL DEVELOPMENT
GRI 3: Material topics (2021)
3-3 Management of material topics
Sustainability library 2022 - People -Organization Learning and Development
GRI 404: Training and Education (2016)
404-2 Programs for upgrading em-ployee skills and transition assistance programs
Sustainability library 2022 - People -Organization Learning and Development

We have examined whether Lerøy Seafood Group ASA has prepared a GRI Index for 2022 and measurements and reporting of ESG indicators for the period 1 January 2022 - 31 December 2022 (the Subject Matter). Our assurance engagement was conducted to obtain limited assurance.
● Lerøy Seafood Group ASA’s GRI Index for 2022 is an overview of the principles, aspects an d indicators from the GRI guidelines that Lerøy Seafood Group ASA has used to report on sustainability. The GRI Index for 2022 also contains a reference to where the material sustainability information is reported within the Annual Report 2022 or at Lerøy Seafood Group ASA’s website. Lerøy Seafood Group ASA’s GRI Index is available in the Annual Report 2022. We examined whether Lerøy Seafood Group ASA has developed a GRI Index for 2022 and whether mandatory disclosures were presented in accordance with the Standards published by The Global Reporting Initiative (www.globalreporting.org/standards) (criteria).
● ESG indicators are indicators that Lerøy Seafood Group ASA measure and control. Lerøy Seafood Group ASA has developed the indicators in line with the Sta ndards published by The Global Reporting Initiative or in line with the definitions included in the GRI index (criteria). We have for selected ESG indicators examined whether these are calculated, estimated and reported in accordance with the criteria. The ESG indicators in scope for assurance are presented on p. 240 Global Reporting Initiative Index, 2022, paragraph “External Assurance” in the Annual Report 2022.
Management’s Responsibility
Management is responsible for Lerøy Seafood Group ASA’s sustainabi lity reporting for 2022 and that the GRI Index for 2022 is developed in accordance with the Standards published by the GRI. Management is also responsible for the ESG indicators and that these are calculated, estimated and reported in accordance with the definitions given. This responsibility includes the design, implementation and maintenance of internal control relevant to the GRI Index and to enable correct calculation, estimation and reporting of the ESG indicators in the Annual Report 2022.
Our Independence and Quality Management
We have complied with the independence and other ethical requirements of the International Code of Ethics for Professional Accountants (including International Independence Standards) issued by the International Ethics Standards Board for Accountants (IESBA Code), and we have fulfilled our other ethical responsibilities in accordance with these requirements.
We apply the International Standard on Quality Management (ISQM) 1, Quality Management for Firms that Perform Audits or Reviews of Financial Statements, or Other Assurance or Related Services Engagements, and accordingly, maintain a comprehensive system of quality control including documented policies and procedures regarding compliance with ethical requirements, professiona l standards and applicable legal and regulatory requirements.
Our Responsibilities
Our responsibility is to express a conclusion on the Lerøy Seafood Group ASA’s sustainability reporting based on the procedures we have performed and the evidence we have ob tained. We conducted our limited assurance engagement in accordance with International Standard on Assurance Engagements (ISAE) 3000 revised – «Assurance Engagements other than Audits or Reviews of Historical Information», issued by the International Audit ing and Assurance Standards Board. That
PricewaterhouseCoopers AS, Sandviksbodene 2A, Postboks 3984 - Sandviken, NO-5835 Bergen
T: 02316, org. no.: 987 009 713 MVA, www.pwc.no
Statsautoriserte revisorer, medlemmer av Den norske Revisorforening og autorisert regnskapsførerselskap
standard requires that we plan and perform this engagement to obtain limited assurance about whether the Subject Matter Information is free from material misstatement.
A limited assurance engagement in accordance with ISAE 3000 involves assessing the suitability in the circumstances of management's use of the Criteria as the basis for the preparation of the Subject Matter Information, assessing the risks of material misstatement of the Subject Matter Information whether due to fraud or error, responding to the assessed risks as necessary in the circumstances, and evaluating the overall presentation of the Subject Matter Information. A limited assurance engagement is substantially less in scope than a reasonable assuran ce engagement in relation to both the risk assessment procedures, including an understanding of internal control, and the procedures performed in response to the assessed risks.
The procedures we performed were based on our professional judgment and, among others, included:
● meetings and interviews with representatives from Lerøy Seafood Group ASA responsible for the GRI Index and the ESG indicators
● evaluating internal controls and procedures for reporting ESG indicators,

● collecting and reviewing relevant supporting information and data which substantiates the calculation and estimation of selected ESG indicators,
● evaluating the completeness of the selected ESG indicators and controlling whether the calculation and estimation of the selected ESG indicators are accurate.
The procedures performed in a limited assurance engagement vary in nature and timing from, and are less in extent than for, a reasonable assuranc e engagement. Consequently, the level of assurance obtained in a limited assurance engagement is substantially lower than the assurance that would have been obtained had we performed a reasonable assurance engagement. Accordingly, we do not express a reasonable assurance opinion about whether the Subject Matter Information has been prepared, in all material respects, in accordance with the Criteria
We believe that the evidence we have obtained is sufficient and appropriate to provide a basis for our conclusion.
● Based on the procedures we have performed and the evidence we have obtained, nothing has come to our attention that causes us to believe that Lerøy Seafood Group ASA’s GRI Index for 2022 is not, in all material respects, developed in accor dance with the requirements of the Standards published by The Global Reporting Initiative;
● Based on the procedures we have performed and the evidence we have obtained, nothing has come to our attention that causes us to believe that Lerøy Seafood Group AS A’s ESG indicators are not, in all material aspects,calculated, estimated and reported in accordance with the definitions provided in the Standards published by The Global Reporting Initiative or in the GRI Index.
Hanne Sælemyr Johansen State Authorised Public Accountant
Head office Bergen, Norway
Lerøy Seafood Group ASA Thormøhlens gate 51 B
N-5006 Bergen
Telephone: +47 55 21 36 50
Email: post@leroyseafood.com
Org. no.: 975 350 940
Contact point for questions about the report or reported information: Email: anne.hilde.midttveit@leroy.no
Wild Catch and Whitefish
Lerøy Havfisk AS Keiser Wilhelmsgate 23
N-6003 Ålesund
Telephone: +47 70 11 86 00
Email: post@havfisk.no
Lerøy Norway Seafoods AS Buøyveien 7
N-8340 Stamsund
Telephone: +47 76 06 20 00
Email: : post.leroynorwayseafoods@leroy.no
Farming
Lerøy Aurora AS Kystens Hus, Stortorget 1, P.O. Box 2123
N-9267 Tromsø
Telephone: +47 77 60 93 00
Email: post@leroyaurora.no
Lerøy Midt AS Industriparken 31
N-7246 Sandstad
Telephone: + 47 72 46 50 00
Email: post@leroymidt.no
Lerøy Vest AS / Sjøtroll Havbruk AS
Skipavika 54
N-5397 Bekkjarvik
Telephone: +47 91 91 18 00
Email: firmapost@sjotroll.no
Preline Fishfarming System AS
c/o Lerøy Seafood AS
P.O. Box 7600
N-5020 Bergen
Telephone: +47 41 45 66 28
Email: bbilberg@preline.no
VAP, Sales & Distribution
Lerøy Bulandet AS
Hellersøyvegen 88
N-6987 Bulandet
Telephone: +47 57 73 30 30
Email: bulandet.fiskeindustri@bufi.no
Leröy Finland Oy
Pajakatu 2 FI-20320
Turku, Finland
Telephone: +358 2 434 9800
Email: info@leroy.fi
Lerøy Fossen AS
Reigstadveien 39
N-5281 Valestrandsfossen
Telephone: +47 56 19 32 30
Email: post@leroyfossen.no
Leroy Japan K.K.
2-27-1-201 Nishinippori
Akakawa-ku
Tokyo 116-0013, Japan
Telephone: +81 3 6712 1672
Email: info@leroy.co.jp
Lerøy Norge AS
Avd. Laks & Vildt
Stanseveien 33
0976 Oslo
Telephone: +47 22 82 18 00
Email: leroynorge@leroy.no
Lerøy Portugal Lda.
Escritorio 11/12, Marl Lugar Di Ouintanilho, Pavilhao R-07 2670-838S. Juliao Do
Tojal-Loures, Portugal
Telephone: +351 219 369 960
Email: geral@leroy.pt
Leroy Processing Spain
Cl. Artesanos No 4
28320 Pinto
Madrid, Spain
Telephone: +34 91 69 18 678
Email: info@leroyps.es
Lerøy Seafood AB
Antorpsgatan 18
SE-442 45 Kungälv, Sweden
Telephone: +46 31 85 75 00
Email: info@leroy.se
Lerøy Seafood AS
Thormøhlens gate 51 B
5006 Bergen, Norway
Telephone: +47 55 21 36 50
Email: post@leroyseafood.com
Leroy Seafood AS China Office
Room 809, Kaixuan Mansion Building B 36 Deshengmenwai Street Xicheng District, Beijing 100088 China
Telephone: +86 130 1110 5490
Email: juliana.guyu@leroy.no
Leroy Seafood Danmark
Søren Nordbysvej 27-29
9850 Hirtshals, Denmark
Telephone: +45 98 94 57 77
Email: info@seafooddanmark.dk
Leroy Seafood France
640 Commios Alley
Zone Actiparc, 62223 Saint Laurent Blangy, France
Telephone: +33 32 11 56907
Email: info@h-leroy.com
Leroy Seafood Italy S.R.L
Via del Gelso 110
Porto Viro 45014, Italy
Telephone: +39 0426 188 3366
Email: info.lsi@leroyseafood.com
Lerøy Seafoods Netherlands B.V.
Schulpengat 10, P.O. Box 54
8320 AB Urk, Netherlands
Telephone: +31 52 76 85 357
Email: finance@leroyseafood.nl
Leroy Seafood UK Ltd
Office Suite F8, Innovation Centre Innovation Way, Grimsby NE Lincolnshire DN37 9TT
United Kingdom
Telephone: +44 777 567 3280
Email: charles.boardman@leroyseafood.com
Leroy Seafood USA, Inc.
1289 Fordham Blvd., Suite 406 Chapel Hill, NC 27514, USA
Telephone: +1 919 967 1895
Telephone: +1 617 270 3400
Email: scott.drake@leroy.no
Lerøy Sjømatgruppen AS
P.O. Box 7600
N-5020 Bergen
Telephone: +47 55 21 36 50
Email: post@leroysjomatgruppen.no
Leröy Smögen Seafood AB
P.O. Box 24, SE-45625 Smögen, Sweden
Telephone: +46 52 36 67 000
Email: smogenseafood@leroy.se
Leröy Turkey
Su Urünleri San Tic A.Ş Atatürk Mah. Girne Cad. No. 33 34758 Ataşehir, Istanbul, Turkey
Telephone: +90 0216 629 0685
Email: umit.guvenc@leroy.com.tr
Sjømathuset AS
Sven Oftedalsvei 10
N-0950 Oslo, Norway
Telephone: +47 23 35 55 50
Email: post.sjomathuset@leroy.no
Associates
Norskott Havbruk AS
P.O. Box 7600
N-5020 Bergen
Telephone: +47 55 21 36 50
Email: post@leroyseafood.com
Scottish Sea Farms Ltd.
Laurel House Laurel Hill Business Park Stirling FK7 9JQ, Scotland
Telephone: +44 1786 445 521
Seistar Holding AS
Økland 12
N-5384 Torangsvåg
Telephone: +47 55 08 45 00
Email: br@seistar.no
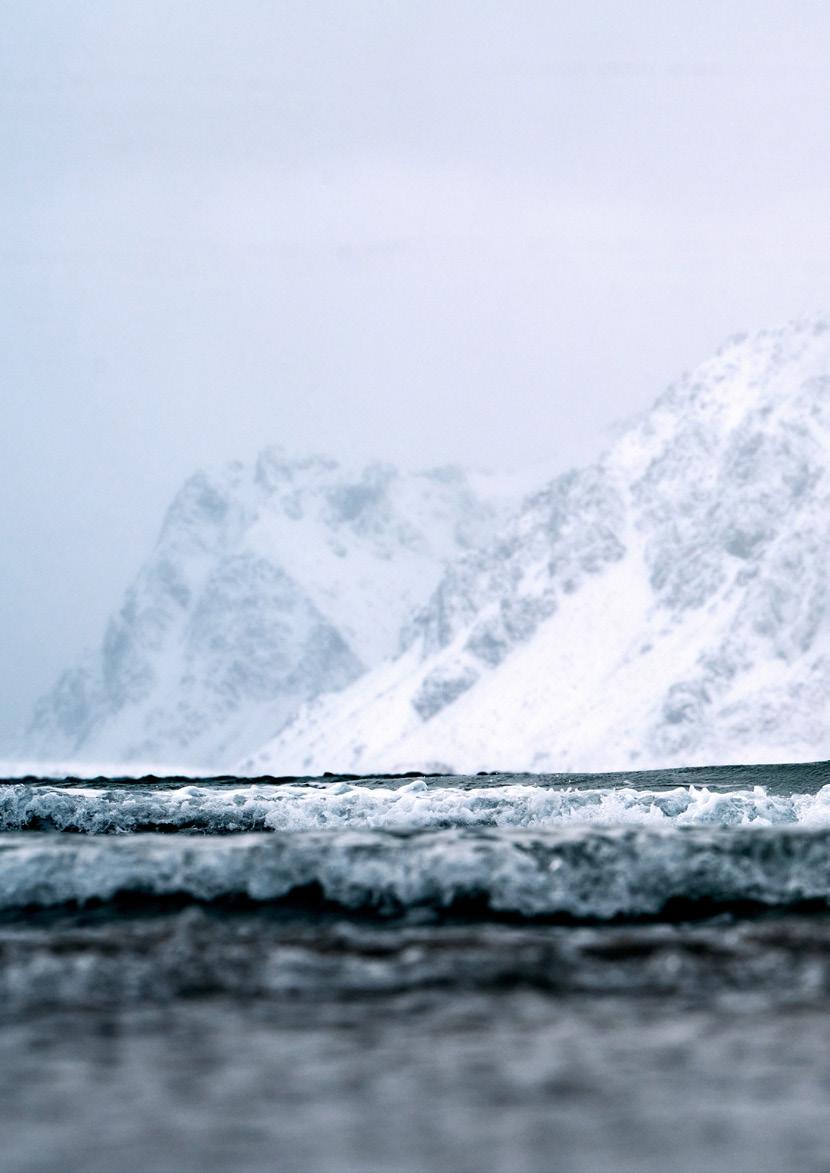
Design: Redink Vest AS
Photo: Lerøy Seafood AS
Illustration: Redink
Cover: Lerøy Seafood Group ASA
April 2023
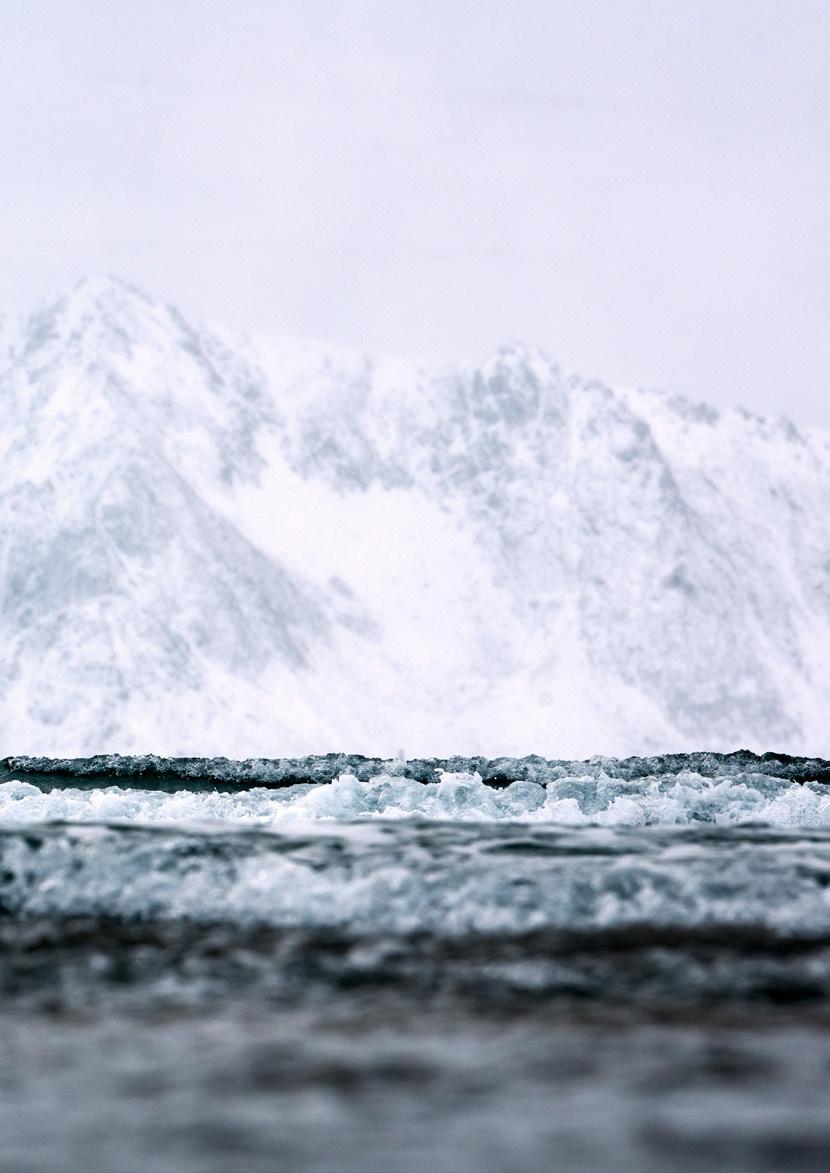
Lerøy Seafood Group ASA
Thormøhlens gate 51 B N - 5006 Bergen
leroyseafood.com
leroyseafood.com
Thormøhlens gate 51 B
N - 5006 Bergen
Lerøy Seafood Group ASA