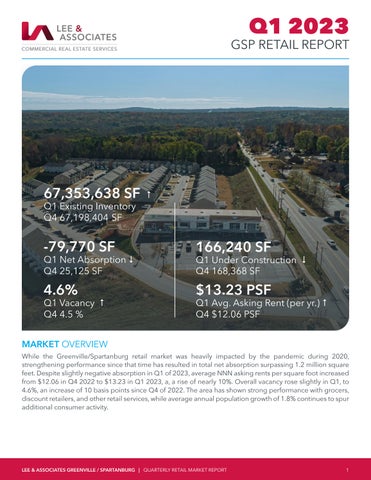
67,353,638 SF # Q1 Existing Inventory
Q4 67,198,404 SF
-79,770 SF
Q1 Net Absorption $ Q4 25,125 SF
4.6% Q1 Vacancy # Q4 4.5 %
166,240 SF
Q1 Under Construction $ Q4 168,368 SF
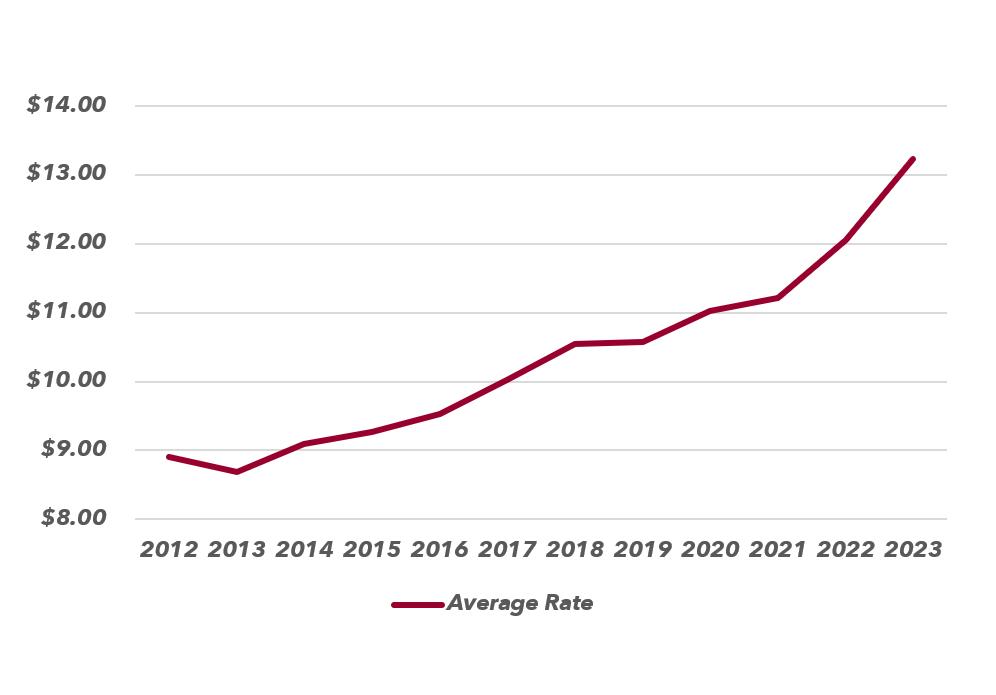
$13.23 PSF
Q1 Avg. Asking Rent (per yr.) # Q4 $12.06 PSF
MARKET OVERVIEW
While the Greenville/Spartanburg retail market was heavily impacted by the pandemic during 2020, strengthening performance since that time has resulted in total net absorption surpassing 1.2 million square feet. Despite slightly negative absorption in Q1 of 2023, average NNN asking rents per square foot increased from $12.06 in Q4 2022 to $13.23 in Q1 2023, a, a rise of nearly 10%. Overall vacancy rose slightly in Q1, to 4.6%, an increase of 10 basis points since Q4 of 2022. The area has shown strong performance with grocers, discount retailers, and other retail services, while average annual population growth of 1.8% continues to spur additional consumer activity.

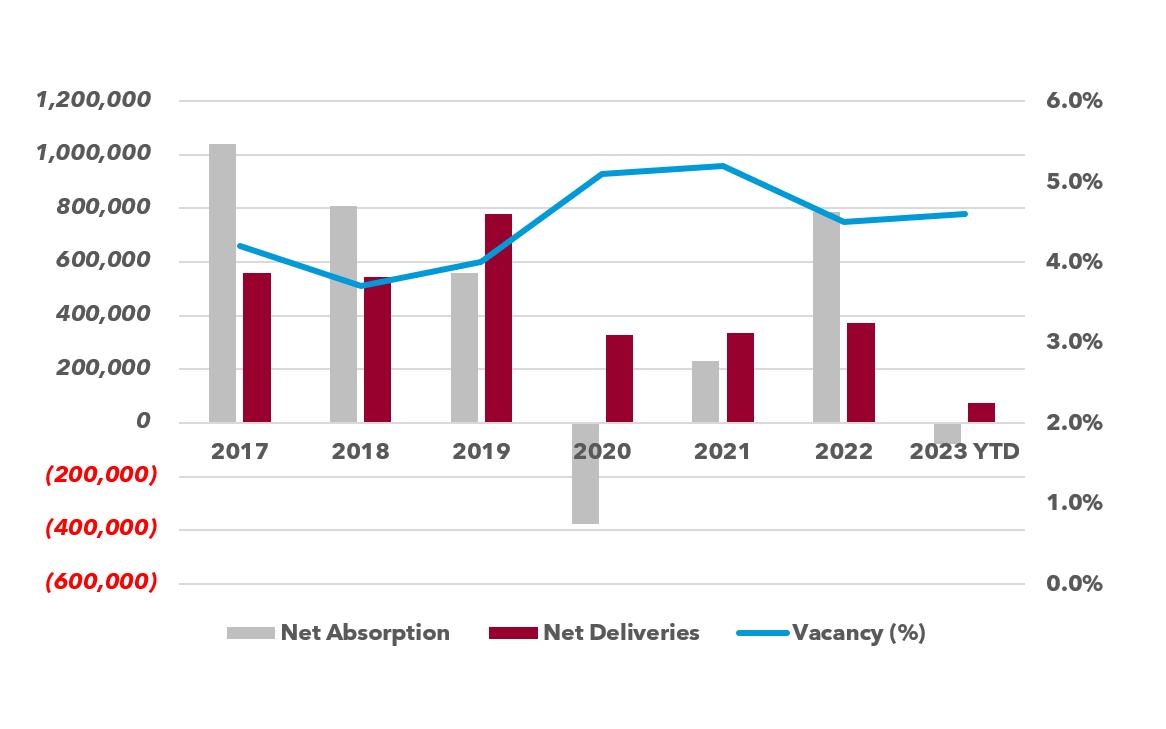
ABSORPTION
Tenant demand fell in Q1 2023 after a robust 2022, with overall net absorption totalin (79,770) SF. Greenville County continues to have a substaintial amount of absorption compared to others, posting 157,407 SF of net absorption in Q1. However, four counties suffered negative absorption in Q1: Anderson, Cherokee, Laurens, and Pickens.
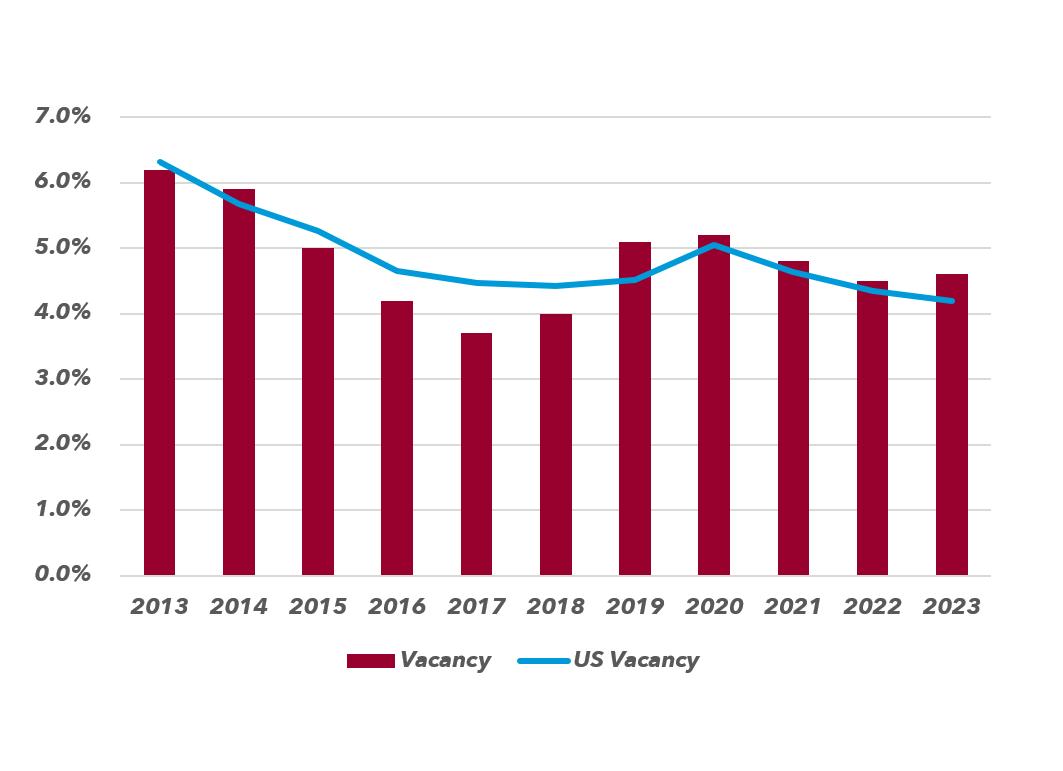
VACANCY
Vacancy rose slightly in Q1 to 4.6% after a year of consistent quarterly vacancy declines. Year-over-year vacancy is up a mere 40 basis points, an illustration of the market’s consistent performance. Greenville and Pickens Counties both boast vacancy rates under 4.0%, while Cherokee County possesses the highest rate at 7.3%.
RENTAL RATES
A lack of plentiful space options and low rates of new development activity are factors providing upward pressure on rental rates in Greenville/Spartanburg. Average asking rents rose to $13.23 PSF in Q1, up from $12.06 in Q4 of 2022 and $11.28 in Q1 2022.
DEVELOPMENT
Currently, Spartanburg (20,000 SF) and Greenville County (146,240 SF) are the only two counties with SF under construction. More than 72,000 feet delivered in Q1, the majority (70%) being located in Greenville County. The new construction is also leading to higher rents as development costs inflate.
The information and details contained herein have been obtained from third-party sources believed to be reliable, however, Lee & Associates has not independently verified its accuracy. Lee & Associates makes no representations, guarantees, or express or implied warranties of any kind regarding the accuracy or completeness of the information and details provided herein, including but not limited to, the implied warranty of suitability and fitness for a particular purpose. Interested parties should perform their own due diligence regarding the accuracy of the information. The information provided herein of properties 7,500 SF+, including any sale or lease terms, is being provided subject to errors, omissions, changes of price or conditions, prior sale or lease, and withdrawal without notice. Third-party data sources: CoStar Group, Inc. and Lee Proprietary Data. © Copyright 2023 Lee & Associates all rights reserved.
SUBMARKET MAP
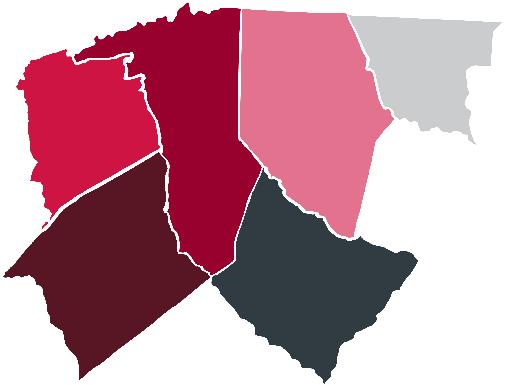
SUBMARKET BREAKDOWN
NOTABLE TRANSACTIONS
LEASED LEASED LEASED
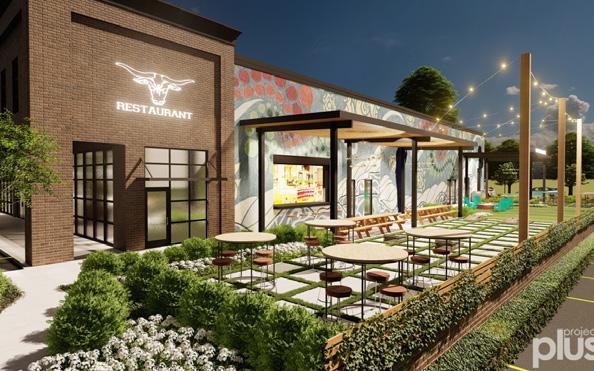
701 EASLEY BRIDGE ROAD GREENVILLE
TOTAL SF 17,028
TENANT THE PLAY CAFÉ TYPE DIRECT
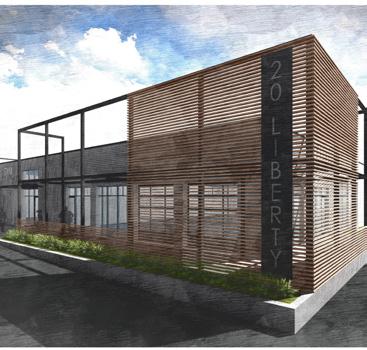
20 LIBERTY LANE LAURENS
TOTAL SF 11,123
TENANT ELITE BATTLES TYPE DIRECT
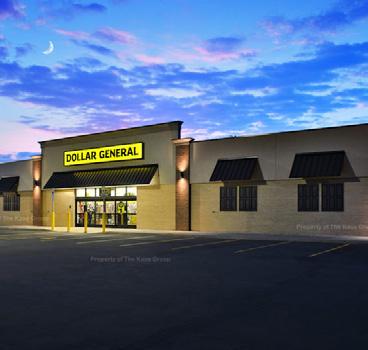
113 ODELL ROAD PICKENS
TOTAL SF 10,640
TENANT DOLLAR GENERAL TYPE DIRECT
1320 GARLINGTON ROAD GREENVILLE
TOTAL SF 50,000 DEVELOPER SIROFLEX DELIVERY DATE Q4 2023
0 BRIDGEWAY GREENVILLE
TOTAL SF 34,493 DEVELOPER HUGHES INVESTMENTS DELIVERY DATE Q3 2023
6520 STATE PARK ROAD TRAVELERS REST
TOTAL SF 17,300
DEVELOPER NEW CAROLINA HOLDINGS DELIVERY DATE Q2 2023
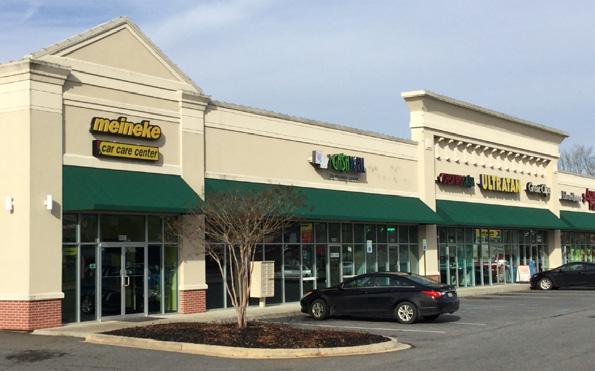
SOLD 1 E BUTLER ROAD GREENVILLE
TOTAL SF 11,336
SALE PRICE $5,060,000
RATE PER SF $446.37
BUYER LIS MAULDIN, LLC
SELLER EAST BUTLER INVS LLC
SOLD
1401-1431 W FLOYD BAKER BLVD CHEROKEE
TOTAL SF 17,000
SALE PRICE $4,050,000
RATE PER SF $238.24
BUYER MERIDIAN HEALTH SERVICES
SELLER PACIFIC WEST LAND
SOLD
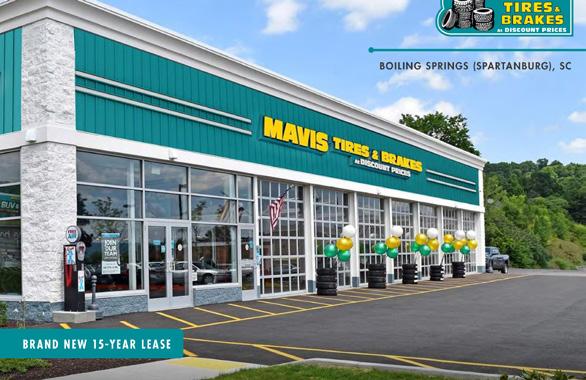
3808-3810 BOILING SPRINGS RD SPARTANBURG
TOTAL SF 6,800
SALE PRICE $3,280,000
RATE PER SF $482.35
BUYER B.A., LLC

SELLER BOILING SPRINGS LLI