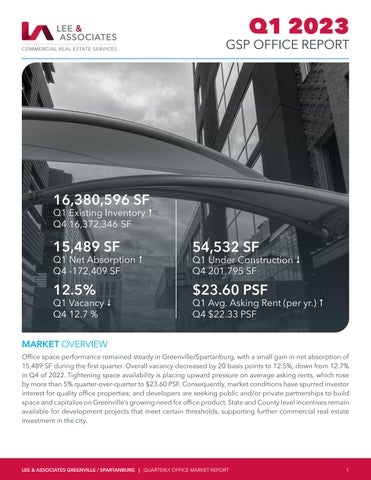
16,380,596 SF

Q1 Existing Inventory # Q4 16,372,346 SF
15,489 SF
Q1 Net Absorption # Q4 -172,409 SF
12.5% Q1 Vacancy $ Q4 12.7 %
MARKET OVERVIEW
54,532 SF
Q1 Under Construction $ Q4 201,795 SF
$23.60 PSF
Q1 Avg. Asking Rent (per yr.) # Q4 $22.33 PSF
Office space performance remained steady in Greenville/Spartanburg, with a small gain in net absorption of 15,489 SF during the first quarter. Overall vacancy decreased by 20 basis points to 12.5%, down from 12.7% in Q4 of 2022. Tightening space availability is placing upward pressure on average asking rents, which rose by more than 5% quarter-over-quarter to $23.60 PSF. Consequently, market conditions have spurred investor interest for quality office properties; and developers are seeking public and/or private partnerships to build space and capitalize on Greenville’s growing need for office product. State and County level incentives remain available for development projects that meet certain thresholds, supporting further commercial real estate investment in the city.

ABSORPTION
Net absorption totaled 15,489 SF in Q1, a small but steady gain after posting more than 300,000 SF in 2022. At the submarket level, Greenville County gained 74,036 SF worth of net occupancy gains, followed by CBD Spartanburg which posted 8,807 SF of net absorption. CBD Greenville, Anderson Couunty and Spartanburg County each recorded net occupancy losses in Q1.
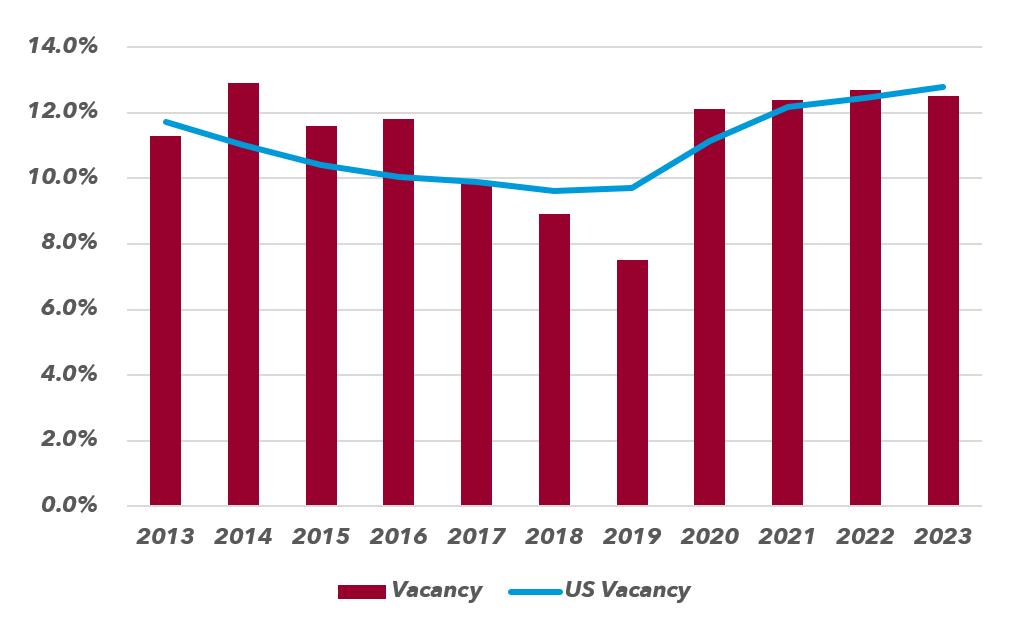
VACANCY
Overall vacancy decreased in Q1 to 12.5%, a 20 basis point (bp) decrease from the prior quarter and 60 bps higher than the rate one year ago. The Greenville County submarket has the highest vacancy (14.4%) in the market, representing 1.3 MSF of space.
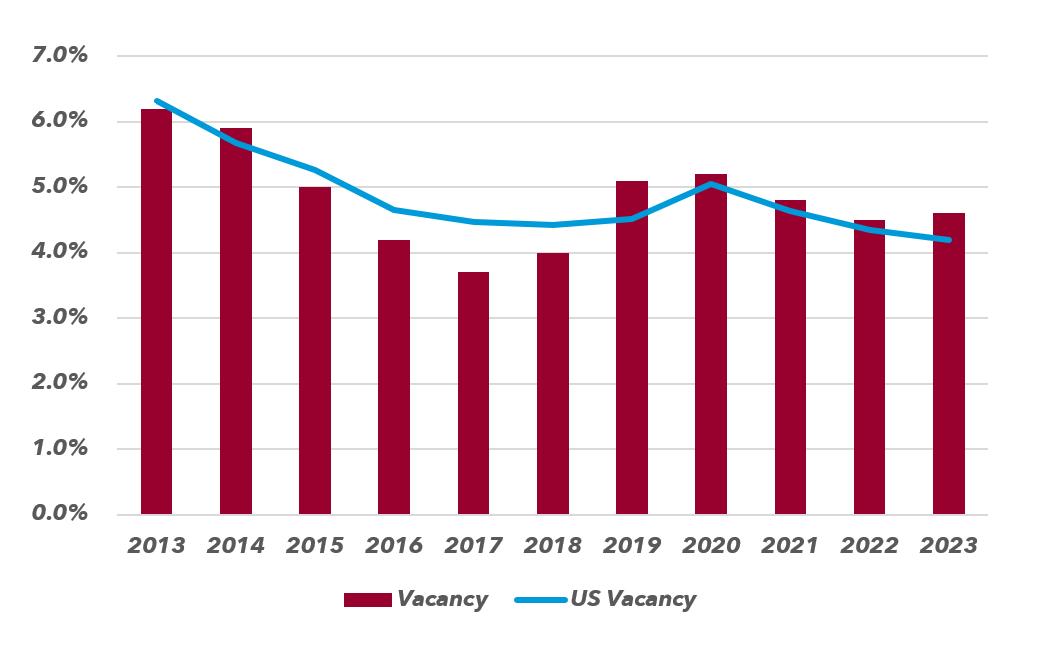
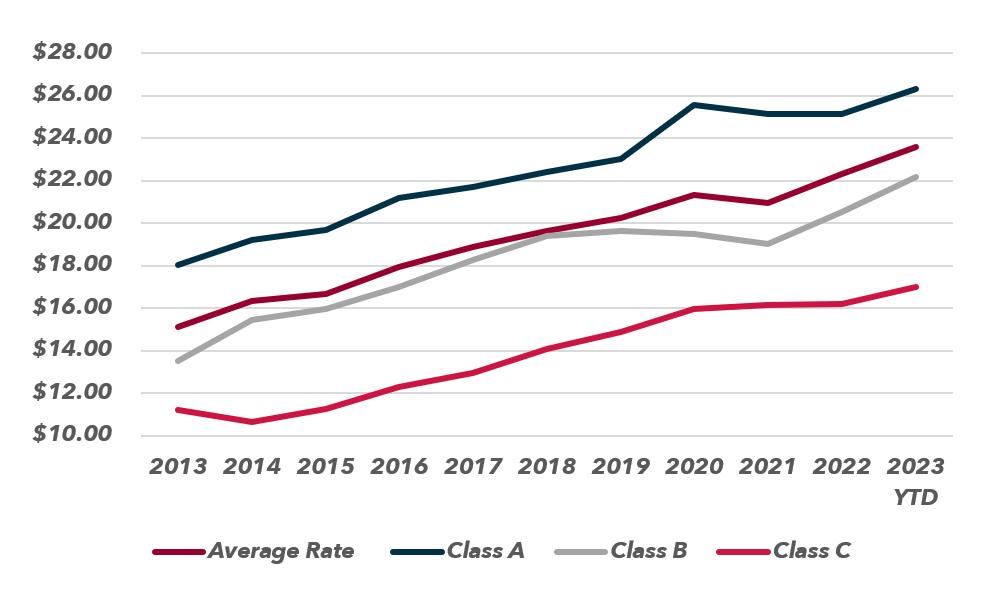
RENTAL RATES
Overall average asking rents rose to $23.60 PSF in Q1, an increase of $1.27 PSF from Q4 2022. The overall year-over-year average increased 6.5%. CBD Greenville showed significant asking rent growth, rising 3.2% quarter-overquarter, with average rents currently standing at $26.13 PSF.
DEVELOPMENT
Development activity in Greenville-Spartanburg remains low, totaling 54,532 SF in one building. Developers continue to seek public and/or private partnerships to build space and capitalize on Greenville’s growing need for office product.
The information and details contained herein have been obtained from third-party sources believed to be reliable, however, Lee & Associates has not independently verified its accuracy. Lee & Associates makes no representations, guarantees, or express or implied warranties of any kind regarding the accuracy or completeness of the information and details provided herein, including but not limited to, the implied warranty of suitability and fitness for a particular purpose. Interested parties should perform their own due diligence regarding the accuracy of the information. The information provided herein of properties 10,000 SF+, including any sale or lease terms, is being provided subject to errors, omissions, changes of price or conditions, prior sale or lease, and withdrawal without notice. Third-party data sources: CoStar Group, Inc. and Lee Proprietary Data. © Copyright 2023 Lee & Associates all rights reserved.
SUBMARKET MAP

SUBMARKET BREAKDOWN
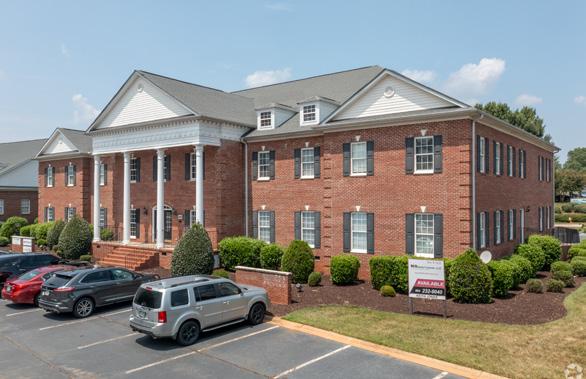
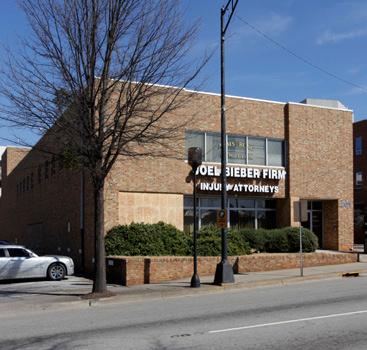
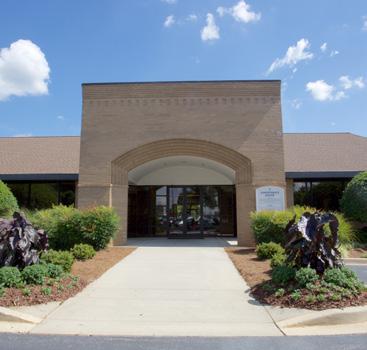
NOTABLE TRANSACTIONS
LEASED LEASED LEASED
1 RESEARCH DRIVE GREENVILLE
TOTAL SF 20,000
TENANT SOTERIA BATTERY INNOVATIONS GROUP
TYPE LEASE LANDLORD CLEMSON UNIVERSITY
3 INDEPENDENCE POINTE GREENVILLE
TOTAL SF 12,921
TENANT PROSOURCE, LLC

TYPE SUBLEASE LANDLORD TSO ICP LP.
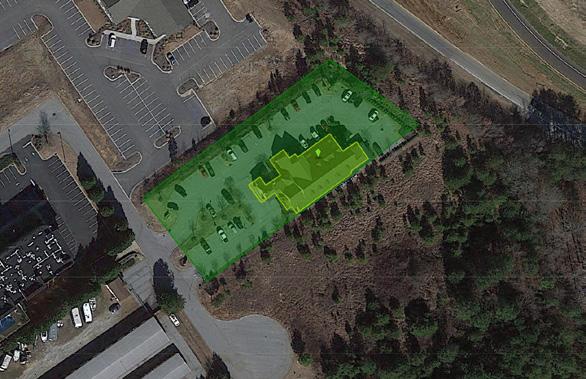
UNDER CONSTRUCTION
TOTAL SF 54,532
DEVELOPER THREE CORNERS DEVELOPMENT DELIVERY DATE 2023
201 E NORTH STREET GREENVILLE
TOTAL SF 7,020
TENANT RIVER FALLS SPA, LLC
TYPE LEASE LANDLORD WILSON FARMS COMPANY LLC
SOLD
15 SOUTHERN CENTER COURT PICKENS
TOTAL SF 7,960
SALE PRICE $2,786,188
RATE PER SF $350.02
BUYER CLEMSON EYE
SELLER GREEN TREE METALS
SOLD
3453 PELHAM ROAD GREENVILLE
TOTAL SF 15,000
SALE PRICE $1,750,000
RATE PER SF $116.67
BUYER JLB EMPIRE SELLER REAGAN REALTY GROUP
SOLD
8 SYCAMORE DRIVE GREENVILLE
TOTAL SF 8,030
SALE PRICE $825,000
RATE PER SF $102.74
BUYER KJ INVESTMENTS LLC
SELLER SYCAMORE DRIVE LLC