230,907,084 SF # Q1 Existing Inventory Q4 225,617,414 SF
4,733,619 SF Q1
8,347,446 SF Q1 Under Construction $ Q4 13,696,449 SF
$4.57 PSF Q1 Avg. Asking Rent (per yr.) $ Q4 $4.60 PSF

MARKET OVERVIEW
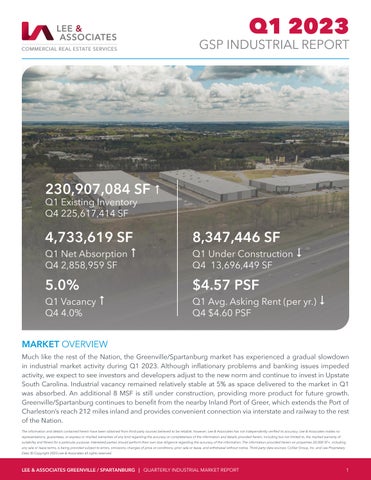
Much like the rest of the Nation, the Greenville/Spartanburg market has experienced a gradual slowdown in industrial market activity during Q1 2023. Although inflationary problems and banking issues impeded activity, we expect to see investors and developers adjust to the new norm and continue to invest in Upstate South Carolina. Industrial vacancy remained relatively stable at 5% as space delivered to the market in Q1 was absorbed. An additional 8 MSF is still under construction, providing more product for future growth. Greenville/Spartanburg continues to benefit from the nearby Inland Port of Greer, which extends the Port of Charleston’s reach 212 miles inland and provides convenient connection via interstate and railway to the rest of the Nation.
1 LEE & ASSOCIATES GREENVILLE / SPARTANBURG | QUARTERLY INDUSTRIAL MARKET REPORT
Q1 2023 GSP INDUSTRIAL REPORT
Net Absorption
Vacancy
# Q4 2,858,959 SF 5.0% Q1
# Q4 4.0%
The information and details contained herein have been obtained from third-party sources believed to be reliable, however, Lee & Associates has not independently verified its accuracy. Lee & Associates makes no representations, guarantees, or express or implied warranties of any kind regarding the accuracy or completeness of the information and details provided herein, including but not limited to, the implied warranty of suitability and fitness for a particular purpose. Interested parties should perform their own due diligence regarding the accuracy of the information. The information provided herein on properties 20,000 SF+, including any sale or lease terms, is being provided subject to errors, omissions, changes of price or conditions, prior sale or lease, and withdrawal without notice. Third-party data sources: CoStar Group, Inc. and Lee Proprietary Data. © Copyright 2023 Lee & Associates all rights reserved.
ABSORPTION
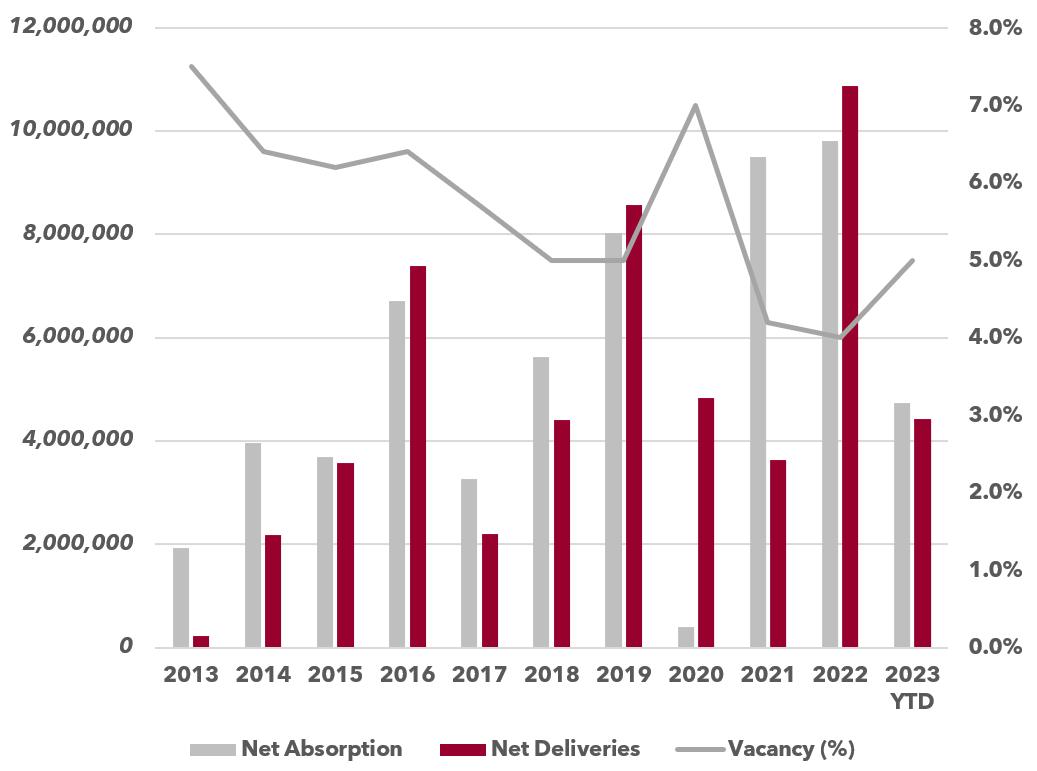
First quarter absorption in Greenville-Spartanburg totaled more than 4.7 MSF, bringing the rolling 12-month total to 12.5 MSF. The vast majority of demand occurred in the industrial warehouse sector, which claimed more than 4.2 MSF of the total absorption in Q1. The South Spartanburg submarket recorded more than 2.3 MSF of move-in activity, followed by the North Spartanburg submarket, which saw more than 1.7 MSF of net occupancy gained.
VACANCY
Overall vacancy increased in Q1 to 5.0% due to the delivery of more than 4.4 MSF of new space, some of which remained uncommitted. The new vacant space entering the market provides some relief to tenants in need of greater space options, but added upwards of 2.5 MSF to overall vacancy.
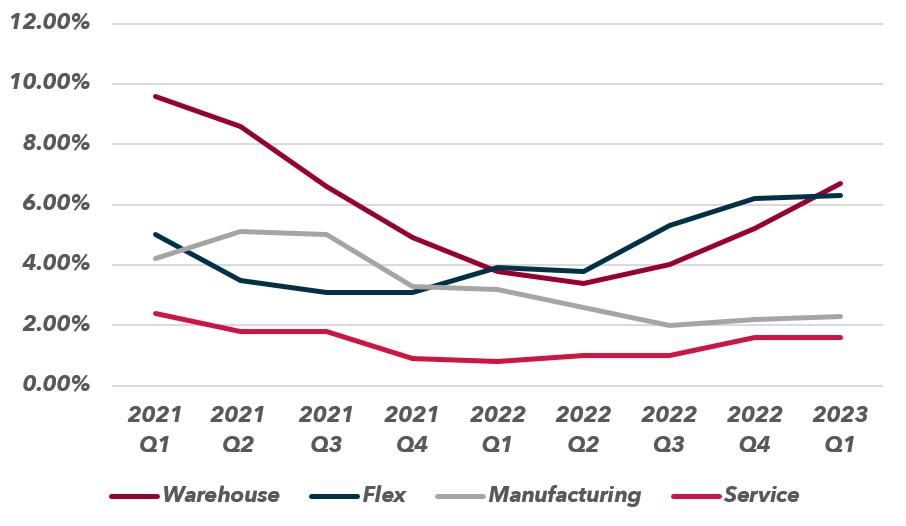
RENTAL RATES
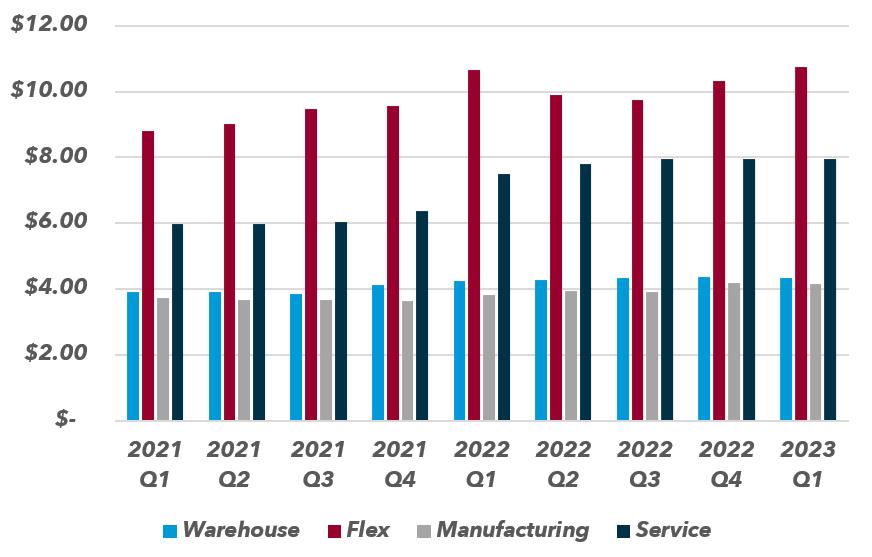
Average asking rents decreased slightly in Q1 to $4.57 PSF. This is a decrease of $.03 PSF quarter-over-quarter and a 15% increase year-over-year. Warehouse asking rents averaged $4.34 PSF, while Flex rents averaged $10.75 PSF as of Q1. A lack of broad space availability continues to place upward pressure on asking rents.
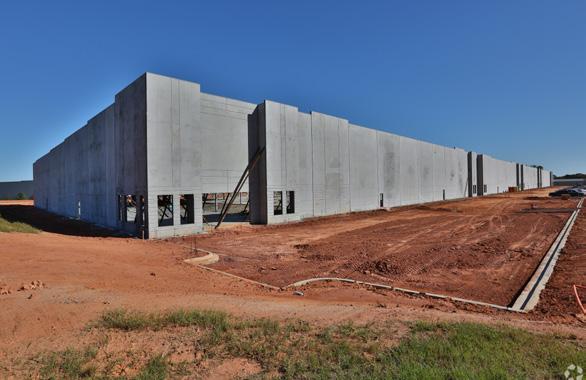
DEVELOPMENT
More than 8.3 MSF of space is under construction as of Q1. While this is a significant decline from Q4, it’s due to the delivery of more than 4.4 MSF of new space to the market. North Spartanburg (2.0 MSF), Hwy 290 (1.95 MSF) and Greer/ Hwy 101 (1.8 MSF) are the most active submarkets for new construction activity.

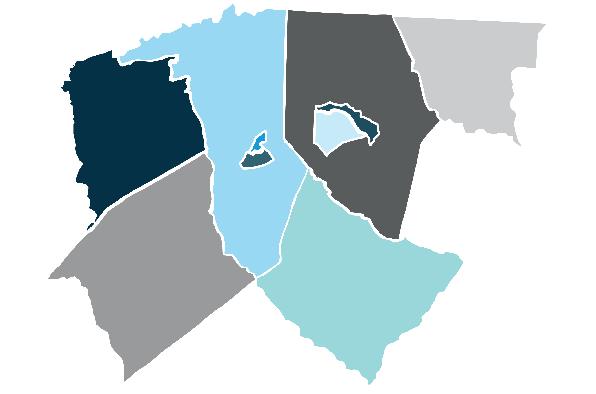
MAP
Q1 2023 GSP INDUSTRIAL REPORT 2 LEE & ASSOCIATES GREENVILLE / SPARTANBURG | QUARTERLY INDUSTRIAL MARKET REPORT
ABSORPTION & DELIVERIES VACANCY RATES GREENVILLE RENTAL RATES COMPARISON 1 2 5 6 7 8 9 10 11 4 3 12 1 2 5 4 6 7 8 9 10 11 12
ANDERSON CO. CHEROKEE CO. E. GREENVILLE N. GREENVILLE S. GREENVILLE PICKENS CO. S. SPARTANBURG N. SPARTANBURG LAURENS COUNTY GREER | HWY 101 CORRIDOR
SUBMARKET
SUBMARKET BREAKDOWN
3 LEE & ASSOCIATES GREENVILLE / SPARTANBURG | QUARTERLY INDUSTRIAL MARKET REPORT SUBMARKET EXISTING INVENTORY VACANCY YTD NET ABSORPTION UNDER CONSTRUCTION SF Total RBA Total SF Vac % Anderson Co. 27,508,570 1,767,586 6.4% (123,650) 0 Cherokee Co. 12,560,198 706,768 5.6% (211,400) 0 Downtown Greenville 2,753,517 57,581 2.1% (1,914) 0 E. Greenville 13,039,715 710,643 5.4% (13,179) 305,500 N. Greenville 19,663,412 229,401 1.2% 50,143 0 S. Greenville 37,289,745 2,383,159 6.4% 820,129 1,624,820 Greer | Hwy 101 Corridor 21,802,361 757,233 3.5% 404,231 1,809,763 Hwy 290 Corridor 10,301,049 283,226 2.7% (119,105) 1,953,720 Laurens Co 13,629,404 25,000 0.2% 0 0 N. Spartanburg 46,742,437 3,876,857 8.3% 1,727,421 2,027,955 S. Spartanburg 19,038,261 475,143 2.5% 2,392,689 625,688 Pickens Co. 6,578,415 237,437 3.6% (191,746) 0 TOTAL 230,907,084 11,510,034 5.0% 4,733,619 8,347,446
Q1 2023 GSP INDUSTRIAL REPORT
PERIOD EXISTING INVENTORY VACANCY YTD NET ABSORPTION UNDER CONSTRUCTION SF Total RBA Total SF Vac % 2023 Q1 135,723,826 9,076,034 6.7% 4,720,227 6,841,606 2022 Q4 128,338,478 6,642,523 5.2% 6,095,660 10,689,109 2022 Q3 126,698,249 5,009,454 3.1% 5,660,293 12,943,026 MANUFACTURING PERIOD EXISTING INVENTORY VACANCY YTD NET ABSORPTION UNDER CONSTRUCTION SF Total RBA Total SF Vac % 2023 Q1 84,918,309 1,950,424 2.3% 470,407 1,505,840 2022 Q4 86,990,433 1,878,255 2.2% 3,826,338 1,505,840 2022 Q3 84,347,308 1,723,405 2.0% 1,377,397 4,109,631 FLEX PERIOD EXISTING INVENTORY VACANCY YTD NET ABSORPTION UNDER CONSTRUCTION SF Total RBA Total SF Vac % 2023 Q1 6,792,662 427,273 1.6% (7,015) 0 2022 Q4 6,816,216 425,986 6.2% (102,174) 1,501,500 2022 Q3 6,847,576 365,940 5.3% (99,128) 1,501,500 SERVICE PERIOD EXISTING INVENTORY VACANCY YTD NET ABSORPTION UNDER CONSTRUCTION SF Total RBA Total SF Vac % 2023 Q1 3,472,287 56,303 1.6% 0 0 2022 Q4 3,472,287 56,303 1.6% (20,303) 0 2022 Q3 3,472,287 34,000 1.0% 2,000 0
WAREHOUSE
Q1 2023 GSP INDUSTRIAL REPORT
NOTABLE TRANSACTIONS
1201 WOODS CHAPEL ROAD GREER / HWY 101 CORRIDOR
TOTAL SF 157,581
TENANT MAGNA SEATING OF AMERICA
TYPE DIRECT
2071 FRYML DRIVE N. SPARTANBURG
TOTAL SF 110,284
TENANT COOPER STANDARD TYPE DIRECT
2701 HIGHWAY 56 S. SPARTANBURG
TOTAL SF 72,705
TENANT LANCASTER SCHUERMANN DISTRIBUTION
TYPE DIRECT
SPARTAN ENTERPRISE PARK I N. SPARTANBURG
TOTAL SF 1,009,962
DEVELOPER NORTHPOINT DEVELOPMENT
DELIVERY DATE Q4 2023
ENTERPRISE 85 INDUSTRIAL PARK S. GREENVILLE
TOTAL SF 1,006,880
DEVELOPER SUNCAP PROPERTY GROUP DELIVERY DATE Q2 2023
TYGER RIDGE LOGISTICS I GREER / HWY 101 CORRIDOR
TOTAL SF 498,960
DEVELOPER PANATTONI DEVELOPMENT GROUP
DELIVERY DATE Q2 2023
915 VICTOR HILL ROAD GREER / HWY 101 CORRIDOR
TOTAL SF 297,607
SALE PRICE $29,000,000
RATE PER SF $97.44
BUYER STREAM REALTY PARTNERS SELLER CHILDRESS KLEIN
1172 BRACKEN ROAD S. GREENVILLE
TOTAL SF 266,777
SALE PRICE $23,209,599
RATE PER SF $87.00
BUYER DALFEN INDUSTRIAL SELLER THE KEITH CORPORATION
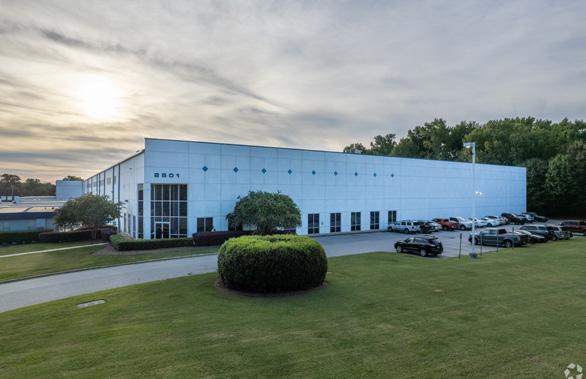
2501 S HIGHWAY 101 GREER / HWY 101 CORRIDOR
TOTAL SF 222,710
SALE PRICE $22,462,500
RATE PER SF $100.86
BUYER BENORE LOGISTICS SYSTEMS SELLER STAG INDUSTRIAL
4 LEE & ASSOCIATES GREENVILLE / SPARTANBURG | QUARTERLY INDUSTRIAL MARKET REPORT
SOLD
SOLD
SOLD
UNDER CONSTRUCTION UNDER CONSTRUCTION UNDER
CONSTRUCTION
LEASED LEASED LEASED

Q1 2023 GSP INDUSTRIAL REPORT 5 LEE & ASSOCIATES GREENVILLE / SPARTANBURG | QUARTERLY INDUSTRIAL MARKET REPORT WISE GUIDANCE. LOYAL TO YOU. leegreenville.com | 864.704.1040 101 W. Court Street, Suite A, Greenville, SC 29601 320 East Main Street, Suite 430, Spartanburg, SC 29302