August 2023

Monthly Market Monitor
Content The Back Page Asset classes 20 Macro Radar Taking the pulse of economic activity 6 Asset Allocation Notes from the Investment Committee 10 Agenda 21 In a Nutshell 4 Theme in Focus Bad timing?! –The magazine cover indicator 13 Satellite View Gas price shock, one year on… 8 Drawdown Quality: One factor speaks for itself 16 Kaiser Partner Privatbank AG | Monthly Market Monitor - August 2023 3
Chart of the Month
In a Nutshell
Our view on the markets
The recession that hasn’t arrived (thus far)
A recession still has yet to arrive in the USA. The effects of the tightened monetary policy are unlikely to pose a serious risk to economic activity there until 2024. In Europe and China, however, economic headwinds are already blowing much more harshly today. There are mounting signs now that China will temporarily resume putting a higher priority on economic growth.
Gas price shock, one year on…
Things are never as bad as they seem (especially when natural gas prices have gotten much cheaper in the meantime). One year after the natural gas price shock in Europe, a preliminary stocktaking of the situation can now be conducted. It turns out that last summer’s fearmongering about a looming natural gas supply shortage was greatly exaggerated in part and that market forces worked effectively. The EU gas price cap has remained merely a theoretical construct thus far and is again unlikely to be triggered during the upcoming heating season.
Unabated momentum (as yet)
The final interest-rate hike is not necessarily a harbinger of the next crash. In five of the last eight Fed rate-hiking cycles since 1980, the S&P 500 index was up 12 months after the final rate hike. Investors, however,
should curb their exuberance because the majority of market participants right now are exactly that: profusely bullish. Short-term setbacks on equity markets are possible at any time – the disappointment potential needed to make them happen is existent in any case.
Quality: One factor speaks for itself
Everyone would like to have “good” stocks in his or her portfolio. But what actually makes for a good stock? For stocks with a high “quality” factor, the name says it all. Those stocks combine security and consistency with an attractive return, and they seemingly turn finance theory on its head. But investors shouldn’t lose their heads over them. There is no such thing as a free lunch, so quality stocks should only be one part of an investor’s menu.
Bad timing?! – The magazine cover indicator
The human psyche often stands in the way of retail investors achieving success, but finance pros and financial journalists also aren’t immune to the pitfalls of (crowd) psychology. Prominent cover stories in financial and news magazines are often a reflection of moods and positionings on the global stock market merry-go-round. The magazine cover indicator has a remarkable track record and belongs in every investor’s toolbox.
“Climate change is out of control,” UN Secretary-General António Guterres said in a strongly worded statement commenting on the record hot days in early July. The average global daily temperature topped 17 degrees Celsius for the first time since monitoring began in 1979. It then stayed at that level for a full 12 consecutive days. Regardless of whether in the United States, North Africa, the Middle East, or China, searing heat waves have swept across many places in recent weeks. It has been unusually warm lately even in Antarctica, where it’s actually winter right now. This sweltering situation is being exacerbated this year by the El Niño effect, which was last observed in 2016, when it caused the hottest year ever recorded up to that time. Regularly recurring record-breaking temperatures are pushing the goal of limiting global warming to 1.5°C increasingly out of reach. Resignation is not an option, however. On the contrary, climate protection efforts must be stepped up further.
Hottest July on record | Climate change in real time Average daily temperature two meters above the Earth’s surface, in degrees Celsius Sources: climatereanalyzer.org, Kaiser Partner Privatbank 11 12 13 14 15 16 18 2023 2022 1979-2000 mean minus 2σ plus 2σ Jan Feb Mar Apr May Jun Jul Aug Sep Oct Nov Dec
One year after the natural gas price shock in Europe, a preliminary stocktaking of the situation can now be conducted.
Monthly Market Monitor - August 2023 | Kaiser Partner Privatbank AG 4

Kaiser Partner Privatbank AG | Monthly Market Monitor - August 2023 5
More and more economists are once again daring to talk about a potential soft landing. We, too, are optimistic and think that a recession won’t become an issue until 2024.
Macro Radar Taking the pulse of economic activity
A recession still has yet to arrive in the USA. The effects of the tightened monetary policy are unlikely to pose a serious risk to economic activity there until 2024. In Europe and China, however, economic headwinds are already blowing much more harshly today. There are mounting signs now that China will temporarily resume putting a higher priority on economic growth.
The recession that hasn’t arrived (thus far)
The US Leading Economic Index fell in June for the 15th month in a row. In light of this slumping indicator of economic activity, which has consistently been a reliable barometer in the past, the Conference Board is forecasting that the US economy will be in a recession from the third quarter onward. Meanwhile, however, a number of other macroeconomic data prints are pointing to a US economy that is still in robust shape. That’s why more and more economists are once again daring to talk about a potential soft landing. We, too, are optimistic and think that a recession won’t become an issue until 2024. But we also remain of the opinion that a recession will ultimately be unavoidable.
Stagnation in the Eurozone
The Eurozone has skirted a recession thus far, but the recent renewed round of disappointingly weak purchasing managers’ index readings portends a continuation of economic stagnation for the second half of this year. Not only is the very weak manufacturing sector acting as a brake on economic activity, but growth dynamics in the services sector are slowing as well. The effects of that on inflation are logical: prices of goods by now are in the midst of a rapid disinflation process. However, given substantial wage growth, it will likely take a longer time before the European Central Bank’s 2% inflation target moves back within eyeshot.
Last interest-rate hikes in the can?
There were no surprises at the central-bank policy meetings in late July. The US Federal Reserve raised its benchmark lending rate to 5.5% and the ECB ratcheted up its deposit rate to 3.75%. The remainder of the screenplay hasn’t been finalized yet, but at the moment there’s a lot suggesting that rate-hiking is now over in the USA. In Frankfurt, meanwhile, monetary policy hawks and doves look set to tussle over a final rate hike in September.
China’s charm offensive
China’s economy lost considerable momentum in the second quarter, growing just 0.8% compared to the prior quarter. China’s Politburo signaled that it will now resume putting a higher near-term priority on stabilizing economic growth. The recent marketing campaigns by a number of local governments promoting China as a great place to do business and the recent meeting between China’s top financial market regulator and the big names in the international private equity industry also fit with this picture. This charm offensive seems urgently necessary because inward foreign direct investment into China plummeted by around 75% in the second half of 2022.
No longer synchronous | America surprising on the upside and Europe on the downside Economic Surprise Indices
Sources: Bloomberg, Kaiser Partner Privatbank
-200 -100 0 100 200 2021 2022 2023 USA Eurozone
Monthly Market Monitor - August 2023 | Kaiser Partner Privatbank AG 6
Kaiser Partner Privatbank interest rates view

Consensus estimates 2023 2024 2025 GDP growth (in %) Switzerland 0.8 1.4 1.6 Eurozone 0.5 1.0 1.6 UK 0.2 0.6 1.5 USA 1.6 0.6 1.9 China 5.2 4.8 4.6 Inflation (in %) Switzerland 2.3 1.6 1.4 Eurozone 5.4 2.5 2.1 UK 7.5 3.0 2.0 USA 4.0 2.5 2.3 China 0.9 2.0 2.0
Last 3M 12M Key interest rates (in %) Switzerland 1.75 ↗ ↗ Eurozone 3.75 ↗ ↗ UK 5.00 ↗ ↗ USA 5.50 → → China 2.65 → → 10-year yields (in %) Switzerland 1.01 → ↘ Eurozone 2.54 → ↘ UK 4.36 → ↘ USA 4.02 → ↘ China 2.67 → → Kaiser Partner Privatbank AG | Monthly Market Monitor - August 2023 7
Satellite View
Gas price shock, one year on…
Things are never as bad as they seem (especially when natural gas prices have gotten much cheaper in the meantime). One year after the natural gas price shock in Europe, a preliminary stocktaking of the situation can now be conducted. It turns out that last summer’s fearmongering about a looming natural gas supply shortage was greatly exaggerated in part. It can also be concluded that market forces worked effectively. The EU gas price cap has remained merely a theoretical construct thus far and is again unlikely to be triggered during the upcoming heating season.
Merely a technical recession
In late August 2022, the complete shutoff of Russian natural gas shipments through the Nord Stream 1 pipeline caused the price of European gas (TTF) to rocket to an intermittent peak of almost EUR 350 per megawatt hour. The panic that broke out among industry associations, labor unions, and economists (and politicians) in Germany, a country heavily dependent on natural gas from Russia, had already reached its climax a few weeks beforehand when drastic horror scenarios were making the rounds. The most pessimistic forecasts projected a 6% to 12% contraction in German economic output in the event of a complete absence of natural gas shipments. One is always wiser in hindsight – in the meantime, we now know that Germany went through only a tiny (technical) recession in the 2022/23 winter half-year. Reality thus validated the faction of much more levelheaded economic researchers who back in spring 2022 had rated a severance of energy ties with Russia as being manageable1
The market regulates everything a lot of things itself
In retrospect, the (German) market economy proved to be much more robust and adaptable than many had feared. Companies did some switching to other fuels (e.g. coal) or to products with an elevated energy content (urea). Moreover, stepped-up imports of European liquified natural gas (LNG) replaced approximately half of the previous imports of Russian natural gas. Households likewise modified their consumption behavior and lowered their natural gas use by 12% (compared to the average consumption volume for the 2019–2021 period). Dreaded “cascade effects”, in contrast, were not observed in Germany. Whereas production in energy-intensive sectors such as chemicals and glass plummeted, industrial output in other sectors was hardly affected. The decision by German policymakers to eschew a natural gas price cap unlike other European countries proved to be the right move. The (high) price by itself played a key steering role in the adaptive behavior outlined above. The swift action taken by Ger-
Sources:
0 50 100 150 200 250 300 350 2022 2023 2021
The natural gas market works… | …even without a price cap Benchmark European natural gas (TTF) futures price, in EUR per MWh
Bloomberg, Kaiser Partner Privatbank
In retrospect, the (German) market economy proved to be much more robust and adaptable than many had feared.
Monthly Market Monitor - August 2023 | Kaiser Partner Privatbank AG 8
many’s Federal Ministry for Economic Affairs to procure gas shipments from other countries in place of Russia and to build out LNG capacity was equally as helpful.
A study by B. Moll, M. Schularick, and G. Zachmann2 found that market participants’ adaptability would have averted a natural gas shortage even if Germany had voluntarily renounced all gas imports from Russia from April 1, 2022, onward. Even the oft-cited “luck” factor – in the sense of a warmer-than-average winter – to which the gentle economic outcome is frequently attributed was not a crucial element, according to the authors of the study. A different study by economists at the International Monetary Fund (IMF)3 also corroborates how important a functioning (global) market is. The study found that the existence of a global LNG market makes the total cost of a Russian gas boycott against Europe only one-third as high as it would be in a scenario in which there were no fallback alternatives.
The current (scorching) summer is just months away from the next (…) winter
Even though heating isn’t necessarily on one’s mind right now in the midst of yet another record hot summer, any examination of the natural gas issue ultimately also has to peer into the future, which looks rather good when viewed objectively. Natural gas has recently been trading at a price below EUR 30 per megawatt hour, and Germany’s gas storage facilities are alrea-
No stress this time | Storage facilities are already well filled
Natural gas storage fill level in Germany
dy over 80% full at this early stage of the year. They could be 100% full by the start of autumn. So, the EU gas price cap at EUR 180 per megawatt hour is again unlikely to be triggered next winter in all probability and looks set to remain merely a theoretical construct. Relief for the European supply situation during the upcoming heating season is coming from China of all places, which competes with the EU for existing LNG production capacity on the world market. According to data from analytics firm ICIS, the People’s Republic will import around 73 million tons of liquefied natural gas in 2023, 6 million tons less than in 2021. The reasons for that are increased Chinese imports of pipeline gas from Russia, China’s economy’s weak recovery from the COVID-19 trough, and the country’s avid signing of long-term LNG supply contracts, which should result in China haggling less often with other countries on the spot market for available LNG allotment quotas. The amount of LNG that China will import less of this year than in 2021, according to the forecast by ICIS, appears to be of little consequence at first glance. After all, the world market for liquified natural gas comprises a total annual volume of 405 million tons. However, those 6 to 7 million tons mentioned above make up approximately 10% of Germany’s annual natural gas consumption. In a tight worldwide market for natural gas, this can already tip the scales as to whether there will be heavy volatility in price signals.
Relief for the European supply situation during the upcoming heating season is coming from China of all places, which competes with the EU for existing LNG production capacity on the world market.
Sources: Gas Infrastructure Europe, Kaiser Partner Privatbank
*1) Rüdiger Bachmann et al. (2022): “Was wäre, wenn...?
Die wirtschaftlichen Auswirkungen eines Importstopps russischer Energie auf Deutschland”
*2) Benjamin Moll, Moritz Schularick, Georg Zachmann (2023):
“Nicht einmal eine Rezession: Die grosse deutsche Gasdebatte im Rückblick”
*3) Silvia Albrizio et al. (2023): “Sectoral Shocks and the Role of Market Integration: The Case of Natural Gas”
20% 40% 60% 80% 100% 2022 2023 Jan Mar May Jul Sep Nov
Kaiser Partner Privatbank AG | Monthly Market Monitor - August 2023 9
A look at historical performance data reveals that a final rate hike (and a restrictive interest-rate level) does not necessarily portend an imminent end to the equity rally.
Asset Allocation
Notes from the Investment Committee
The final interest-rate hike is not necessarily a harbinger of the next crash. In five of the last eight Fed rate-hiking cycles since 1980, the S&P 500 index was up 12 months after the final rate hike. Investors, however, should curb their exuberance because the majority of market participants right now are exactly that: profusely bullish. Short-term setbacks on equity markets are possible at any time.
Insurance-linked bonds
Alternative Assets
Convertible bonds Gold
Duration
Currencies
US dollar
Real estate
Hedge funds
Structured products
Swiss franc Private equity
Euro Private credit
British pound 07/2023
Equities: Unabated momentum (as yet)
• As anticipated, the US Federal Reserve ratcheted up its benchmark lending rate in late July to 5.5%, the highest level in 22 years. Fed Chairman Jerome Powell reiterated that real interest rates are now well in positive territory. We expect to see a lengthy pause in policy-rate movements in the USA in the quarters ahead. A look at historical performance data reveals that a final rate hike (and a restrictive interest-rate level) does not necessarily portend an imminent end to the equity rally. After all, in five of the last eight Fed rate-hiking cycles since 1980, the S&P 500 index was up 12 months after the final rate hike. Upward momentum on stock markets usually persists for longer than the bears expect.
• However, the long-prevailing bearishness among investors recently has turned into increasing bul
lishness, as evidenced by regularly conducted sentiment surveys as well as by positioning data and put-to-call ratios. The Fed also has become more bullish and no longer expects to see a recession.
Some of the biggest bears among Wall Street analysts have even thrown in the towel lately and have acknowledged that their market views had long
Scorecard - +
Macro
Monetary/fiscal policy
Corporate earnings
Valuation
Trend
Investor sentiment
been overly pessimistic. These signals should set off alarm bells for countercyclical-minded investors. In our opinion, now at least is not the right time to configure equity exposure even more offensively than before because a short-term market setback could occur at any time.
• There is plenty of potential for disappointments. The majority of companies have beaten analysts’ estimates in the ongoing reporting season for the second quarter, as so often happens, but the (positive) reactions to the good numbers have been rather muted in recent weeks. However, there has also been a large number of profit warnings. Consequently, the earnings estimate revision ratio has been tilting to the downside lately. After cor-
-
Asset Allocation Monitor - + - + Cash Equities Fixed Income Global Sovereign bonds Switzerland 07/2023 Corporate bonds Europe Microfinance UK Inflation-linked bonds USA High-yield bonds Japan Emerging-market bonds Emerging markets
Monthly Market Monitor - August 2023 | Kaiser Partner Privatbank AG 10
porate earnings bottomed out last quarter, analysts now expect to see an 8% increase in aggregate profits in the USA for the second half of this year. This projection could prove overly optimistic.
Fixed income: High-yield bonds are vulnerable
• The rally on equity markets and the brightening of sentiment have also been reflected on fixed-income markets in recent weeks. Credit spreads on US highyield bonds, for instance, have recently been at their lowest since April 2022. This stands in stark contrast to credit defaults, which have increased considerably year-to-date in both the syndicated leveraged loans segment and the high-yield sector. More and more companies are having trouble shouldering higher refinancing costs, which have risen massively in some cases. The longer this trend continues, the less likely it becomes that the financial market can keep on ignoring it. Against this backdrop, investors should refrain in the near term from jumping on the high-yield bond bandwagon.
• We continue to prefer government bonds in the fixed-income space. Even though the risk of a US recession doesn’t look set to gradually increase until next year, the sovereign bonds asset class is already a good hedge today against an adverse economic scenario. Timing is a tough game not just with regard to stocks, but with bonds as well – the market is likely to prematurely anticipate a deterioration of the macroeconomic climate. Moreover, further downside potential for government bond prices and further upside potential for sovereign yields is constrained by the rate-hiking cycle that is drawing to an end and by subsiding inflation.
Alternative assets: Gold is waiting for a recession
• The price of gold edged upward in July, but this was more a consequence of the very weak US dollar than a sign of intrinsic strength. Rapidly receding inflation rates (in the USA) and a corresponding surge in real interest rates are creating a stiff headwind for the yellow precious metal. The prospect of gold surpassing its all-time high of around USD 2,075 per ounce is hardly realistic in the months ahead – a continued rangebound trajectory is much
more probable. A recession next year could provide the crucial impetus for a breakout above the key technical resistance on gold’s price chart. Private credit remains our favorite alternative asset class at the moment. Private credit currently combines offensive (double-digit) yield potential with defensive attributes and looks set to deliver attractive returns even in a weaker economic scenario.
Currencies: The Swiss franc is getting stronger and stronger
• EUR/USD: The EUR/USD exchange rate hit a new year-to-date high above 1.12 in July. The forex market currently sees a bit more rate-hiking potential in the Eurozone than in the USA. This interest-rate speculation could continue to drive the euro in the near future because although the Eurozone is in much weaker economic shape than the USA at the moment, the US dollar is still comparatively richly valued. If the valuation correction continues, an EUR/USD exchange rate of 1.20 is even conceivable on a longer-term 24-month horizon.
• GBP/USD: An interest-rate level that is continually becoming more attractive and a cheap valuation are the ingredients fueling an ongoing appreciation also of the British pound against the greenback this year. The path of least resistance continues to point upward for sterling. The restoration of a certain degree of stability in British politics has also contributed in the meantime to the pound now being considered investable again.
• EUR/CHF: The Swiss franc has appreciated dynamically against the euro and the US dollar over the past month. The EUR/CHF exchange rate’s all-time low last autumn in the 0.94– 0.95 range has moved back into sight in the meantime. The support at this level will likely hold on the first attempt to breach it. However, new lows and prices in the direction of 0.90 are realistic in the longer term due to the sizable inflation differential between Switzerland and the Eurozone. Meanwhile, the franc has long since surpassed its former high against the greenback. From a technical analysis perspective, “the trend is your friend” now applies – the franc looks destined to strengthen even further in the medium term.
Timing is a tough game not just with regard to stocks, but with bonds as well – the market is likely to prematurely anticipate a deterioration of the macroeconomic climate.
Kaiser Partner Privatbank AG | Monthly Market Monitor - August 2023 11
The summer thus far has brought more than just scorching temperatures. As so often happens, the summer silly season has also been filled with all sorts of “head-turners”, including a chart that has been making the rounds in recent weeks particularly among financial analysts. The chart in question displays a comparison of the S&P 500 earnings yield with yields on investment-grade corporate bonds and short-term US Treasury yields. The (purported) “aha” is that yields on interest-bearing securities are currently higher than the equity earnings yield. But caution is called for here, and here’s why: although the chart shows that stocks have lost attractiveness relative to the fixed-income sector, one shouldn’t directly compare different yields with each other because whereas bondholders can actually pocket the indicative yields (if they hold the securities to maturity), corporate earnings do not automatically get paid out as stock dividends.
Chart in the Spotlight

Apples and oranges? | A chart is making the rounds S&P 500 earnings yield vs. bond yields
Sources: Bloomberg, Kaiser Partner Privatbank
-2 0 2 4 6 8 10 2010 2011 2012 2013 2014 2015 2016 2017 2018 2019 2020 2021 2022 2023 S&P500 Earnings Y eld Global Investment Grade US Treasury 3M Monthly Market Monitor - August 2023 | Kaiser Partner Privatbank AG 12
Theme in Focus
Bad timing?! – The magazine cover indicator
The human psyche often stands in the way of retail investors achieving success, but finance pros and financial journalists also aren’t immune to the pitfalls of (crowd) psychology. Prominent cover stories in financial and news magazines are often a reflection of moods and positionings on the global stock market merry-go-round. The magazine cover indicator has a remarkable track record and belongs in every investor’s toolbox.
Financial markets are not an easy game
The average retail investor frequently gets talked about less than flatteringly. It often gets said that he hangs on to losers in his portfolio for too long and sells winners too soon (disposition effect), puts all of his eggs in one basket (lack of diversification) and trades too much (overtrading), follows the crowd (herd instinct), and chronically suffers from FOMO, a general fear of missing out on something – profits to be more precise. Retail investors often also try to time the market, an endeavor that very few ever get right. Given all of these investor errors, the Quantitative Analysis of Investor Behavior study published annually by US-based analytics firm Dalbar Inc. regularly comes to the conclusion that the average do-it-yourself investor ultima-
tely earns several percentage points less than he or she would simply by investing in the broad S&P 500 index. The findings of this analysis, mind you, apply to the USA, but it is unlikely that investors in Europe behave much differently. However, it has to be conceded that the alleged “pros” often don’t do a better job of it than retail investors do. New investment products regularly get launched precisely at the moment when an asset (class) has already been performing very well or a new story has been circulating or a new trend has already been in place for a while. This category includes, for example, the ETFs on SPACs (special purpose acquisition companies) that came out in late 2020 and the equity baskets on the Metaverse theme that were rolled out in summer 2021.
New investment products regularly get launched precisely at the moment when an asset (class) has already been performing very well or a new story has been circulating or a new trend has already been in place for a while.
Regularly procyclical? | Buy high, sell low (by financial pros) Bitcoin price in US dollars Sources: Bloomberg, Kaiser Partner Privatbank 500 1’000 2’000 4’000 8’000 16’000 32’000 64’000 128’000 256’000 2017 2018 2019 2020 2021 2022 2023 2024 CME Futures Launch ICE Futures Launch CME Options Launch Coinbase IPO US Futures ETF Launch First US Short Bitcoin ETF Launch Blackrock Spot Bitcoin ETF Launch?
Kaiser Partner Privatbank AG | Monthly Market Monitor - August 2023 13
This phenomenon has a name both simple and apt: the magazine cover indicator.
The magazine cover indicator
The fact that investment products of that ilk regularly come onto the market “too late” is thoroughly understandable. A trend or theme first has to be discovered by a wide public and by a supplier of investment products. It then has to be “manufactured” into an investable product, and finally the marketing machinery has to be fired up. All of that takes time – time during which the news about an investment idea and its return potential usually already gets priced in on the market. It’s the same with the output from financial journalists, the third category of participants riding on the stock market merry-go-round alongside retail and semiprofessional investors and full-time pros. A story must first gain a certain degree of currency on the market or in society. Then it has to be researched, drafted, and written before it maybe makes it onto the cover of a financial publication. By the time the story finally gets published, the topic or theme it addres-
ses oftentimes has already become old hat. What’s more, with astonishing frequency, flashy magazine covers and eye-catching cover stories often mark the climax of a hype or a nadir just before a turn for the better. This phenomenon has a name both simple and apt: the magazine cover indicator. To this day, the legendary cover of the August 13, 1979, issue of BusinessWeek heralding “The Death of Equities: How inflation is destroying the stock market” is considered a textbook example of a sentiment barometer with a contraindicative signaling function, though somewhat unjustly in this instance because although the publication of this cover story was followed shortly thereafter by a big equity bull market that lasted until the turn of the millennium, it took only around three more years (and an inflation-adjusted 32% plunge in the Dow Jones index) for the US stock market to reach its definitive bottom. So, this reputed reverse indicator actually wasn’t one at all in this notorious case.
Astoundingly high accuracy rate Nevertheless, it’s not for nothing that the magazine cover indicator enjoys a certain renown. Nobel economics laureate Paul Krugman once quipped that “whom the Gods would destroy, they first put on the cover of BusinessWeek.” There certainly are anecdotes consistent with that statement, albeit in examples involving another prominent US news weekly, TIME Magazine. TIME chose Amazon founder Jeff Bezos as its person of the year at the end of 1999 at the height of the dotcom bubble. Amazon’s stock then went on to lose more than 80% of its value the following year. Something similar recurred 22 years later. At the end of 2021, it was Elon Musk who adorned the cover of TIME as the magazine’s person of the year – 12 months afterwards, Tesla’s stock price was down by two-thirds. Citigroup analysts Gregory Marks and Brent Donnelly dug up more than just isolated evidence in 2016. They searched back iss-
ues of the financial magazine The Economist for visually impactful cover stories with a very distinct optimistic or pessimistic message. They found 44 covers spanning a period from 1998 to 2016 that fit this bill. Of those 44 cover stories, 68% acted as a reverse indicator in the space of a year, meaning that if you had consistently bet on the opposite of the magazine’s recommendation or storyline, you would have bet right in two out of three cases. Last year Brent Donnelly reprised this analysis using 54 cover stories in The Economist and eight standout issues of TIME. This time he augmented the study with performance data and differentiated between bullish and bearish covers. In this investigation as well, more than half of the cover stories acted as a reverse indicator after a year. Bets against the 39 bearish covers were up 13% on average in performance terms a year after they were published. But the amazing thing was that the contrarian bets against the 23
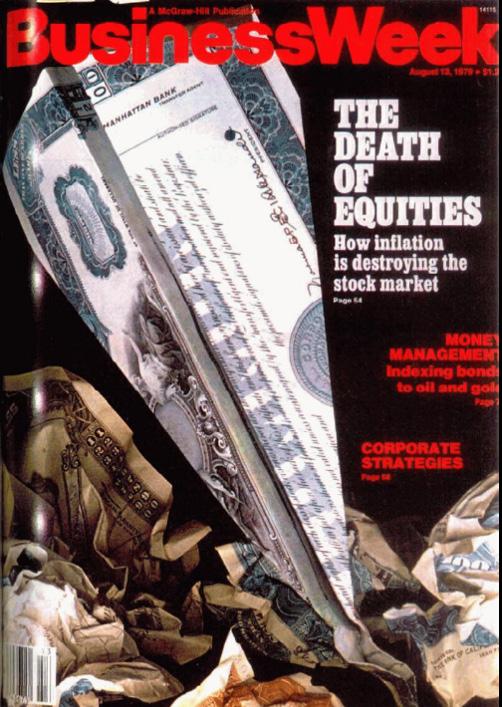 World-famous… | …for the wrong reasons Cover of August 13, 1979, issue of BusinessWeek
Sources: BusinessWeek, Kaiser Partner Privatbank
World-famous… | …for the wrong reasons Cover of August 13, 1979, issue of BusinessWeek
Sources: BusinessWeek, Kaiser Partner Privatbank
Monthly Market Monitor - August 2023 | Kaiser Partner Privatbank AG 14
bullish cover stories also had a high 60% accuracy rate and resulted in a positive performance – investments in line with the stories were down 8% on average one year later. This is remarkable because sentiment indicators usually work well particularly when bearishness overshoots. When that happens, markets then are often heavily oversold and most investors have already
unloaded stock holdings, so a retracement rally sets in sooner rather than later in any case. The situation is different in very bullish markets in which investor euphoria becomes ultra-exuberant and expectations of rising prices can turn into a self-fulfilling prophecy – this momentum causes sentiment indicators to malfunction as a reverse indicator.
Useful, but not easy to use
The magazine cover indicator thus can deliver a better-than-average and timely warning signal especially during periods of exuberant euphoria, but it is not a holy grail. For one thing, despite its high accuracy rate, the indicator is still wrong often enough. Moreover, the many biases described at the beginning of this article that often cloud the views of retail and professional investors will likely make it hard for them to practically implement the indicator signals in their investment decisions. But
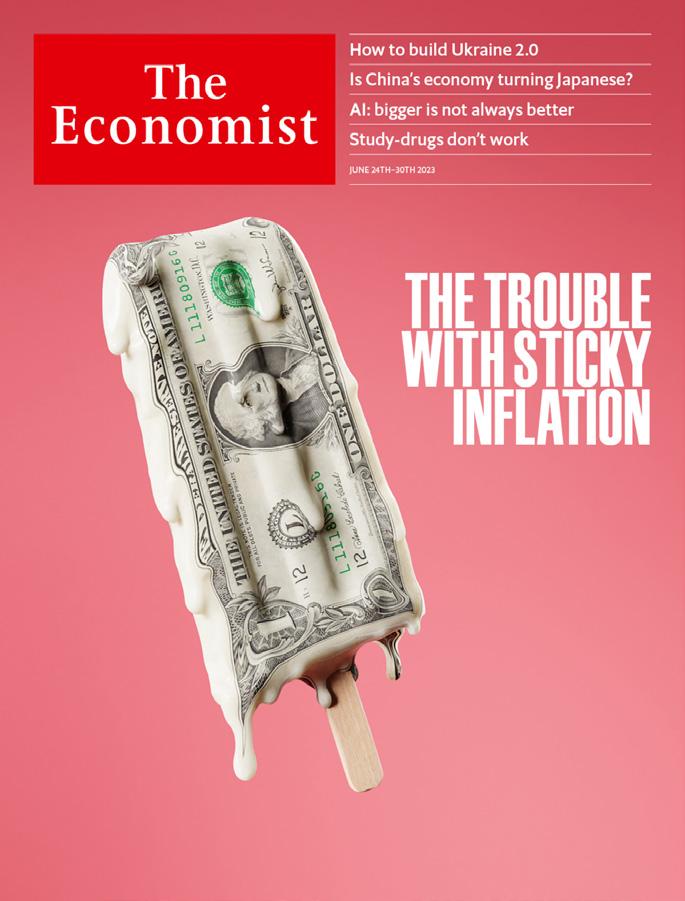
perhaps it also suffices just to be aware of the effect that cover stories and visually impactful cover images have. If you come across them, you should be sensitized to them and should at least critically question the story. This often helps a person view the frequently turbulent world of finance and certain themes in a more relaxed state of mind, for example when perusing the cover of an issue of The Economist from June 2023. Its title –“The Trouble with Sticky Inflation” – should give anyone who fears persistently high inflation rates some relief.
The magazine cover indicator thus can deliver a better-than-average and timely warning signal especially during periods of exuberant euphoria, but it is not a holy grail. Bad


Regularly procyclical! | Buy high, sell low (by financial journalists) Petroleum price and cover of The Economist
Bloomberg, Kaiser Partner Privatbank 5 10 20 40 80 160 1990 1995 2000 2005 2010 2015 2020
Sources:
timing… | …even on inflation?
of the June 24, 2023, issue of The Economist
Economist, Kaiser
Privatbank Kaiser Partner Privatbank AG | Monthly Market Monitor - August 2023 15
Cover
Sources:
Partner
Drawdown
Quality: One factor speaks for itself
Everyone would like to have “good” stocks in his or her portfolio. But what actually makes for a good stock? For stocks with a high “quality” factor, the name says it all. Those stocks combine security and consistency with an attractive return, and they seemingly turn finance theory on its head. But investors shouldn’t lose their heads over them. There is no such thing as a free lunch, so quality stocks should only be one part of an investor’s menu.
A matter of definition
What actually makes for a “good” stock? Many an investor may have asked him- or herself that question at one time or another. The answer to it, like so much else in life, lies in the eye of the beholder. A “good” stock could be a very inexpensively valued one or one that pays out a high dividend yield. Many an investor would like the lowest possible volatility in his or her portfolio or prefers stocks with good momentum. For other investors, robust enterprise growth is the only thing that matters – in the hope that the company’s share price will also grow robustly. All of the aforementioned attributes are (equity) “factors”, in investment parlance. They are characteristics that help explain a stock’s long-term risk/return profile. One factor that’s missing in the list above and which
comes closest to what one would presumably associate with a “good” or high-quality stock is the factor “quality”, which describes companies that have a stable business model and a sustainable competitive advantage. Quality companies typically carry little or no debt, have steady earnings, and are highly profitable. The name says it all, so to speak – even in tough stock-market periods because quality stocks rank as defensive and tend to lose less than the broad index during phases of general market weakness. Pharmaceuticals giant Novo Nordisk, major semiconductors player ASML, and luxury goods group LVMH are examples of enterprises considered typical quality companies in Europe. IT titans Apple and Microsoft and payment services provider VISA are prominent examples in the USA.
Almost a free lunch | High return with relatively low volatility Risk/return profile of different factors (since 2000) Sources: Bloomberg, Kaiser Partner Privatbank 4% 5% 6% 7% 8% 10% 11% 12% 13% 14% 15% 16% 17% 18% R e turn Risk World Enhanced Value World Quality World Equal Weighted World Minimum Volatility World Momentum World Growth World World High Dividend Yield
Monthly Market Monitor - August 2023 | Kaiser Partner Privatbank AG 16
“Quality” describes companies that have a stable business model and a sustainable competitive advantage.
Delivers what the label says
A stock “of high quality” should of course ideally also perform well, i.e. better than average. And in fact, the “quality” factor has indeed outperformed by a wide margin since the year 2000, generating a substantial excess return of 2 percentage points per annum relative to the MSCI World index (+7.1% vs. +5.1%). The factor indices published by index provider MSCI serve as the basis for the above calculation. To capture the quality factor and to identify quality stocks, MSCI screens the equity universe for three fundamental variables: return on equity, debt to equity, and earnings variability (how consistent earnings growth has been over time). The consistent alpha that quality stocks
generate seemingly stands in contradiction to finance theory, according to which higher risk should be compensated with a higher return. That’s the way it is, for example, on the bond market, where high-yield bonds are riskier than investment-grade bonds. High-yield bonds are more volatile than their investment-grade counterparts and can exhibit relatively bigger drawdowns over the course of their life, but in exchange deliver a higher return in the long run. However, it’s exactly the other way around with the “quality” factor on the equity market: (“junk”) stocks that fail to meet the aforementioned quality criteria exhibit higher price volatility and deliver lower returns than genuine “quality” stocks do.
Topsy-turvy investment world | When higher quality yields a better return
Risk/return profile of bonds vs. stocks
Sources: GMO, Bloomberg, Kaiser Partner Privatbank
The cause of the anomaly opportunity
The “quality” factor has been well-known for quite some time. Robert Novy-Marx paved the way for its widespread dissemination in academic literature in 2012. His pioneering study1 found that a company’s profitability and stability are just as useful as the much better-known “value” factor for explaining stock-price performance. In 2015, Nobel laureates Eugene Fama and Kenneth French broadened their three-factor model for explaining stock returns by adding the factors “profitability” and “asset growth” (a measure for conservative or aggressive investment behavior). Frazzini, Kabiller, and Pedersen2, in turn, demonstrated that the success achieved by Warren Buffett, who is primarily known as a value investor, is attributable not just to the “value” factor, but equally owes to his focus on safe “quality” stocks. A vast amount of academic ink has been spilled in theorizing an explanation for this apparent anomaly. One relatively simple hypothesis holds that investors are willing to pay a premium for the positive attributes of “quality” stocks (for their safety, for example). And in fact, stocks with a high “qua-
lity” factor are consistently more expensive than the “average” stock. Another hypothesis postulates that analysts and investors systematically underestimate the future returns on shares of high-quality companies. They prefer to bet on spectacular lottery-like stocks with fragile business models while ignoring boring but stable companies and their shares. According to this theory, this misappraisal is the fount that harbors alpha potential, and to this day is hasn’t run dry yet. Although the “quality” phenomenon has been well-known for a long time, the opportunity that it presents on the equity market still exists today. Studies3 show, for example, that a long-short portfolio composed of “quality” (long) and “junk” (short) stocks can constitute a strategy with attractive risk/return characteristics. The “quality” factor’s star is shining exceptionally brightly at the moment. Practically regardless of the starting date used to pit the different MSCI factor indices against each other in a performance comparison, the “quality” factor leads the pack in most cases (from 2000, 2010, and 2020 onward, for example).
And in fact, stocks with a high “quality” factor are consistently more expensive than the “average” stock.
Bonds Eq es % % % % % % % % % % % R e t rn Risk High Yield In estment Grade Bonds: Bonds Eq i es % % % % % % % % % % % % R e t rn Risk Q alit J nk Equities: Kaiser Partner Privatbank AG | Monthly Market Monitor - August 2023 17
Choose the menu with caution
The “quality” factor, moreover, is also benefiting from the current euphoria surrounding the artificial intelligence theme, in part because some of the big, fast-growing (US) technology companies have developed in recent years into highly profitable earnings-generating machines that perform reliably (almost) regardless of the ups and downs of the economic cycle. Consequently, some former “growth” companies have since also become “quality” companies at the same time. This is also reflected in the respective MSCI factor indices, in which companies like Apple, Microsoft, Alphabet, and Meta feature prominently on both the “growth” and “quality” rosters. After the halfway point of 2023, “growth” and “quality” are both way out in front in the factor rankings with a performance above +20%. However, despite the good track record over both the short and long term, investors shouldn’t put all of their eggs in the “quality” basket. That’s because even though
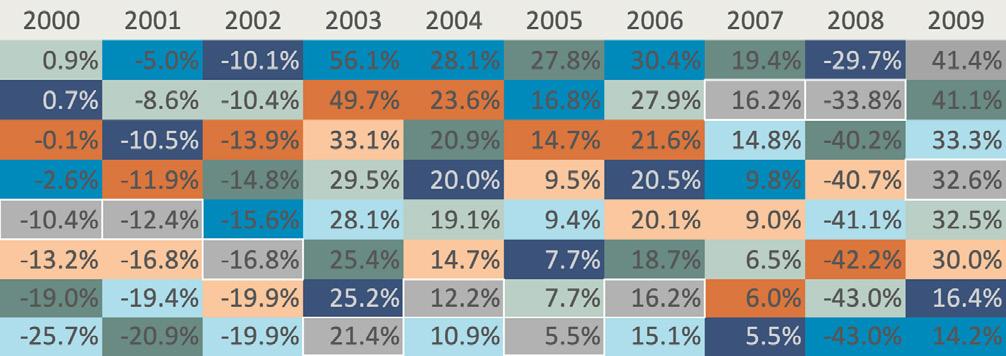
the “quality” anomaly looks set to continue presenting opportunities in the long run, one should never forget one of the most important lessons for investors, the tenet that diversification is and remains essential, including in factor investing, because fashions can change (repeatedly). For example, in the middle of the 2000s decade, even the “quality” factor experienced a lengthy dry spell. We currently do not detect any immediate macroeconomic or market drivers that could trigger a recurrence of such a long phase of (relative) weakness. However, in the medium term we also see good investment opportunities elsewhere, particularly in the “size” factor. At the moment, small-cap stocks in both the USA and Europe are very inexpensively valued in historical terms relative to large caps. This valuation gap could close again over the next two to three years. So, against this backdrop, dedicated small-cap strategies or, alternatively, the MSCI Equal Weighted index also belong on the investor menu.
|
Performance
Outperformance
Quality is in demand at the moment
of different factor indices
2 in 1 | Quality and growth at once Top 10 companies in factor indices Sources: MSCI, Kaiser Partner Privatbank Microso 6.1% Nvidia 5.4% Apple 5.2% Meta 3.6% Alphabet A 2.9% Alphabet C 2.7% Home Depot 2.6% Visa 2.5% Johnson & Johnson 2.3% Unitedhealth Group 2.3% Top 10 35.6% Quality Apple 9.9% Microso 8.2% Amazon 3.9% Nvidia 3.3% Alphabet A 2.6% Alphabet C 2.4% Meta 2.1% Tesla 1.9% Visa 1.3% Eli Lilly 1.2% Top 10 36.6% Growth 0 100 200 300 400 500 2000 2002 2004 2006 2008 2010 2012 2014 2016 2018 2020 2022 World Enhanced Value World Quality World Equal Weighted World Minimum Volatility World Momentum World Growth World World High Dividend Yield Microso 6.1% Nvidia 5.4% Apple 5.2% Meta 3.6% Alphabet A 2.9% Alphabet C 2.7% Home Depot 2.6% Visa 2.5% Johnson & Johnson 2.3% Unitedhealth Group 2.3% Top 10 35.6% Quality Apple 9.9% Microso 8.2% Amazon 3.9% Nvidia 3.3% Alphabet A 2.6% Alphabet C 2.4% Meta 2.1% Tesla 1.9% Visa 1.3% Eli Lilly 1.2% Top 10 36.6%
Sources: Bloomberg, Kaiser Partner Privatbank
Growth
Monthly Market Monitor - August 2023 | Kaiser Partner Privatbank AG 18
Consequently, some former “growth” companies have since also become “quality” companies at the same time.
No free lunch after all | Fashions can change Performance heat map for factor indices
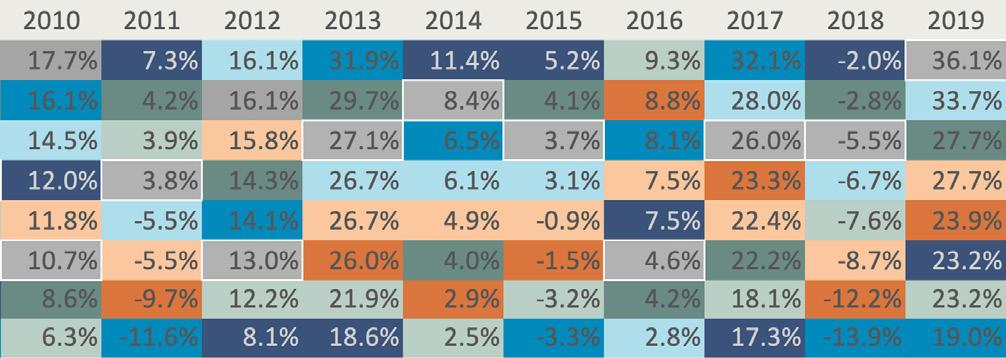
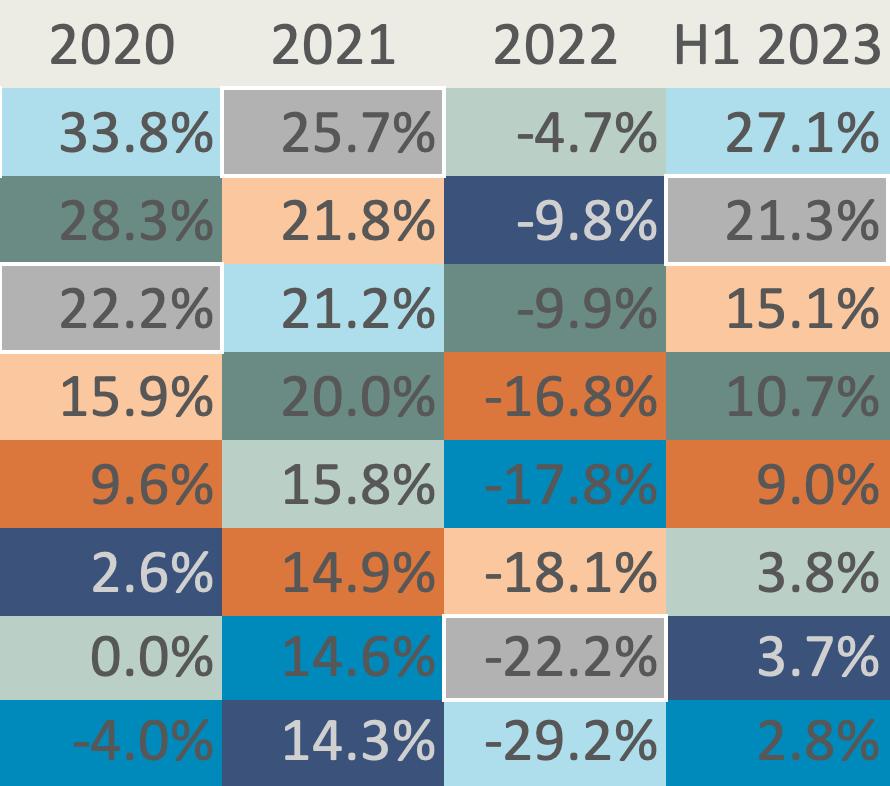
World Enhanced Value
World Quality
World Equal Weighted
World Minimum Volatility
World Momentum
World Growth
World
World High Dividend Yield
Sources: Bloomberg, Kaiser Partner Privatbank
*1) Novy-Marx, R. (2012): “The Other Side of Value: The Gross Profitability Premium”

*2) Andrea Frazzini, David Kabiller, Lasse H. Pedersen (2013): “Buffett’s Alpha”
*3) Including, for instance, Clifford S. Asness, Andrea Frazzini, Lasse H. Pedersen (2013): “Quality Minus Junk”
Kaiser Partner Privatbank AG | Monthly Market Monitor - August 2023 19
The Back Page
Asset classes
Performance as of 31 July
Asset class YTD 1 Month 1 Year 3 Years Cash CHF 0.1% 1.0% -0.3% EUR 0.3% 2.5% 1.5% USD 0.4% 4.6% 5.6% Fixed Income Sovereign bonds -0.3% -4.7% -13.5% Corporate bonds 1.0% 0.2% -12.9% Microfinance 0.3% 3.3% 8.7% Inflation-linked bonds 0.1% -8.2% -9.8% High-yield bonds 1.4% 3.2% 4.5% Emerging-market bonds 1.9% 5.6% -11.7% Insurance-linked bonds 1.3% 9.1% 17.9% Convertible bonds 2.8% 8.8% 15.3% Equities Global 2.9% 12.7% 43.2% Switzerland 0.4% 2.1% 16.7% Europe 1.9% 17.8% 43.9% UK 2.2% 6.8% 48.4% USA 3.4% 12.6% 43.1% Emerging markets 5.8% 5.3% -3.0% Alternative assets Commodities 5.8% -11.9% 56.3% Gold 2.4% 11.3% -0.5% Real estate Switzerland 0.2% -3.7% 0.6% Hedge funds 0.5% 1.1% 6.6% Currencies EUR/USD 0.8% 7.6% -6.6% EUR/CHF -1.9% -1.5% -10.9% GBP/USD 1.0% 5.5% -1.9%
2023
0.8% 1.9% 3.0% 0 1.7% 4.5% 2.4% 1.8% 6.4% 5.8% 11.8% 11.0% 0 18.5% 7.8% 17.5% 4.9% 20.8% 9.5% 0 -4.8% 7.7% -0.2% 1.0% 0 2.7% -3.1% 6.2% 7.7% Monthly Market Monitor - August 2023 | Kaiser Partner Privatbank AG 20
On our Agenda
• August 15: Liechtenstein’s national holiday
The tiny country will celebrate in grand style once again this year on Assumption Day. As always, there will be a triad consisting of a state ceremony, a big folk festival, and a fireworks spectacle – the customary beer-and-wine reception has been canceled this year, however, due to ongoing renovation work on the grounds of Vaduz Castle. This enables everyone, though, to participate all the better in the evening torchlight procession over the Fürstensteig with a clear head.
• August 19: World Photography Day
A picture says more than 1,000 words – with the aid of photography since 1839, when the first commercially usable photography process (daguerreotype) was invented. World Photography Day encourages people around the globe to share their personal perspective with the entire world via professional photos or simple snapshots taken with a smartphone.

• August 28 to September 10: US Open
The arguably loudest of the four Grand Slam tennis tournaments – thanks to airplanes and boisterous spectators – traditionally takes place at the end of the summer vacation break in New York. The men and women players at least receive the same prize money for their efforts. The US Open introduced equal pay back in 1973.
Kaiser Partner Privatbank AG | Monthly Market Monitor - August 2023 21
This document constitutes neither a financial analysis nor an advertisement. It is intended solely for informational purposes. None of the information contained herein constitutes a solicitation or recommendation by Kaiser Partner Privatbank AG to purchase or sell a financial instrument or to take any other actions regarding any financial instruments. Furthermore, the information contained herein does not constitute investment advice. Any references in this document to past performance are no guarantee of a positive future performance. Kaiser Partner Privatbank AG assumes no liability for the completeness, correctness or currentness of the information contained herein or for any losses or damages arising from any actions taken on the basis of the information in this document. All contents of this document are protected by intellectual property law, particularly by copyright law. The reprinting or reproduction of all or any parts of this document in any way or form for public or commercial purposes is expressly prohibited unless prior written consent has been explicitly granted by Kaiser Partner Privatbank AG.
Publisher: Kaiser Partner Privatbank AG
Herrengasse 23, Postfach 725
FL-9490 Vaduz, Liechtenstein
HR-Nr. FL-0001.018.213-7
T: +423 237 80 00, F: +423 237 80 01
E: bank@kaiserpartner.com
Editorial Team: Oliver Hackel, Senior Investment Strategist
Roman Pfranger, Head Private Banking & Investment Solutions
Design & Print: 21iLAB AG, Vaduz, Liechtenstein
Monthly Market Monitor - August 2023 | Kaiser Partner Privatbank AG 22
kaiserpartner.bank
