Monthly
Market Monitor

July 2025

Trump’s 90-day grace period is nearing its end.
of the Month
Eyes on Trump’s deadline

July 2025
Trump’s 90-day grace period is nearing its end.
of the Month
Eyes on Trump’s deadline
Donald Trump’s 90-day grace period is nearing its end. Drastically higher “retaliatory tariffs” loom for most of the USA’s trade partners on July 9, in no small part because it’s unlikely that the US president and his team of negotiators will have come even close to making the promised 90-plus deals by then. Is a next deadline already lurking behind the one set to expire shortly? Another postponement would again provide respite for the near term, but would only prolong the current phase of uncertainty, with consequences for economic growth, employment, and inflation, especially in the USA. Better or worse developments are imaginable depending on President Trump’s mood.
Wall of worry
The US equity market climbed a proverbial wall of worry in June. The blue-chip S&P 500 index and the technology stocks in the Nasdaq 100 clawed their way to new all-time highs despite the escalation in the Middle East, the temporary spike in the price of oil, and the lingering question marks regarding punitive tariffs. As so often happens, mispositioning on the part of investors lent the rally impetus. While individual private investors instinctively used the April selloff to buy the dip, a move that has usually been successful in recent years, systematic strategies got caught on the wrong foot and stopped out. They have had to chase the rising prices and the waning volatility in recent weeks.
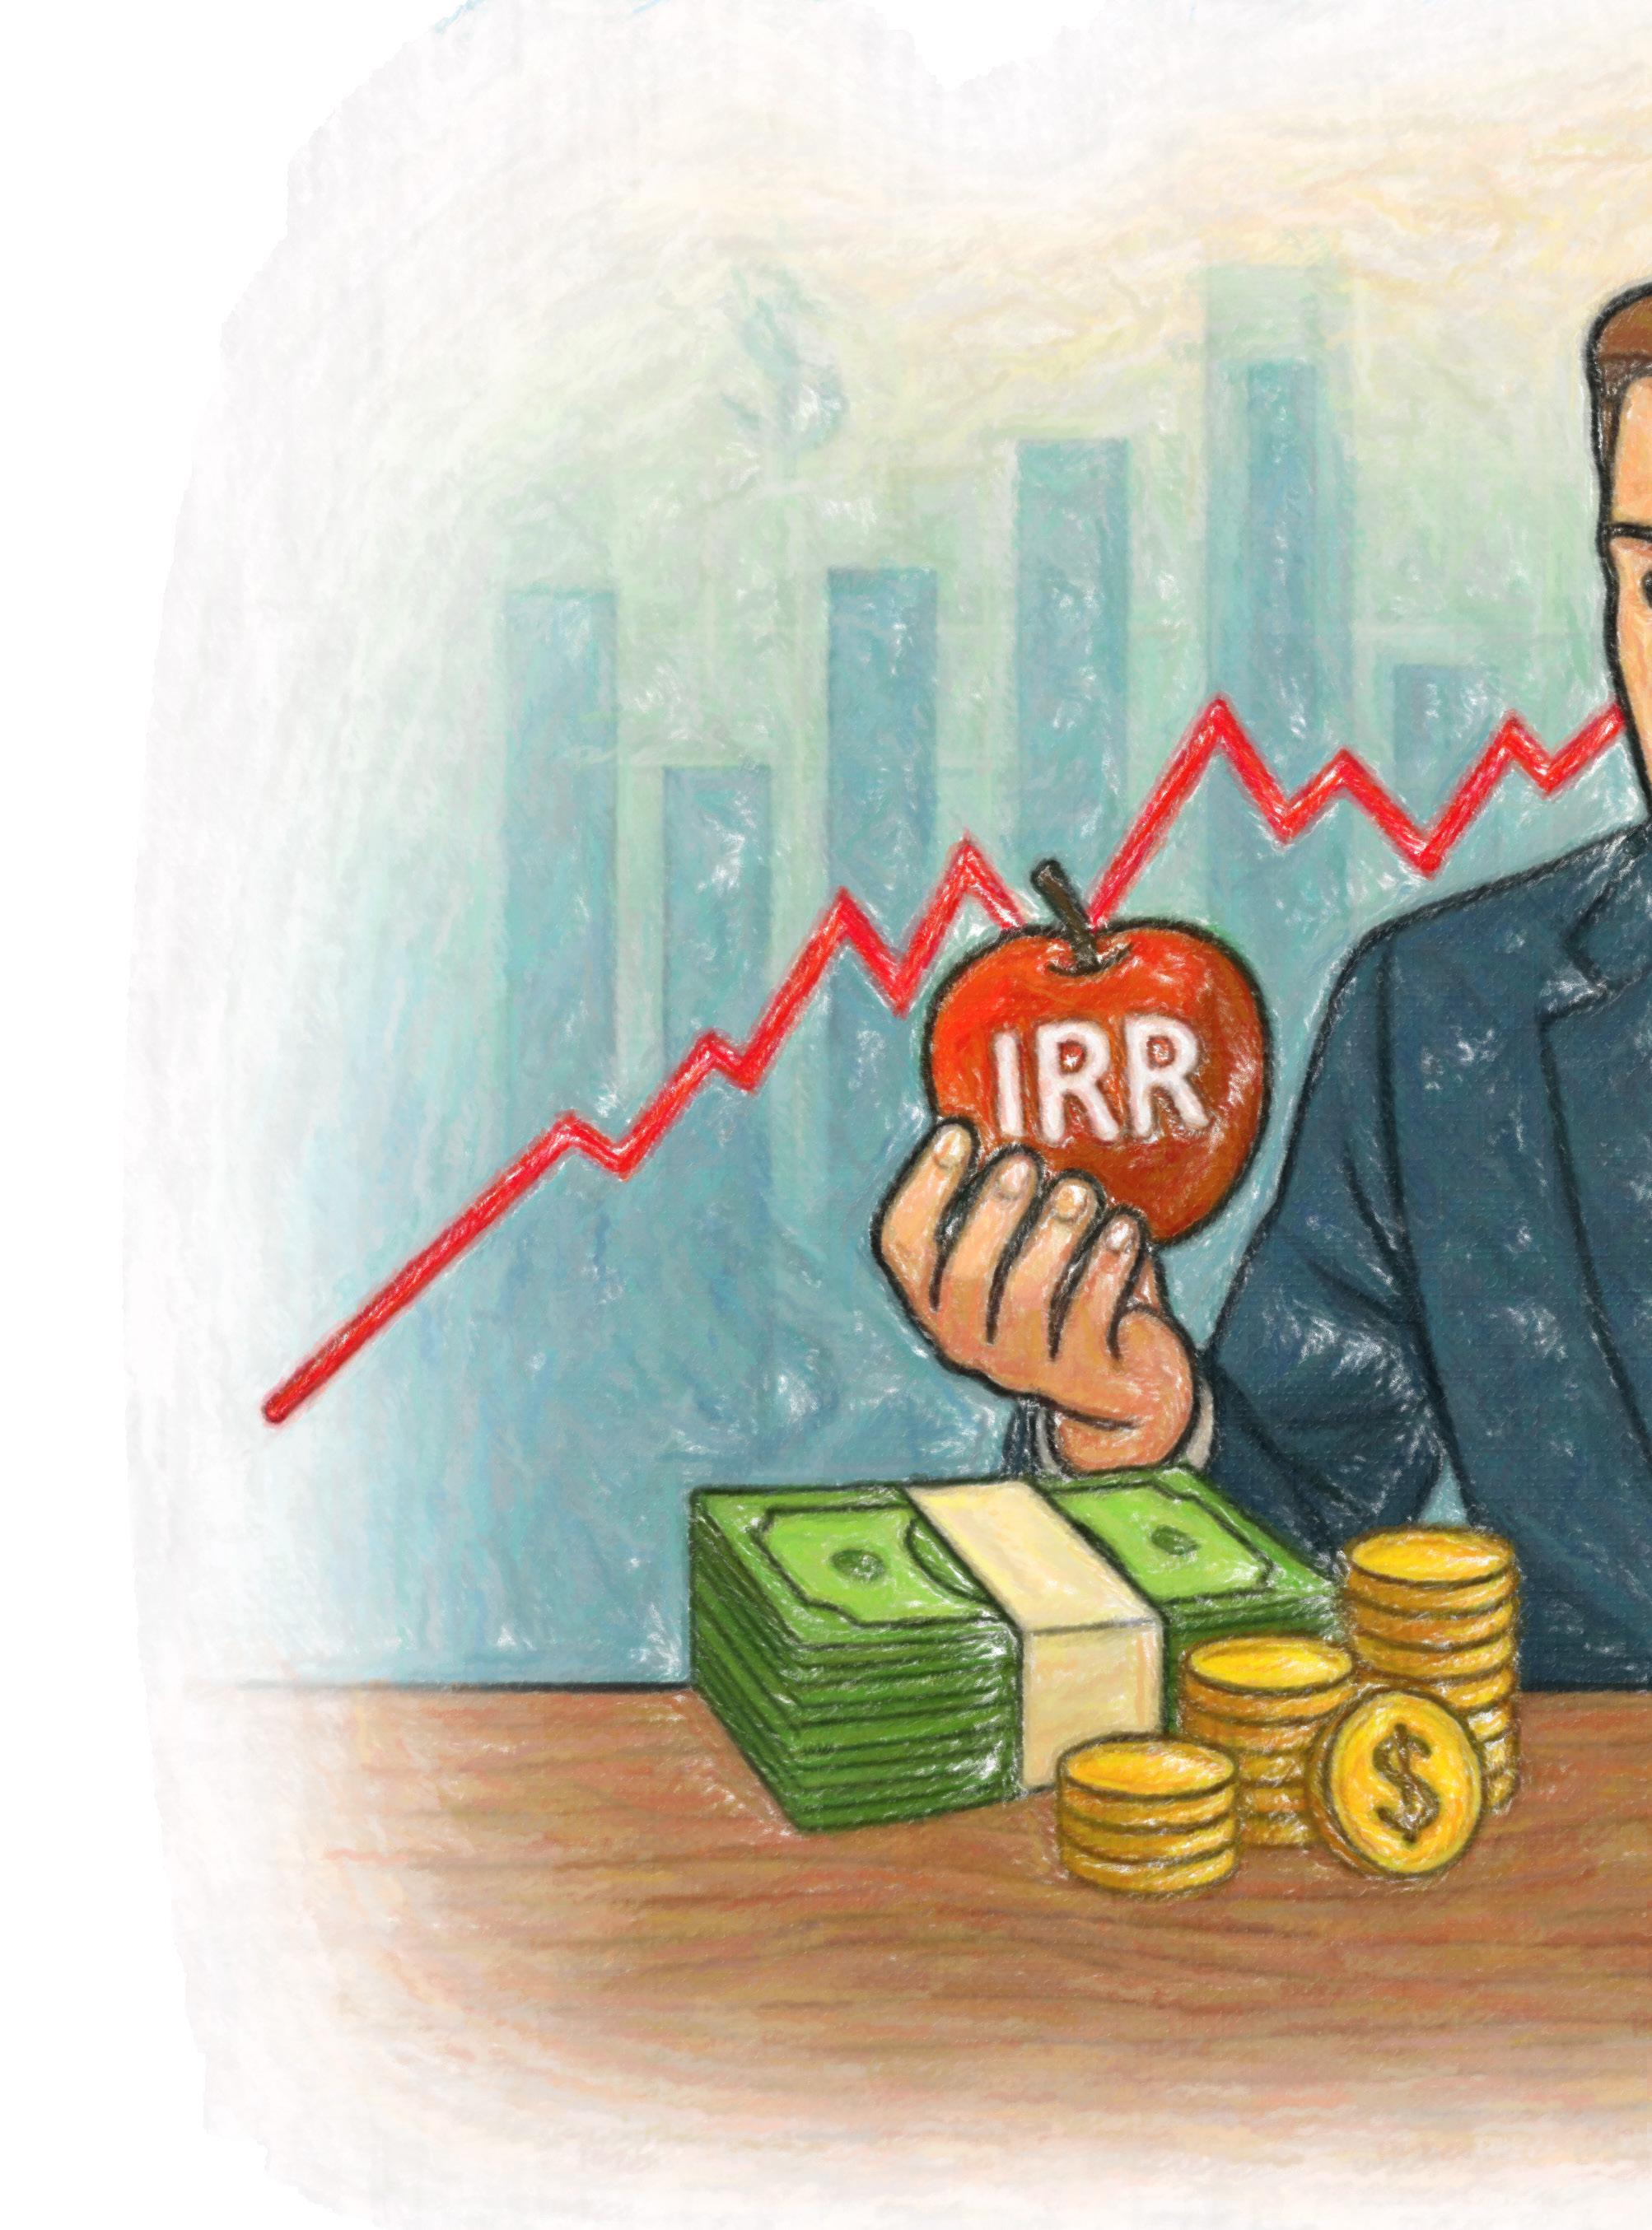
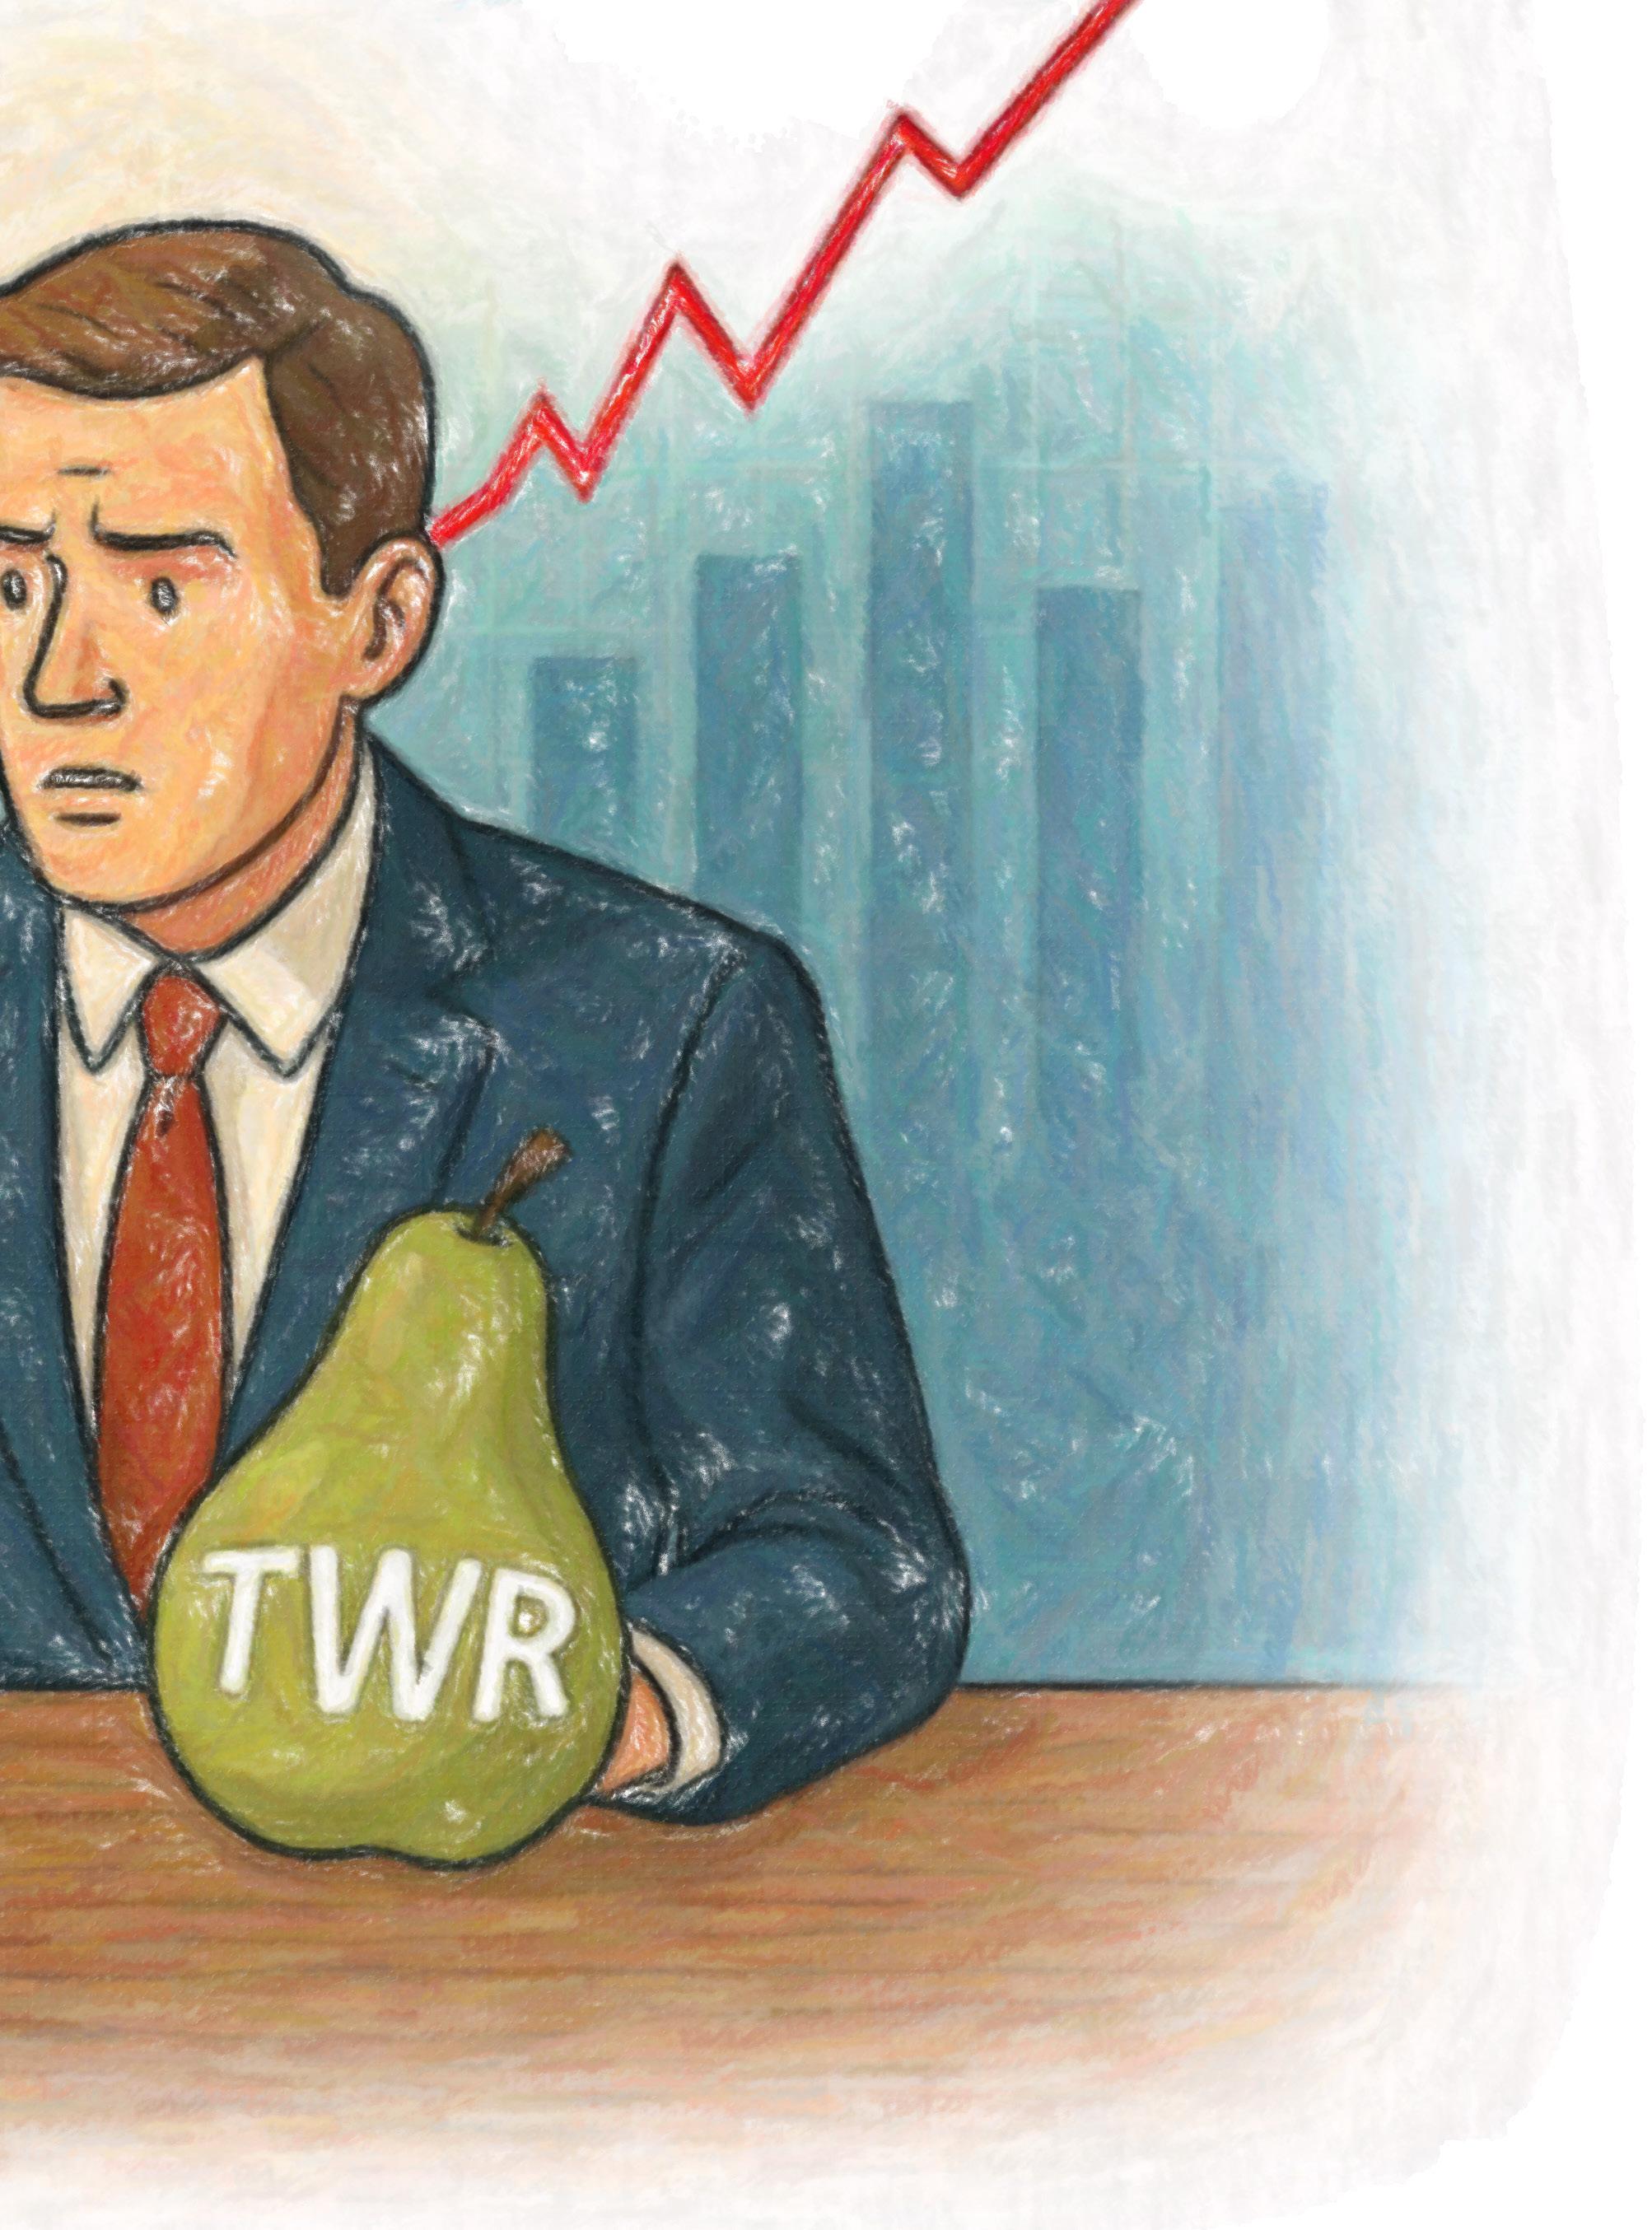
You can’t eat IRR: On realistic performance expectations for private equity
More and more investors these days are growing enthusiastic about investing in private equity. However, their interest in this asset class is often based on exaggerated return expectations of 20% and upward per annum. Due to inadequate knowledge and/or misguided marketing, apples (internal rates of return) frequently get mistakenly compared and equated with oranges (time-weighted returns). Those who know their way around the jungle of performance metrics are not only better informed, but are also likely to be disappointed less often by their private-market investments.
Policy chaos or cunning negotiating tactic? Whether the Trumpian way of steering the fate of the USA on trade issues and in other matters ultimately proves successful, culminates in fabulous deals, and eliminates the country’s problematic budget deficit on the side still remains to be seen. Meanwhile, in any case, the financial markets are well acquainted by now with the habitual cycle of threat, subsequent qualifying statement, and inevitable triumphal tweet. Investor nervousness has substantially decreased, and there is even talk afoot in the meantime about the “TACO Trade” (short for “Trump Always Chickens Out”). It remains pure speculation, though, whether that unflattering acronym egged on the USA’s bombing raid on Iran’s nuclear facilities. The US president didn’t back down in this instance. Despite the shock effect, the market’s reaction confined itself to the price of oil and only for a short time because the worst-case scenario – a blockade of the Strait of Hormuz – seems unlikely to come to pass. The same arguably goes for a summer news void this year.
Eyes on Trump’s deadline
Donald Trump’s 90-day grace period is nearing its end. Drastically higher “retaliatory tariffs” loom for most of the USA’s trade partners on July 9, in no small part because it’s unlikely that the US president and his team of negotiators will have come even close to making the promised 90-plus deals by then. Is a next deadline already lurking behind the one set to expire shortly? Another postponement would again provide respite for the near term, but would only prolong the current phase of uncertainty, with consequences for economic growth, employment, and inflation, especially in the USA. Better or worse developments are imaginable depending on President Trump’s mood. With regard to the USA’s largest trade partner, the European Union, a 10% baseline levy and some sector-specific tariffs combined with additional concessions such as commitments to purchase US natural gas arguably would be a tolerable, face-saving solution for everyone at this point. But a renewed escalation ahead of an inevitable deal cannot be ruled out entirely. The only thing certain is that a single-digit average tariff rate on US imports is history for now.
Different speeds – reversed for once
While America is raising tariffs against almost all of its trade partners, the USA is just one sales market among many for those countries. So, Trumpian trade policy is bound to have a more adverse effect on US economic activity than on growth prospects in Europe, for instance. Although the first-quarter GDP growth differential between the two regions (USA: –0.1%; Eurozone: +0.6%) was heavily skewed by import/export frontloading and is likely to have partially corrected itself in the second quarter, the omens for the Eurozone for the second half of 2025 and beyond are more favorable than the portents on the other side of the Atlantic for once. A pickup in near-term sentiment and a sustained spurt of growth have already been sparked on the old continent in no small part by the new spending enthusiasm by the federal government of Germany, which intends in the years ahead to make use of its borrowing leeway – maneuvering room that it actually has unlike most of the other industrialized nations.
The Eurozone is at an advantage also with regard to inflation, which is already within the European Central Bank’s target range and looks set to continue edging downward as a result of the Trump tariffs and the surge in the value of the euro. Some members of the ECB’s governing council thus are already flirting with the idea of cutting the central bank’s policy rate again to below the current 2% level regarded by the consensus as neutral. The US Federal Reserve, meanwhile, remains in wait-and-see mode in the wake of the June FOMC meeting. This prompted the US president to unleash another round of tirades against Fed Chairman Jerome Powell, who has withstood the pressure from the White House thus far. However, there is a rapidly growing risk of some Fed board members allowing their views to be swayed and/or of Trump soon unveiling a successor to Powell and of that person then influencing US interest-rate policy ahead of time. The Swiss National Bank, in contrast, recently proved yet again that it is truly independent and duty-bound only to preserving the stability of the value of money. With its latest policy rate cut to 0%, the SNB countered calls for (or fears of) a straightaway return to negative interest rates and formulated a formidable hurdle to going below zero. The SNB is at the end of the rate-cutting cycle for now. Back at the zero-percent line | SNB at end of rate-cutting cycle Policy
The US Federal Reserve, meanwhile, remains in wait-and-see mode in the wake of the June FOMC meeting.
Sources: Bloomberg, Kaiser Partner Privatbank

Asset Allocation Monitor
Cash Equities
Fixed Income
Sovereign bonds
Corporate bonds
Microfinance
Inflation-linked bonds USA
High-yield bonds Japan
06/2025
Emerging-market bonds
Insurance-linked bonds
Convertible bonds
Emerging markets
Alternative Assets
Gold
Duration Hedge funds
Currencies
US dollar
Structured products
Private equity
Swiss franc Private credit
Euro Infrastructure
British pound
Equities: Wall of worry
• The US equity market climbed a proverbial wall of worry in June. The blue-chip S&P 500 index and the technology stocks in the Nasdaq 100 clawed their way to new all-time highs despite the escalation in the Middle East, the temporary spike in the price of oil, and the lingering question marks regarding punitive tariffs. As so often happens, mispositioning on the part of investors lent the rally impetus. While individual private investors instinctively used the April selloff to buy the dip, a move that has usually been successful in recent years, systematic strategies got caught on the wrong foot and stopped out. They had to chase the rising prices and the waning volatility in recent weeks and thus created buying demand. From a technical analysis perspective, US stocks now look more constructive again on the heels of the new all-time highs – a double top is becoming more unlikely, and the bear-market question is off the table for the time being.
• The US market has advanced disproportionately in recent weeks not just in absolute terms, but also relative to other regions. On one hand, the euphoria pendulum had swung a bit too far in favor of Europe since the start of this year, which has now been corrected. And on the other hand, investors are coming up with old and new rationales for not entirely dropping the stock-market darlings of recent years. The old reasons include still-ongoing speculative upside
Real estate
Scorecard
Macro
Monetary/fiscal policy
Corporate earnings
Valuation
Trend
Investor sentiment
fantasizing about artificial intelligence, which continues to bring the Big Tech sector handsome growth rates, and at a valuation level that is no longer so expensive now. The newer pro arguments include the weak US dollar, which is bound to pleasingly make itself noticeable on the net financial income lines of internationally oriented corporations’ income statements during the next reporting season. The Federal Reserve’s future interest-rate path, for which only the timing is uncertain but not the direction (clearly headed downward), also makes the longer-term prospects for US stocks favorable, at least judging by the historical pattern.
• Nevertheless, a complete undoing of the revival of international (ex-US) stocks that has been observable since last year is unlikely to happen. It’s only normal for a big trend turnaround of that kind to follow a “two steps forward, one step back” pattern. The weaker US dollar and still-cheap valuations make a case for an improved outlook for emerging-mar-
The newer pro arguments include the weak US dollar, which is bound to pleasingly make itself noticeable on the net financial income lines of internationally oriented corporations’ income statements during the next reporting season.
Mirroring equity markets, government bonds likewise have been relatively unperturbed by geopolitical events in recent weeks.
ket stocks. European stocks beckon with the prospect of higher growth potential in the years ahead, thanks in part to the eased hand brake on German government spending. The general corporate profit growth malaise also appears to have been surmounted in Europe, which has been running neck and neck with the USA over the last three quarters (as measured by median earnings growth). Last but not least, European stocks have gained a lot of allure in recent years also with regard to share buybacks.
Fixed income: Better prospects for emerging markets
• Mirroring equity markets, government bonds likewise have been relatively unperturbed by geopolitical events in recent weeks. The yield on 10-year US Treasury notes has fallen a few tenths of a percentage point since mid-May, but has been drifting sideways in the bigger year-to-date picture. Questions about a looming recession and the inflationary effect of Trumpian punitive tariffs are likely to determine the future direction of yields in the second half of this year. Both risks, which have opposite effects on the yield trend, have swiftly diminished lately, so upward and downward forces are offsetting each other at the moment and continued rangebound movement thus wouldn’t be surprising. For investors, US Treasurys therefore are nothing more or less than a sound addition to a portfolio, but one with an inherent shock effect because although we think it’s still too soon right now to declare spiraling US public debt a “red flag” issue for investments in American sovereign bonds, Trump’s OBBBA (One Big Beautiful Bill Act) might trigger further talk and bond-price volatility in the near future.
• The geopolitically induced selloff of risky assets in April also hit high-yield bonds, but lasted only for a brief time like it did on the equity market. So, the window of opportunity for adding exposure to that asset class was accordingly short. In the meantime, credit spreads have seen their temporary widening correct already by around three-quarters. The evident slowdown in economic growth in the USA thus has already been priced in. Risk premium spreads on emerging-market bonds have also appreciably tightened again lately. In view of a weaker US dollar, the tendency toward rate-cutting in many emerging economies, high real yields, and the carry advantage versus developed-market bonds, we see sustainably better prospects for emerging-market bonds and are tactically upgrading this asset class.
• The price of oil has been acting as a sensitive risk gauge in the Middle East conflict. At first, its surge by around 25% since mid-May reflected a rapidly growing risk of a disturbance of the global petroleum market. Then, after the USA intervened in the conflict, oil traders were briefly confronted with the question of whether the market ought to price in a much more drastic escalation such as a shutdown of
the Strait of Hormuz. The uncertainty, though, was short-lived because the meek response by Iran not only had a deescalating effect, but at the same also sparked a swift selloff, causing the market to price out the risk premium. This marked a recurrence of a phenomenon that has been observable again and again in recent years: every news-induced spike in the price of petroleum gets sold off because the fundamentals argue against a sustained increase in oil prices. However, a price drop below the year-to-date low also is unlikely to happen, not even if the American president (“Drill, baby, drill!”) calls on the US oil industry to further ramp up output. Many oil production projects will already have become unprofitable at the reduced price levels seen in recent weeks. This gives OPEC an opportunity to recapture market share.
Currencies: US dollar remains under pressure
• EUR/USD: The EUR/USD exchange rate hit a new year-to-date high above the 1.17 level in June. The Trump administration’s relentless verbal onslaughts on Fed Chairman Jerome Powell and its ever more frequent calls for interest-rate cuts are outweighing the fact that the US dollar actually still has a sizable interest-rate advantage as a result of the US central bank’s cautious monetary policy. For the time being, the trend is still your friend – moderation on the part of the US administration appears to be necessary in order for the greenback to stage a robust rebound. On the other hand, an early nomination of a successor to Powell would pour more gasoline on the fire.
• GBP/USD: The dollar has lost further ground recently also against the British pound. Despite its latest bout of weakness, the US currency is still overvalued as measured by purchasing power parity and alternative valuation models. Since one can assuredly speak of an established long-term trend reversal by now, it would not be surprising if the GBP/USD exchange rate were to gravitate toward its “fair” value in the quarters ahead. The dollar cannot even count on an interest-rate advantage versus sterling.
• EUR/CHF: In June, the Swiss National Bank refrained from administering the bitter pill called “negative interest rates.” It remains in the poison cabinet for the time being and, according to statements by SNB President Martin Schlegel, it is likely to be fetched from there only in the direst of emergencies, which probably would specifically mean in the event of a further and, above all, rapid appreciation of the Swiss franc. There are currently no signs of that happening, at least not with regard to the EUR/CHF exchange rate, which has stayed in a tight range in recent weeks. The franc’s strength is expressing itself mainly against the US dollar at the moment.
While the risk of a summer void on the news front seems small this year, a summer lull is a definite fact in the global corporate mergers and acquisitions (M&A) market. This applies at least to small and medium-sized transactions. Activity in mega deals picked up in the first half of the year. However, the total number of completed M&A transactions has fallen steadily in recent months. An increase in financing costs for acquisitions only partially explains the scant appetite for deals. The policy uncertainty radiating around the world from the USA likely has greater explanatory power because the real nosedive in the M&A market has only been observable since Donald Trump’s inauguration. The clog in the deal pipeline is unlikely to get dislodged unless Trump the dealmaker shifts his focus soon more toward growth-promoting issues like deregulation and concludes actual agreements instead of just setting new deadlines in the area of trade policy. In the meantime, it’s a consolation for investment bankers that at least the initial public offerings market is regaining momentum. The recent rally on stock exchanges has reopened the IPO window, at least for the moment.
Summer doldrums | Little appetite for deals
Number of closed M&A deals worldwide

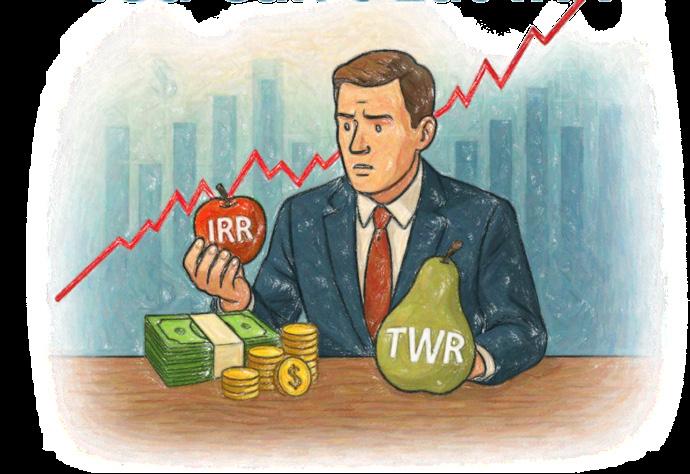
You can’t eat IRR: On realistic performance expectations for
More and more investors these days are becoming enthusiastic about investing in private equity. However, their interest in this asset class is often based on exaggerated return expectations of 20% and higher per annum. Due to inadequate knowledge and/or misguided marketing, apples (internal rates of return) frequently get mistakenly compared and equated with oranges (time-weighted returns). Those who know their way around the jungle of performance metrics are not only better informed, but are also likely to be disappointed less often by their private-market investments.
Good marketing or deception?
Private equity has steadily been gaining favor with investors in recent years. Although this asset class has not yet gone mainstream, it has long since broken out of its former niche role. Interest is mounting on both sides. Private equity managers view wealthy private clients as the next big growth market now that the potential among institutional investors has largely been exhausted. Individual private investors, in turn, want to partake in the vast universe of privately held companies to reap the highest possible returns amid low volatility.
Diversification has never harmed an investment portfolio, so individual private investors’ interest in investing in private equity is fundamentally a positive development. That interest becomes problematic, though, if it is based solely on lofty or even wildly overinflated return expectations, which can lead to misallocations or at least to big disappointments. This problem, unfortunately, is not purely of a theoretical nature. The image of private equity managers earning double-digit percent annual returns of 20% and above year after year is relatively widespread, not just among investors, but also in the financial press. But people not knowing
better is not the sole cause of that distorted image. Another reason is the not infrequently deceptive reporting and the sometimes misguided marketing by private equity firms that exploit the complexity of this asset class for their own purposes and advantage.
Tricks employed by managers
Very high performance figures turn up in, among other places, the quarterly and annual reports of publicly traded private equity firms. US-based private equity giant KKR, for example, reports an internal rate of return (before fees), or IRR for short, of 25.5% for the years 1976 through 2023 and compares that with the much lower performance posted by the S&P 500 index (11.9%) and MSCI World index (9.2%) over the same period. As a standard practice, the specialized private-market financial data providers Pitchbook and Preqin also use IRRs in their statistics to measure the performance of private equity funds. By that metric, even a merely median fund of vintage 2014 earned an IRR of 19% over the last 10 years (see chart above), and private equity funds that invest in niches or specialize in specific single sectors even achieved a whopping IRR of 31% on average over that same period. Another metric, however, shows that no investors in reality are likely to have actually earned a 31% annual return on their invested capital and to have grown it by a factor of 15x (1.3110) with those top performers. That’s because the multiple on invested capital (MOIC) for the 2014 vintage amounts to a still substantial but much less spectacular 2.5x, which equates to a normal (time-weighted) return of 9.6% over 10 years.
The extreme example above demonstrates that private equity IRRs cannot be compared and equated with the time-weighted returns on liquid asset classes like stocks, bonds, or gold. That’s because, on one hand, IRRs always refer only to the specific share of capital actually invested in private equity but not to the usually larger part of it that has to be temporarily parked in a money-market account or invested elsewhere during the investment term. On the other hand, IRRs depend greatly on the timing of capital flows. Large early distributions particularly drive up IRRs (see table below). The timing of negative cash flows, i.e. investors’ payments into private equity funds, also has an impact. Private equity managers can create an optically large IRR by working with credit lines to delay calling capital from investors. A substantial share of managers regularly makes use of this possibility to tune (or better said, manipulate?) performance.
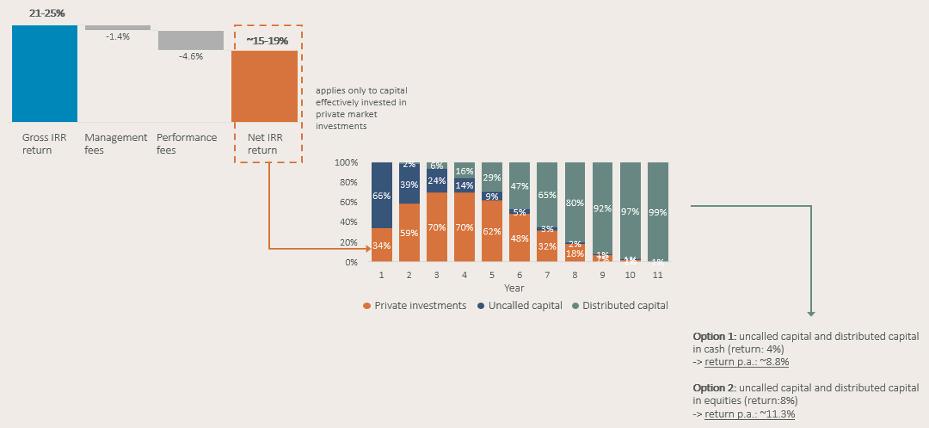
The mathematical path to disillusion (Capital-weighted) IRRs and time-weighted returns –just like proverbial apples and oranges – cannot simply be compared with each other. A closer look at the cost structure of private equity funds and the progression of a typical investment is helpful to gaining an understanding of why high IRRs of 20% and more erode considerably and leave a much smaller profit on the bottom line than one perhaps had been hoping for. Private equity has always been an expensive affair from an investor’s perspective, and the “democratization” of this asset class currently underway has done little thus far to change that. Private equity managers with a good track record continue to command annual management fees of 1.5%–2.5% and performance fees of 20%–25% today. Deducting those expenses turns a gross IRR of 23%, for example, into a net IRR of 17%.
So far, so clear (and nothing out of the ordinary). But what’s even more interesting and less present in the minds of most investors is the second part of the analysis of return erosion. The typical progression of a conventional investment in a private equity fund envisages that the committed capital is called and invested over a period of four to six years. Only that capital actually locked in private-market assets yields a return at the net IRR cited above. In contrast, the capital not yet called and the money expected to be restituted to investors by the private equity fund after several years generate a much lower return equal to either the money-market interest rate (if the capital is parked in a money-market account) or the return on the broad equity market (if the capital is invested in a broad equity ETF), depending on an investor’s risk appetite. Typically, an average of only 35% to 40% of the committed capital in a private equity fund is actually invested in private market assets across the entire 10-year investment horizon. Therefore, in our example, the net IRR erodes further to 11.3%
Not an ideal metric | IRRs are easy to manipulate Influence of timing of capital distributions on IRR
Sources: L. Phalippou1, Kaiser Partner Privatbank
From dreamlike IRRs… | …to the reality of time-weighted returns
Analysis of return erosion
Source: Kaiser Partner Privatbank
(in the case of investment in stocks) or to 8.8% (in the case of investment in a money-market account). The original gross IRR of 23% has thus decreased at least by half.
Once the gross IRR is corrected for fees and the capital allocation, only then do apples become oranges that can be compared with other liquid assets. The conversion table below shows what net IRRs are needed to earn equivalent time-weighted returns with an investment in a private equity fund. The difference is particularly striking if an investor is conservative and consistently leaves the uncalled committed capital in a money-market account. In that event, an IRR twice as high is needed to achieve the same capital growth after 10 years.
Our math exercise above is helpful in two respects. It not only puts the IRR metric into proper perspective, but at the same time illustrates why semi-liquid “evergreen funds” are arguably the better investment solution for most investors interested in private equity. Evergreens are always 85% to 90% invested in private-market assets, and they immediately reinvest the proceeds from
Once the gross IRR is corrected for fees and the capital allocation, only then do apples become oranges that can be compared with other liquid assets.
successful exits. This means that the bulk of the capital benefits from the compound interest effect (and from high IRRs). Evergreen returns, too, admittedly get reduced because a cash allocation of 10% to 15% must be kept available at all times to service liquidity needs. But on the bottom line, good evergreen funds are at least on a par with the kinds of professionally run multimanager programs that only institutional investors like large pension funds, foundations, and insurance companies are capable of implementing.
So, what returns are truly realistic with private equity? And are they also accessible to individual private investors via evergreen funds? Depending on the exact design of the investment vehicle, the specific allocation (e.g. venture/growth vs. buyout, or mega/large vs. mid-market), and the way in which the cash allocation is managed, managers of pure-play evergreen private equity funds normally aim for target returns ranging from 12% to 17%. A look at the London Stock Exchange shows that those numbers do not stir up unrealistic expectations. Since as early as the late 1980s, the LSE has been a listing venue for private equity investment trusts (e.g. Pantheon International since 1987, Hg Capital Trust since 1989) that operate on the evergreen
principle and have delivered annual returns of 12% to 15% over a period of more than 30 years. The plausibility of those figures has been validated by a study by CEM Benchmarking2, which found that US pension funds earned an average annual performance of 12.4% with private equity during the period from 1998 through 2020. The excess return versus liquid equity markets over the 23 years observed amounted to 200 basis points over US large caps and 340 basis points over world stocks excluding the USA.
In times of booming stock markets, annual returns of 11% or 12% may seem boring to many an investor. However, returns of that kind are actually higher than average in a long-term context. Since stock markets are still relatively highly valued despite this year’s correction and double-digit equity returns are unlikely again in the next five years, that’s precisely the reason why private equity is very attractive at the moment. In the past, the performance of this asset class has been especially high particularly during periods of flat or declining stock markets.
Evergreen funds are the ideal vehicle to enable individual private investors to partake in the long-term outperformance potential of private equity and to diversify their portfolios by blending in this asset class. It is relatively easy to steer the target allocation with the aid of evergreens. Moreover, the capital is fully invested right from the outset and benefits from the compound interest effect. Furthermore, in contrast to traditional private equity funds with capital calls, with evergreens investors know right from the start in which (privately held) companies they are investing – there is no blind-pool risk. And whereas traditional funds are illiquid or are sellable on the secondary market only at a steep discount to their intrinsic net asset value, evergreen funds are semi-liquid. Investors normally can redeem their shares monthly or quarterly. However, redemption isn’t guaranteed because most managers reserve the right to limit the volume of share redemptions or to suspend them entirely during periods of financial-market stress. Generally speaking, private equity – evergreen funds included – remains an asset class for which investors should have a long time horizon of at least three years or, better yet, more than five years.
One other crucial point also mustn’t go unmentioned: apart from limited redemptions, private equity managers have the capital in open-end evergreen funds at their perennial disposal – hence the name “evergreen.” Whereas managers of traditional private equity funds have to liquidate their assets at as high a value as possible within a compressed time frame of three to six years, managers of evergreen funds are not under this compulsion. They earn their management fees solely on the basis of a fund’s invested capital volume and therefore may have an incentive not to cash in prematurely. Evergreen funds that are not spread widely across
a variety of managers and numerous private equity deals but are instead highly concentrated under the management of a single private equity firm are particularly susceptible to this problem.
Even though it has become easier these days to gain access to the world of private equity, conducting rigorous due diligence when selecting managers remains just as important as making sure that a private equity portfolio has an optimal allocation. A do-it-yourself approach is likely to be the right way for only the fewest of individual private investors. One would be well advised to place trust in the expertise of a professional wealth management consultant.
*1 L. Phalippou (2024): „The tyranny of IRR”
*2) A.D. Beath, C. Flynn (2022): „Asset Allocation and Fund Performance of Defined Benefit Pension Funds in the United States, 1998-2020”
What’s realistic? | Good managers historically have earned a 12%-15% annual return
Performance of exchange-listed private equity investment trusts
Sources: Bloomberg, Kaiser Partner Privatbank
The most important chart | Private equity performs at the most crucial times
Average four-year excess return on private equity
This document constitutes neither a financial analysis nor an advertisement. It is intended solely for informational purposes. None of the information contained herein constitutes a solicitation or recommendation by Kaiser Partner Privatbank AG to purchase or sell a financial instrument or to take any other actions regarding any financial instruments. Furthermore, the information contained herein does not constitute investment advice. Any references in this document to past performance are no guarantee of a positive future performance. Kaiser Partner Privatbank AG assumes no liability for the completeness, correctness or currentness of the information contained herein or for any losses or damages arising from any actions taken on the basis of the information in this document. All contents of this document are protected by intellectual property law, particularly by copyright law. The reprinting or reproduction of all or any parts of this document in any way or form for public or commercial purposes is expressly prohibited unless prior written consent has been explicitly granted by Kaiser Partner Privatbank AG.
Publisher: Kaiser Partner Privatbank AG
Herrengasse 23, Postfach 725 FL-9490 Vaduz, Liechtenstein HR-Nr. FL-0001.018.213-7
T: +423 237 80 00, F: +423 237 80 01 E: bank@kaiserpartner.com
Editorial Team: Oliver Hackel, Senior Investment Strategist
Design & Print: 21iLAB AG, Vaduz, Liechtenstein