
Monthly Market Monitor
2024
March
Content The Back Page Asset classes 17 Macro Radar Taking the pulse of economic activity 6 Asset Allocation Notes from the Investment Committee 8 In a Nutshell 4 Theme in Focus Index concentration: A problem or not? 11 Ask the experts What is stirring our clients (and moving the financial markets) 15 Kaiser Partner Privatbank AG | Monthly Market Monitor - March 2024 3
The upward momentum on equity markets around the world continued across a broad front in February as more and more indices set new records.
Chart of the Month
In a Nutshell
Our view on the markets
US economic activity still in the sweet spot
Economic activity in the USA continues to follow the trajectory of a Goldilocks scenario. The economy appears to be gliding in for a soft landing without slipping into a recession. However, the more stubborn-than-expected inflation of late poses a risk to this best-case scenario. If the Fed sticks with its very restrictive monetary policy for too long, that could stifle economic growth in the quarters ahead. The government of China, meanwhile, is faced with a different problem and is trying to win back the trust of businesses and consumers.
All-time highs across a broad front
The upward momentum on equity markets around the world continued across a broad front in February as more and more indices set new records. Recent weeks even saw Japan’s Nikkei 225 index surpass its record high from late 1989. The upward move was driven once again first and foremost by large-cap technology stocks. Although vulnerability to a short-term price correction is increasing, a sustained U-turn is unlikely in the immediate future. Big Tech thus far hasn’t disappointed the hopes that investors have pinned on the artificial intelligence theme.
Index concentration: A problem or not?
Investors especially have a massive outperformance by the Magnificent Seven to thank for the rewarding year on the equity market in 2023. On the back of a years-long rally, the weight of the biggest US technology companies in the major stock indices has swelled to a possibly record-breaking high level. We examine the question of to what extent and for whom the top-heavy index concentration poses a problem, whether it’s a manifestation of a bubble, and how investors should deal with it.
Ask the experts
Has OPEC lost its influence over the oil market? How have our capital market expectations for the next five years changed? Is an end to the Chinese real estate market crisis in sight? What are “basis trades” all about? And does the recent approval of Bitcoin ETFs by the US Securities and Exchange Commission mark the definitive breakthrough for cryptocurrencies? You’ll find our answers to these questions in our quarterly Q&A.
Equity analysts are optimists by profession (exceptions confirm the rule), and they perennially forecast constantly rising stock prices, and rightly so because the longterm price arrow on equity markets points upward and whoever continually predicts a crash is right only once in a blue moon and otherwise is dead wrong in most cases. However, during the last two years, the analyst community was in a bearish mood during “forecasting time” at the end of 2022 and 2023. In both instances, the projected 12-month price target for the S&P 500 index was uncustomarily below the actual index level at the time. Most analysts therefore have trailed behind and have had to chase after the rising stock prices over the course of recent quarters, a trend that continues to this day and which is indicative of a market driven by momentum. Once every seat on the stock-market carousel is occupied, a major correction looms (among large caps). It could be accompanied by a rotation into small caps that have lagged behind thus far.
Behind the curve | Analysts are behind on raising their price targets S&P 500 index and analysts’ index target Sources: Bloomberg, Kaiser Partner Privatbank 3500 4000 4500 5000 5500 S&P 500 Analyst Forecast 01/2023 07/2022 01/2022 01/2024 07/2023
Monthly Market Monitor - March 2024 | Kaiser Partner Privatbank AG 4
Kaiser Partner Privatbank AG | Monthly Market Monitor - March 2024 5
The US economy has carried the positive momentum from 2023 into the new year.
Macro Radar
Taking the pulse of economic activity
Economic activity in the USA continues to follow the trajectory of a Goldilocks scenario. The economy appears to be gliding in for a soft landing without slipping into a recession. However, the more stubborn-than-expected inflation of late poses a risk to this best-case scenario. If the Fed sticks with its very restrictive monetary policy for too long, that could stifle economic growth in the quarters ahead. The government of China, meanwhile, is faced with a different problem and is trying to win back the trust of businesses and consumers.
US economic activity is still in the sweet spot
The US economy has carried the positive momentum from 2023 into the new year. The US Economic Surprise Index has been trending back upward since mid-January, indicating that macro data points have been coming in mostly better than expected since then. A number of leading economic indicators – such as ISM purchasing managers’ indices, for example – that have been reliable warning signals of a recession in the past have recently stabilized or have already turned upward. Last but not least, sentiment among CEOs and consumers has also picked up noticeably in recent months. By the same token, though, an immediate overheating of economic activity this year is unlikely despite these dynamics. Monetary policy is restrictive and looks set to become even more so due to receding inflation (and rising real interest rates), and banks have recently further tightened their lending. Meanwhile, consumers’ surplus savings from the pandemic years will soon be exhausted, which should tend to put a drag on their spending behavior.
Rate-cutting potential corrected
All in all, the picture in the USA resembles a soft landing. The threat of a recession has been postponed for the time being to the second half of this year. Whether or not one will occur at all will likely be co-determined particularly by the US Federal Reserve. To facilitate the positive economic scenario, sooner or later the Fed would have to lower interest rates. However, in the wake of the higher-than-expected January inflation data, voices of Fed officials who see a bigger risk in cutting interest rates too soon have been dominating lately. A rate cut in March seems definitively off the table. In fact, new life has been breathed into the “higher for longer” narrative. Market expectations have pulled back from six quarter-point rate cuts this year to four. The first rate cut now isn’t expected until June. The waning US rate-cutting potential doesn’t make the European Central Bank’s job any easier. The weaker state of economic activity in the Eurozone makes lower interest rates more urgent for the ECB than for the Fed, but the ECB actually beating the Fed to the punch in altering interest rates would be a first in the central bank’s 26-year history.
China’s central bank delivers more than expected China sank deeper into deflation in January with an inflation rate of –0.8%. The policy response to this alarming trend surprised on the positive side for once. After the People’s Bank of China refrained from providing stimulus through interest-rate cuts at the end of last year, it delivered more than expected in February by lowering the benchmark rate for mortgages (the five-year loan prime rate) by 25 basis points in one fell swoop. This means that the PBoC is explicitly striving to revive China’s real estate market. The government of China had already enacted a variety of measures in recent weeks aimed at helping out this problem child. It remains to be seen to what extent this action sounds the starting gun for more extensive economic stimulus. The government’s anxiously awaited new growth target could provide an initial indication about whether more stimulus will follow.
The calls are getting louder | More and more economists want lower interest rates Proportion of economists who consider Fed policy to be "too restrictive" Sources: National Association of Business Economics, Kaiser Partner Privatbank 0 10% 20% 30% 40% 50% 2000 2005 2010 2015 2020
Monthly Market Monitor - March 2024 | Kaiser Partner Privatbank AG 6
Kaiser

Consensus estimates 2023 2024 2025 GDP growth (in %) Switzerland 0.8 1.2 1.5 Eurozone 0.5 0.5 1.4 UK 0.3 0.4 1.2 USA 2.5 2.0 1.7 China 5.2 4.6 4.3 Inflation (in %) Switzerland 2.1 1.5 1.4 Eurozone 5.4 2.3 2.1 UK 7.3 2.5 2.1 USA 4.1 2.7 2.4 China 0.2 0.8 1.7
rates view Last 3M 12M Key interest rates (in %) Switzerland 1.75 → ↘ Eurozone 4.00 → ↘ UK 5.25 → ↘ USA 5.50 → ↘ China 2.50 → → 10-year yields (in %) Switzerland 0.79 → ↘ Eurozone 2.42 → ↘ UK 4.13 → ↘ USA 4.23 → ↘ China 2.38 → → Kaiser Partner Privatbank AG | Monthly Market Monitor - March 2024 7
Partner Privatbank interest
Asset Allocation
Notes from the Investment Committee
Equity markets began this year the same way they ended 2023: with significant share-price gains for US technology giants. The new all-time highs on the US stock market after a more than two-year dry spell make a statistical case for further share-price advances.
The upward momentum on equity markets around the world continued across a broad front in February as more and more indices set new records.
Equities: All-time highs across a broad front
• The upward momentum on equity markets around the world continued across a broad front in February as more and more indices set new records. Recent weeks even saw Japan’s Nikkei 225 index surpass its record high from late 1989 after more than 34 years. Europe’s benchmark Stoxx 600 index likewise climbed to new heights. The upward move was driven once again first and foremost by large-cap stocks while small caps spent another month treading water. Shares of Nvidia were once again the star performer in February. After the chip manufacturer’s quarterly results beat analysts’ already high expectations, Nvidia’s stock price rose by another 30% or so over the course of February, putting the company in third place in the US top ten in terms of market capitalization, ahead of Alphabet and Amazon. The torrid share-price advance by this one stock alone accounts for around 25% of the S&P 500 index’s year-to-date gain.
• The meteoric momentum of a handful of large caps in the technology sector has almost assumed the character of a full-blown mania lately.
The array of extremely bullish readings in a variety of sentiment indicators fits with this picture. The investment quota among active managers, for example, is at an elevated level, as is sentiment among US retail investors. Meanwhile, the VIX volatility barometer is displaying an absence of fear, just like the ratio of put to call options on stocks is. However, these indicators are nothing more than a warning signal. The self-reinforcing momentum would make it difficult to time a potential bubble. Moreover, the final stage of a mania is usually marked by another burst of sharp share-price gains. So, taking profits is a better strategy than completely exiting the market.
Asset Allocation Monitor - + - + Cash Equities Fixed Income Global Sovereign bonds Switzerland Corporate bonds 02/2024 Europe Microfinance UK Inflation-linked bonds 02/2024 USA High-yield bonds Japan Emerging-market bonds 02/2024 Emerging markets Insurance-linked bonds Alternative Assets Convertible bonds Gold Duration Hedge funds Currencies Structured products US dollar Private equity 02/2024 Swiss franc Private credit Euro Infrastructure British pound Real estate
Scorecard - + Macro Monetary/fiscal policy Corporate earnings Valuation Trend Investor sentiment
Monthly Market Monitor - March 2024 | Kaiser Partner Privatbank AG 8
• Even though vulnerability to a short-term price correction is continually increasing, we see no reason to expect a drastic U-turn in the immediate future. One encouraging factor is how well the equity market lately has coped with the scaled-back expectations for interest-rate cuts by the US Federal Reserve, which have retreated from 170 to 90 basis points in the span of a few weeks. The fact that Big Tech thus far hasn’t disappointed the hopes that investors have pinned on the artificial intelligence theme and has actually undergirded them with good revenue and profit figures also suggests that the current stock-market trend is not yet an unhealthy one. All of the Magnificent Seven companies except Tesla posted a strong Q4 2023. Shortly before the end of the reporting season (as of February 22), the blended year-on-year earnings growth rate of +7% for the S&P 500 index for Q4 2023 was entirely attributable to the Mag 7 alone; stripping out those heavyweights, the blended earnings growth up to that point in time amounted to –4%.
Fixed income: Not so fast!
• The big turning point on the bond markets last autumn was followed by another smaller one in January. The change in the direction of bond yields in both cases was caused by the US Federal Reserve. Last October, the Fed communicated relatively clearly that its policy rate had reached the top of the flagpole, which caused the yield on 10-year US Treasurys to fall from 5% to 3.8% within a span of two months. And it was comments by Fed Chairman Jerome Powell that triggered another U-turn at the end of January. The Fed chief said that a federal funds rate cut by as early as March, which the markets theretofore had been hoping for, was too soon and would risk reigniting inflation. The 10-year yield subsequently climbed back to around 4.4% by the end of February on those remarks. Yields now could fluctuate in a horizontal channel demarcated by those two levels in the months ahead.
• A breakout on the upside (to above 5%) would require a further acceleration in economic activity combined with a sustained increase in inflation as a catalyst and is thus rather unlikely to happen, in our opinion. A breakout through the bottom boundary of the range (to below 3.8%) would be most expectable in a recession scenario. A recession is still possible, especially if the Fed doesn’t make a move soon, but US economic indicators on the whole suggest that the risk of a recession has diminished lately. From a tactical investment standpoint, we consider government and investment-grade corporate bonds the most attractive fixed-income assets right now against this backdrop (we are mildly overweighing them). We are positioned neutrally in high-yield bonds and are underweighting inflation-linked and emerging-market bonds.
Alternative assets: Unabated crypto euphoria
• The risk-on sentiment seen on equity markets in recent weeks has also left its mark on cryptocurrencies. On the heels of the entirely expectable profit-taking following the US Securities and Exchange Commission’s approval of nearly a dozen new Bitcoin ETFs, new upward impetus kicked in at the end of January, propelling the price of Bitcoin beyond the USD 50,000 mark. The upsurge was supported by sustained net capital inflows into the crypto complex. The bullish scenario propounded by crypto optimists who consider the Bitcoin ETFs a beknighting of this still-young asset class thus appears to be coming true so far. The price of gold hasn’t been able to keep pace with the “new gold” over the last two months. The yellow precious metal’s breakout above its previous all-time high of USD 2,080 per ounce in early December turned out to be a false signal. Gold would first have to lastingly overcome this resistance barrier to trigger a compelling buy signal.
Currencies: The beginning of Swiss franc weakness?
• EUR/USD: The trajectory of the EUR/USD exchange rate is an exact replica of the recent constant pivoting by central bankers. The revival of the motto “higher for longer” initially dealt the euro a setback in early February. During the next several days, though, the European Central Bank put up some resistance with hawkish statements, and the euro accordingly rebounded. In the big picture, we see a wider price channel between USD 1.04 and USD 1.13. This probably won’t be up for debate until one of the central banks moves more forcefully toward cutting interest rates.
• GBP/USD: The British pound has been moving in an extremely narrow range between 1.25 and 1.28 against the US dollar for three months now – an unusual showing for this high-beta currency. The pound’s lethargy is likewise a reflection of the waiting for direction-setting actions by the central bank. If the Bank of England loosens the interest-rate screw before the Fed does, which seems possible given the continuation of favorable inflation surprises, the pound could suffer a short-term fainting spell.
• EUR/CHF: The EUR/CHF exchange rate has been heading in an unusual direction – upward – since the start of this year. The driver of the appreciation of the franc over the last two years is rapidly losing force due to the significant pullback in inflation rates in the Eurozone. Meanwhile, the Swiss National Bank has lost its appetite for an even stronger franc. A weak currency, though, is also not in the SNB’s interests. If the franc were to slump, the SNB could respond to that with proven remedies. Last but not least, a number of technical obstacles in the form of intact downtrend lines are standing in the way of a stronger euro.
The big turning point on the bond markets last autumn was followed by another smaller one in January.
Kaiser Partner Privatbank AG | Monthly Market Monitor - March 2024 9
Stock indices are subject to constant change, and no index better reflects this fact than the Dow Jones Industrial Average index, which has been in existence since 1896 and was first published in the Wall Street Journal on May 26 of that year. The venerable Dow is a special case in this context. An “index committee” made up of delegates from S&P Dow Jones Indices and the Wall Street Journal determine the contemporary composition of the blue-chip index, which aims to representatively reflect the US economy and its constant state of flux at all times. The latest update of the index was undertaken in February: Amazon – a technology stock and a member of the Magnificent Seven – now joins the index, replacing drugstore chain Walgreens Boots Alliance in the exclusive club. However, caution is called for in imitating this substitution in one’s portfolio. In the past, joiners and leavers of the index have experienced stock-price U-turns on multiple occasions after such switches.
Chart in the Spotlight
Change in favorites? | Index rotations are not a good buy (or sell) signal Dow Jones Industrial Average index and joiners/leavers, indexed

Sources: Bloomberg, Kaiser Partner Privatbank 0 50 100 150 200 250 2020 2021 2022 2023 2024 Dow Jones Industr a Index Salesforce Exxon Mobi e Amazon Walgreens Boot Al iance Salesforce enters Dow Jones index Exxon Mobile exits Dow Jones index Monthly Market Monitor - March 2024 | Kaiser Partner Privatbank AG 10
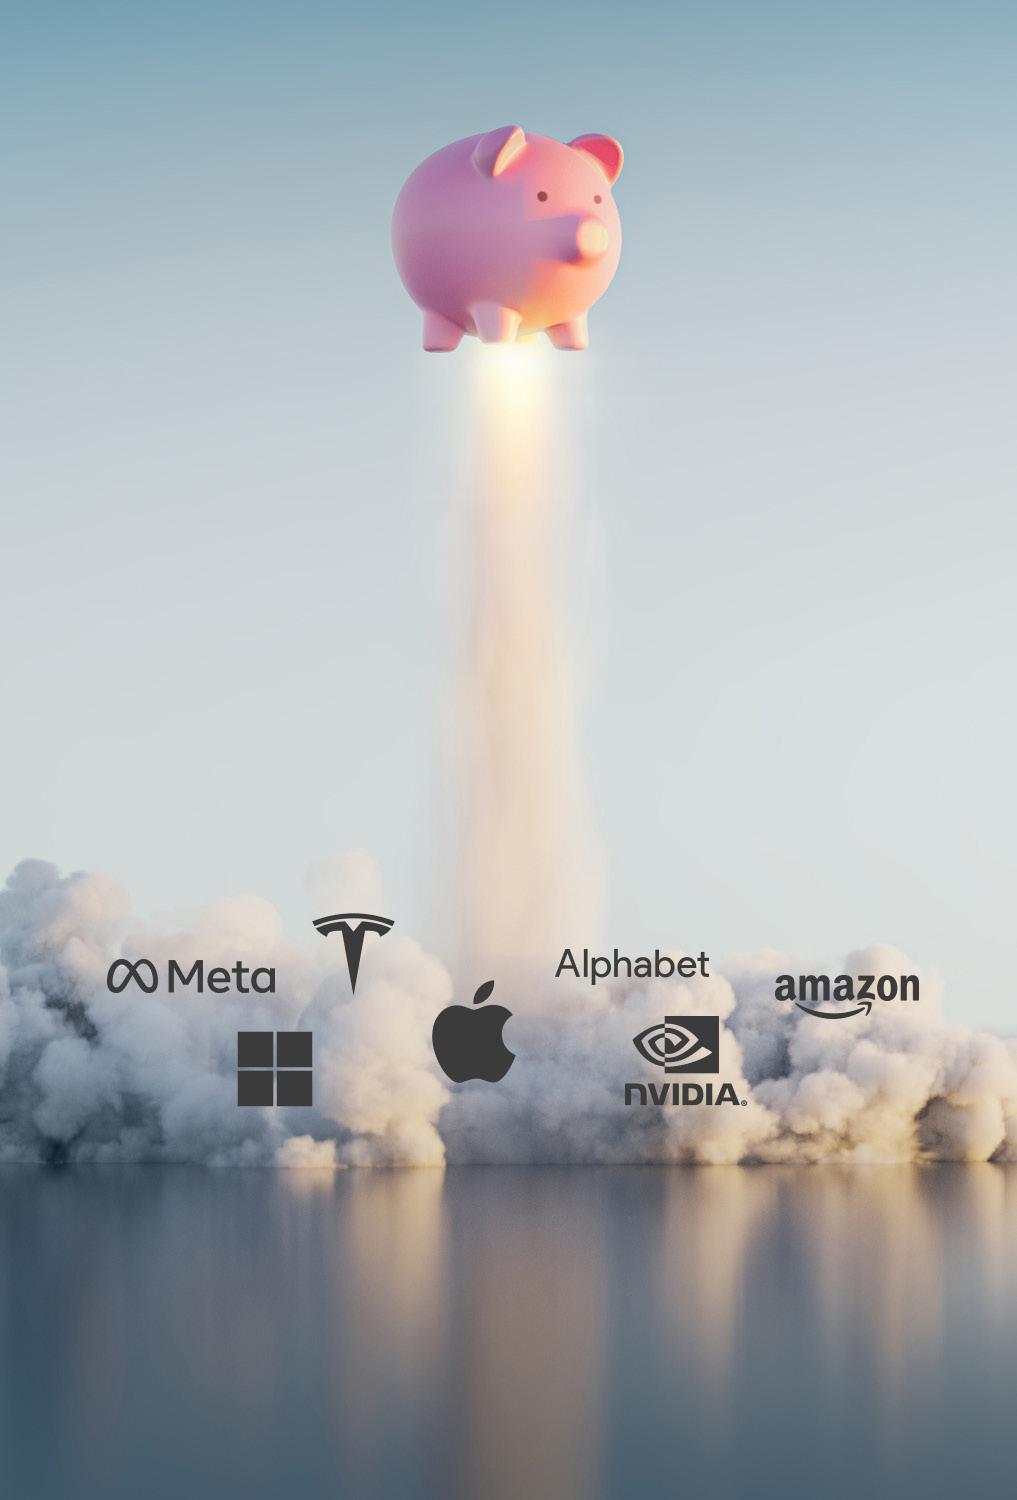
Theme in Focus
Index concentration: A problem or not?
Investors especially have a massive outperformance by the Magnificent Seven to thank for the rewarding year on the equity market in 2023. On the back of a years-long rally, the weight of the biggest US technology companies in the major stock indices has swelled to a possibly record-breaking high level. In the following article, we address the question of to what extent and for whom the top-heavy index concentration poses a problem, whether it’s a manifestation of a bubble, and how investors should deal with it.
Extreme in the short run…
The fact that the big (US) technology stocks have an ever heavier, direction-determining weight in the major equity indices is no longer headline-worthy in itself. Acronyms describing this trend have been around since the mid-2010s. FANG (Facebook (today Meta), Amazon, Netflix, Google) evolved into FAANG (with Apple) and then FAAMG (with Microsoft replacing Netflix). In light of the immense popularity of those technology stocks, the finance industry didn’t let the chance slip to launch a specific FANG+ index and associated derivative products later on. Last year, however, betting on the biggest technology stocks experienced a further remarkable escalation. Seven large-cap stocks – the FAAMG quintet plus Tesla and Nvidia – downright dominated the action on the US equity market. Instead of reaching for another acronym, the media invented a formal name for this group of stocks: the Magnificent Seven (Mag 7), because their performance in 2023 was indeed truly magnificent. The value of the Mag 7 rocketed by 76% while the value of the rest of the stocks in the USA’s blue-chip S&P 500 index (hereinafter to be called the S&P 493) increased by only 14%. The seven high flyers together accounted for more than 60% of the S&P 500 index’s performance for the year. The Mag 7 started out 2024 as well with a continued outperformance as some of its members hit new all-time highs. This raised the weight of the Mag 7 in the S&P 500 to a new high of more than 29%. Many investors are thus rightly asking themselves whether this top-heavy concentration could become a problem at some point.
…but nothing out of the ordinary in the long run
When it comes to answering the question of how extreme the current situation is, it helps – as it so often does – to take a comparative look at the past. Compared to the situation shortly before the bursting of the technology bubble around the time of the turn of the millennium, the S&P 500 index is more concentrated today. The weight of the top 10 stocks, at a good 33%, is higher than it was in the year 2000 (when it was almost 27%). However, the weight of the top 10 was actually even
Strong (out)performance | But also more volatility Comparison of performance of “Mag 7 vs. the rest”, indexed as of January 1, 2023
Corpulent | Is Ozempic needed?
Weight
Sources:
much higher for a while in the 1960s, when there was likewise a group of dominating stocks on the US market called the Nifty 50 (which included names like IBM, Coca-Cola, Procter & Gamble, McDonald’s, and Disney). And a handful of companies had an overproportionate weight in the overall market also in the decades prior between 1930 and 1960. Similar to today with the internet, e-commerce, and the recent rise of the artifi-
Kaiser
80 100 120 140 160 180 200 220 240 Magnific ent Seven S&P 493 Russe l 2000 S&P 500 Equal We ght Index 01/2023 07/2022 01/2022 01/2024 07/2023
Sources: Bloomberg,
Partner Privatbank
of the Mag 7 in the S&P 500 index
Bloomberg, Kaiser Partner Privatbank 5% 10% 15% 20% 25% 30% 2015 2016 2017 2018 2019 2020 2021 2022 2023 2024 Kaiser Partner Privatbank AG | Monthly Market Monitor - March 2024 11
cial intelligence theme, back then telecommunication, electrification, and automobile manufacturing were the megatrends that sent certain industries and companies soaring. At that time, names like AT&T, General Motors, and General Electric, which are still known today (and still in existence), consistently ranked among the top 5 in the USA for decades. So, from a purely temporal perspective, the half-life of the Mag 7 looks far from over. The majority of the Mag 7 companies have been in the top 10 only since 2020, and Tesla and Nvidia in particular are veritable newcomers, historically speaking. Only Microsoft has managed to stay at the top of the heap of heavyweights for more than two decades already.
single holdings that exceed 5% of the fund’s net asset value at the time of investment. Both phenomena are part of the reason why a record number of active fund managers lagged the benchmark last year. This creates a vicious cycle. The poor performance by active managers causes more money to constantly flow into the alternative: passive ETFs. In turn, by design, most of the money in passive ETFs automatically flows into shares of the largest companies, which tends to further drive up their prices. Price momentum fosters momentum in capital flows, and vice versa.
Aside from that problem, which possibly has further intensified the momentum of the Mag 7 trade in recent months, the heavy weight of a few stocks tends not to be problematic, according to the current state of financial theory studies. For example, studies from 2008 (FTSE 100) and 2022 (USA and BRICS) found no evidence that highly concentrated stock indices exhibit greater volatility than others do. Working papers have also negated the supposition that an index composed of a few superstars is tantamount to weak market competition. Meanwhile, the rather technical question of to what extent a rally driven by only a few stocks is a sign of an imminent price correction generally tends to get examined in technical analysis studies mostly in reference to short time frames. But here, too, the conclusion most times is that a narrow market – counterintuitively – is not problematic.
The Mag 7 in the SWOT crosshairs
However, one problem could exist theoretically: if all of the top stocks were to have unrealistically lofty valuations, a bubble could burst, similar to what happened in the year 2000. That would lastingly depress the broad market. The SWOT analysis below answers the question of to what extent concerns of that kind are appropriate.
Strengths:
Momentum begets momentum
Is the top-heavy index concentration a problem now? It is indeed, at least for many active fund managers. That’s because in order to achieve an outperformance of the benchmark (which is usually the S&P 500), they frequently underinvest in index heavyweights that supposedly are already richly valued. And even those managers who would like to place bets on index heavyweights often encounter regulatory obstacles because US investment funds that are registered with the Securities and Exchange Commission as “diversified” are not allowed to put more than 25% of their assets into
• Arguably the greatest strength of the Mag 7 is a fundamental one. Their stellar performance over the last four years was almost exclusively attributable to revenue growth and profit margin expansion. Their slightly increased valuation, on the other hand, explains only a small part of their stock performance. At a forward price-to-earnings multiple of around 30x, the seven technology titans admittedly are far more expensive than the S&P 493 with their aggregate forward P/E of 18x. However, the Mag 7 in turn are growing at a much faster rate. The analyst community’s consensus estimate projects that the Mag 7 will boost their revenue by an average of 12% per annum through end-2026, outpacing the rest of the market’s revenue growth by a factor of 4x, and doing that at a profit margin that is twice as high and continues to climb (net profit margin 2023-26e: 21.8% vs. 10.2%). Adjusting for the robust growth, rich cash flows, and earnings quality puts the valuation of the Mag 7 much more into perspective and makes it characterizable as “fair”, which is a crucial differen-
| …is the only constant Largest US stocks by market capitalization, 1930–2023 Sources: Dimensional Fund Advisors, Kaiser Partner Privatbank AT&T Largest General Motors General Electric Exxon Marathon Oil DuPont 1930 1940 1950 1960 1970 1980 1990 2000 2010 2020 2023 26.8% 33.0% 26.7% 30.9% 25.1% 17.4% 13.4% 19.9% 16.2% 21.7% 27.5% 1 2 3 4 5 6 7 8 9 10 Companies Ranked by Weight Combined Market Share for 10 Largest Companies Single Decade Appearance in Largest 10 Multiple-Decade Appearance in Largest 10 Con Edison NY Central RR Philadelphia Co. Penn Central Cola-Cola Union Carbide Gulf Corp IBM Chevron Texaco Sears Shell BellSouth CitiGroup Lucent Intel Cisco Time Warner Atlantic Richfield Visa Walmart Johnson & Johnson JP Morgan Eli Lilly Berkshire Hathaway Tesla Meta Nvidia Amazon Alphabet Microsoft Apple Amoco BristolMyers Squibb Merck Mobil Altria P&G Xerox
Change…
Shifted market forces | Passively managed assets are in the ascendancy now Share of passively managed assets in the overall market Sources: EPFR, Kaiser Partner Privatbank 10% 20% 30% 40% 50% 60% 2004 2006 2008 2010 2012 2014 2016 2018 2020 2022 Global Equity US Equity
Monthly Market Monitor - March 2024 | Kaiser Partner Privatbank AG 12
Is the top-heavy index concentration a problem now? It is indeed, at least for many active fund managers.
ce compared to the technology bubble at the turn of the millennium. At that time, the valuations of the largest tech stocks were around twice as high as today, and instead of being profit-making machines like they are now, most of the tech companies back then actually burned cash.
• Most of the top 10 companies of the past, which operate in the “physical world” of automobile production (General Motors), supermarkets (Walmart), or staple consumer goods (Procter & Gamble), eventually reached certain limits to their growth due to geographic or resource-related factors. The Mag 7, in contrast, operate for the most part in a virtual world of zeros and ones – the physical limitations to their expansion might be farther away than in previous cycles.
• Although the members of the Mag 7 rank among the world’s largest companies, their respective free floats (the proportion of shares available to the public for trading in the open market) are relatively constrained, a fact that has been further worsened in some cases by regularly recurring stock buybacks (like at Microsoft for two decades now). This exerts a constant upward pull on the prices of the largest technology stocks in today’s investment world dominated by ETFs and index funds.
Weaknesses:
• The Mag 7 have outperformed the MSCI World index in nine of the last ten years, with the exception of 2022. The fact that this popular coterie of stocks is beloved by many investor groups such as retail investors and hedge funds (though not by actively managed investment funds, as explained above) and accordingly is disproportionately overrepresented in portfolios is arguably the greatest weakness of the Mag 7.
• Many of those investors believe that the Mag 7 are made of Teflon. They want to be invested in them if the US economy slips into a recession because their (mostly) less cyclical business models give them defensive qualities. And they want to be invested in them if economic activity continues to hum because the Mag 7 benefit more than average from economic expansion. The problem, though, is that the past has shown that there are seldom any investments on financial markets that win on both heads and tails of a coin toss. And if they do exist, they’re not investments that almost everyone already has in his or her portfolio.
Opportunities:
• The firing of the starting gun for the rally of the technology sector in general and the Mag 7 in particular coincided exactly with the launch of ChatGPT. Proof that this was not first and foremost a coincidental correlation but instead owed at least in large part to causation was delivered at the latest by the financial figures and guidance disclosed by the tech-
The Mag 7 are growing faster… | …and more profitably
Consensus estimates for revenue growth and net profit margins for 2023–2026 period
nology companies in their most recent reporting for the fourth quarter of 2023. The quintessence was that the world of artificial intelligence presents enormous growth opportunities that will be realized shortly. The leading US companies are once again in the pole position here, in large part because policymakers have already put legal obstacles in the way of European companies.
Threats:
• Investors undoubtedly are pinning high expectations on an AI revolution. If the growth that they’re hoping for doesn’t materialize, one can expect to see those stocks affected suffer at least a short-term price setback. The performance of Tesla’s stock in recent months provides a visual aid for picturing such a scenario.
• Big, bigger, too big? Many a US technology giant has grown so big in the meantime that questions about monopolistic dominance and inadequate competition are getting louder and louder. The Biden administration has since started to scrutinize the conduct of the technology giants more critically, which has been reflected not least by a string of antitrust lawsuits. No landmark rulings have been handed down in them to date, but the headwind for Big Tech looks set to tend to gain further intensity. A breakup of at least one of the Mag 7 companies in the next five to ten years is definitely a plausible scenario.
• A change of leadership in the White House – read: Trump 2.0 – would likewise be no reason for the big technology companies and their shares to breathe a sigh of relief. Quite the contrary, in fact, Donald Trump could be plotting revenge and might turn up regulatory pressure on those companies that actively or passively put obstacles in his way after the storming of the Capitol. A newly reelected President Trump would at least ask why, after January 6, 2021, he was banned from Facebook, Instagram, and YouTube, why the Parler app was removed from the Apple and Android app stores, and why Amazon denied Parler access to its cloud storage service.
The Mag 7 have outperformed the MSCI World index in nine of the last ten years, with the exception of 2022.
Sources: Goldman Sachs, Kaiser Partner Privatbank 35% 30% 25% 20% 15% 10% 5% 0 NVDA TSLA MSFT META AMZN GOOGL AAPL S&P 493 Mag7 Sales growth 2023-26e
Kaiser Partner Privatbank AG | Monthly Market Monitor - March 2024 13
• The strong performance by the Mag 7 ultimately also could become an impediment – a hindrance at least to their continued outperformance. Stocks, by nature, post huge excess returns versus the benchmark in the years before ascending to the top10 summit. But once they have climbed that high in the market capitalization rankings, the excess return shrinks considerably and even turns negative from year five onward after having reached the top.
Big is beautiful? | It becomes harder for the really big stocks to outperform
Average annual outperformance of US stocks before/after belonging to the top 10
Less synchronous in the near future
The Mag 7 all had a strong stock performance in common in recent years, but whether they all permanently belong in the same pot remains to be seen and is highly doubtful. In any case, the price drivers and risks are not the same for all of them. Nvidia and Tesla, for example, are increasingly dependent on relations between the USA and China not deteriorating further. There are also wide valuation and growth differences between the members of the Mag 7. Companies that are unable to undergird AI hopes fast enough with corresponding good revenue and profit figures risk decoupling from the rest of the group – downward with regard to their share prices. This process may have already begun because since the start of this year, if not before, the price trajectories of the seven stocks have increasingly been diverging. While Apple’s share price is stagnating, a weak outlook threatens to knock Tesla out of the US top 10 altogether. The Magnificent Seven in their current configuration may have already seen their best days. But everyone knows that the media never run out of new names for the future group of frontrunners, and if in doubt, they can turn to ChatGPT for help these days.
Sources:
What now?
The SWOT analysis paints a neutral picture for the Mag 7 on balance. Investors do not urgently need to buy this group of stocks right this minute at peak prices out of fear of missing out on the artificial intelligence trend, but nor are these stocks so outrageously richly valued on aggregate that investors should categorically shun them. The top-heavy concentration in the major equity benchmarks likewise is not a real problem in this sense. However, investors should at least be aware that their exposure to a narrow set of stocks is greater than they perhaps suppose. The Mag 7 by now already make up a good 19% of even the globally diversified MSCI World index. Whoever exclusively invests passively in the well-known blue-chip indices implicitly holds a certain clump of Big Tech in his or her portfolio. This concentrated risk can be diluted by blending in equal-weighted index ETFs, small caps, or actively managed funds (on the condition of good stock selection). A strategy of that kind is likely to pay off over the longer term because one thing is still as true as ever on financial markets: sooner or later the law of reversion to the mean kicks in. When it does, the Mag 7, or possibly some new acronym, will underperform.
Dimensional Fund Advisors, Kaiser Partner Privatbank % % % % % ea bef e ea bef e ea bef e ea a e ea a e ea a e % % % % % % a f f ca e da ea e
then there were just five | New acronym sought Performance of the Mag 7, indexed Sources: Bloomberg, Kaiser Partner Privatbank 60 80 100 120 140 160 NVIDIA Meta Amazon Microsoft Alphabet Apple Tesla 08/2023 02/2024 01/2024 12/2023 11/2023 10/2023 09/2023 Time for a reversion to the mean? | This “law of nature” is bound to kick in eventually S&P 500 index: capitalization-weighted vs. equal-weighted (rolling 12-month return) Sources: Bloomberg, Kaiser Partner Privatbank -20% -15% -10% -5% 0 5% 10% 15% 20% 2016 2017 2018 2019 2020 2021 2022 2023 2024 Outperformance cap-weighted Outperformance equal-weighted Monthly Market Monitor - March 2024 | Kaiser Partner Privatbank AG 14
And
Ask the experts
What is stirring our clients (and moving the financial markets)
We are always available to our customers for concerns and questions about their portfolios. As a representative of this, once a quarter we summarize the most frequently asked customer questions and the answers provided by our experts, thus giving you direct insights into our asset management and investment advisory services.
Crude oil: Despite production cuts by OPEC and turmoil in the Middle East, the price of petroleum has only been moving in a rangebound manner in recent months. Has the oil cartel lost its influence over the oil market?
Kaiser Partner Privatbank: The disinflation process over the past year happened surprisingly quickly in the eyes of more than a few economic observers, but it was a big relief in any case for consumers and businesses. However, alongside the wide array of beneficiaries of receding inflation, there also was at least one group of losers: oil producers. That’s because a large part of the pullback in inflation was caused by the falling price of petroleum in a decline that saw the price of Brent crude oil plummet from a high above USD 135 per barrel in March 2022 to a low of around USD 70 in March 2023. That level is too low for the financial conditions in many oil-producing countries including Saudi Arabia, the opinion leader and largest producer in OPEC. Saudi Arabia needs an oil price of around USD 85 per barrel to maintain a balanced public budget. The (typical) reaction by OPEC to the drop in the price of oil didn’t take long to arrive. In April 2023, the cartel in coordination with Russia (OPEC+) announced an initial curtailment in its oil production volume by 1.7 million barrels per day. However, the cutback’s boosting effect on the price of oil fizzled out within a span of four weeks. In June and then again most recently in November, the oil cartel further upped the ante with additional cuts totaling 2.2 million barrels per day. Saudi Arabia is shouldering the brunt of the production cuts to the tune of 1.5 million barrels per day – at a current output of 9 million barrels daily, the Saudis are utilizing only 75% of their oil production capacity at present.
Looking at the evolution of the price of crude oil over the last ten months alone, it appears that the strategy of cutting output hasn’t generated the desired effect. At a price of a good USD 80 per barrel at last look, Brent crude oil has been trading lately at roughly the same level as it was at the time of the first production cut. What went wrong for OPEC(+)? For one thing, non-OPEC countries like the USA, Canada, Brazil, and Norway have
expanded their production over the course of the past year, by a lot in some instances. The output expansion has been particularly impressive in the United States, which has ascended on the back of the shale oil boom in recent years to become the world’s largest oil producer by far and further increased its production over the past year by around another 1 million barrels per day. The oil cartel’s efficiency and price-setting power have gradually diminished as a result. Moreover, OPEC itself is its own worst enemy because some members’ compliance in implementing agreed production cuts evidently leaves a lot to be desired. In May of last year, OPEC convened a meeting in Vienna aimed at bringing members back into line with production quotas, but the cartel’s success was fleeting once again. The pressure caused by the cuts was too much for some members to bear. This prompted Angola to exit OPEC at the end of last year. Meanwhile, other countries likely haven’t been taking their quotas all that seriously.
Saudi Arabia is thus bearing the biggest burden within the oil cartel. The question is whether and when the most important OPEC country will lose its patience and start to use its spare capacity to massively expand its output and maximize its oil revenue. If that were to happen, a price war with manifold consequences
The (typical) reaction by OPEC to the drop in the price of oil didn’t take long to arrive.
fizzled
Brent crude oil price, in US dollars Sources: Bloomberg, Kaiser Partner Privatbank 70 80 90 100 110 120 130 OPEC(+) production cuts 01/2022 07/2022 01/2023 07/2023 01/2024
An ineffective cartel | Oil production cuts have
to date
Kaiser Partner Privatbank AG | Monthly Market Monitor - March 2024 15
An end to OPEC(+) in its present form cannot be entirely ruled out in the long term.
would loom. For one thing, the price of oil would plunge, sending a deflationary shock wave around the world. Moreover, OPEC(+) would permanently lose its importance. This would mark a geopolitical win for still oil-thirsty industrialized nations because all at once it could make freer oil trade and/or bilateral production agreements possible with countries like Iraq, Kuwait, Nigeria, etc. Saudi Arabia, the de facto leader of the oil cartel, particularly would obviously rank among the losers. But also Russia would be ill-prepared to face a more competitive oil market. In the end, though, a complete dissolution of the OPEC cartel would have detrimental effects on all member countries because the pursuit of revenue optimization by each producer would necessitate increased output (which would cause prices to fall). An end to OPEC(+) in its present form cannot be entirely ruled out in the long term, but a
price war initiated by Saudi Arabia that might trigger a breakup of the oil cartel is very unlikely in the near to medium term. That’s because not even that oil titan can afford a price war at the moment since Saudi Arabia’s Vision 2030 plan requires an estimated investment volume of USD 3.3 trillion (equal to 300% of the kingdom’s gross domestic product). Moreover, a price war would probably be to no avail anyway because unlike in 2014, when Saudi Arabia threw open the spigots on its oil wells with success at that time, US shale oil producers these days are on a sounder financial footing and are much less price-sensitive than before. They would no longer be so easy to squeeze out of the market. So, there’s a lot suggesting that Saudi Arabia’s current strategy of pursuing price maximization rather than volume maximization is the better of the two not entirely ideal options.
Learn more on our blog:
You want to be always up to date? Follow us on LinkedIn.

Monthly Market Monitor - March 2024 | Kaiser Partner Privatbank AG 16
Asset classes
The Back Page
Performance as of February 29th 2024 Asset class YTD 1 Month 1 Year 3 Years* Index Cash US Dollar 0.9% 0.4% 5.6% 2.9% USD Interest Rate Return Euro 0.7% 0.3% 3.9% 1.4% EUR Interest Rate Return Swiss Franc 0.3% 0.1% 1.6% 0.4% CHF Interest Rate Return Fixed Income Government Bonds USA -2.2% -2.1% 1.4% -4.7% Bloomberg US Govt 7-10 Yr Bond Index (USD) USA inflation-protected -0.9% -1.1% 2.5% -0.9% Bloomberg US Treasury Inflation-Linked Bond Index (USD) Germany -2.6% -2.0% 4.5% -5.6% Bloomberg Germany Govt 7-10 Yr Bond Index (EUR) United Kingdom -3.5% -1.8% 1.8% -5.5% Bloomberg UK Govt 7-10 Yr Bond Index (GBP) Switzerland -0.7% 0.0% 5.9% -2.0% Bloomberg Switzerland Govt 7-10 Yr Bond Index (CHF) Corporate Bonds US Investment Grade -0.5% -0.8% 6.1% -0.7% Bloomberg US Corporate 3-5 Yr Index (USD) EU Investment Grade -0.7% -0.9% 6.2% -1.6% Bloomberg European Corporate 3-5 Yr Index (EUR) US High Yield 0.3% 0.3% 11.0% 1.8% Bloomberg US Corporate High Yield Index (USD) EU High Yield 1.4% 0.4% 10.7% 1.5% Bloomberg Pan-European High Yield Index (EUR) Others Emerging-market bonds -0.3% 1.0% 9.7% -2.6% JPMorgan EMBI Global Core Index (USD) Insurance-linked bonds 3.4% 1.6% 19.7% 8.3% Swiss Re Global Cat Bond Total Return Index (USD) Convertible bonds -0.3% 1.2% 7.4% -3.5% Bloomberg Global Convertibles Index (USD) Equities Global 5.6% 4.3% 25.6% 9.2% MSCI World Gross Total Return Index (USD) USA 7.1% 5.3% 30.5% 11.9% S&P 500 Total Return Index (USD) Europe 3.5% 2.0% 10.9% 10.2% STOXX Europe 600 (Gross Return) (EUR) United Kingdom -0.8% 0.5% 0.8% 9.6% FTSE 100 Total Return Index (GBP) Switzerland 2.0% 0.6% 3.9% 4.2% Swiss Performance Index (CHF) Japan 13.1% 4.9% 37.6% 15.6% Topix Total Return Index (JPY) China -3.1% 8.4% -14.0% -20.8% MSCI China Gross Total Return Index (USD) Emerging-markets ex. China 1.0% 3.6% 20.3% 2.2% MSCI Emerging Markets ex China Gross Return Index (USD) Alternatives Commodities -2.0% -1.9% -8.9% 4.3% Bloomberg Commodity Index (USD) Gold -0.9% 0.2% 11.9% 5.6% Gold Spot (US Dollar/Ounce) Real estate USA -3.3% 1.8% 0.0% 0.1% S&P US All Equity REIT Index (USD) Real estate Switzerland 2.8% 0.3% 6.4% 0.1% SXI Real Estate Funds Total Return Index (CHF) Hedge Funds 0.2% 0.0% 5.4% 2.0% Bloomberg All Hedge Fund Index (USD) Private Equity 3.0% 3.3% 22.9% 0.1% Global Listed Private Equity Index (USD) Currencies EUR/USD -2.1% -0.1% 2.2% -3.6% EURUSD Spot Exchange Rate EUR/CHF 2.9% 2.6% -4.1% -4.5% EURCHF Spot Exchange Rate GBP/USD -0.8% -0.5% 5.0% -3.2% GBPUSD Spot Exchange Rate *annualised Kaiser Partner Privatbank AG | Monthly Market Monitor - March 2024 17
This document constitutes neither a financial analysis nor an advertisement. It is intended solely for informational purposes. None of the information contained herein constitutes a solicitation or recommendation by Kaiser Partner Privatbank AG to purchase or sell a financial instrument or to take any other actions regarding any financial instruments. Furthermore, the information contained herein does not constitute investment advice. Any references in this document to past performance are no guarantee of a positive future performance. Kaiser Partner Privatbank AG assumes no liability for the completeness, correctness or currentness of the information contained herein or for any losses or damages arising from any actions taken on the basis of the information in this document. All contents of this document are protected by intellectual property law, particularly by copyright law. The reprinting or reproduction of all or any parts of this document in any way or form for public or commercial purposes is expressly prohibited unless prior written consent has been explicitly granted by Kaiser Partner Privatbank AG.
Publisher: Kaiser Partner Privatbank AG
Herrengasse 23, Postfach 725
FL-9490 Vaduz, Liechtenstein
HR-Nr. FL-0001.018.213-7
T: +423 237 80 00, F: +423 237 80 01
E: bank@kaiserpartner.com
Editorial Team: Oliver Hackel, Senior Investment Strategist
Roman Pfranger, Head Private Banking & Investment Solutions
Design & Print: 21iLAB AG, Vaduz, Liechtenstein
Monthly Market Monitor - March 2024 | Kaiser Partner Privatbank AG 18
kaiserpartner.bank
