Impact Snapshot
Overview

April 12, 2023
Total Money Moved $210,559,850.11 Secondary $ Granted $119,866,33641 Total Organizations Funded 1,915 Total Funds 143 Total Unique Funder Accounts 772 Total Proposals Submitted 9,801 Total Proposals Funded 2,869 Percent of Proposals Funded 29.27% Hours Saved with Common Proposal 245,025 Years Saved with Common Proposal 28 35 Total Grant Cycles Run 298 Average Grant Size $49,485 28 Total Money Moved: �210,559,850.11 2023 $15,029,853.25 2022 $77,741,692.26 2021 $38,386,752.60 2020 $65,510,098 00 2019 $8,686,269.00 2018 $2,693,935.00 2017 $196,000.000 1
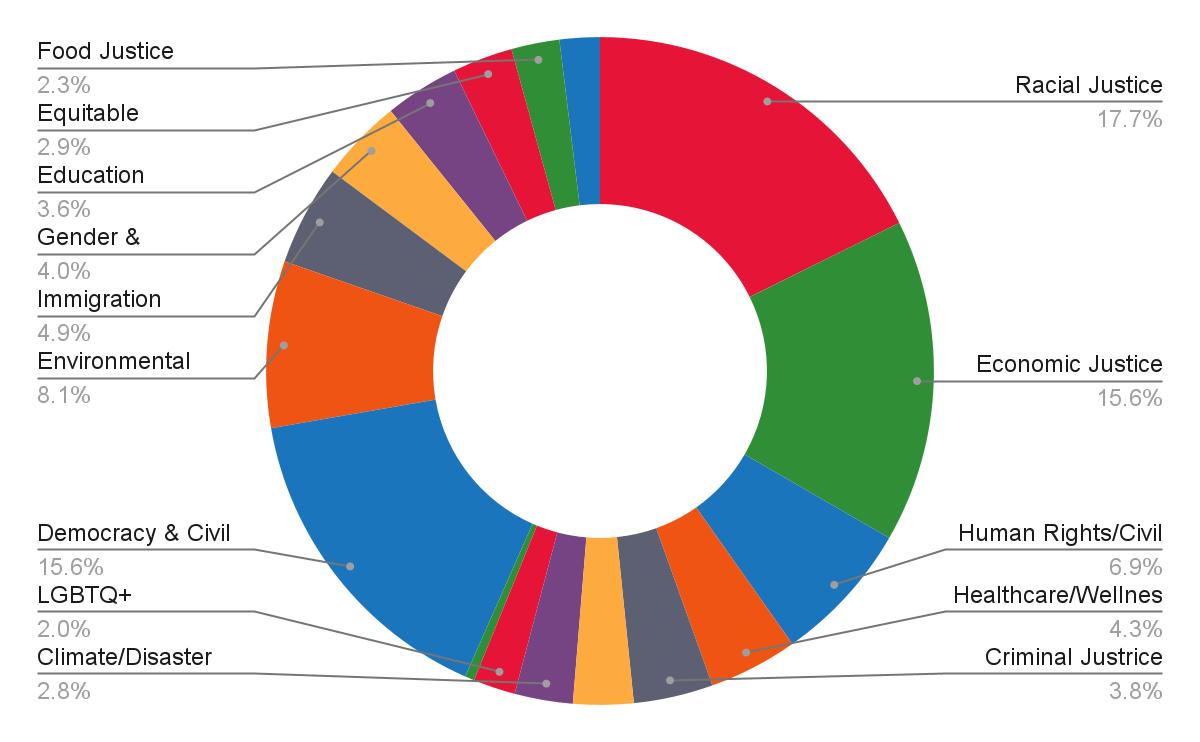
Funding Allocated to Communities
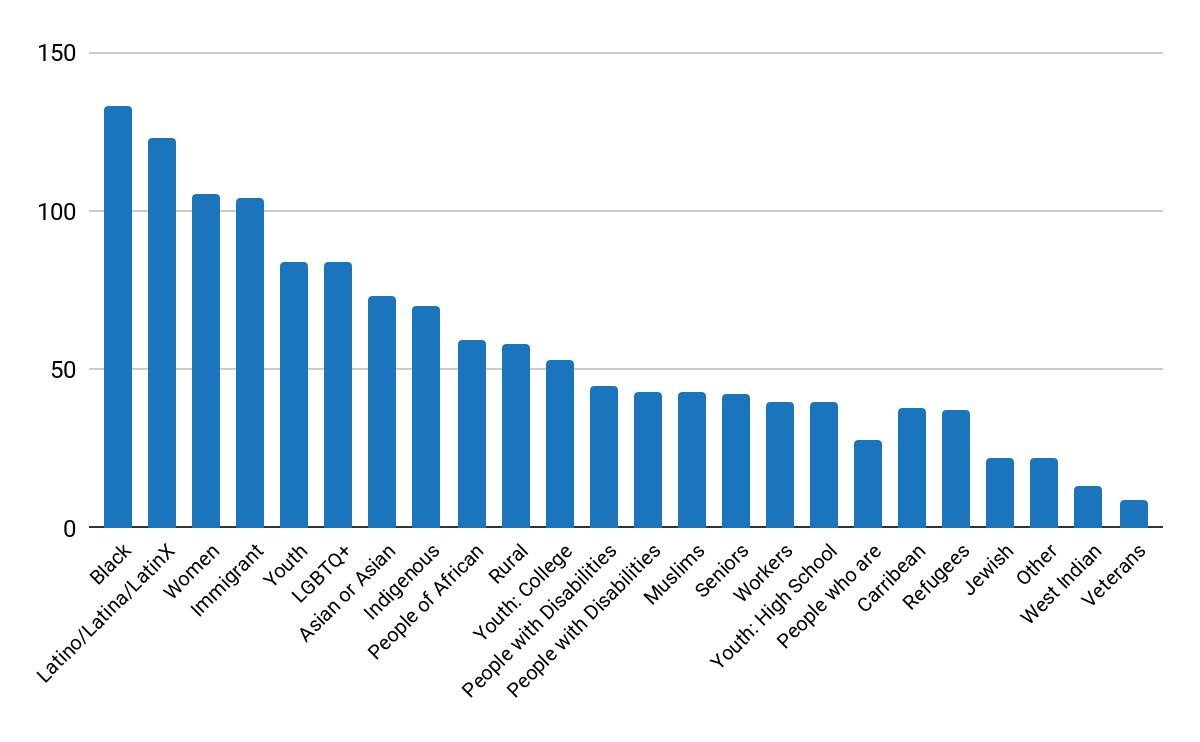
Top 10 Black $133M LGBTQ+ $84M Latino $123M Asian or Asian American/AAPI $73M Women $105M Indigenous $70M Immigrant $105M People of African Decent $60M Youth $85M Rural $58M Focus Areas (Grantees) Top 5 Economic Justice 12 9% Racial Justice 18.2% Environmental Justice 8.3% Democracy and Civil Engagement 16.1% Human Rights/Civil Rights 7% 2
Grantee Regions
South 32% West 23% Midwest 19% Northeast 17% US Territory 8% 3
Applicant vs Grantee Organization Budget Size
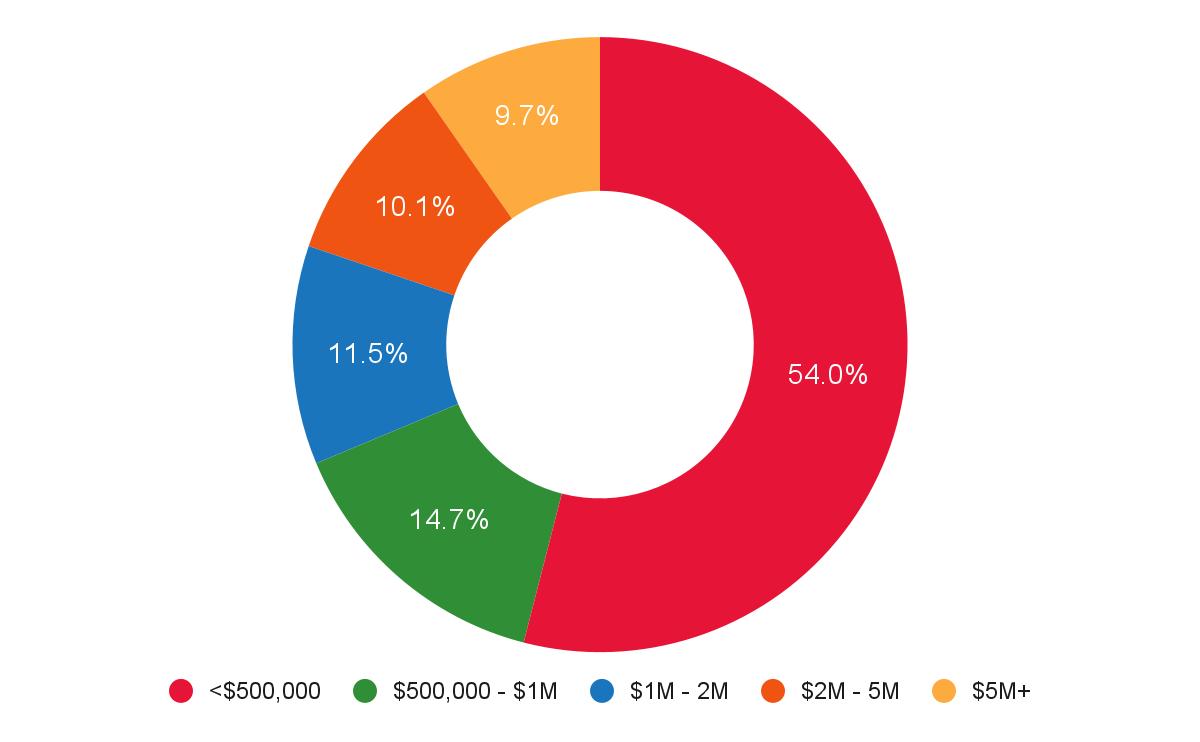
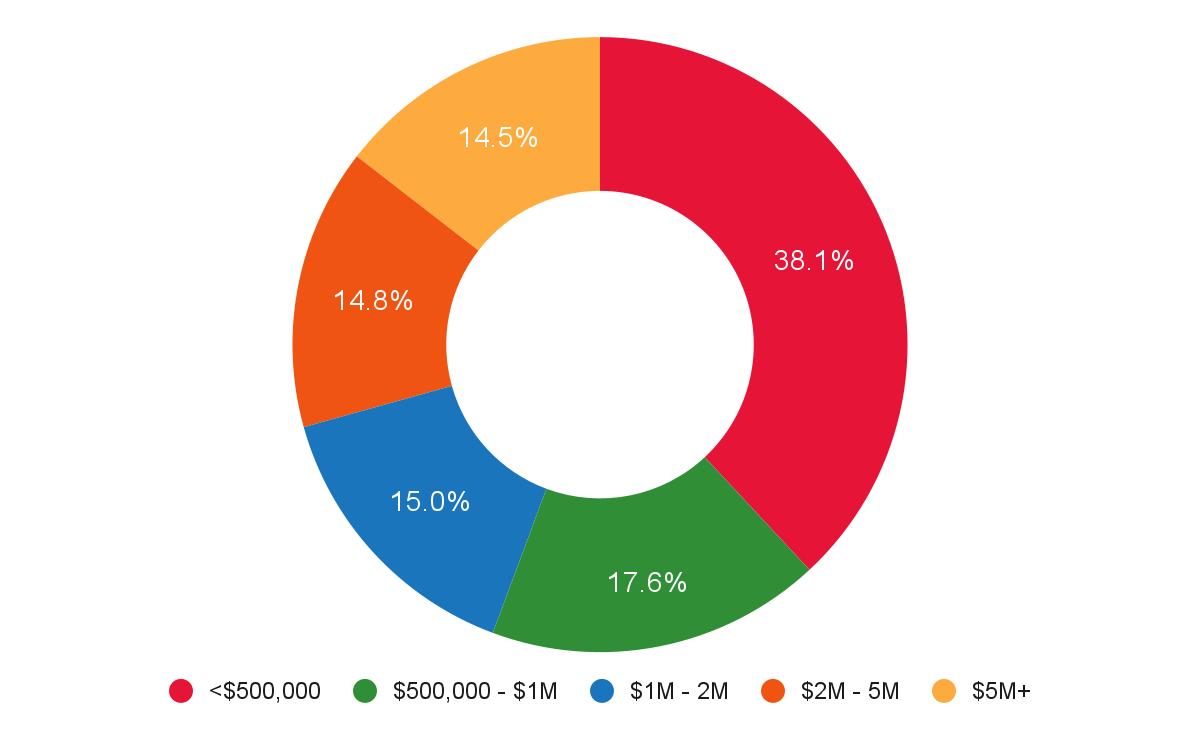
Org. Budget Size Applicant Grantee Difference <$500,000 54% 38% -16% $500,000 - $1M 15% 18% +3 $1M - $2M 11% 15% +4% $2M - $5 10% 15% +5% $5M+ 10% 14% +4%
4
Grantee Organization Budget Size Applicant Organization Budget Size
