
Impact Snapshot
Overview
As of October 3, 2023
Total Money Moved $244,919,428.90 Secondary $ Granted $139,780,806 38 Total Organizations Funded 2,126 Total Funds 144 Total Unique Funder Accounts 833 Total Proposals Submitted 11,279 Total Proposals Funded 3,265 Percent of Proposals Funded 28.95% Hours Saved with Common Proposal 281,975 Years Saved with Common Proposal 326 Total Grant Cycles Run 363 Average Grant Size $50,59273 Total Money Moved: �196,307,762,11 2023 $49,389,432.04 2022 $80,056,942.26 2021 $38,386,752.60 2020 $65,510,098 00 2019 $8,686,269.00 2018 $2,693,935.00 2017 $196,000.000 1
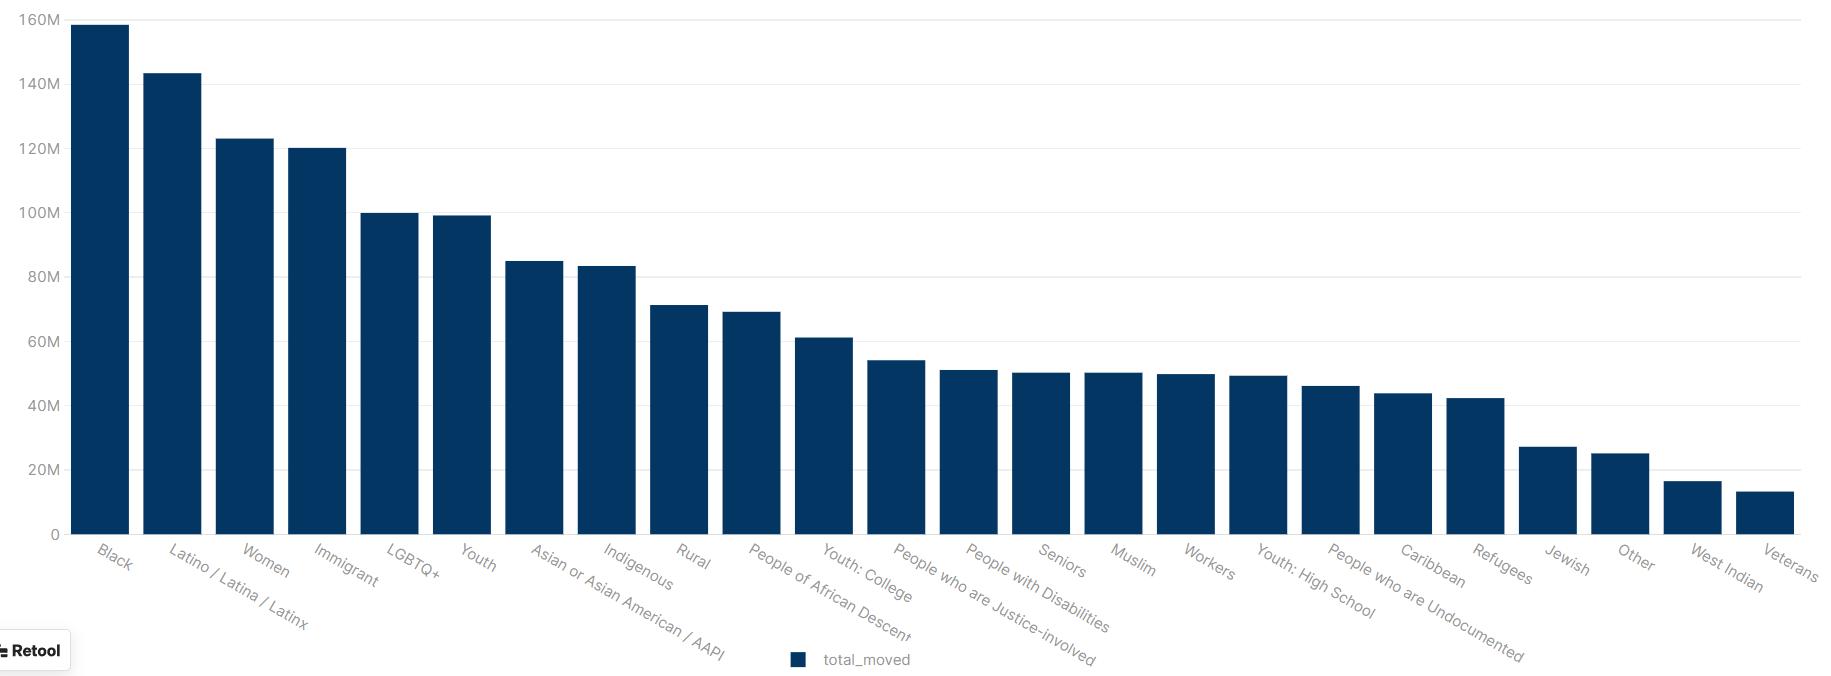
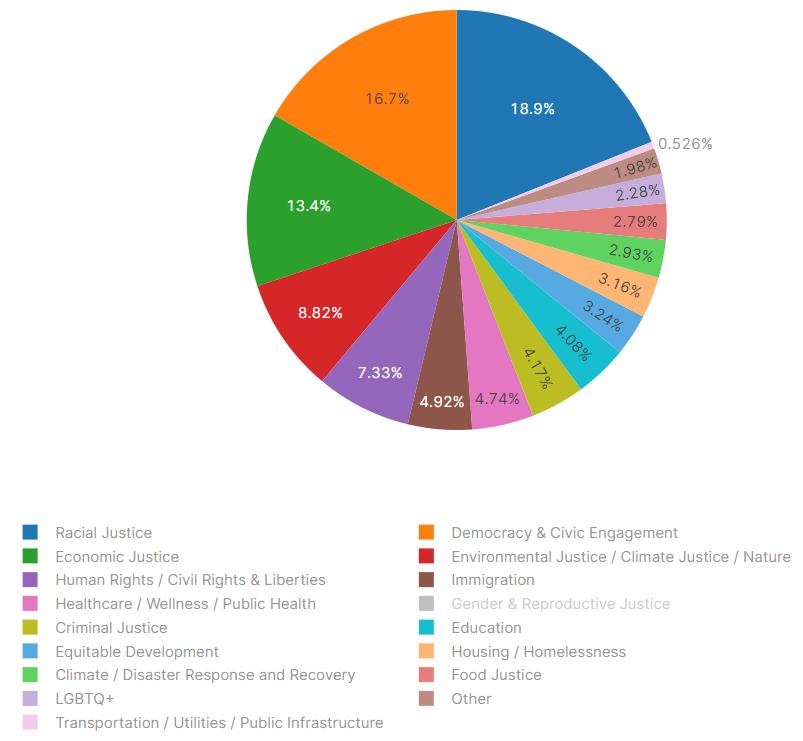
Top 10 Black $158M Youth $99M Latino $143M Asian or Asian American/AAPI $85M Immigrant $120M Indigenous $83M Women $123M People of African Decent $69M LGBTQ+ $100M Rural $71M Focus Areas (Grantees) Top 5 Economic Justice 12.9% Racial Justice 18.2% Environmental Justice 8.5% Democracy and Civil Engagement 16% Human Rights/Civil Rights 7% 2
Funding Allocated to Communities

Grantee Regions South 32% West 23% Midwest 19% Northeast 18% US Territory 8% 3
Applicant vs Grantee Organization Budget Size

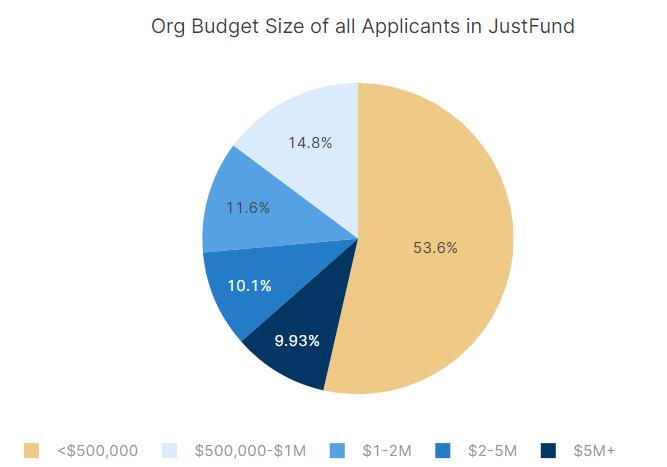
Org. Budget Size Applicant Grantee Difference <$500,000 53% 41% -12% $500,000 - $1M 15% 15% 0 $1M - $2M 12% 17% +5% $2M - $5 10% 14% +4% $5M+ 10% 14% +4%
4
Grantee Organization Budget Size Applicant Organization Budget Size