DISTRIBUTION
complex projects Food Distribution in the NL
II
FOOD DISTRIBUTION: The Netherlands
a publication by:
Lisa Blok Jonathan Kaye Chi-Hua Liu Max Mika Harit Naik David Sauer Bo Vissers
02
03
Circularity -Present -Future -Problem -Action 3.0 84 86 104 110 Dutch Distribution
System
System 2.0 50 56 74
Developments -13th Century
Century
Century to Present 1.0 16 20 24 34 Introduction -Global
04 05 06 08 10 0.0 References 128 116 PART I PART II
To
-International
-National
Historic
-17th
-19th
-National -Port of Rotterdam -Food Systems
50 1.0 3.0 The Netherlands as a Global Hub Value-Added Distributor
DUTCH DISTRIBUTION
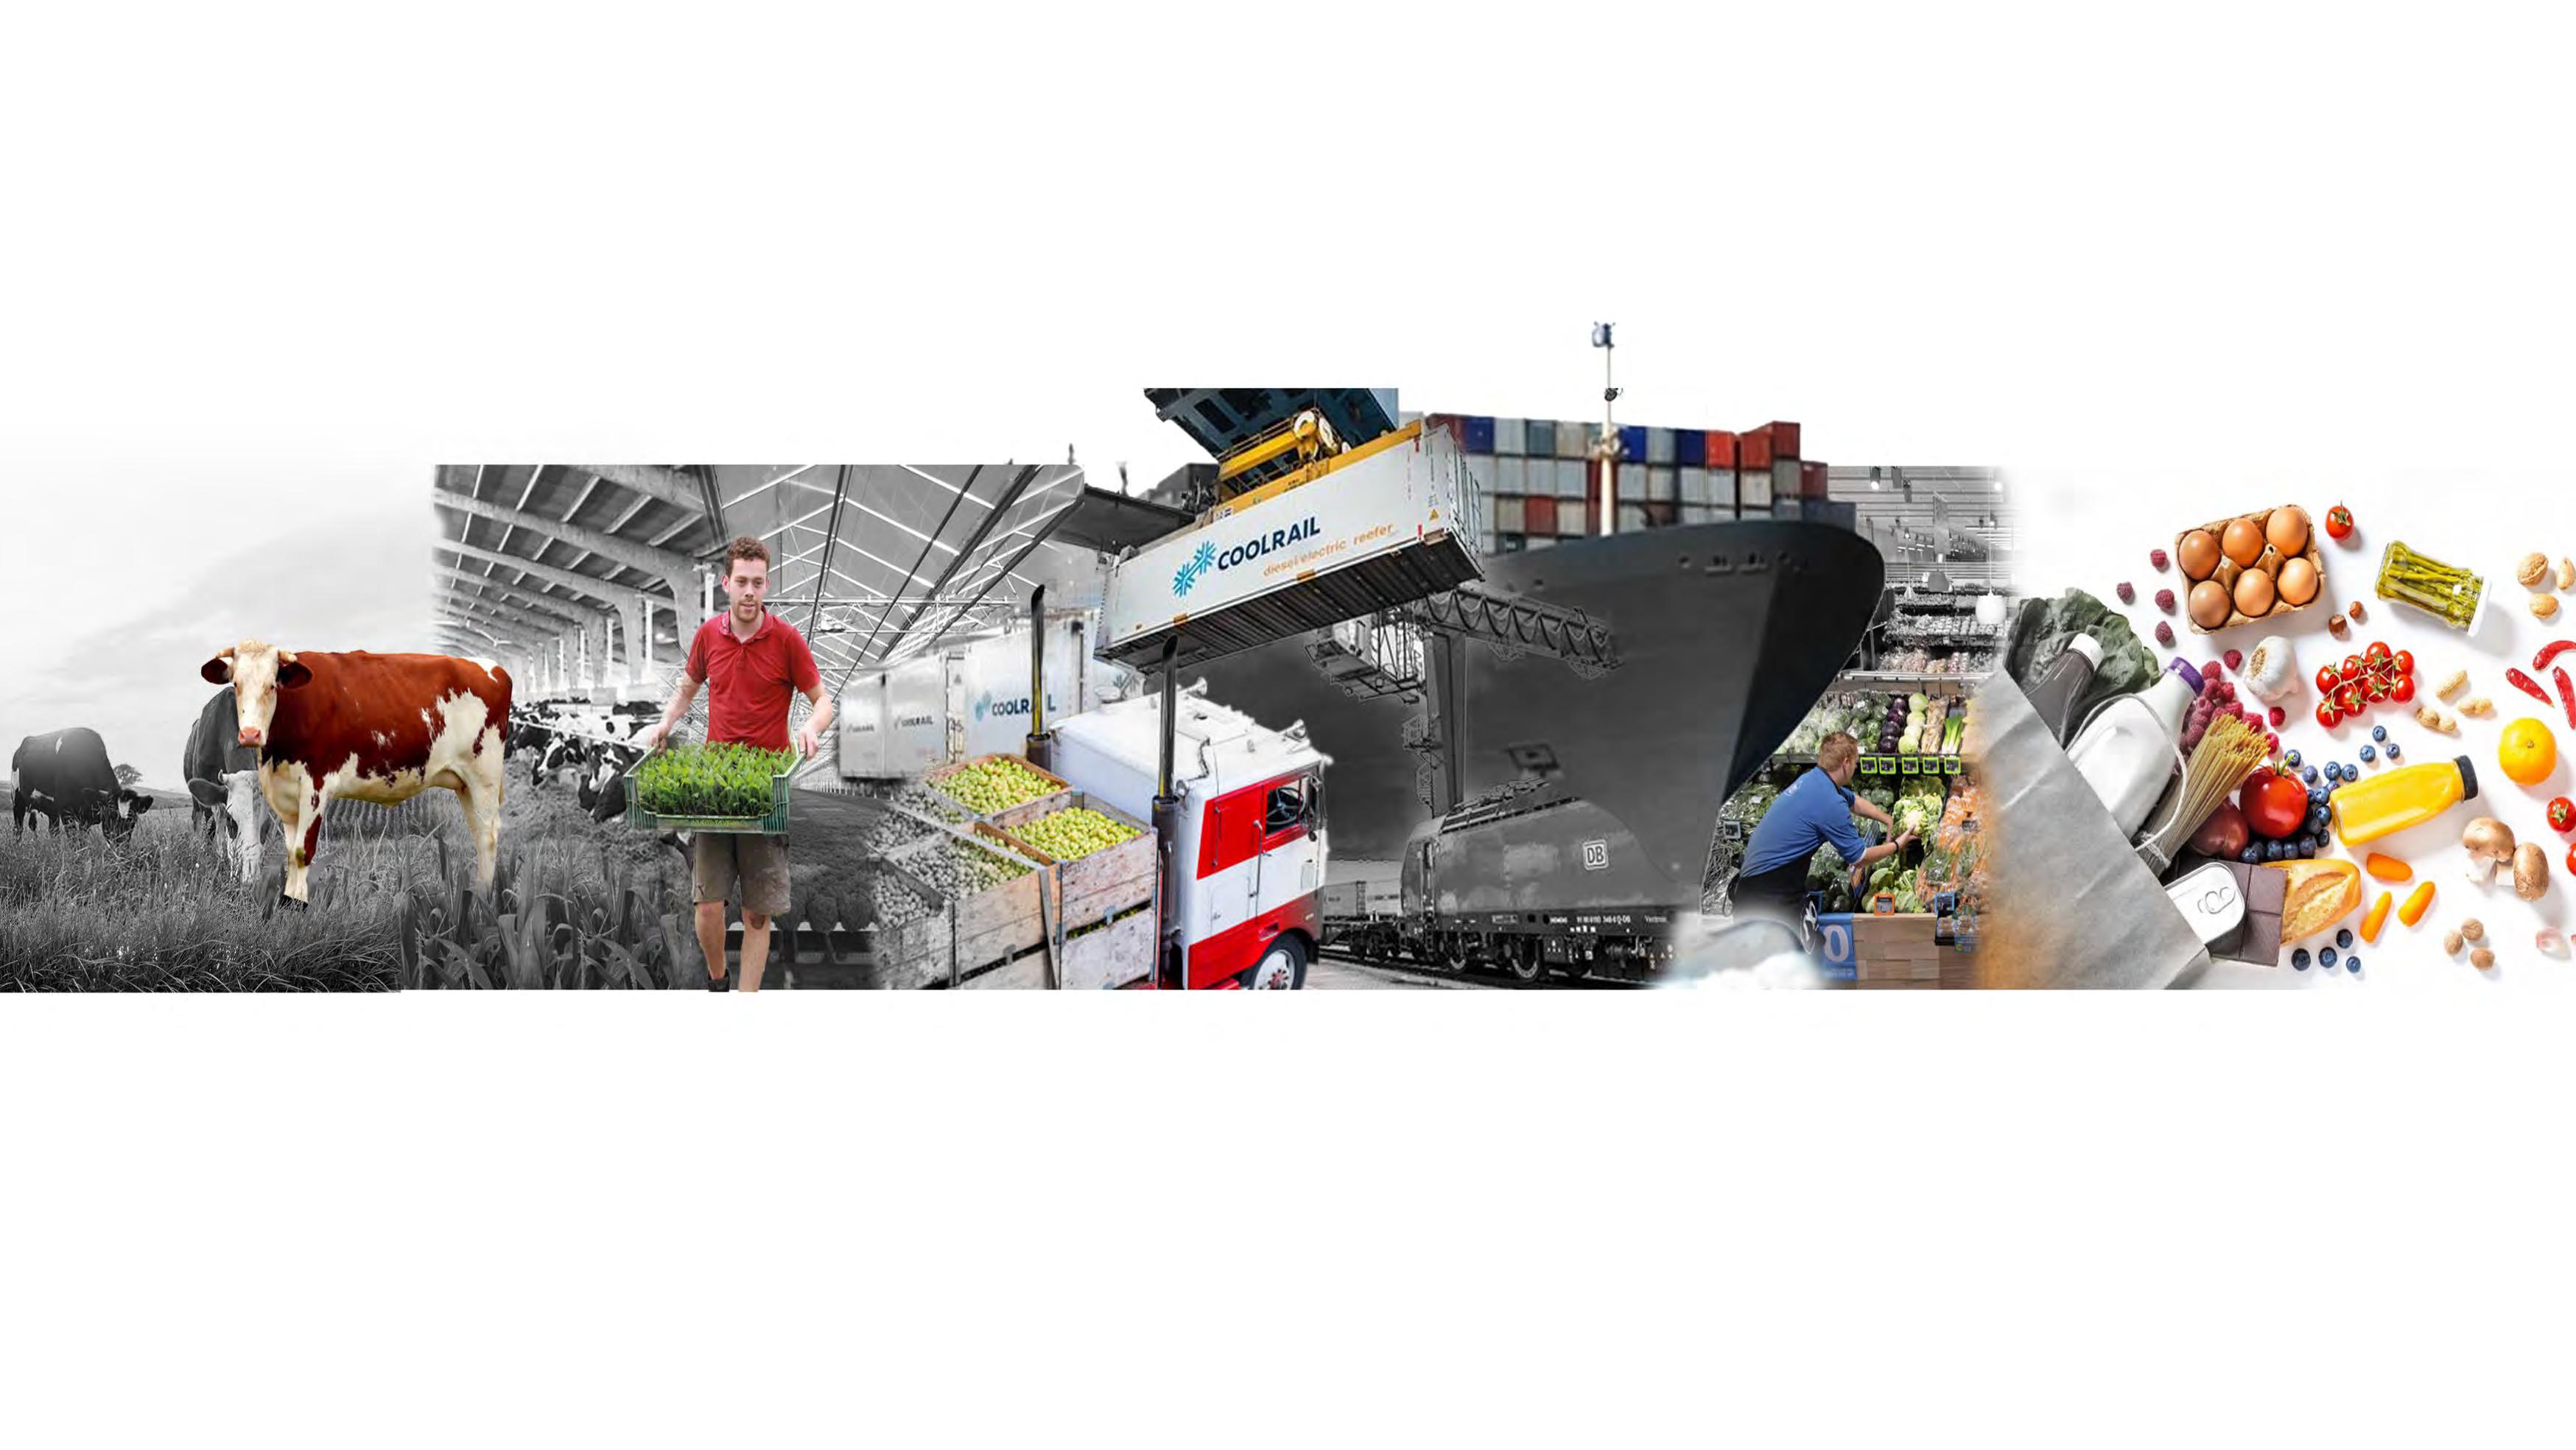
Right - Fig. 39 Food System timeline highlighting contemporary processes characteristic of System 2.0.
“The success of our port [of Rotterdam] is measured not only by throughput tonnes but alsobytheimpactwehave on employment, income and prosperity, in the Netherlands and beyond.
[This] not only shows that the port of Rotterdam adds value in terms of employment and income fortheNetherlands,italso highlights how we as a portaddvaluetobringing Dutch exports to the global market efficiently and prominently.
In that way, we boost the economic significance of the Netherlands and the competitiveness of the Dutch economy.’
Allard Castelein, 2022 CEO - Port of Rotterdam Authority
51
MODERN ROLE OF FOOD SYSTEM 2.0
More than a century after the onset of industrialisation, the Netherlands have established themselves not only as a top global producer, but also as a distributor. Within the top 10 countries by GDP, the Netherlands instills much of its modern identity in its innovative culture of technology, knowledge export, and heritage research.
Its universities, scientists, and methods are among the best in the world in producing and optimizing wealth acquisition across sectors.
In agriculture specifically, the digital
revolution has offered tools for optimising crop yield. As production moved from the field into the greenhouse, required fertilizers and water volume were reduced while total production increased. Leveraging these and other innovations, the Netherlands has positioned itself as the world’s second-highest exporter by value of agricultural goods (EUR).
Despite its fractional size compared to the USA (the number one global exporter), the Netherlands utilises two primary methods to add value: the trade and manufacture of goods.
52
DUTCH DISTRIBUTION
€157b
Left - Fig. 40
Infographic comparing yearly agricultural exports by value (EUR).
Source: Adapted from Facts and Figures in the Port of Rotterdam (2021).
€101b
53
KEY AGRICULTURAL EXPORTER
We trade goods.
* *the Netherlands 54 DUTCH DISTRIBUTION
We make goods.
Above - Fig. 41
Infographic comparing domestic production with total yearly exports (EUR).
Source: Adapted from De Nederlandse Agrarische Sector Internationaal 2021 (z.d.)
55
€
TWO WAYS TO MAKE MONEY
56 DUTCH DISTRIBUTION
International Food Distribution System
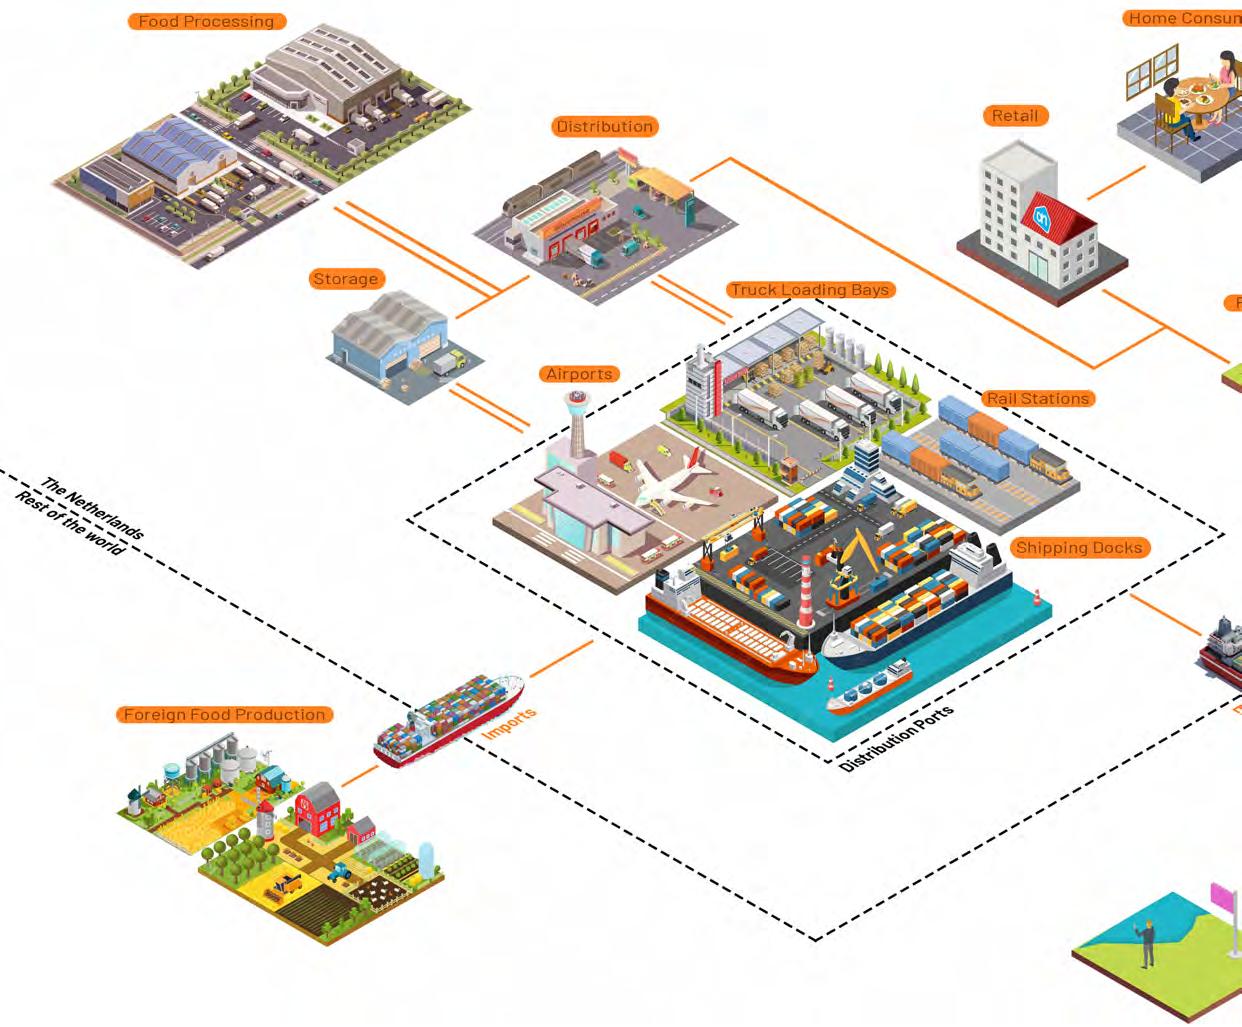
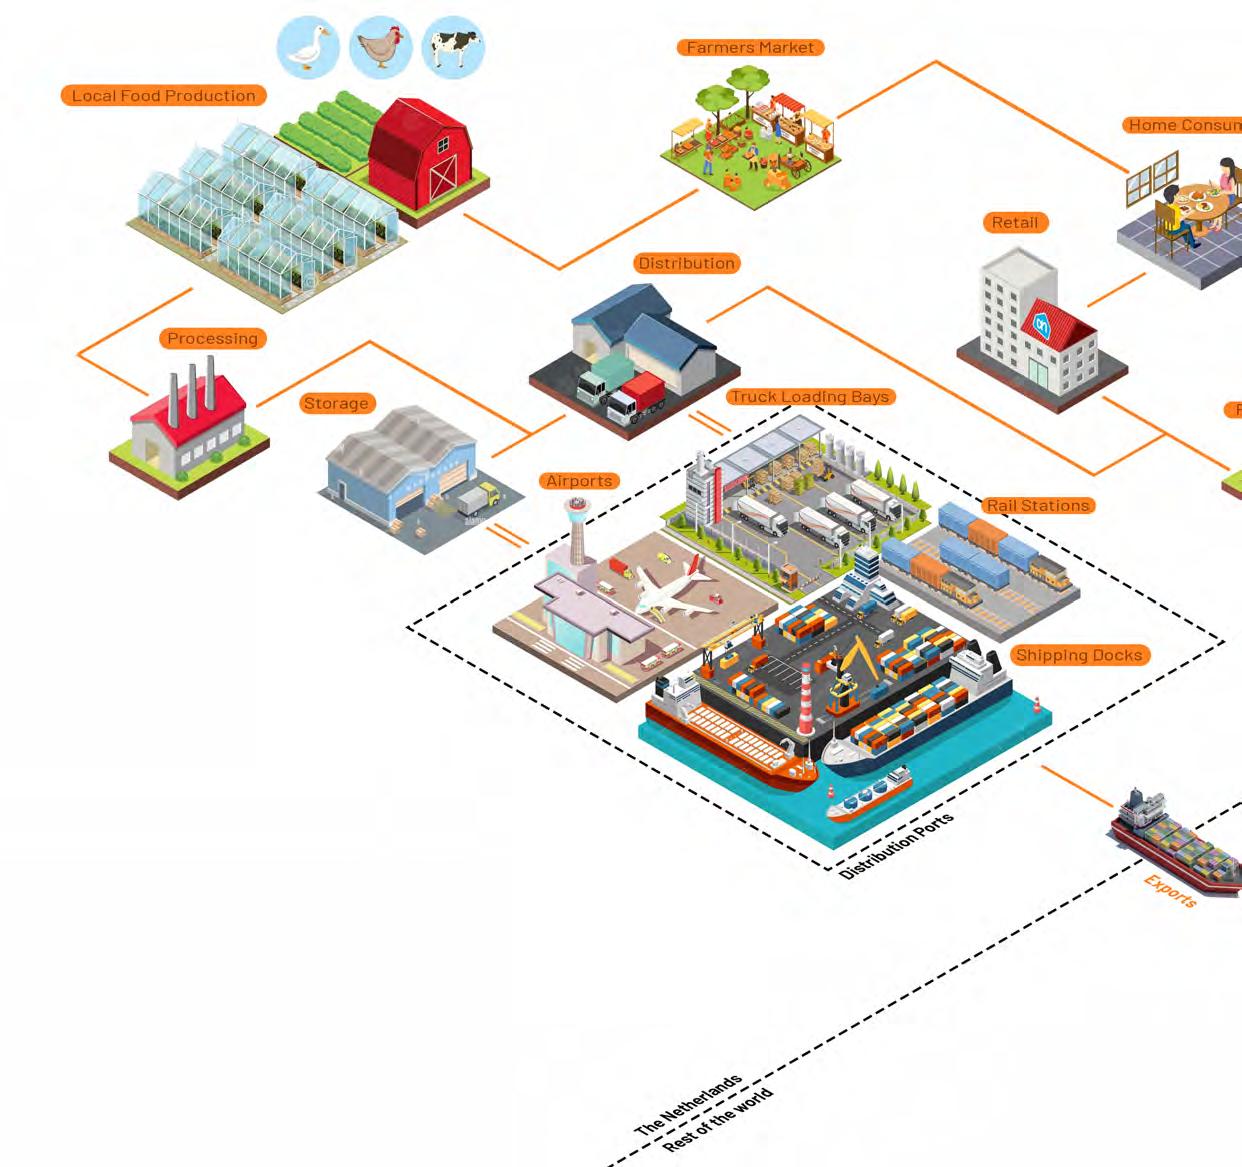
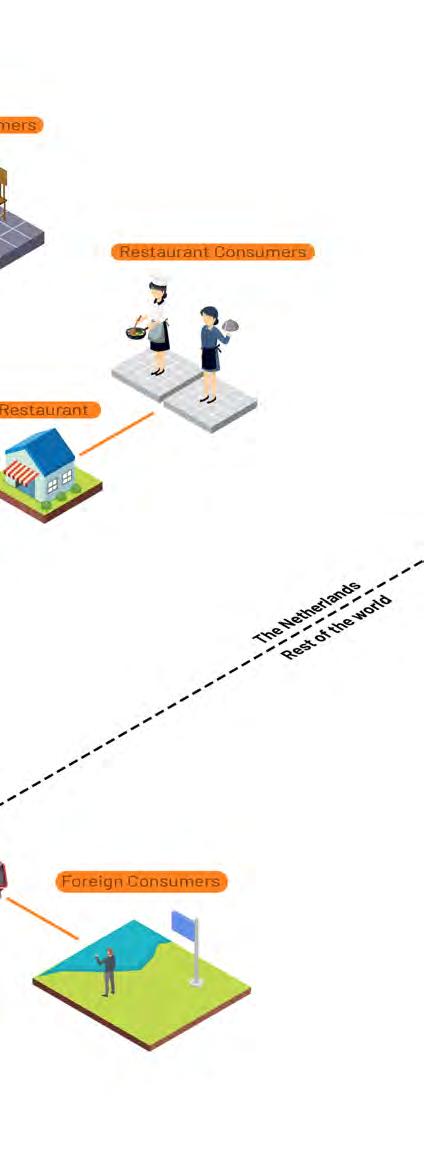
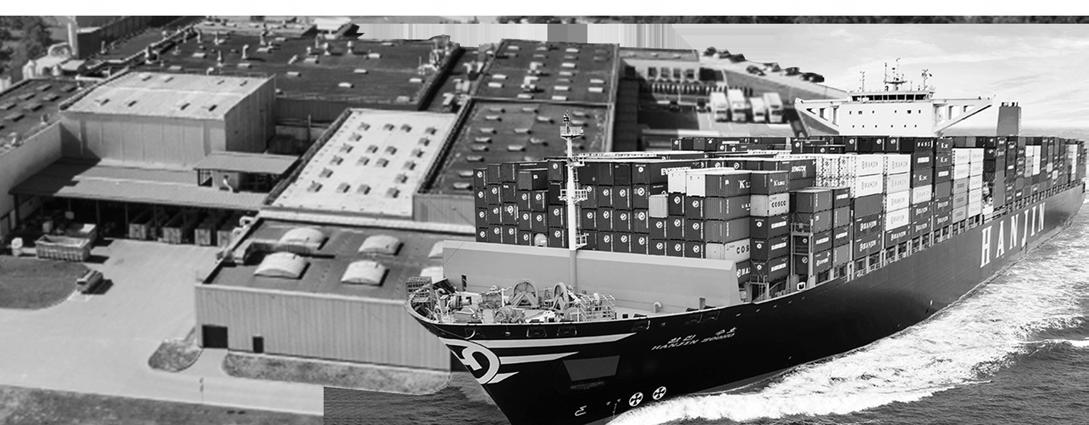
The food distribution system through the Netherlands is highly developed.
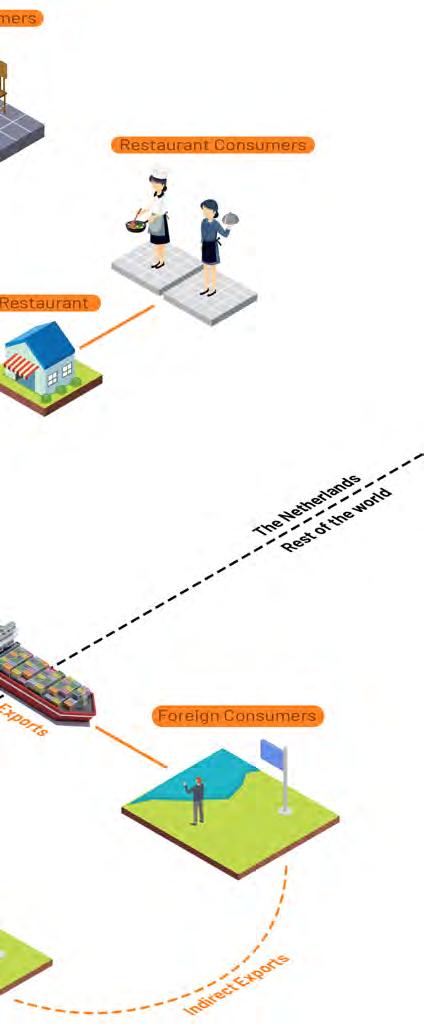
Beginning with its heritage as an expert in global navigation and trade, the Netherlands today is knowledgable about goods both foreign and domestic.
Financial systems and industrialisation make it possible for goods to be distributed by the Dutch in three ways:
1. Goods can be produced and purchased from another country, then traded without entering the Netherlands.
2. Goods can be produced and purchased from another country before entering the Netherlands for final distribution.
3. Goods can be produced and purchased from another country before entering the Netherlands for further value-added processing before final distribution.
Final distribution can be to Dutch customers, to European customers, or to consumers across the globe.
57
Upper Left - Fig. 42
INTL. FOOD DISTRIBUTION SYSTEM
Infographic diagramming the organisation of the international food system and the primary actors who engage in it.
Above - Fig. 43
Percent of import tonnage which is agribulk.
Source: Adapted from De Bosatlas van Nederland (1ste editie). Noordhoff. (2007, 1 oktober).
Above - Fig. 44
Percent of agribulk tonnage imports by region. 40% are sourced from the European continent.
Source: Adapted from De Bosatlas van Nederland (1ste editie). Noordhoff. (2007, 1 oktober).
Lower Right - Fig. 45
Annual Imports to Rotterdam by Country-of-Origin (2006).
Source: Adapted from De Bosatlas van Nederland (1ste editie). Noordhoff. (2007, 1 oktober). United Kingdom 30,428
Norway 17,470
Port of Rotterdam - Imports
In 2006, the Port of Rotterdam imported 467.1 million tonnes of goods. These goods were from a variety of regions and sectors.
Agribulk comprised 3% of total import tonnage. 40% of this tonnage was from the European continent, while 60% came from Africa, South America, and Oceania. The majority of this tonnage comprised raw materials (e.g. animal feed, cocoa) in need of value-added processing before export.
SOUTH
SE SW NE AFRICA
AMERICA
Brazil 35,984
58 DUTCH DISTRIBUTION
United States 14,991 Canada 8,996
Russia 40,616 Egypt 13,536 China 12,884 South Africa 15,744 Australia 9,207 Country Gross Weight x 1000 metric tons 59 PORT IMPORT TONNAGE
Above - Fig. 46
Fig. 42: Percent of imports which are re-exported.
Source: Adapted from De Bosatlas van Nederland (1ste editie). Noordhoff. (2007, 1 oktober).
Above - Fig. 47
Fig. 43: Percent of agribulk tonnage exports by region. 77% are distributed on the European continent.
Source: Adapted from De Bosatlas van Nederland (1ste editie). Noordhoff. (2007, 1 oktober).
Lower Right - Fig. 48
Fig. 44: Annual Exports from Rotterdam by Shipping Country (2006).
Source: Adapted from De Bosatlas van Nederland (1ste editie). Noordhoff. (2007, 1 oktober).
United States 9,105
Port of Rotterdam - Exports
Of the goods which are imported, onethird are re-exported in their original form to other trade partners via the Port of Rotterdam. The remainder are processed, used as raw material for other value-added goods (e.g. beef), consumed by the Dutch population, or exported via a different modality.
Of exports sent via the Port of Rotterdam, 77% travel to other European countries via waterway, cargo ship, or another direct method.
Kingdom
France 3,350
Germany
United
21,512 Ireland 3,582
Spain 4,105
3,979
60 DUTCH DISTRIBUTION
Singapore 8,187 China 8,844 Finland 2,423 Russia 3,038 Germany 3,979 Country Gross Weight x 1000 metric tons 61 PORT EXPORT TONNAGE
Seaports
Above - Fig. 49 Freight waterway system in The Netherlands. Source: Adapted from Freight traffic on inland waterways CCNR (2019, 6 November).
There are four primary seaports in the Netherlands. These include the Ports of Amsterdam, Zeeland, and Groningen, as well as the Port of Rotterdam — the largest port in the whole of Europe.
From Rotterdam, goods can be imported or exported overseas or inland to other European countries.
The inland waterway system in the Netherlands is extensive and consists of a large number of canals, rivers, and lakes. Various forms of infrastructure have been constructed to improve navigability and efficiency, including locks, terminals, and dams (Ministerie van Infrastructuur en Waterstaat, 2020).
The most important inland waterways are directly connected to Germany, particularly the Rhine route (from Basel to the Dutch border) via which 165 million tonnes were transported in 2018 (of which 15% were agricultural and food products). Additionally, the amount of transport was abnormally low compared to trends due to a low water level that year (CCNR, 2019).
Legend: Seaports Waterways
While 77% of goods handled at Dutch ports are transported to other European countries, they are also an economic method of shipping goods globally to Africa, Asia, and the Americas.
Sea and waterway-based shipping is the most eco-friendly method for global goods transport (Shipping to and from the Netherlands, 2022). An average freight ship costs 0,012 euro per tonkm, due to the overall efficiency of the massive capacity of global cargo ships to transport 100.000 tonnes each (Fuel Consumption by Containership Size and Speed | The Geography of Transport Systems, 2022). Evaluated by its carbon emissions per kilometer, shipping is the lowest of all transportation methods at 5 CO2/ton-km (Ministerie van Infrastructuur en Waterstaat, 2020).
Port of Amsterdam
Port of Rotterdam
Zeeland Seaports
62 DUTCH DISTRIBUTION
Groningen Seaports
Above - Fig. 50
Freight aterway system in continental Europe.
Source: Adapted from Freight traffic on inland waterways. CCNR (2019, 6 november)
Above - Fig. 51
Average costs per tonkm by Mode of transport (EUR).
Above - Fig. 52
Average emission by Mode of transport (CO2/ton-km).
Above - Fig. 53
Average freight load capacity.
Source: Adapted from Fuel Consumption by Containership Size and Speed | The Geography of Transport Systems, 2022.
0,0120,0170,180,366 5 35 80435
Source: Adapted from Ministerie van Infrastructuur en Waterstaat. Publicatie | Kennisinstituut voor Mobiliteitsbeleid. (2020, 26 mei).
Source: Adapted from Ministerie van Infrastructuur en Waterstaat. Publicatie | Kennisinstituut voor Mobiliteitsbeleid. (2020, 26 mei).
0,0120,0170,180,366 53580435
W R H A W R H A W R H A W R H A W R H A W R H A W R H A W R H A
W R H A W R H A W R H A W R H A W R H A W R H A W R H A W R H A 20 ton 100.000 ton 12.500 ton 100 ton 63 WATER TRANSPORTATION SYSTEMS
Airports
Above - Fig. 54
Freight airport system in The Netherlands. Source: De Bosatlas van Nederland (1ste editie). Noordhoff. (2007, 1 Oktober).
There are two primary airports in the Netherlands. These include Maastricht Aachen Airport, as well as the Amsterdam Schiphol Airport — the primary airport for Dutch freight transport, the fourth biggest cargo airport in Europe, and a global hub for EasyJet and KLM. Both airports are primarily connected to the UK, Russia, Brazil, US and China.
This method of transport is primarily used for high value import and export, or the transportation of live animals. Its use is minimal for agribulk and lowvalue agricultural goods because of its high cost of 0,366 per tonkm. This is the most expensive transport method and produces the highest carbon emission per unit with 435 CO2/ tonkm. Due to this high per/km cost and the low capacity of 100 tonnes per flight, this transport method is inefficient for the transportation of agricultural goods.
Legend: Airports
Amsterdam Schiphol Airport
Maastricht Aachen Airport
Amsterdam Schiphol Airport
64 DUTCH DISTRIBUTION
Maastricht Aachen Airport
Above - Fig. 55
Freight airport system in continental Europe.
Source: Adapted from De Bosatlas van Nederland (1ste editie). Noordhoff. (2007, 1 oktober).
Above - Fig. 56
Average costs per tonkm by Mode of transport (EUR).
Source: Adapted from Ministerie van Infrastructuur en Waterstaat. Publicatie | Kennisinstituut voor Mobiliteitsbeleid. (2020, 26 mei).
Above - Fig. 57
Average emission by Mode of transport (CO2/ton-km).
Source: Adapted from Ministerie van Infrastructuur en Waterstaat. Publicatie | Kennisinstituut voor Mobiliteitsbeleid. (2020, 26 mei).
Above - Fig. 58
Average freight load capacity.
Source: Adapted from Aircraft Guide, z.d. Fliteline. (z.d.).
W R H A W R H A W R H A W R H A W R H A W R H A W R H A W R H A
W R H A W R H A W R H A W R H A W R H A W R H A W R H A W R H A 20 ton 12.500 ton 100 ton 65 AIR TRANSPORTATION SYSTEM
5000 km 10.000 km 1000 km United States China Norway South Africa Egypt Australia Singapore Spain Ireland France Germany Finland Canada Russia United Kingdom Brazil 0,0120,0170,180,366 53580435
0,0120,0170,180,366 53580 435
66 DUTCH DISTRIBUTION
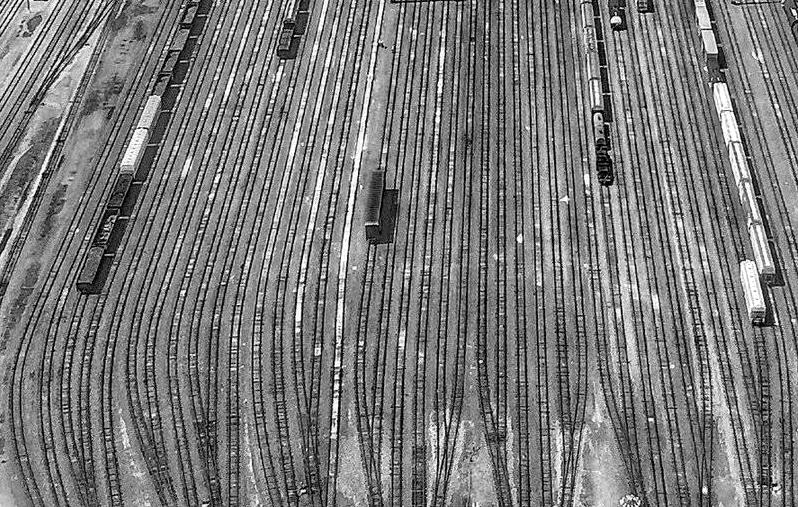
Above - Fig. 59 Kijfhoek rail freight terminal
Source: The largest railway freight station in the Netherlands is to be automated. RailTarget, z.d.
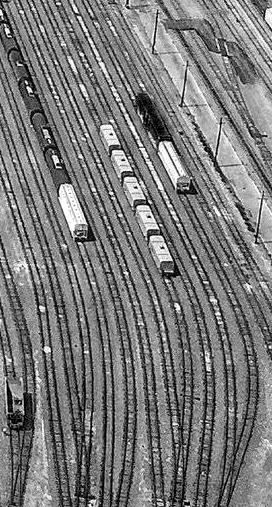
67 RAIL TRANSPORTATION SYSTEM
Above - Fig. 60
Freight railroad system in The Netherlands.
Source: Adapted from Special report: The EU core road network. (z.d.)
Railroads
With a total of nine freight transport routes in Europe, almost all countries are interconnected. Three of these routes pass through the Netherlands: Corridor 1 connects Amsterdam, Rotterdam and Vlissingen with Germany and Italy, Corridor 2 connects Amsterdam and Rotterdam to Belgium and France, and Corridor 8 connects Amsterdam and Rotterdam with Belgium, Germany, and Poland. From Poland, a possible rail connection can be made to China (modern Silk Road). (Rail Freight Corridors need quick wins - ERFAEuropean Rail Freight Association, z.d.)
This sytem features various challenges to its organisation which have consequences for the efficiency of transportation.
Legend:
Railroad Hub
Rail freight corridor 1
Rail freight corridor 2
Rail freight corridor 3
Rail freight corridor 4 Rail freight corridor 5 Rail freight corridor 6 Rail freight corridor 7 Rail freight corridor 8
Currently, seamlessly transiting borders can be difficult due to different power and control systems, a variety of regulations regarding traffic management, and problems arising from miscommunications between languages. The EU is planning to engage policy to optimize the railroad network over the next few years, (Faculty of Applied Sciences, WSB University Poland & Polytechnic School, University of Extremadura Spain, 2019).
Nonetheless, rail transportation is reliable, cost-effective, and faster than sea freight. It is also less polluting than road haulage, but is not ideal for short distances and time-sensitive loads (Shipping to and from the Netherlands, 2022). The costs of rail freight transport are 0,017 euro per ton/km and it emits 35 CO2/tonkm.
Due to the overall high quality of European connection and the high capacity per unit of 12.500 ton, this transportation method is efficient for transporting agricultural goods (Ministerie van Infrastructuur en Waterstaat, 2020).
Amsterdam Rotterdam
Vlissingen 68 DUTCH DISTRIBUTION
Hannover Duisburg Antwerpen Köln
There are four primary railroad freight hubs in the Netherlands. These include the Ports of Amsterdam, Rotterdam and Vlissingen. More than four million tons of freight are transported to and from the Amsterdam port region by rail per year (Shipping to and from the Netherlands, 2022).
Above - Fig. 61
Freight railroad system in continental Europe.
Source: Adapted from Special report: The EU core road network. (z.d.)
Above - Fig. 62
Average costs per tonkm by Mode of transport (EUR).
Source: Adapted from Ministerie van Infrastructuur en Waterstaat. Publicatie | Kennisinstituut voor Mobiliteitsbeleid. (2020, 26 mei)
Above - Fig. 63
Average emission by Mode of transport (CO2/ton-km).
Source: Adapted from Ministerie van Infrastructuur en Waterstaat. Publicatie | Kennisinstituut voor Mobiliteitsbeleid. (2020, 26 mei)
0,0120,0170,180,366 53580435
Above - Fig. 64
Average freight load capacity.
Source: Adapted from Ministerie van Infrastructuur en Waterstaat. Publicatie | Kennisinstituut voor Mobiliteitsbeleid. (2020, 26 mei)
0,0120,0170,180,366 5 35 80435
W R H A W R H A W R H A W R H A W R H A W R H A W R H A W R H A
W R H A W R H A W R H A W H W R H A W R H A W R H A W R H A 20 ton 100.000 ton 12.500 ton 100 ton 69 RAIL TRANSPORTATION SYSTEM
Road Freight / Trucking
Above - Fig. 65
Freight highway system in The Netherlands.
Source: Adapted from Bosatlas van de veiligheid. Lijn43, Noordhoff Atlasproducties, Beukers, E., Donkers, H. & Lijn43 (Utrecht). (2017, 31 oktober).
Road freight transportation, or trucking, is the most utilised mode of transportation for short distances, particularly within the Netherlands. It is also employed for longer distances to other European countries due to its flexibility and relatively nimble size. Although it can be affected by traffic jams and weather conditions, it is an affordable method available twentyfour hours a day. Nationally, the Netherlands has one of the densest road networks in the world, and this network is interconnected to the rest of industrialised Europe (Shipping to and from the Netherlands, 2022).
The costs of this transport method are significantly higher than the costs for shipping or railroad at 0,18 euro/tonkm. Additionally, the carbon emissions are twice that of comparable rail transport, 35 CO2/ tonkm. However, this transport method is faster than the others because of its lower capacity and accessibility, making it more efficient for smaller distances. (Ministerie van Infrastructuur en Waterstaat, 2020).
Legend:
70
Highways
DUTCH DISTRIBUTION
Above - Fig. 66
Freight highway system Europe.
Source: Adapted from Special report: The EU core road network. (z.d.).
Above - Fig. 67
Average costs per tonkm by Mode of transport (EUR).
Above - Fig. 68
Average emission by Mode of transport (CO2/ton-km).
Source: Adapted from Ministerie van Infrastructuur en Waterstaat. Publicatie | Kennisinstituut voor Mobiliteitsbeleid. (2020, 26 mei).
0,0120,017 0,18 0,366 53580435
Above - Fig. 69
Average freight load capacity.
Source: Adapted from FreightWaves. FStaff, F. (2020, 2 januari).
0,0120,0170,180,366 535 80 435
Source: Adapted from Ministerie van Infrastructuur en Waterstaat. Publicatie | Kennisinstituut voor Mobiliteitsbeleid. (2020, 26 mei).
W R H A W R H A W R H A W R H A W R H A W R H A W R H A W R H A
W R H A W R H A W R H A W R H A W R H A W R H A W R H A W R H A 20 ton 12.500 ton 100 ton 71
ROAD TRANSPORTATION SYSTEM
The Netherlands is an Intermodal Powerhouse
Above - Fig. 70 Freight system in the Netherlands. Source: Adapted from fig. 50 t/m 53, fig. 55 t/m 58, fig. 61 t/m 64, fig. 66 t/m 69.
As a distribution hub, Netherlands acts as the gateway for agricultural goods to Europe.
Each freight transportation modality has been rigorously developed and is interconnected to multiple countries within the Eurozone.
Generally, freight transport via waterways is the most efficient: it produces the least carbon emissions, has the lowest costs per tonkm, and features the biggest loading capacity.
Similarly, the least efficient is air transport: it produces the most carbon emissions, has the highest costs per tonkm, and features a small loading capacity.
Legend:
Air Highway Railroad Waterways
72
DUTCH DISTRIBUTION
Above - Fig. 71
The Netherlands as distribution hub for freight transport.
Source: Adapted from fig. 49, fig. 54, fig. 60, fig. 65.
Source: Based on Ministerie van Infrastructuur en Waterstaat, 2020
73 TRANSPORTATION SYSTEMS
74 DUTCH DISTRIBUTION
Local Food Distribution System
The food distribution system within the Netherlands is highly developed.
The Netherlands has specialized its domestic production to focus on value-added products like beef, dairy, and horticulture. Many industrial farming methods involve greenhouses and precise growing techniques.
For many goods produced domestically, value is added to agricultural goods during transport and processing within the Netherlands.
1. Goods can be produced and distributed to their final consumer.
2. Goods can be produced, processed, and distributed to their final consumer.
Goods can be distributed using local systems like Farmer’s Markets and Retail Chains or international systems through larger distributors or throughout other countries.
75
LOCAL FOOD DISTRIBUTION SYSTEM
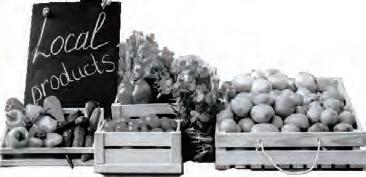
Upper Left - Fig. 72
Infographic diagramming the organisation of the national / local food system and the primary actors who engage in it.
Food Production System
Above - Fig. 73
Diagram of the interconnected food system from stages of production to distribution to consumption.
Food Grown / Famers Processed / Stored 1. 2. 76 DUTCH DISTRIBUTION
Food Growth Farmers Processing / Storage Agricultural Companies
The food distribution system is composed of a multitude of overlapping systems from food, packaging, and waste to logistical infrastructures and points-of-sale.
It is the most comprehensive component of the food system as it touches all corners of the populated globe. Everywhere food is produced or consumed, a distribution network is present.
The Netherlands has a particularly robust and innovative network.
Food Production & Distribution
Consumed Distributed / Exported 3. 4. 77
FOOD SYSTEM STAGES Distribution / Export Logistics Sales to Consumers Grocers / Markets
Port of Amsterdam
Port of Rotterdam
Shipping Ports & Specialty Imports
Above - Fig. 74 Freight highway system in The Netherlands.
Source: Adapted from Bosatlas van de veiligheid. Lijn43, Noordhoff Atlasproducties, Beukers, E., Donkers, H. & Lijn43 (Utrecht). (2017, 31 oktober).
Above - Fig. 75
Annual percentage of waste in the NL by category (Millions of Tons).
There are three key ports in The Netherlands which facilitate the distribution of particular food products before and after processing.
The Port of Amsterdam is the fourth largest port in the EU and is the second largest for annual agribulk import. It features robust all-weather and refrigerated terminals. Almost 1/4 of all global cacao enters through this port for processing in Dutch factories.
The Port of Rotterdam is the largest port in the EU by annual import (EUR)
and is particularly important because its harbours have uninterrupted access to/from the sea. It features agriculture specific terminals and is building a new Food Hub. Key agricultural imports include fruit.
The Zeeland Seaports are an important EU logistics hub shared between The Netherlands and Belgium. It has developed intermodal transport connections and the largest salt terminal in the EU. Key agricultural imports managed here include juice and cereal grains.
78
Trash Incinerated Recycled / Repurposed
Zeeland Seaport
DUTCH DISTRIBUTION
- Fig. 76
Freight waterway system in The Netherlands. Source: Adapted from Freight traffic on inland waterways CCNR (2019, 6 November).
lot
Soil.
With a landscape defined by its relationship to water, primarily the Rhine-Meuse-Scheldt Delta and the North Sea, land use across The Netherlands varies. From varietous soil types with different drainage abilities and topographical shifts to historical developments, different areas of the country are better suited for certain functions.
With more than 90% of the population living in cities, urban areas are densely developed. Around these, up to 55% of The Netherlands is utilised for agriculture: both traditional and greenhouse. Another 13% are protected, natural areas in National Parks. The small size and technical acumen of the country facilitates detailed, accurate calculations about the ways these varied uses optimize produtivity and contribute value.
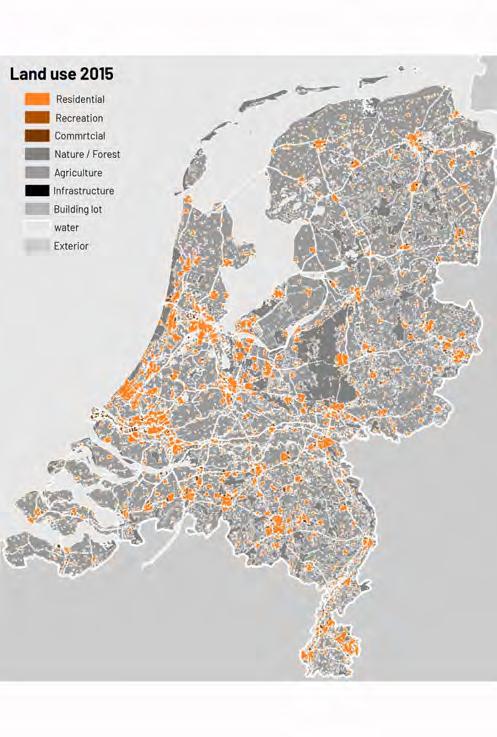
Land Use
79
Land
SPECIALTY IMPORTS & LAND USE
The Netherlands places a
of it energy into agricultural • Around been • Land
• The agriculture. • 54.11 agricultural • 44.36 for agricultural
Usage Legend: Agriculture Infrastructure Building Lot Water Surrounding Countries Nature / Forest Commercial Recreation Residential
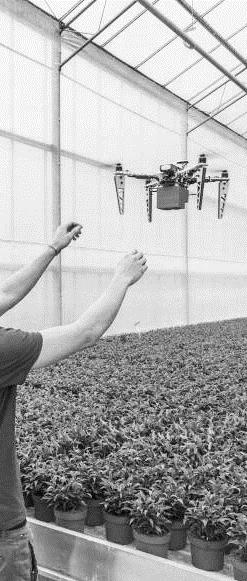
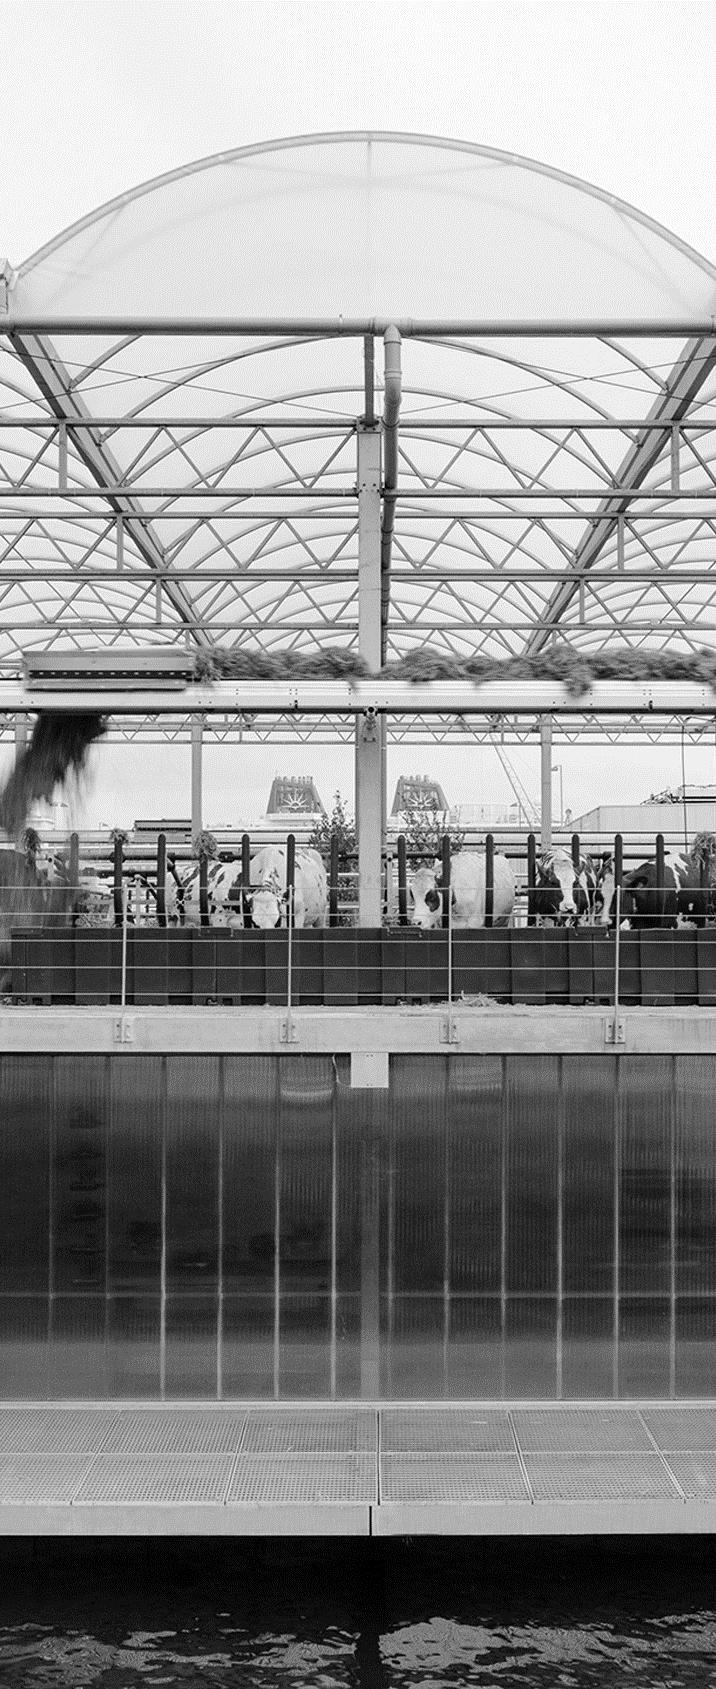
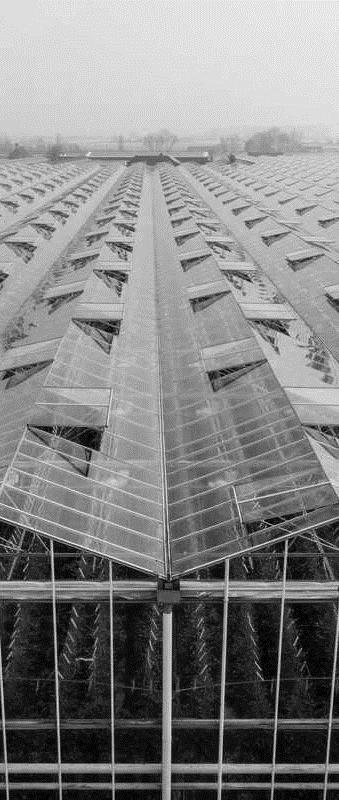
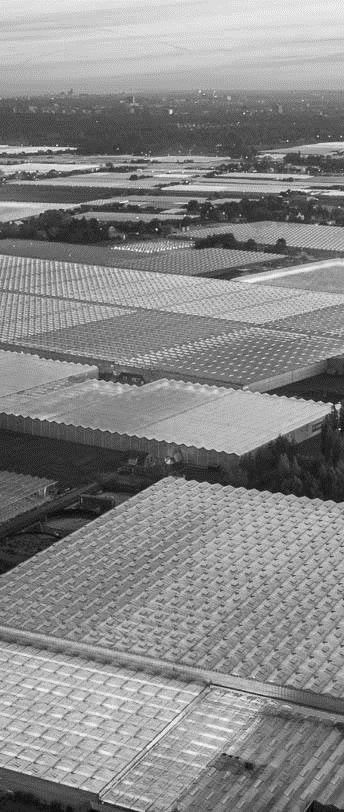
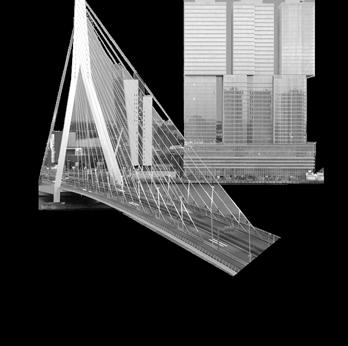
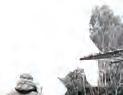
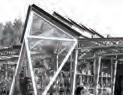
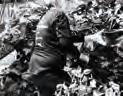
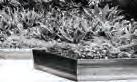
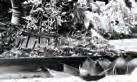
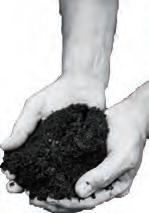
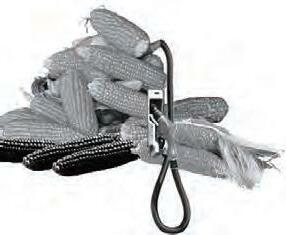
Above - Fig. 77 Collage of technical innovations in The Netherlands.
What the Netherlands
The Netherlands places
80
Technological Advancement DUTCH DISTRIBUTION
Netherlands does differently?
places a lot of it energy into agricultural innovation.
• A large Percentage of food within Greenhouses.
Agricultural Production & Technological Innovation
• Greenhouse allow a more grown.
With its developed post-industrial economy, most of the value produced by the Netherlands is generated through its university system and business sectors. Therefore, knowledge production through scientific investigation and technical innovation is the primary value creator of the Dutch economy.
• A constant push for innovated as mechanised automation.
This high tech methodology has been applied across disciplines. One example is its role in transforming traditional farming practices into incredibly efficient systems. Particular attention must be paid to the role of greenhouses in agricultural production as innovations in this sector have reduced material costs and production inputs while driving incredible multiplications in reliable, quality output.
• Only 2% of the workforce production.
•
81
Small population means capable of feeding itself.
AGRICULTURAL & TECHNOLOGICAL INNOVATION
Food Processing
Highest Annual Production of Meat
Above - Fig. 78 Freight highway system in The Netherlands. Source: Adapted from Bosatlas van de veiligheid. Lijn43, Noordhoff Atlasproducties, Beukers, E., Donkers, H. & Lijn43 (Utrecht). (2017, 31 oktober).
The developed food system of The Netherlands not only facilitates efficient production, but processing. This value-added stage prepares raw goods for consumption, combines multiple goods into higher quality products, and includes the packaging of goods for transport. Between 11 and 17% of companies registered in each Dutch province work in the food industry and their expertise enables both Dutch-origin and internationalorigin goods to be processed domestically. A total of 2% of the Dutch population works in this sector.
82
100 1200+
Number of Food Processing Companies in each Province
DUTCH DISTRIBUTION
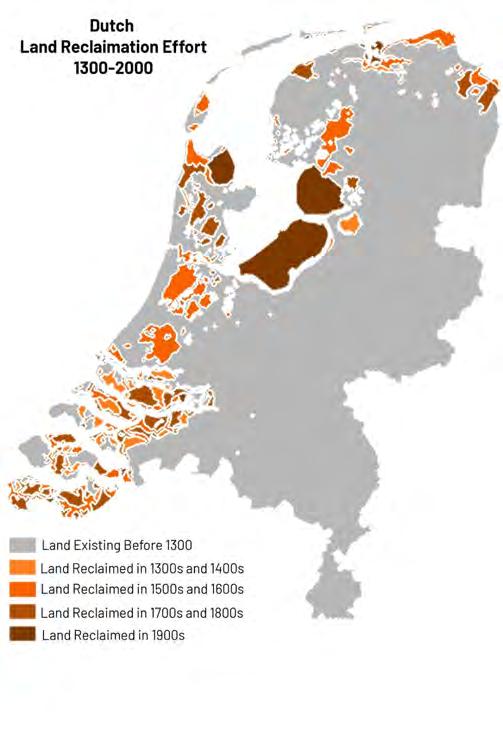
Land Usage
Above - Fig. 79 Freight waterway system in The Netherlands. Source: Adapted from Freight traffic on inland waterways CCNR (2019, 6 November).
Legend:
Land Existing Before 1300
Reclaimed in 1300s & 1400s
Reclaimed in 1500s & 1600s
Reclaimed in 1700s & 1800s
Reclaimed in 1900s
National reclamation projects have been practised for centuries, with varying degrees of success. Through the closure of the Afluisdijk in the 1930s and the efforts of the Delta Works, up to 17% of contemporary Dutch land area is reclaimed from the sea. The Eastern provinces have a greater proportion of land reclaimed from the sea (e.g. Westland, Delfland) while the Western provinces rest on harder, higher ground. Reclaimed land benefits from nutrient-rich, fertile soil and much of it is utilised for agriculture.
Land Reclamation
83 The Netherlands places
PROCESSING & LAND RECLAMATION
84 1.0 2.0
FOOD SYSTEM IN THE MRDH: Present-to-Future
REGIONAL
TO CIRCULARITY
Right - Fig. 80 Food System timeline highlighting current stages of System 2.0 and the progress required to reach System 3.0.
“...the complex network of actors, processes and relationships to do with food production, processing, marketing, and consumption that exists in a given geographical region that includes a more or less concentrated urban centre and its surrounding peri-urban and rural hinterland; a regional landscape across which flows of people, goods and ecosystem services are managed.”
Jennings, S.
85
PRESENT - PROBLEM - FUTURE
86
CONSUMER RETAIL TO CIRCULARITY
DISTRIBUTION
PRODUCTION
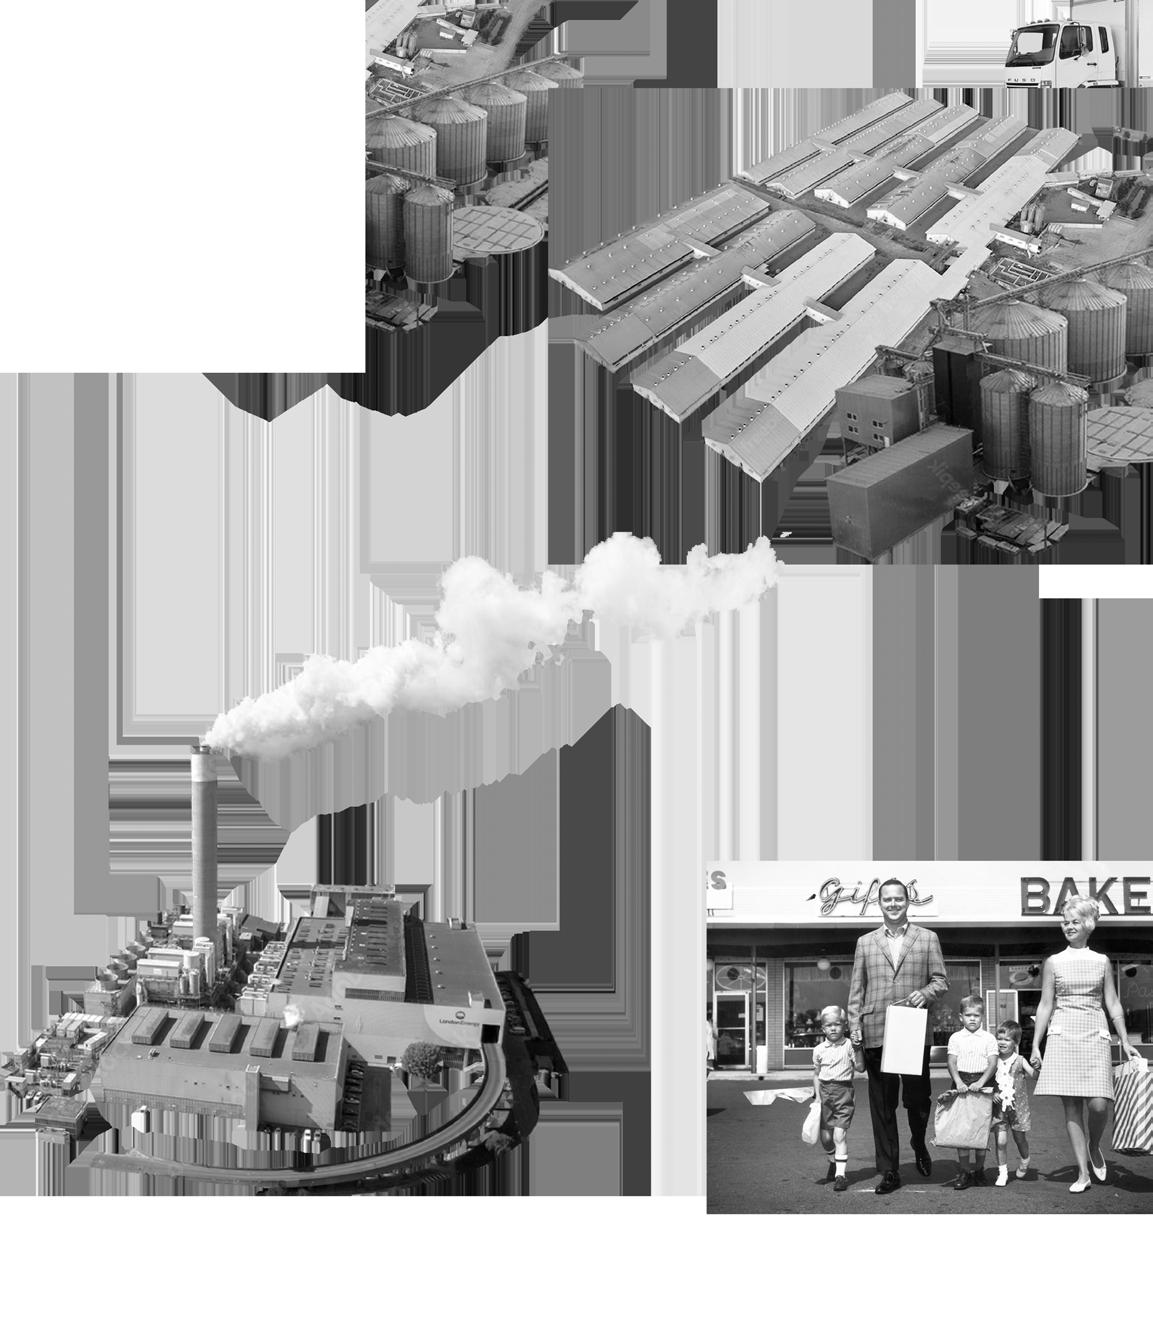
The first step in the supply chain of agricultural goods is their PRODUCTION.
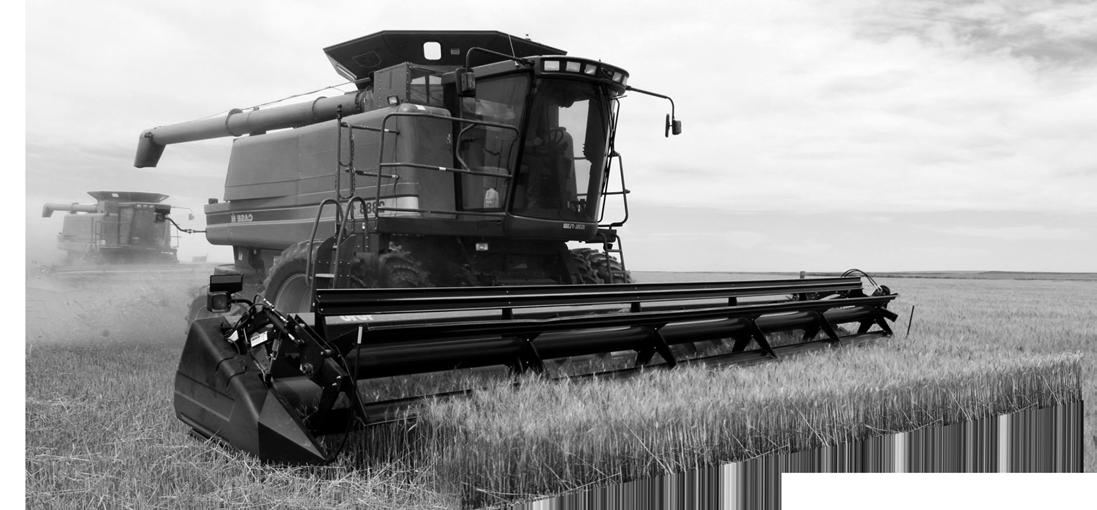
The majority of production occurs in rural areas. In Food System 2.0, some food production occurs in the Netherlands (e.g. high-value, specialty foods), while other production occurs within other countries and is imported. Domestic production occurs primarily in greenhouses or in fields.
Food production is typically industrialized, but can rely on small, local farmers in the Global South. When production is scaled for efficiency or for highest economic prospects, biodiversity decreases and modern crops are increasingly monocultural.
Left
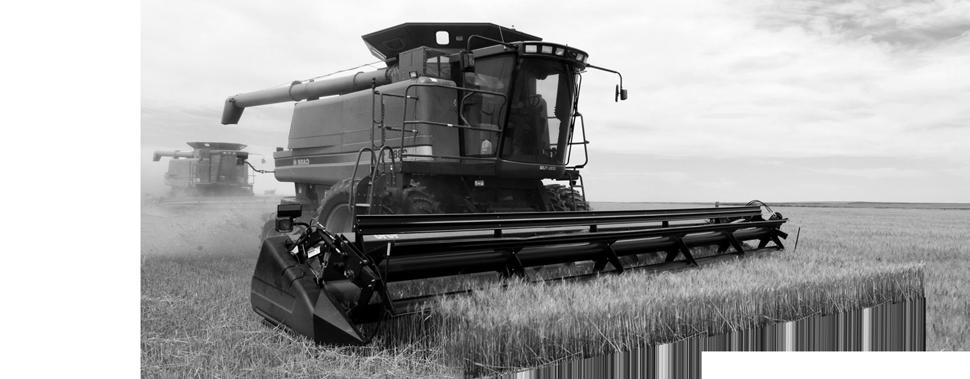
Above - Fig. 82
87
PRODUCTION STAGE
Collage of “Production” stage of the supply chain.
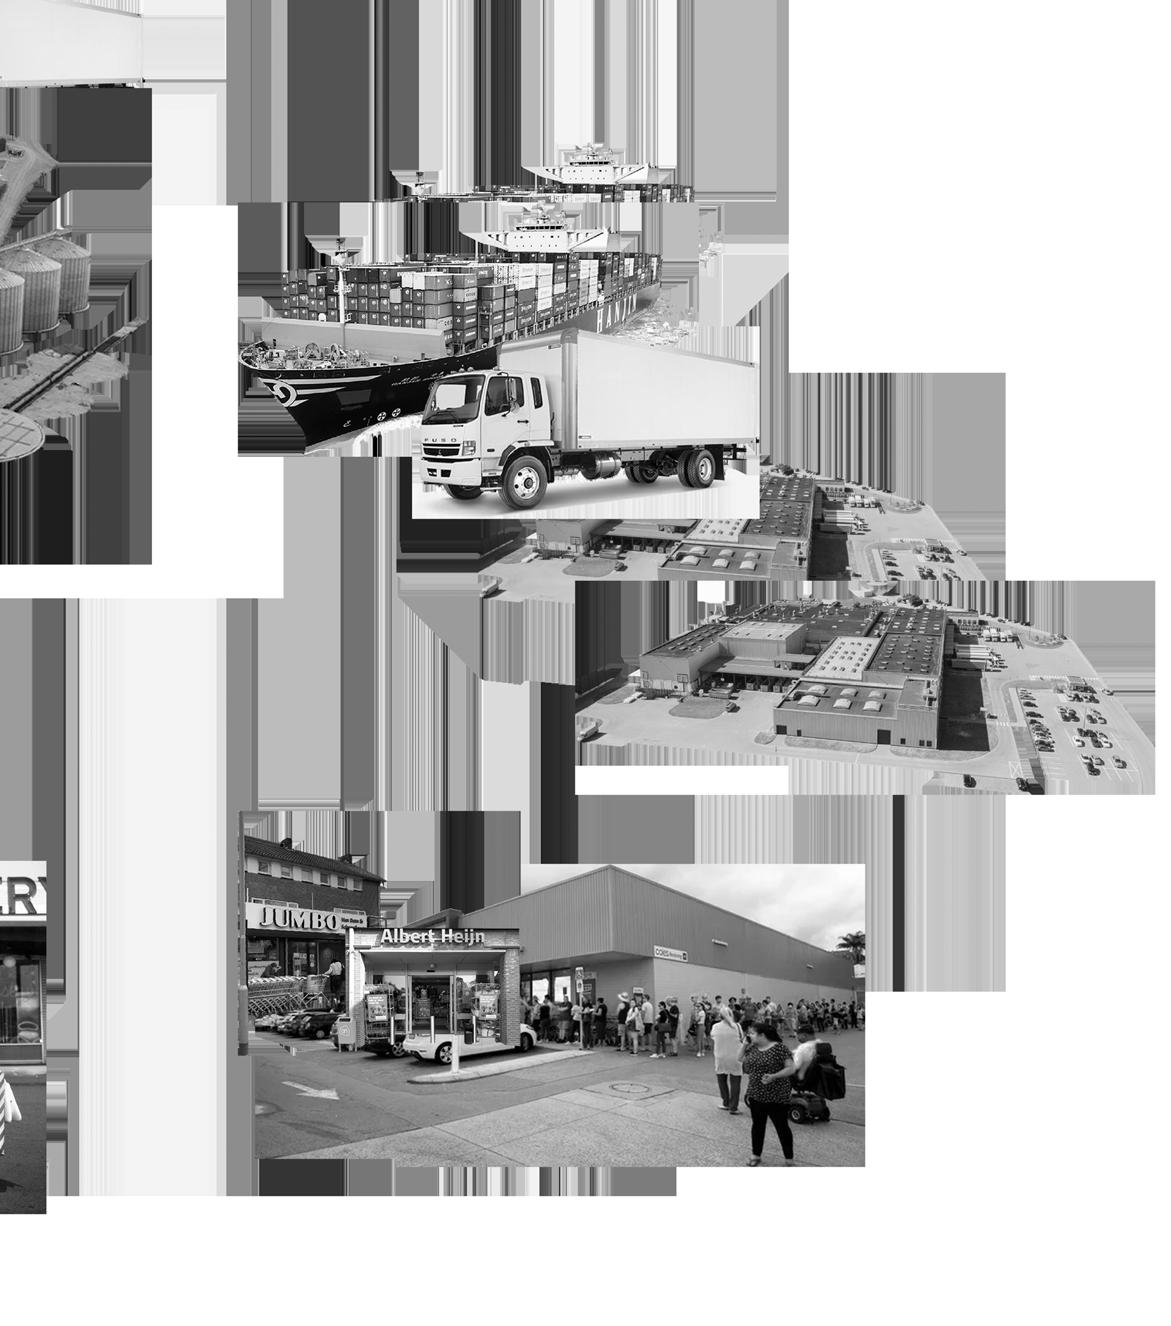
- Fig. 81 Collage of the companion stages of the supply chain.
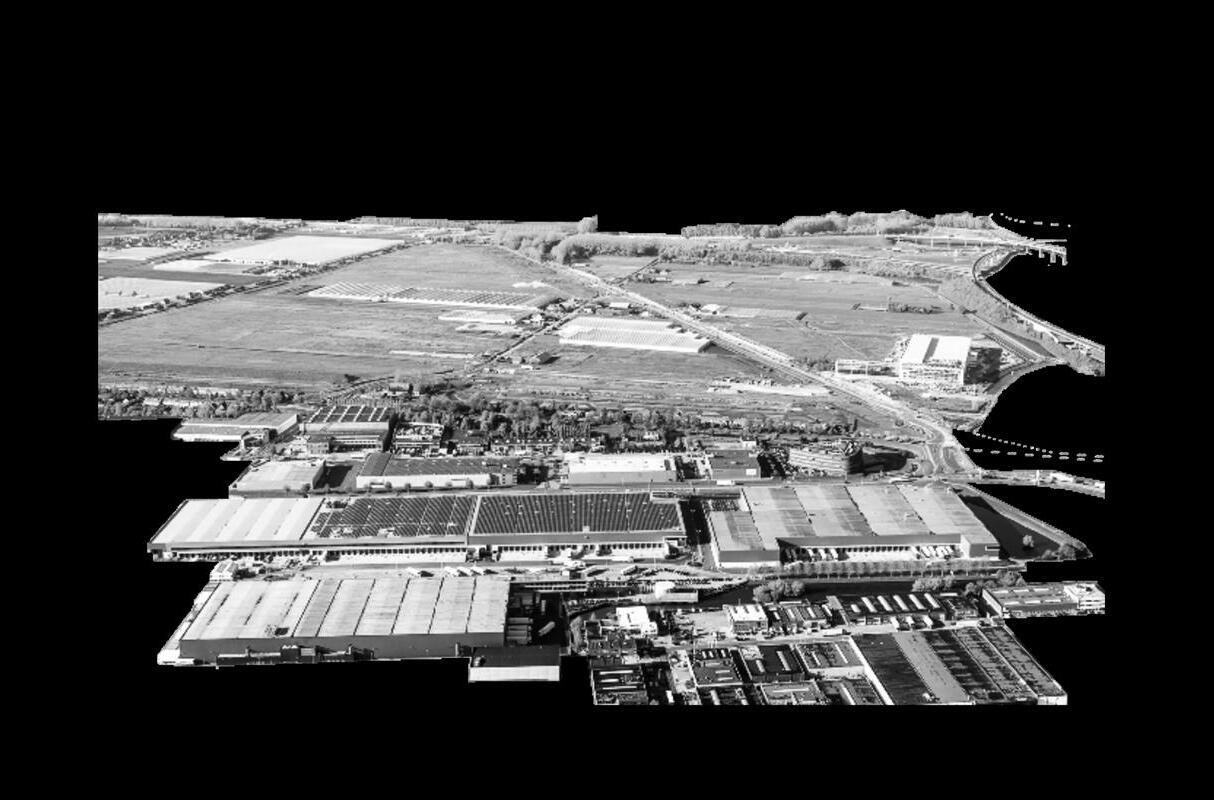
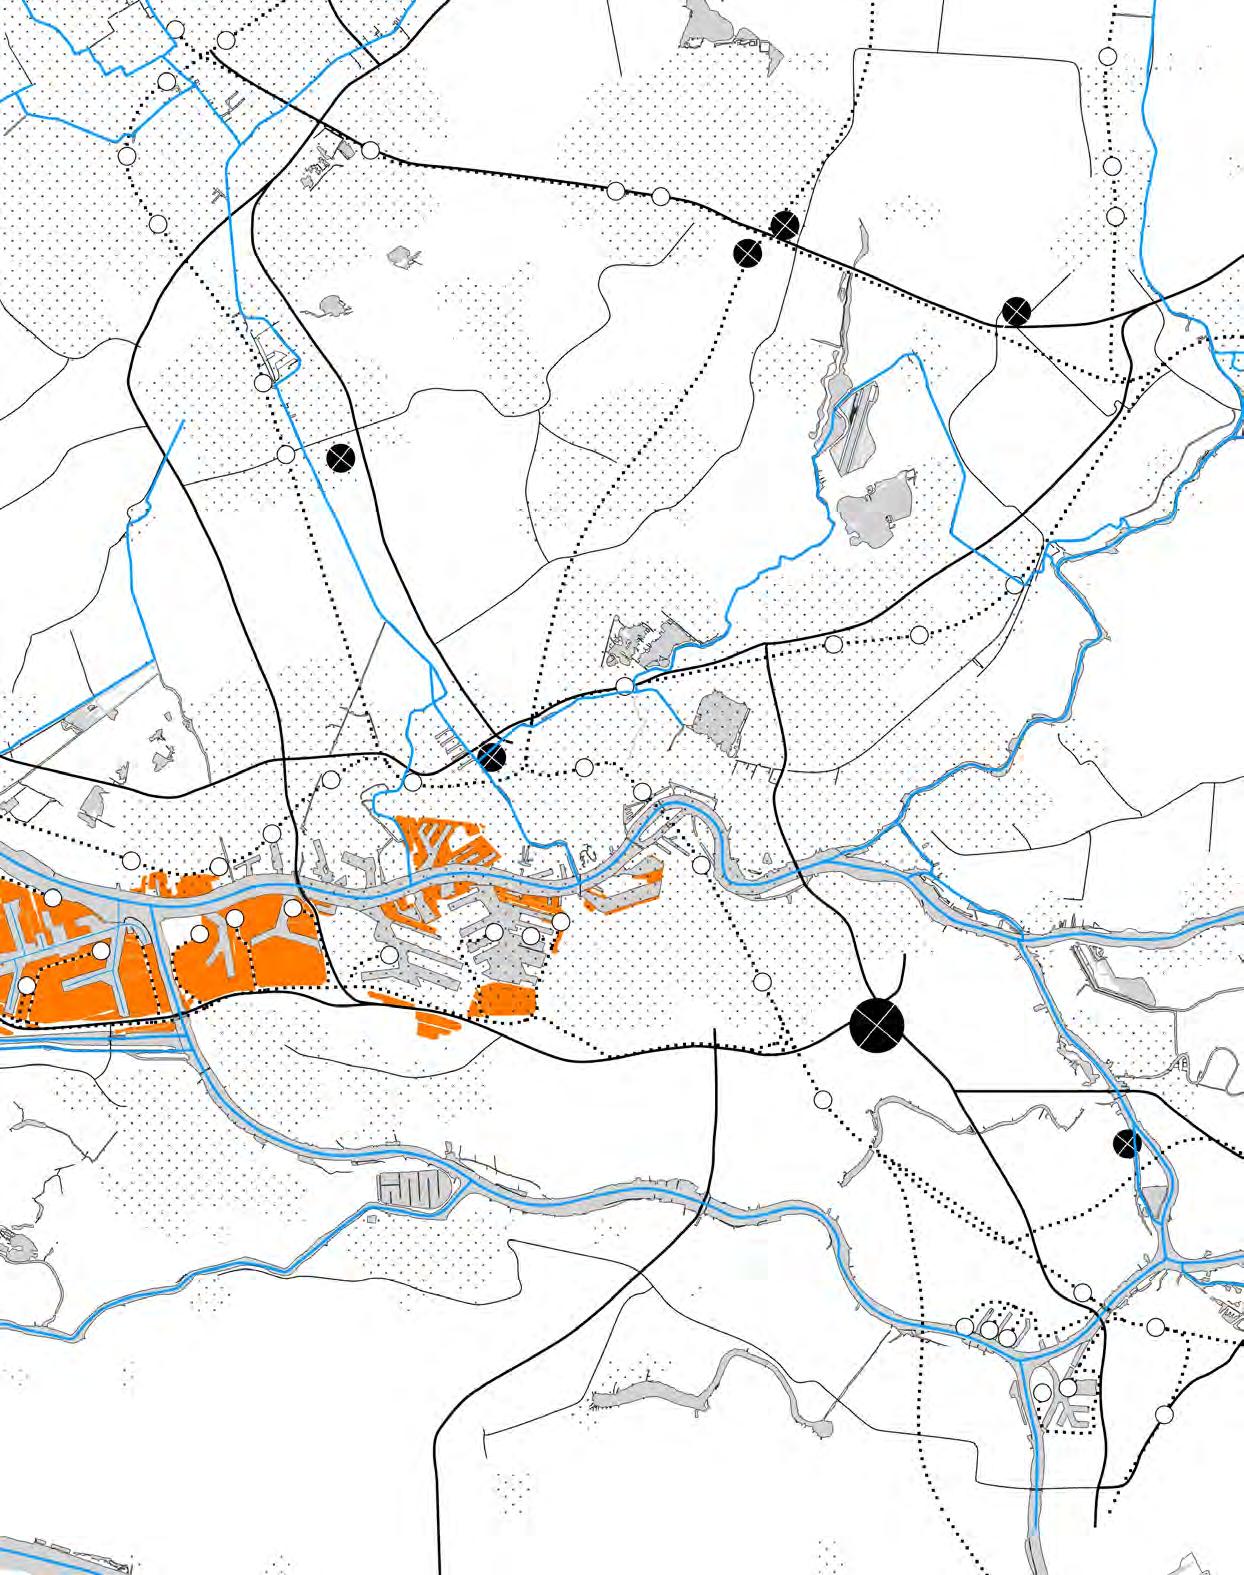
Food Production in the Rotterdam - The Hague Metropolitan Area
South Holland is the most developed and industrialised region in The Netherlands. Over 90% of the food consumed in Rotterdam is imported from outside the province. However, within the metropolitan region a large majority of land is dedicated to food production. These can be classified into three types of use: (1) “industrialized” agriculture with its greenhouses in Westerland and around Zoetermeer, (2) the traditional field agriculture in the region “Zuid-Hollandse Eilanden,’’ and (3) the pastures used mainly for sheep and cattle.
Port of Rotterdam
88
Right - Fig. 83 Map of food production regions near Rotterdam. Source: Open Street Map, Atlas of the Region.
TO CIRCULARITY
Westland
Den Haag Zoetermeer
Delft
P a s t u r e s
P a s t u r e s P a s t u r e s Rotterdam
Port of Rotterdam
89
FOOD PRODUCTION IN MRDH Farmland Greenhouses Urban Areas Legend:
90 PRODUCTION CONSUMER
TO CIRCULARITY
RETAIL
DISTRIBUTION
The second step in the supply chain is DISTRIBUTION.
Whether goods are produced domestically or imported from international origins, they require logistical management and transport to their final destination. Depending on the distance to this location, this step varies in complexity. Some goods are transported to an enduser in raw form, while others are processed in industrial settings. The value-added during this step varies with the type of good.
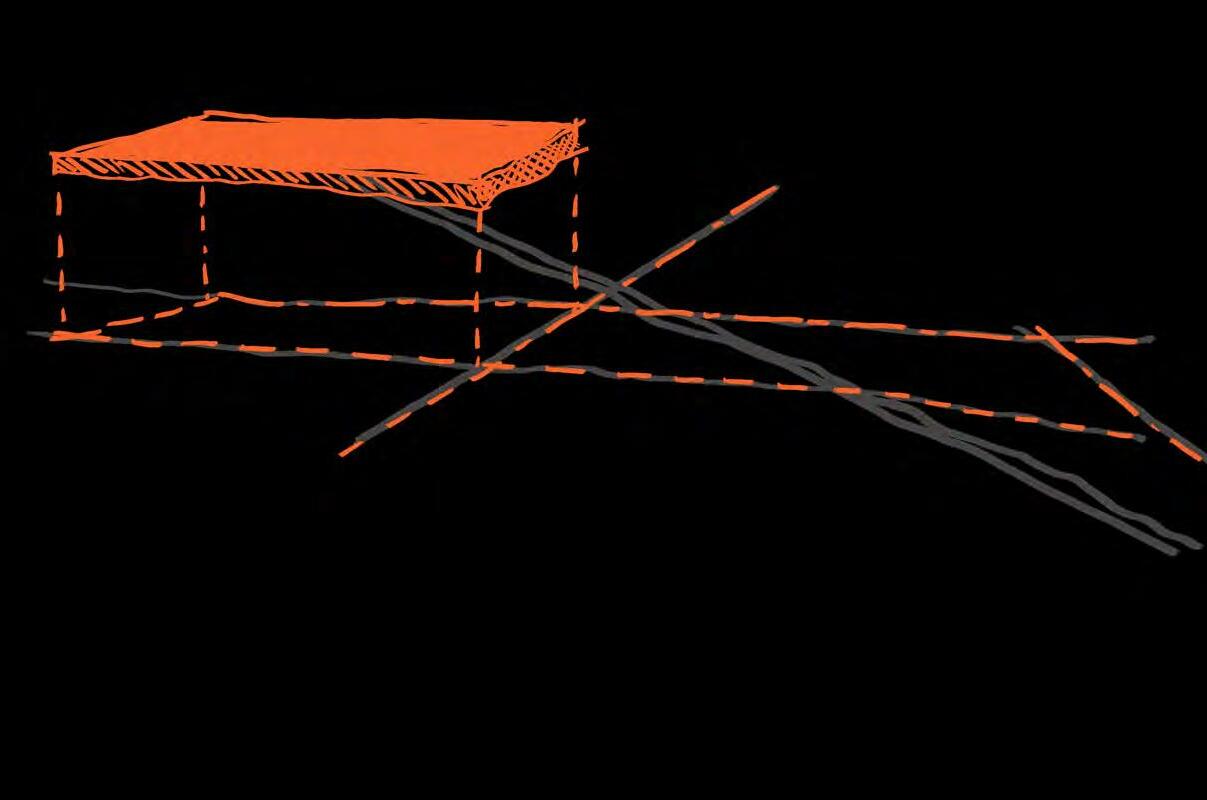
Left - Fig. 84
Above - Fig. 85
91
DISTRIBUTION STAGE
Collage of “Distribution” stage of the supply chain.
Collage of the companion stages of the supply chain.
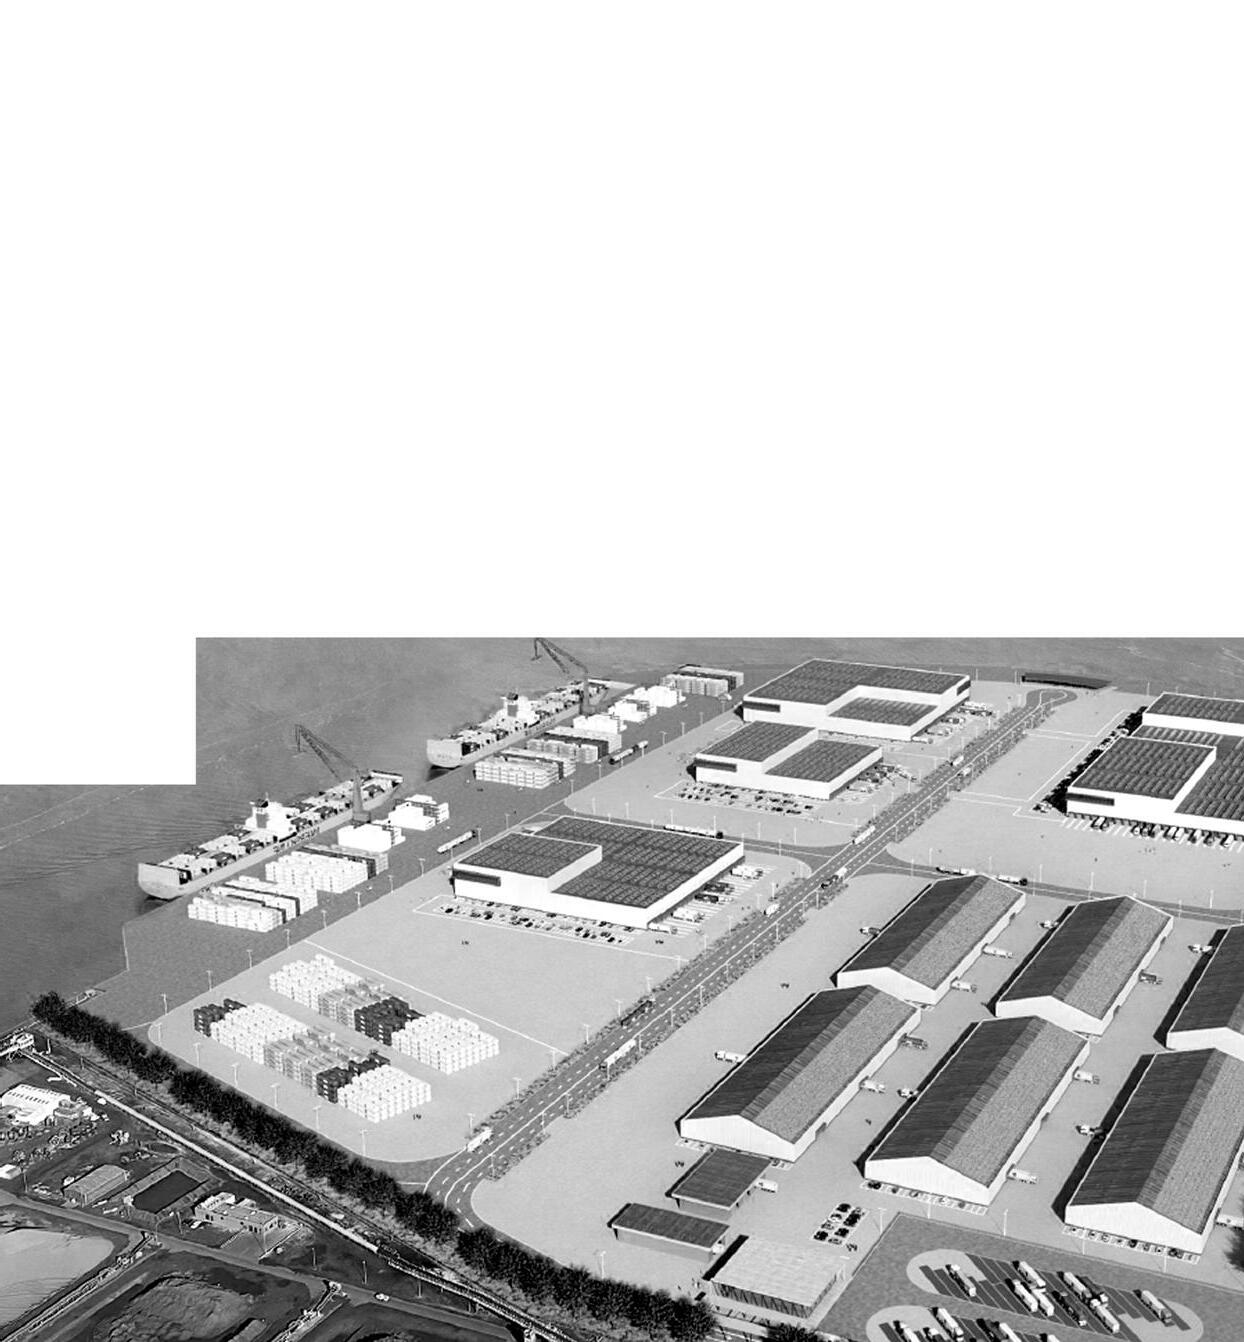
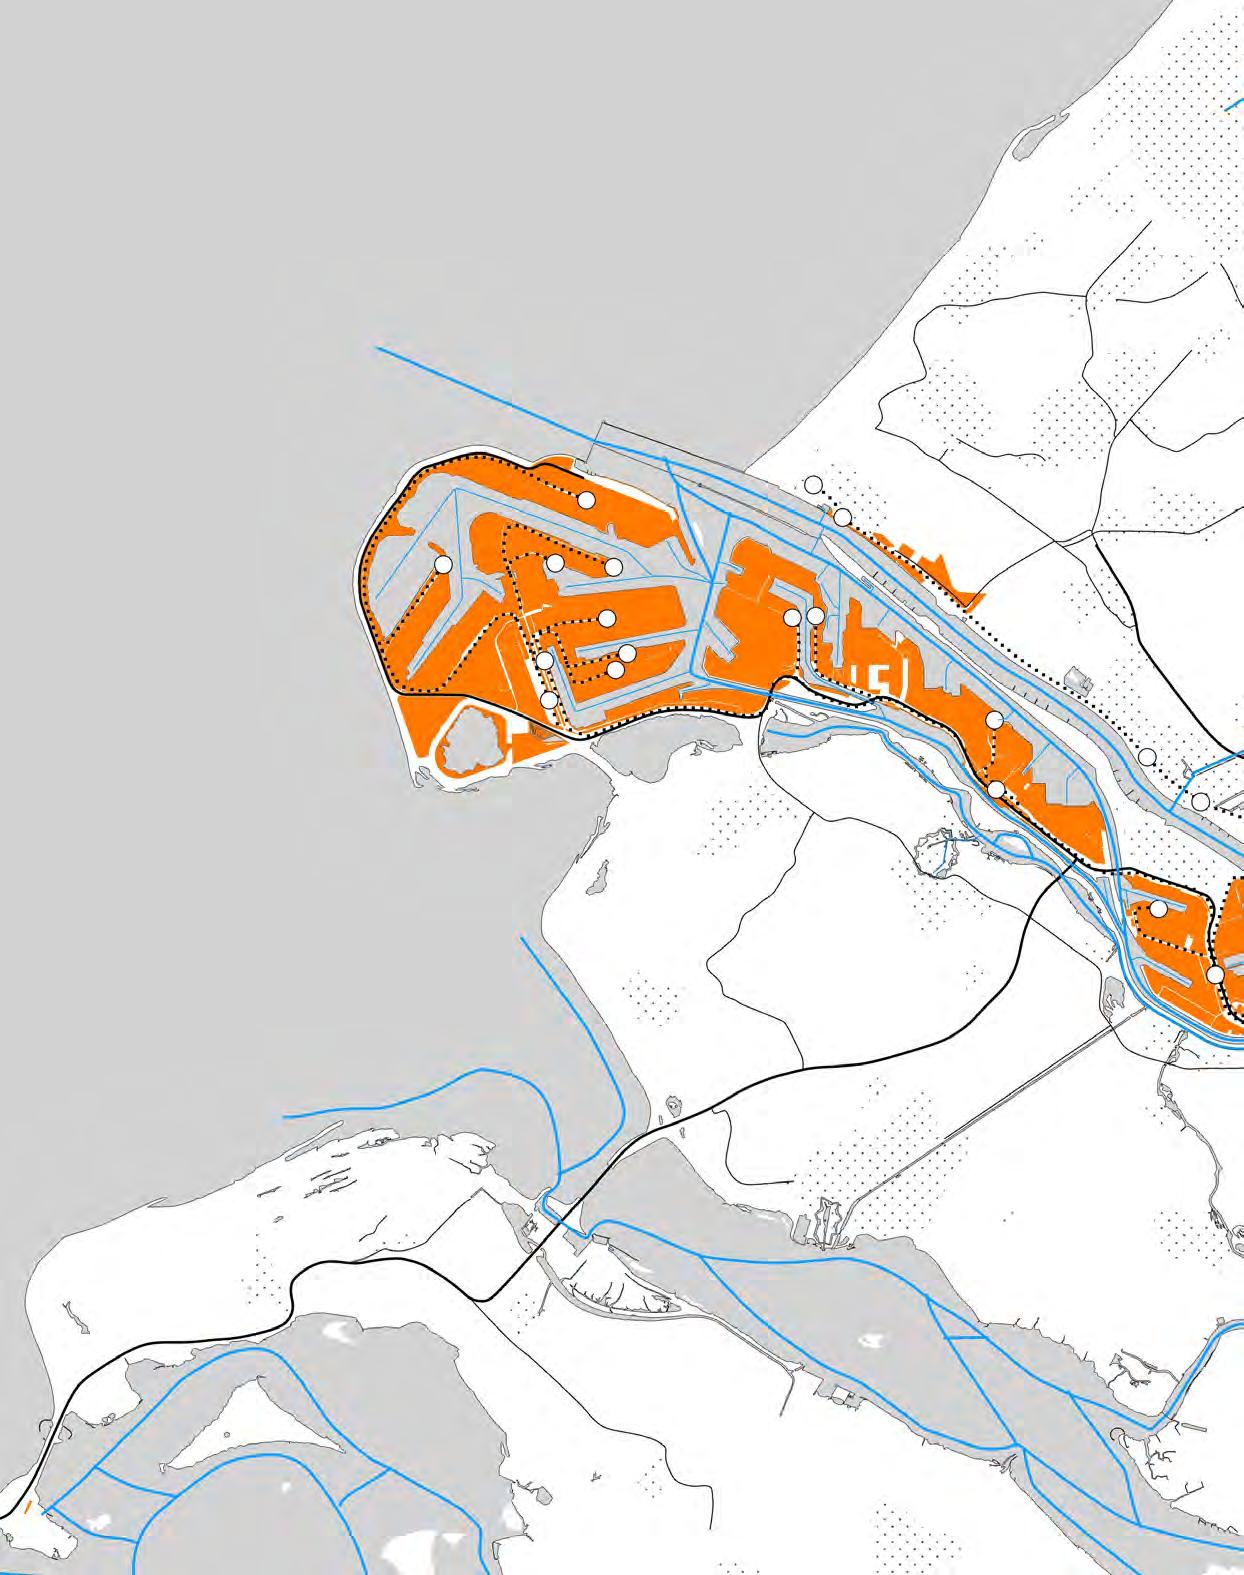
The Port of Rotterdam plays a central role in domestic and international distribution. Locally, it is an important part of Rotterdamer’s civic identity and is the result of generations of savvy investment and thoughtful development.
The further expansion of the Nieuwe Waterweg and addition of new, larger terminals have extended the relevance of the port into the 21st century. Additionally, its richly developed intermodal netowork make it an incredibly important transshipment point. The parallel arrangement of waterways and roads/railroads make this port unmatched in cargo distribution.
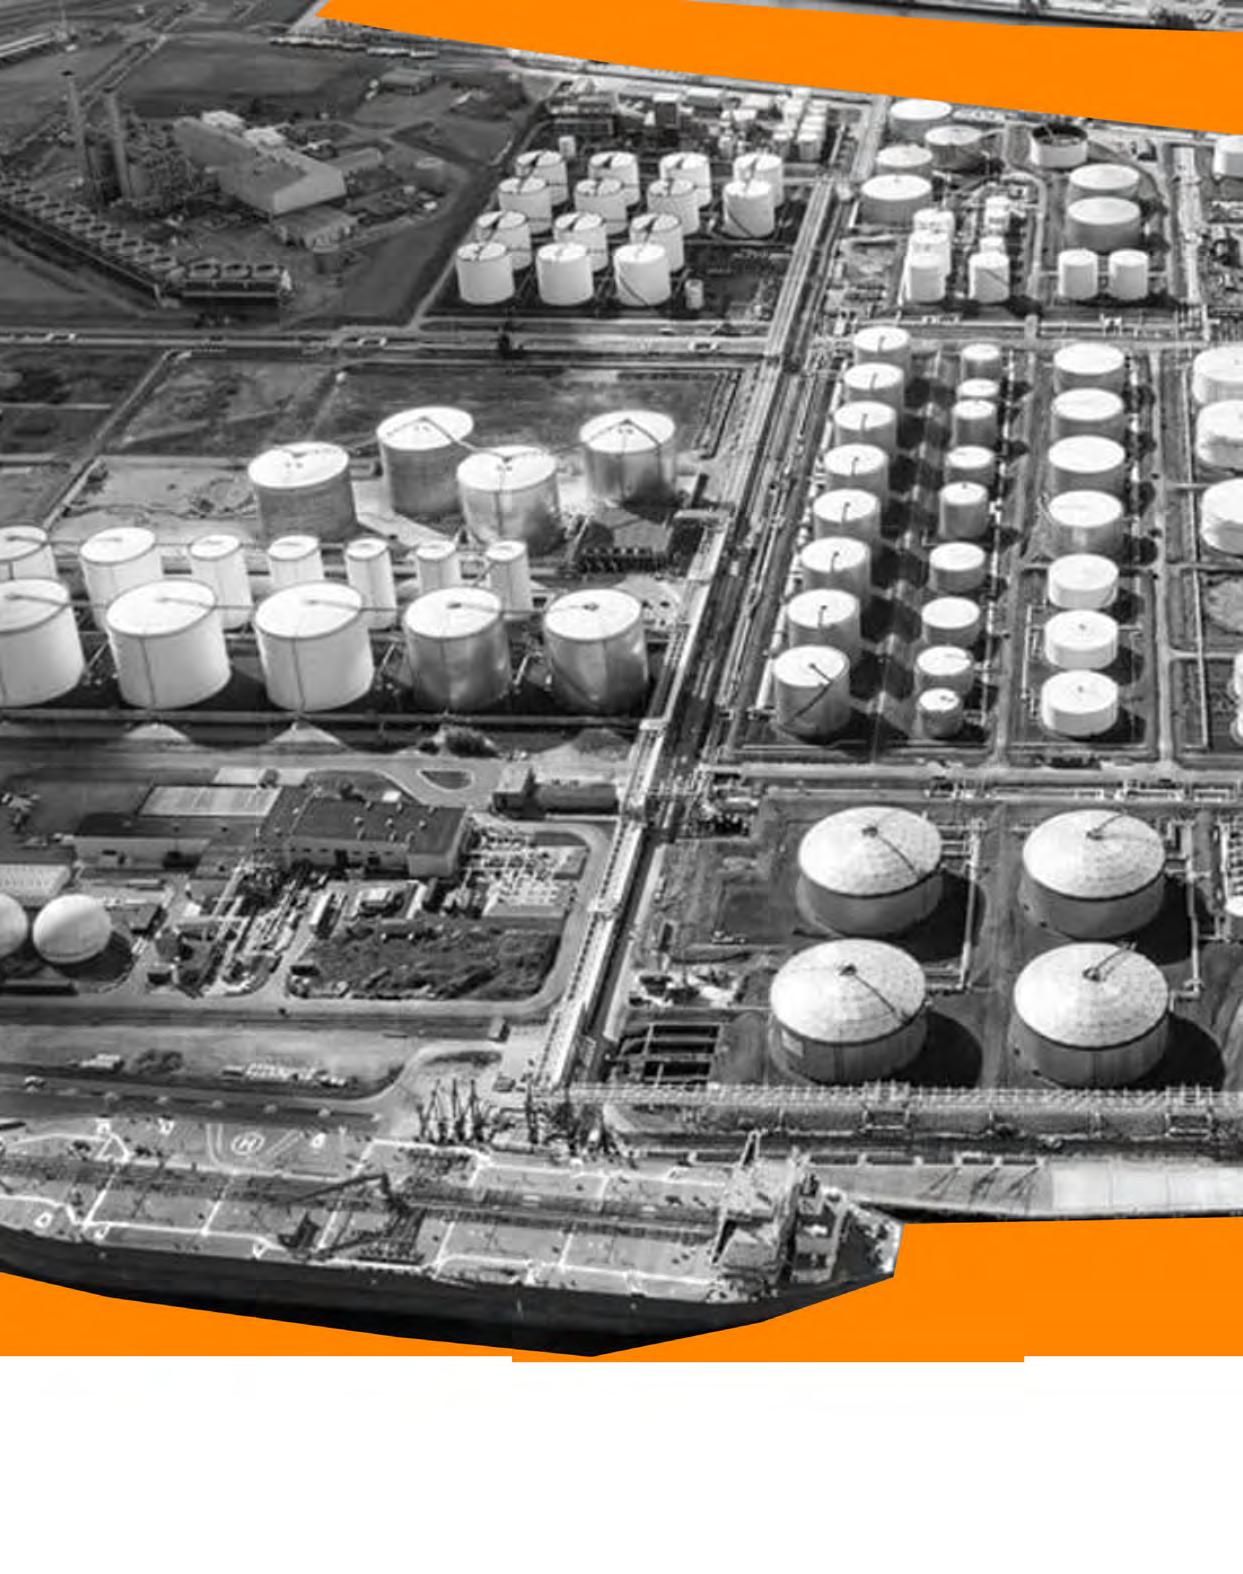
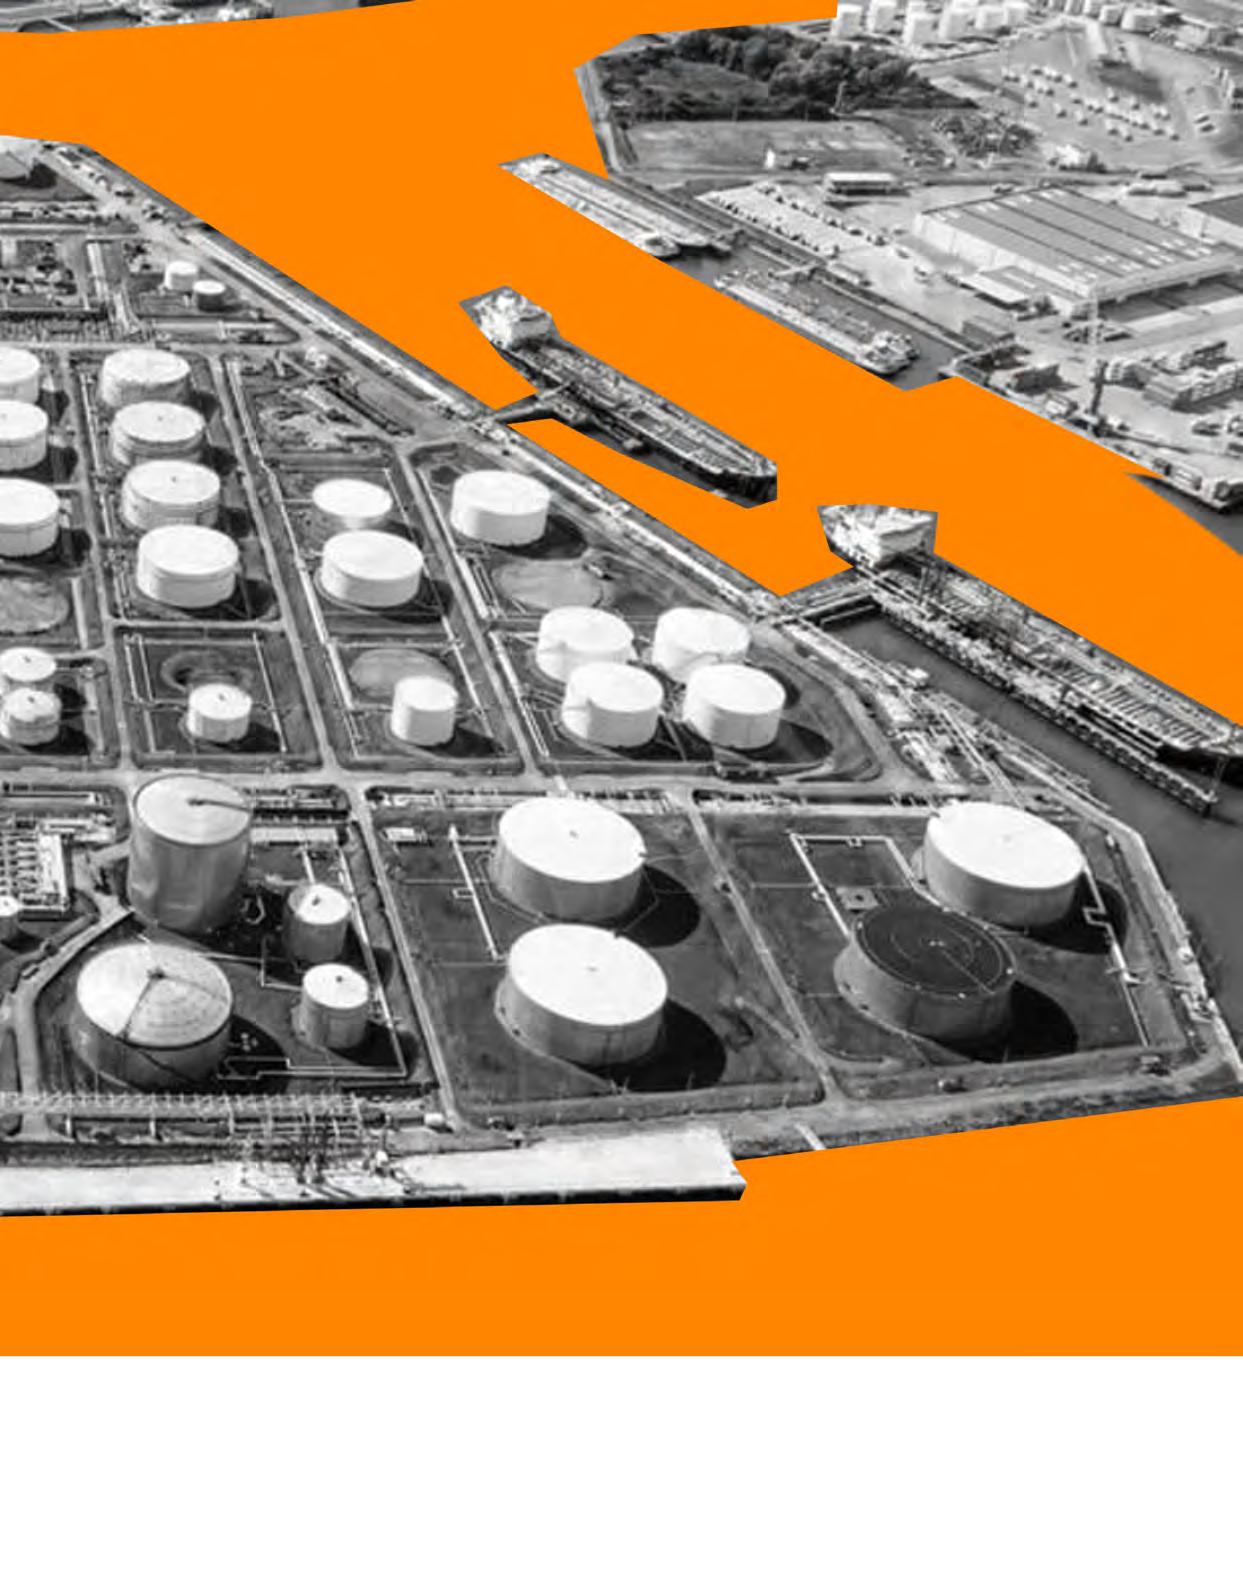
Currently, a significant portion of the port is dedicated to the storage, processing, and transportation of petrochemicals (primarily crude oil). In its report on the structural transformation of the areas, the Port Authority envisions a shift away from petroleum toward a hub for circularity. This would make optimal use of the infrastructural conditions, expand the port, and transform its function.
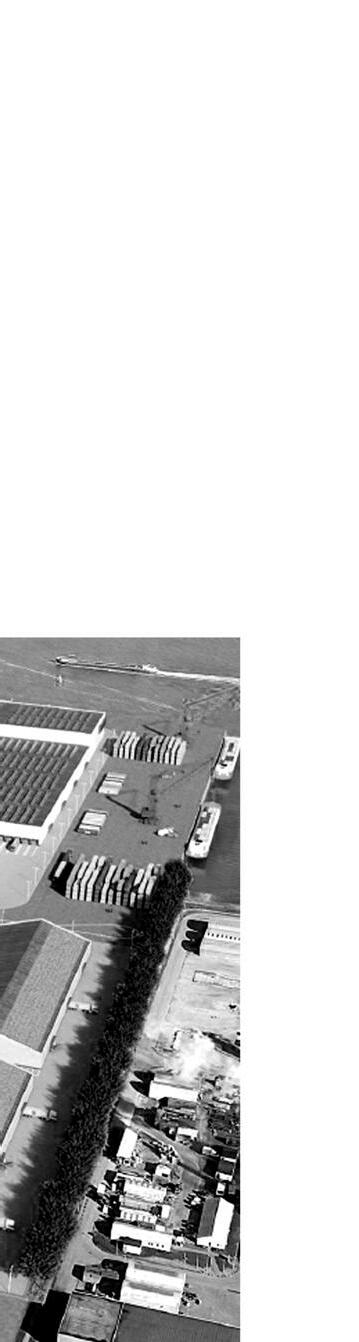
Right - Fig. 86
Connectivity
92
TO CIRCULARITY
Port of Rotterdam
of port and distribution centers via various modes of transport.
Source: Open Street Map, Atlas of the Region.
Den Haag
Westland Delft
93
Schiedam
CONNECTIVITY OF MRDH
Distribution
Train Stations Industrial Areas
Centers Legend: Railroad Tracks Waterways Major Highways
Food Distribution in the Region: A Centralized System
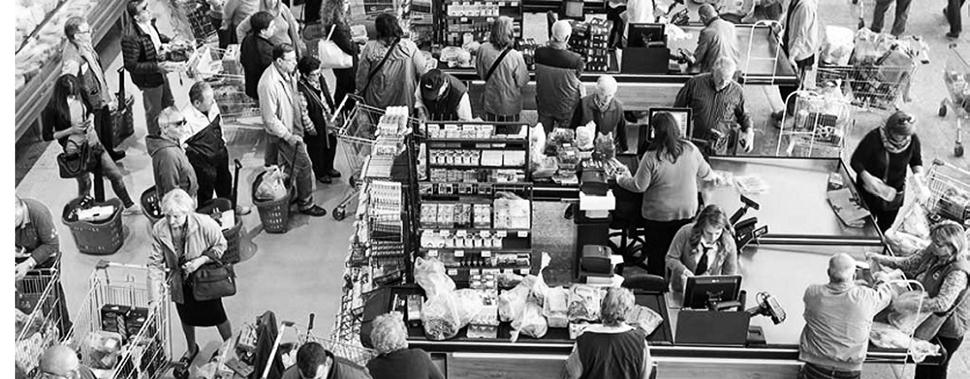
In a survey, over 80% of Rotterdammers said they purchased groceries in supermarkets.
The logistics centers of the five largest supermarket chains have been identified and located on the map. These are mostly located on the periphery of urban centers, but in close proximity to major traffic arteries. This underscores the central role that road transportation plays in supplying the metropolitan region.
Railroad and shipping networks are mostly used for national and international imports and exports.
Westland
Port of Rotterdam
94
TO CIRCULARITY
Right - Fig. 87 Food distribution routes via water, rail, and road. Source: Open Street Map, Atlas of the Region.
Den Haag Zoetermeer
Rotterdam
95
Delft Port of
DISTRIBUTION ROUTES IN MRDH Train Stations Industrial Areas Distribution Centers Legend: Railroad Tracks Waterways Major Highways
Dordrecht
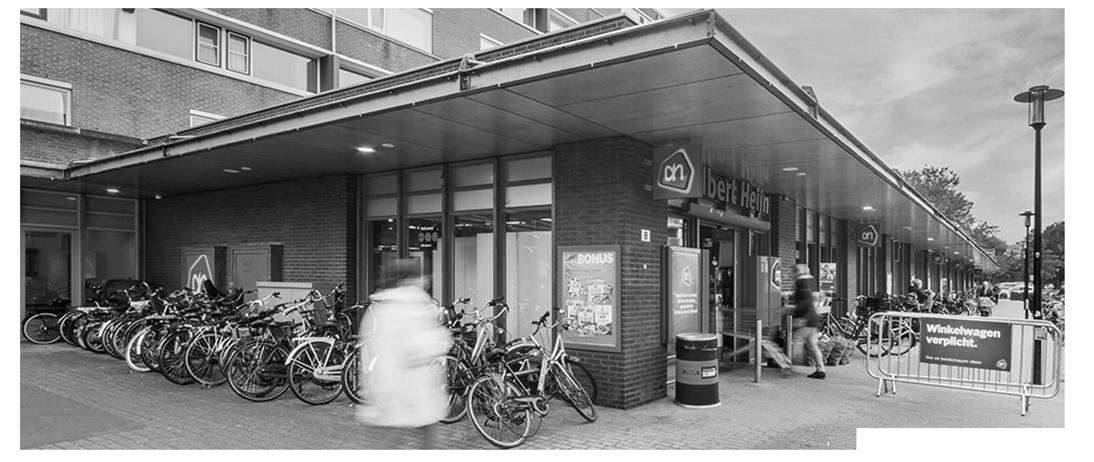
Above - Fig. 88 Collage of the companion stages of the supply chain.
Right - Fig. 89
Collage of “Retail” and “Consumer stages of the supply chain.
PRODUCTION DISTRIBUTION
96
TO CIRCULARITY
RETAIL & CONSUMER
The third step in the supply chain is RETAIL.
This step forms the link between the industrial food system and the end consumer. In Food System 2.0, this is also the most common way of acquiring groceries.
97
RETAIL & CONSUMER STAGES
Below - Fig. 90 Location of retail locations in / around Rotterdam.
Source: Open Street Map, Atlas of the Region.
Westland Delft
Port of Rotterdam
Rotterdam
98 TO CIRCULARITY
Zoetermeer
Supermarkets & Small Retail Shops
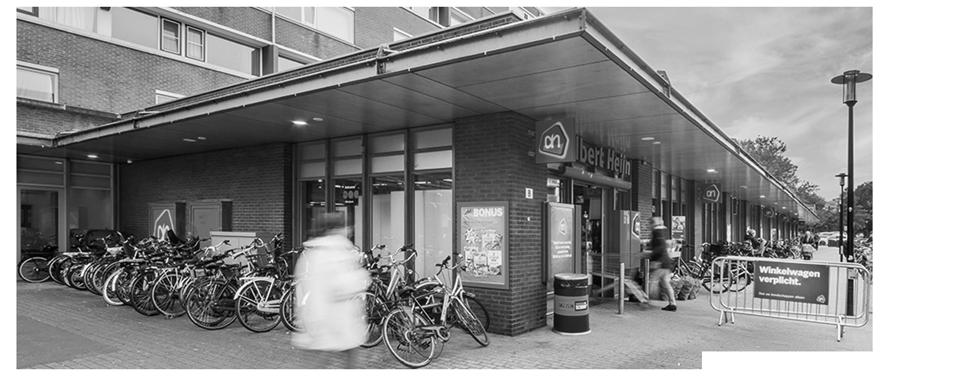
The map shows a distribution of the top five chain supermarkets in The Netherlands (Albert Heijn, Jumbo, Aldi, Lidl, Plus) along with privately owned retail shops. The city centre has a higher store density.
Supermarkets are the primary drivers of the retail system. Unlike distribution centres, the priority of their location is not only about proximity to transit corridors, but also the location of the consumers they serve.
Dordrecht
Legend:
Supermarkets Non-Industrial Areas
99
According to the statistics, 80%of the people in Rotterdam city get groceries from supermarkets, while 20% of the people get groceries from local markets, small shops, and the internet (Bedford, 2022). The pandemic and subsequent lifestyle changes may affect these data. Small Retail Shops Industrial Areas FOOD SALES POINTS IN MRDH
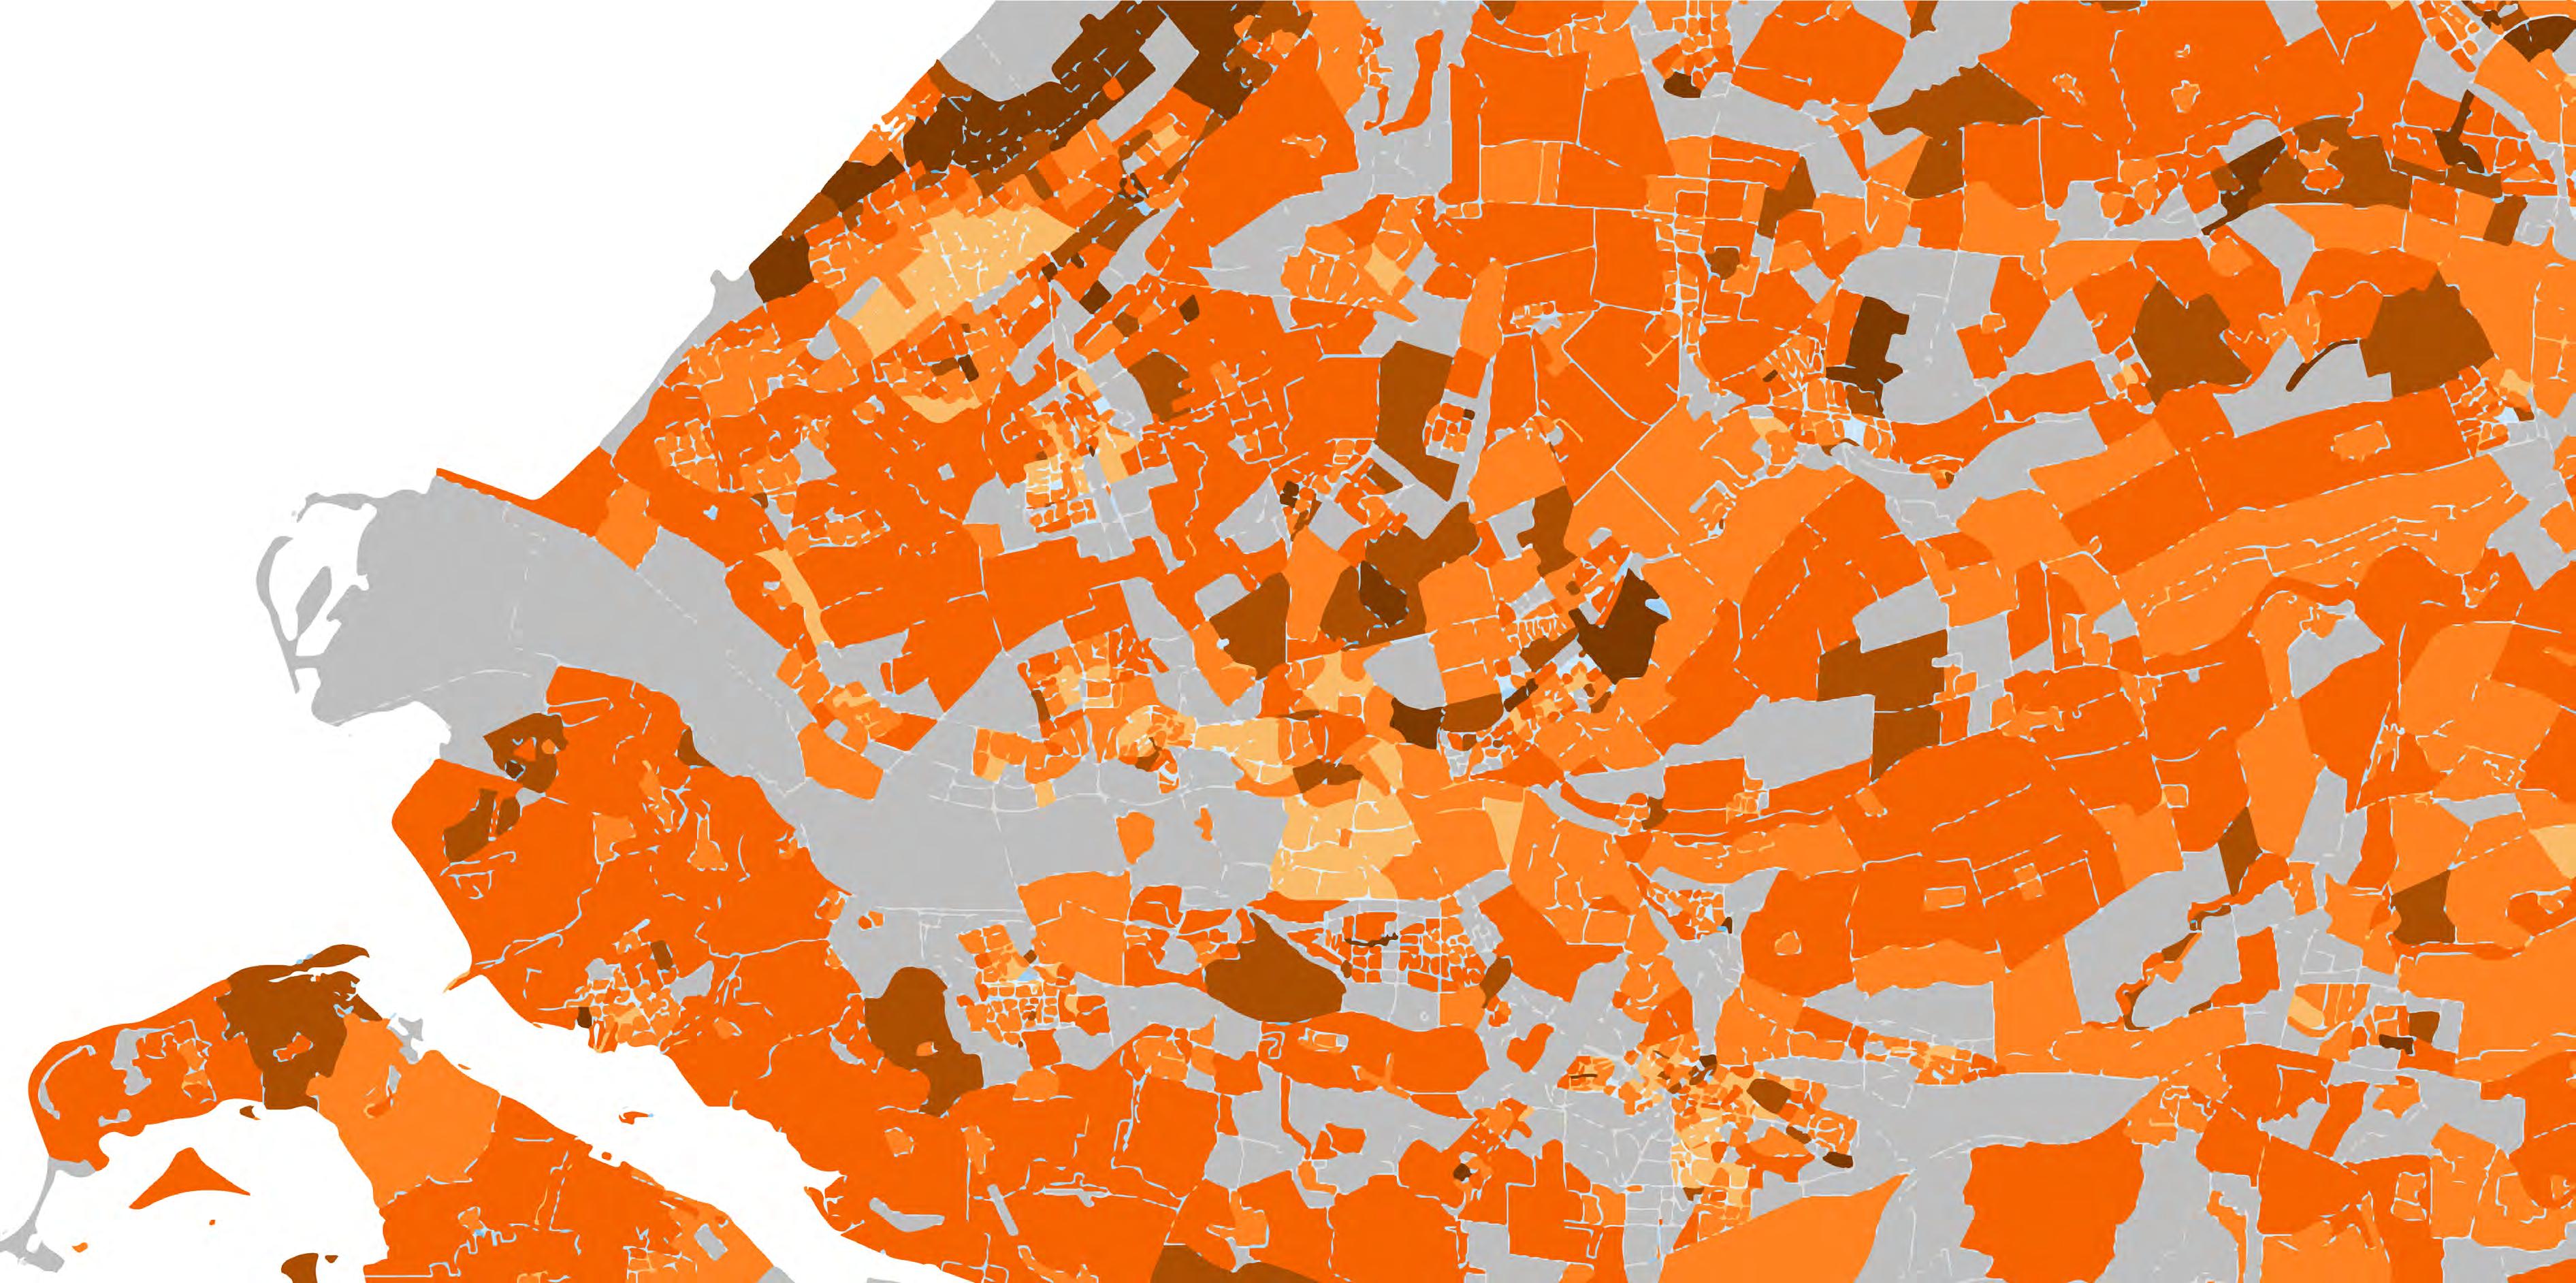
Below - Fig. 91 Location of retail locations in relation to averge income. Source: Open Street Map, Atlas of the Region.
Westland Delft
Port of Rotterdam
Rotterdam
TO CIRCULARITY
Zoetermeer
Gross Income & Points-of-Sale
This map presents the arithmetic average personal gross income per person based on persons living in private households. The location of stores has been superimposed over this data.
Surprisingly, this comparison reveals a weak correlation between these factors. The level of income does not appear to have a significant impact on store distribution. This means the density of points of sale is not related to the wealth of the area.
Highest Income Lowest Income FOOD SALES POINTS IN MRDH
Dordrecht
Small Retail Shops Supermarkets
Legend:
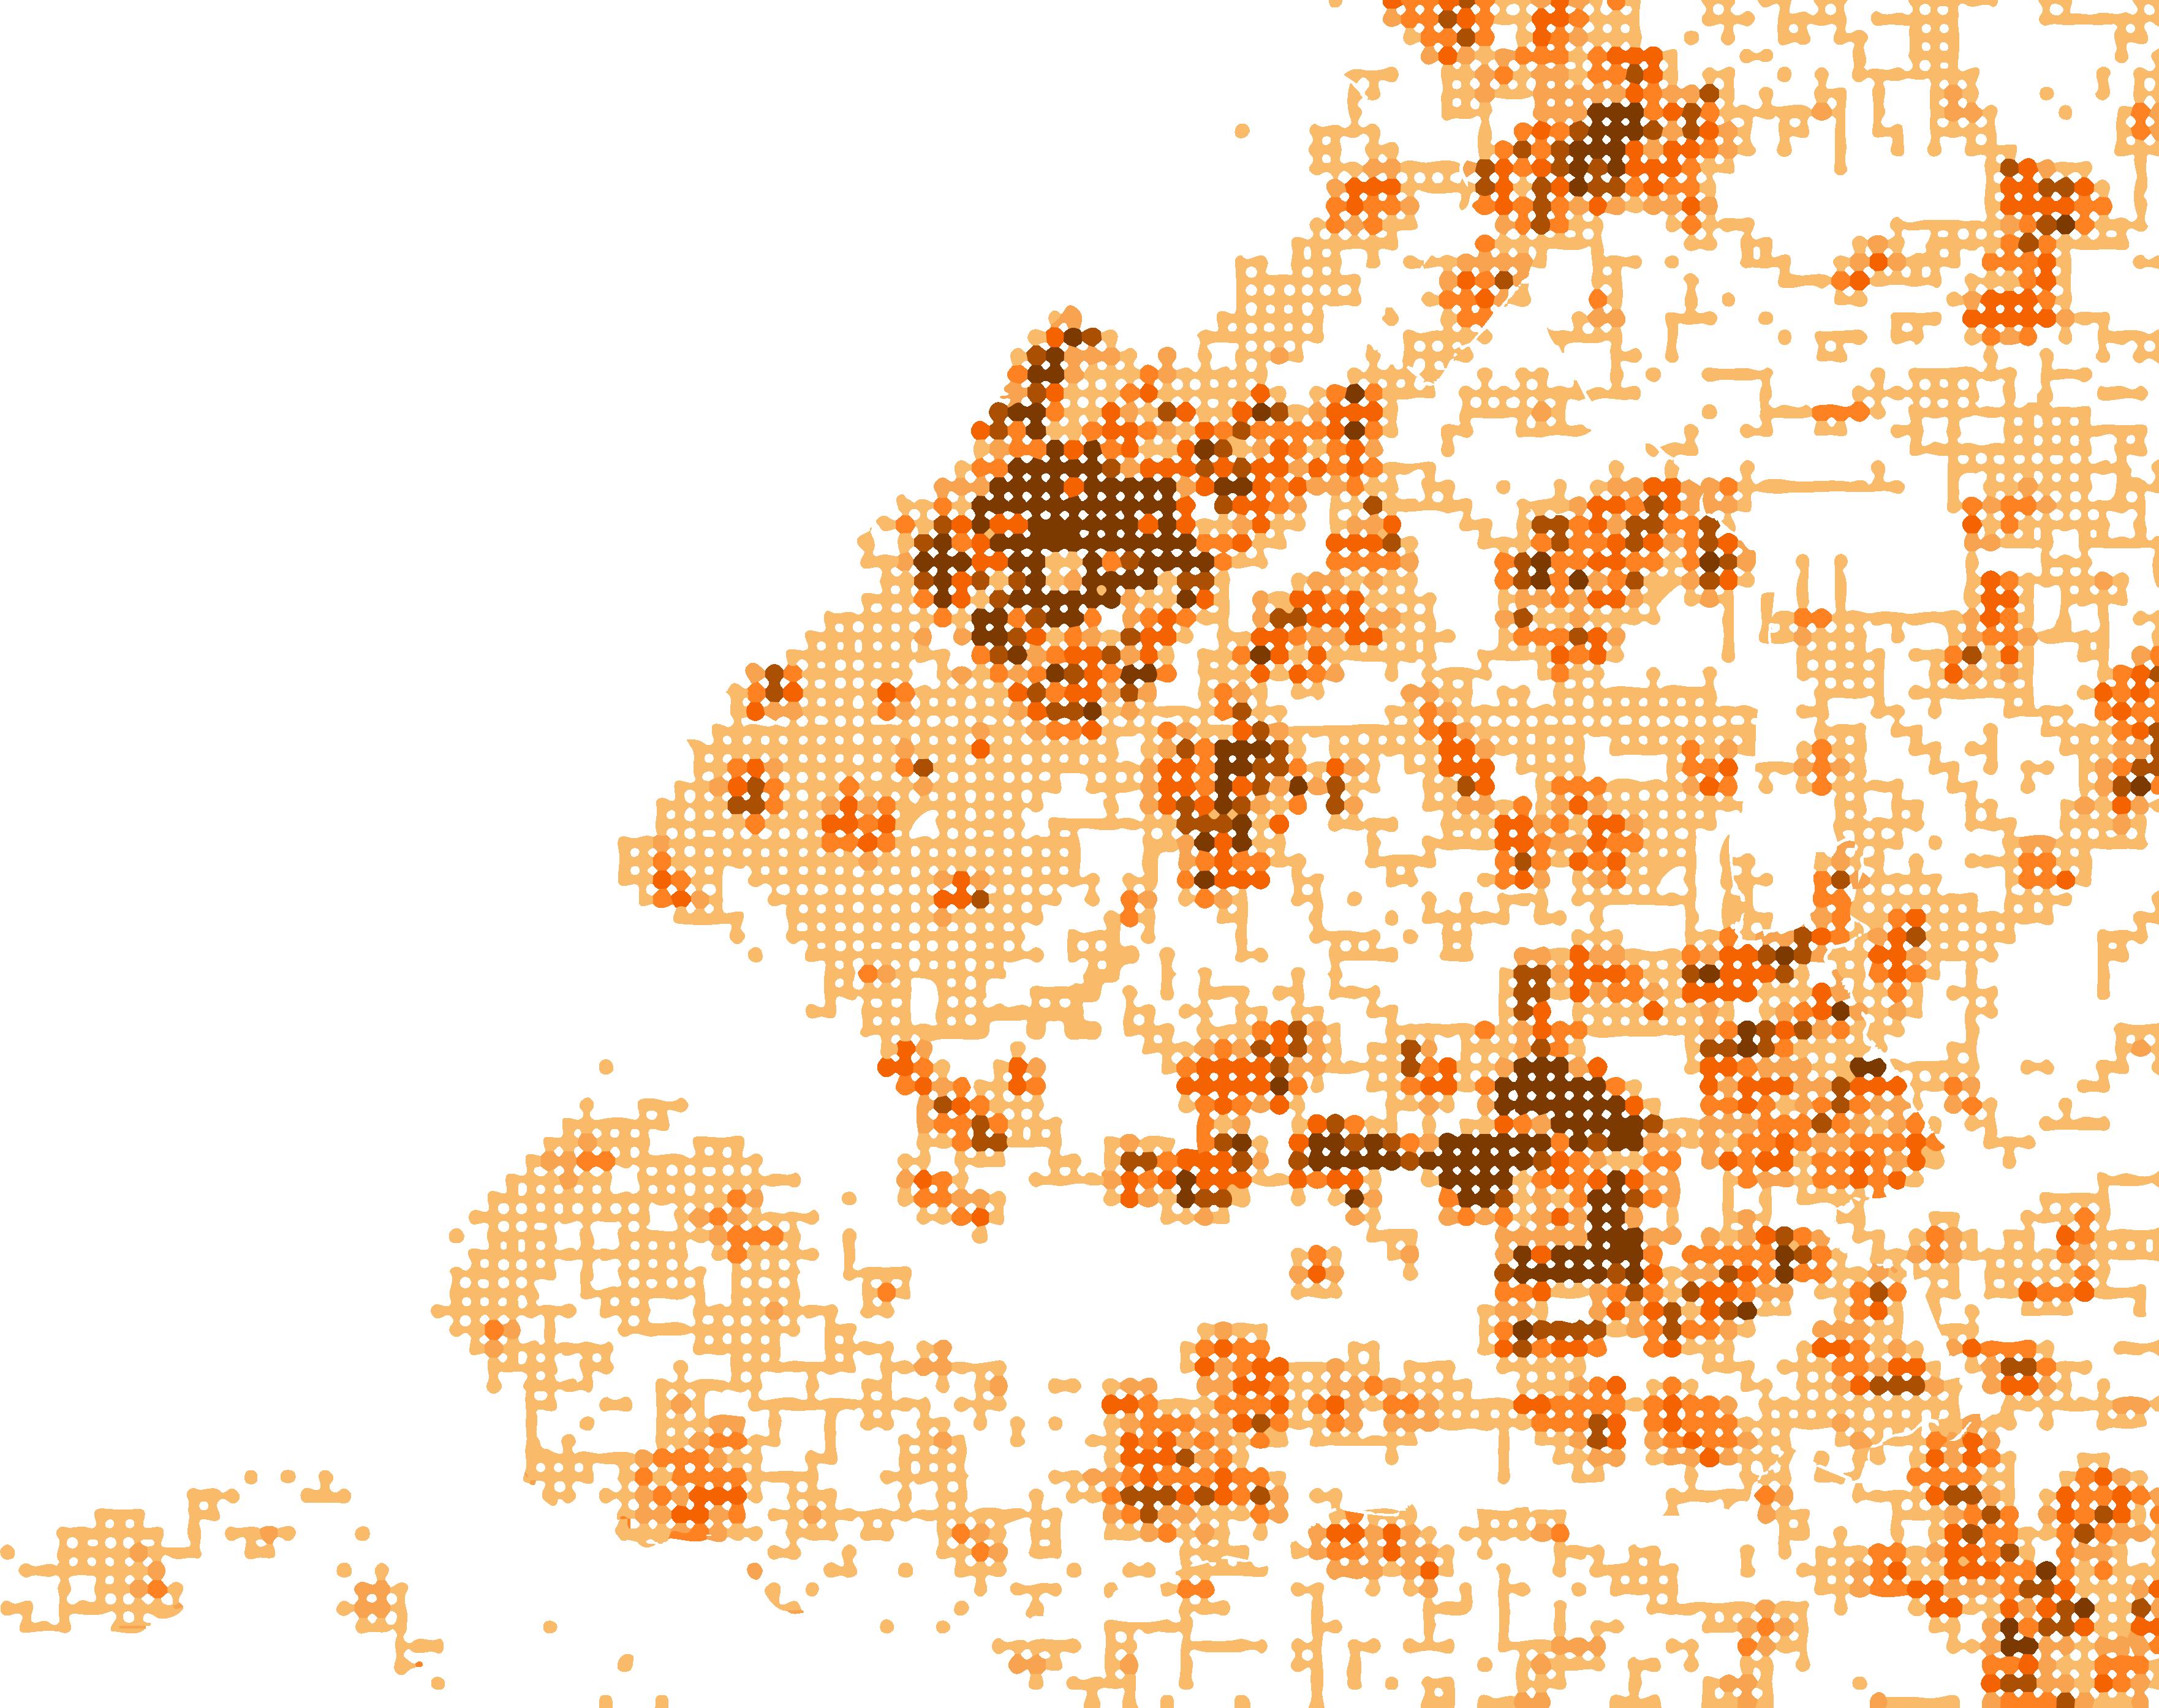
Below - Fig. 92 Location of retail locations in relation to population density. Source: Open Street Map, Atlas of the Region.
Westland Delft
Port of Rotterdam
Rotterdam
TO CIRCULARITY
Zoetermeer
Population Density & Points-of-Sale
This map presents the population density of Rotterdam (Nabielek et al., 2020). The location of stores has been superimposed over this data.
This comparison reveals a strong correlation between these factors. Multiple stores exist in close proximity in densely populated areas.
Notably, there are some ares with high population density and few supermarkets or other points-of sale. This might suggest retail locations are near centralised workplaces and public spaces rather than residences.
103
FOOD SALES POINTS IN MRDH
Dordrecht
Highest Density Lowest Density Small Retail Shops Supermarkets
Legend:
FUTURE
104
TO CIRCULARITY
WHAT IS THE SYSTEM OF THE FUTURE?

FUTURE?
105
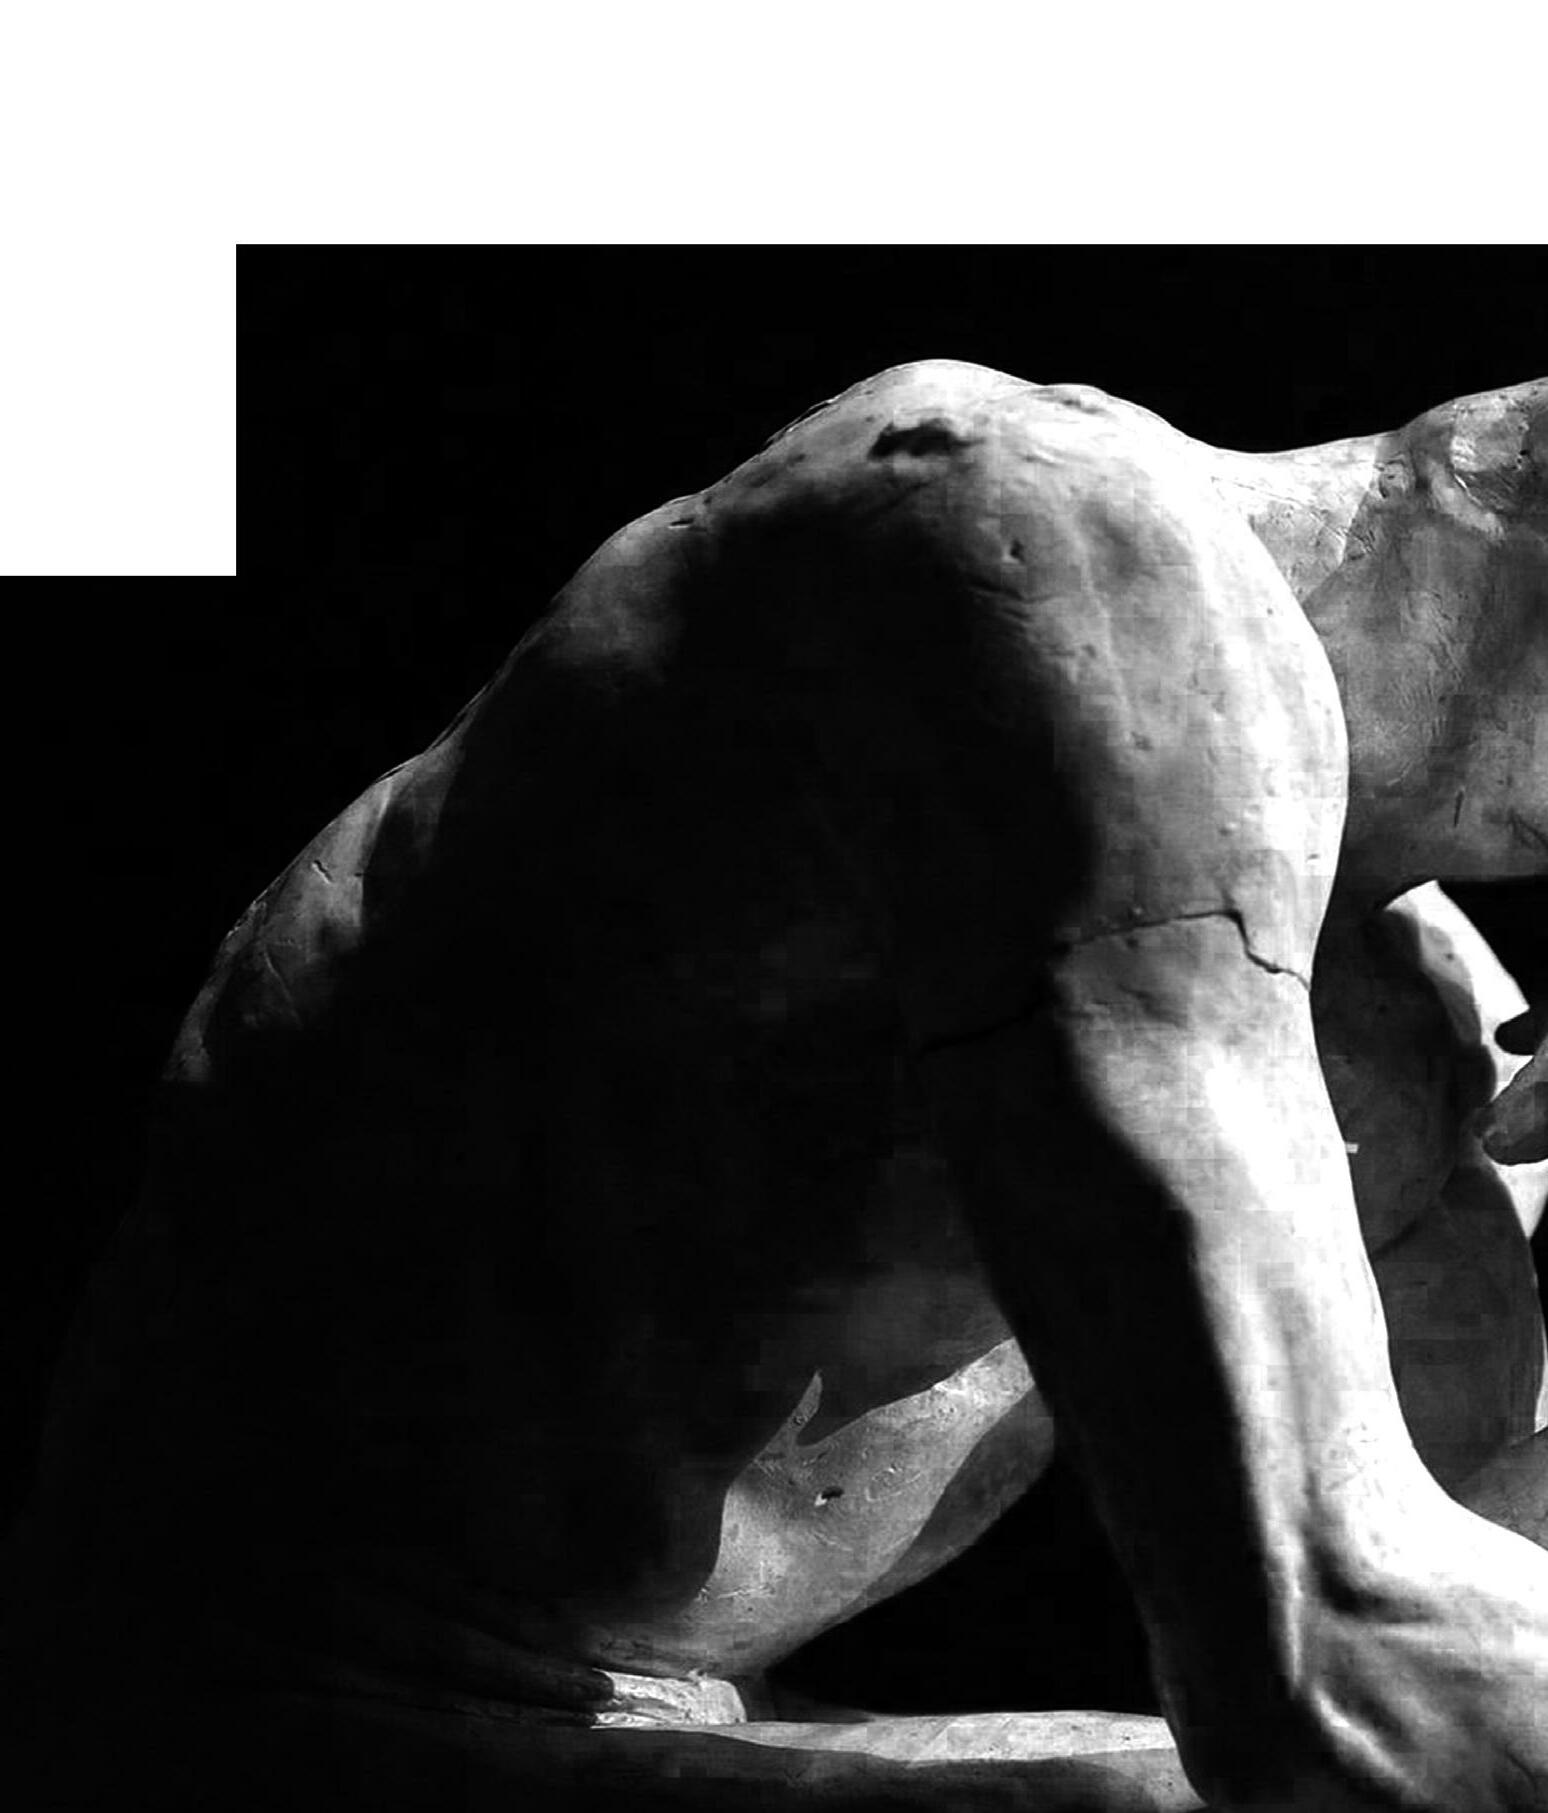
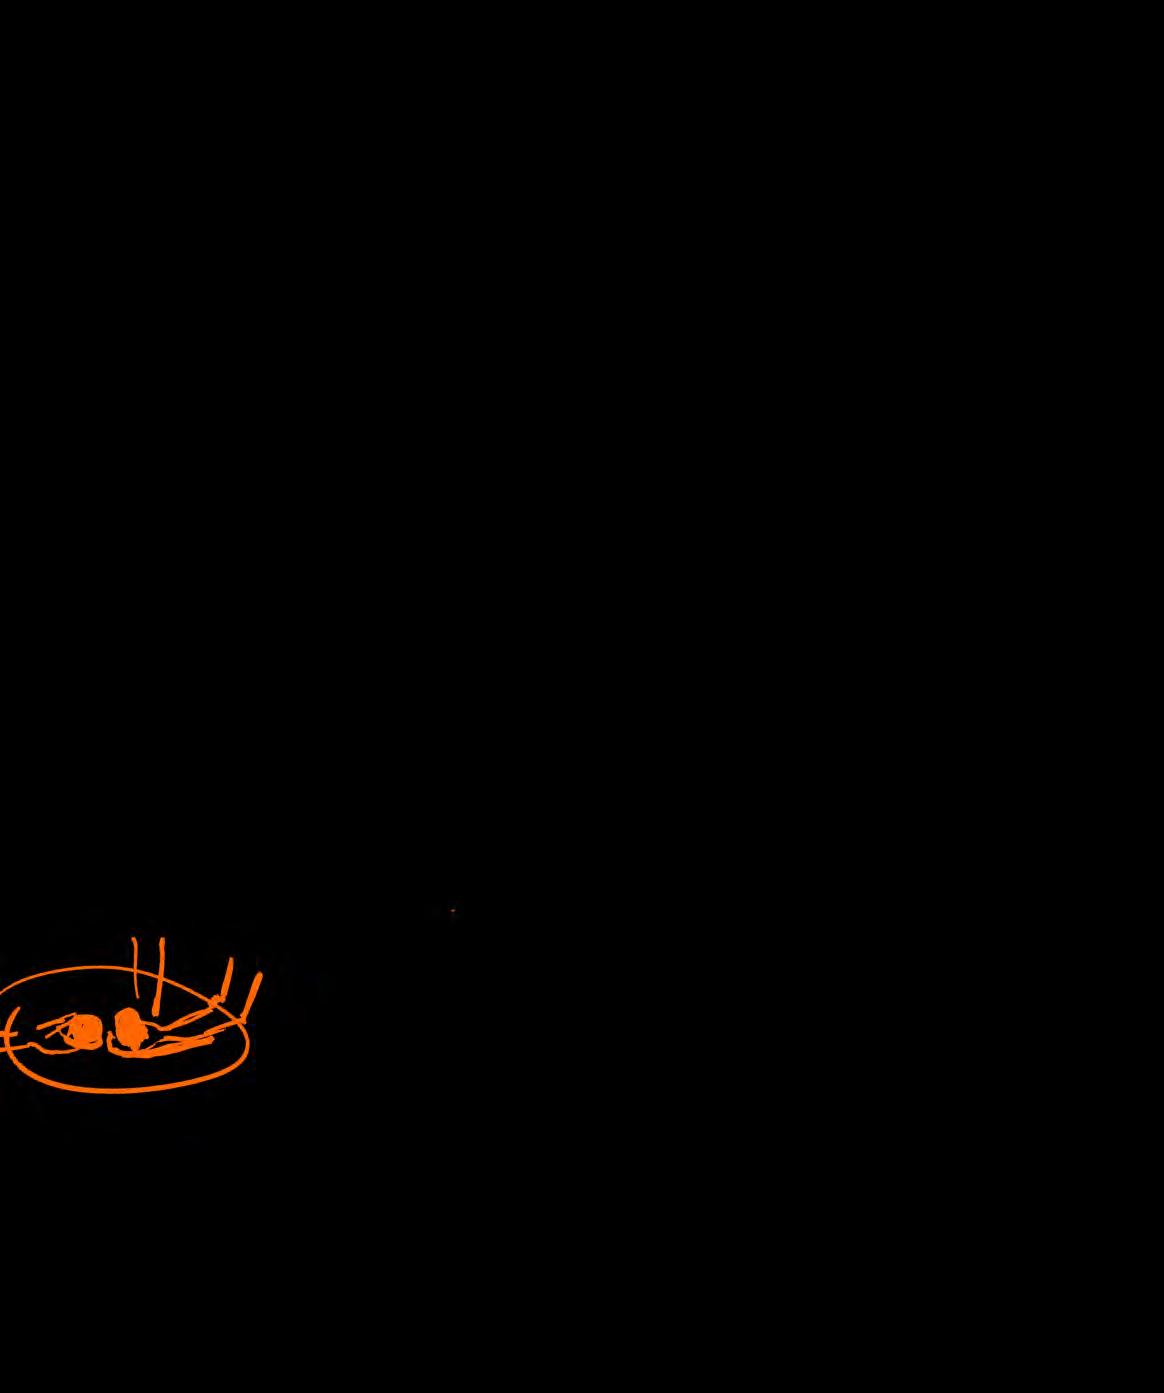
Left - Fig. 93
Sculptural representation of the “Thinker.”

106 TO CIRCULARITY
waste waste
waste
CO2 emissions waste
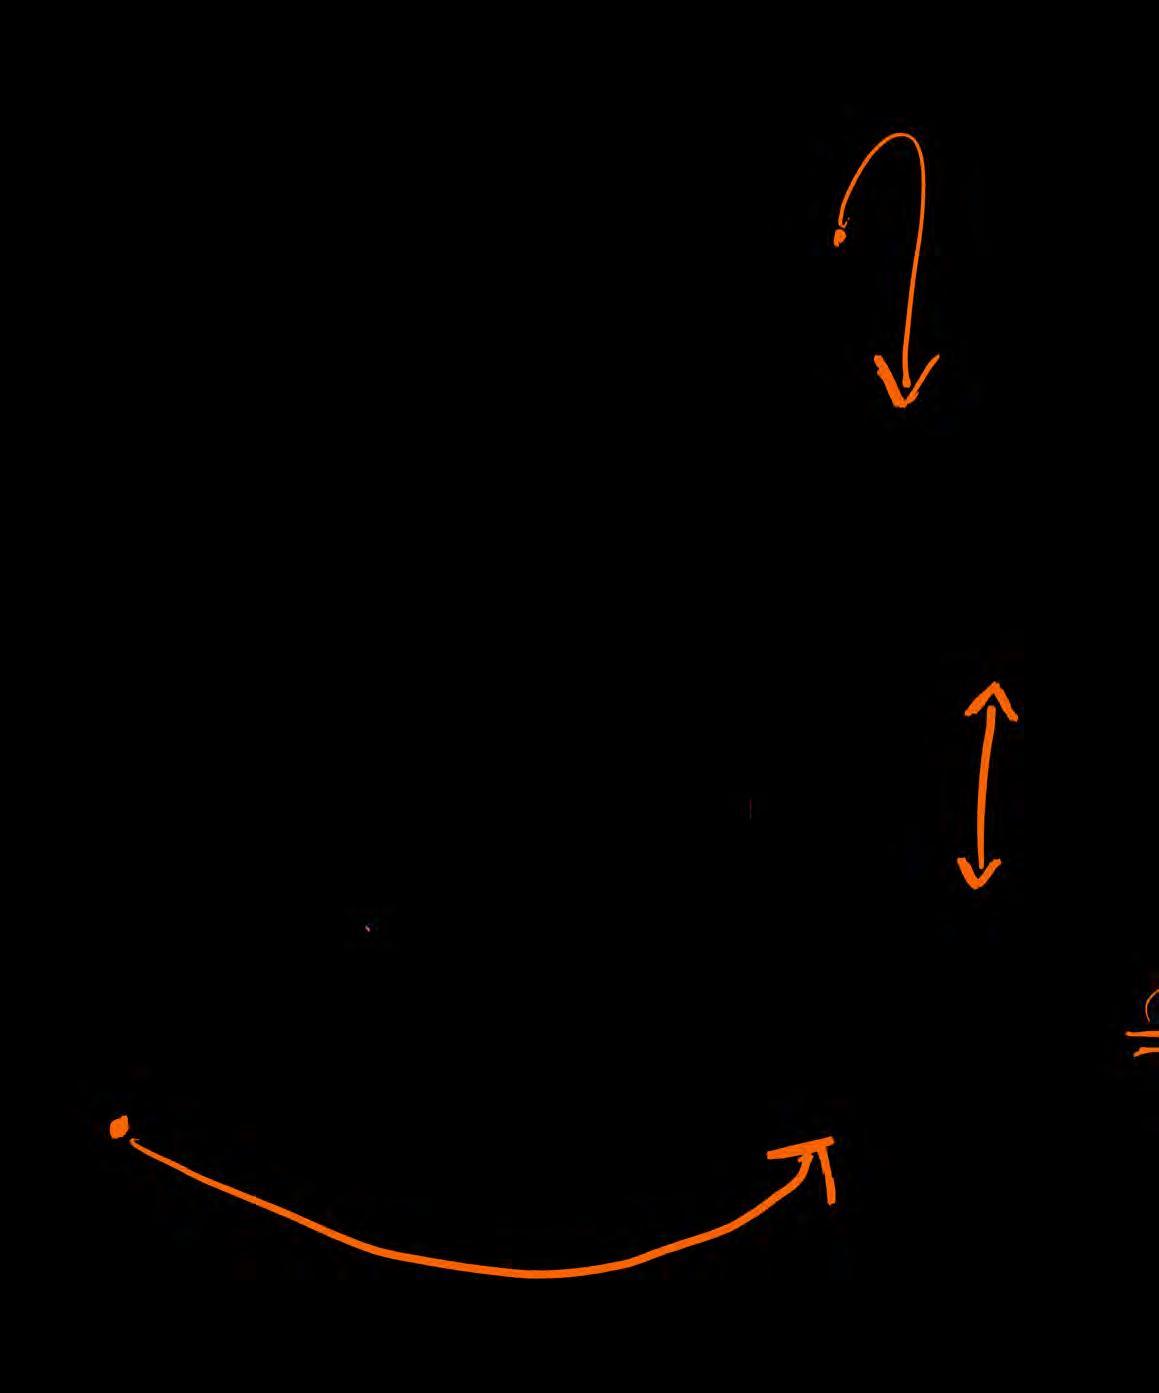
Above - Fig. 94

Cycle of inefficiencies in the Linear System (2.0).
Source: Circular Rotterdam Report.
107
INEFFICIENCIES OF A LINEAR SYSTEM
108 TO CIRCULARITY
shorter supply chains (decarbonization efforts)
Above - Fig. 95
Creating a closed and Circular System (3.0).
Source: Circular Rotterdam Report.
109
inter-relations between producers and consumer
BENEFITS OF A CIRCULAR SYSTEM
PETROCENTRISM
110
TO CIRCULARITY
PETROCENTRISM
111
THE PRESENT SITUATION MUST CHANGE
store, process

Creation of FOOD HUB strengthening global position of port as a Fresh Produce Hub
112
TO CIRCULARITY
Envisioning a Future: Public & Private Initiatives
The modern growth of the port is inextricably connected to petrocentrism and the role of Dutch industrial conglomerates in perpetuating this market.
As global policy and business leaders address a changing climate, the proportion of the port utilised for activities within this sector will decrease. The Port of Rotterdam has already begun to invest in the growth of other sectors and create a local innovation culture.
For agriculture specifically, a number of private and public initiatives have been introduced. These vary in their originality, but are each variations on the theme of increasing locality and access, as well as the cultivation of new innovations. These initiatives are a glimpse of a Food System 3.0 future as they bridge local production and distribution with global access and efficiencies.
Flagship projects include a modern “Food Hub” and earmarked areas around the port for future sector growth.
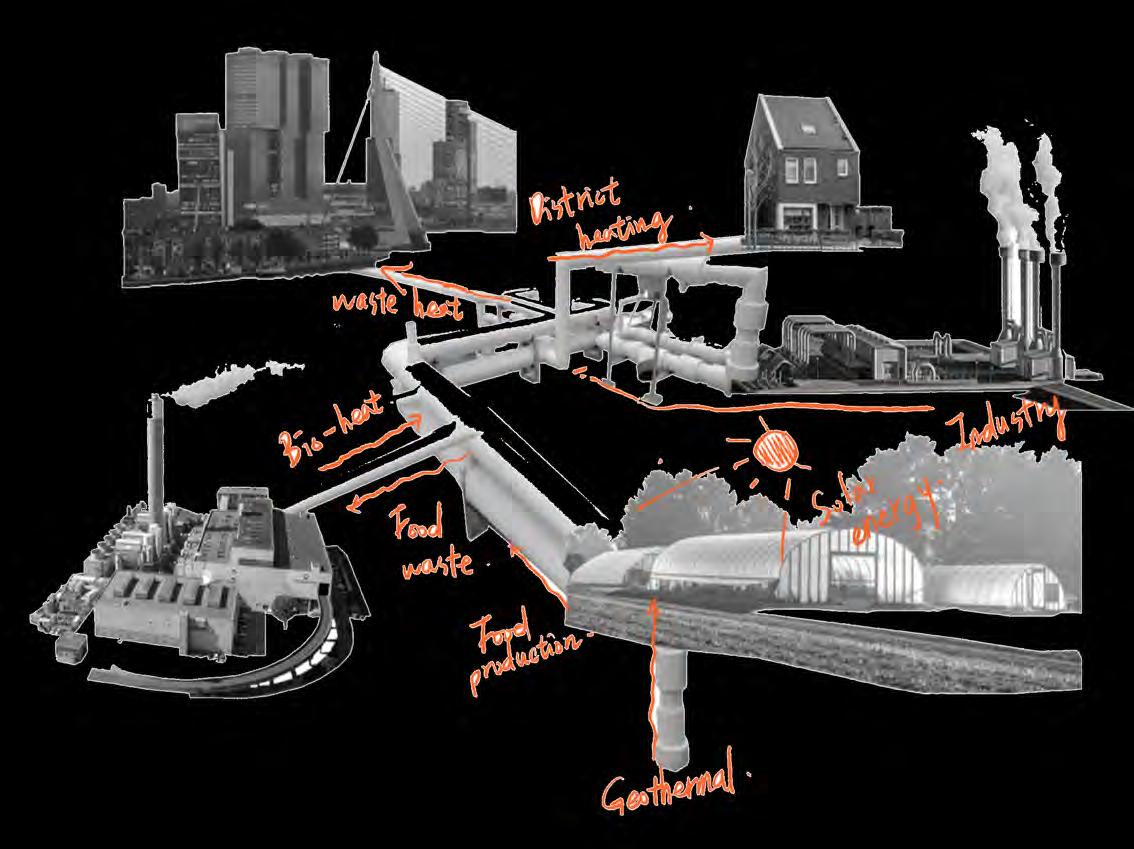
One key initiative are Greenports, an association of various relevant actors operating in food system throughout the metropolitan region of Rotterdam. Greenports envision a networking of the waste heat systems of industrial, agricultural, and urban areas to generate symbiotic and holistic benefits.
Key attributes of Food System 3.0 are its holistic approach to initiating circularity.
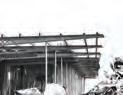
Previous - Fig. 96
Left - Fig. 97
Collage of upcoming “circular” projects in the port.
113
THE FUTURE REQUIRES
Representation of the petrochemical area of the port.
HOLISTIC ACTIONS
GREENPORT INITIATIVE
114
TO CIRCULARITY
Utilisation of industrial and agricultural waste heat in the metropolitan region
Right - Fig. 98 Collage of new initiatives transforming the Port. Source: Open Street Map, Atlas of the Region.
115 EXPANSION FRESH PORT central logistic hub strategically positioned at a large highway intersection PUBLIC & PRIVATE INITIATIVES
TO CIRCULARITY
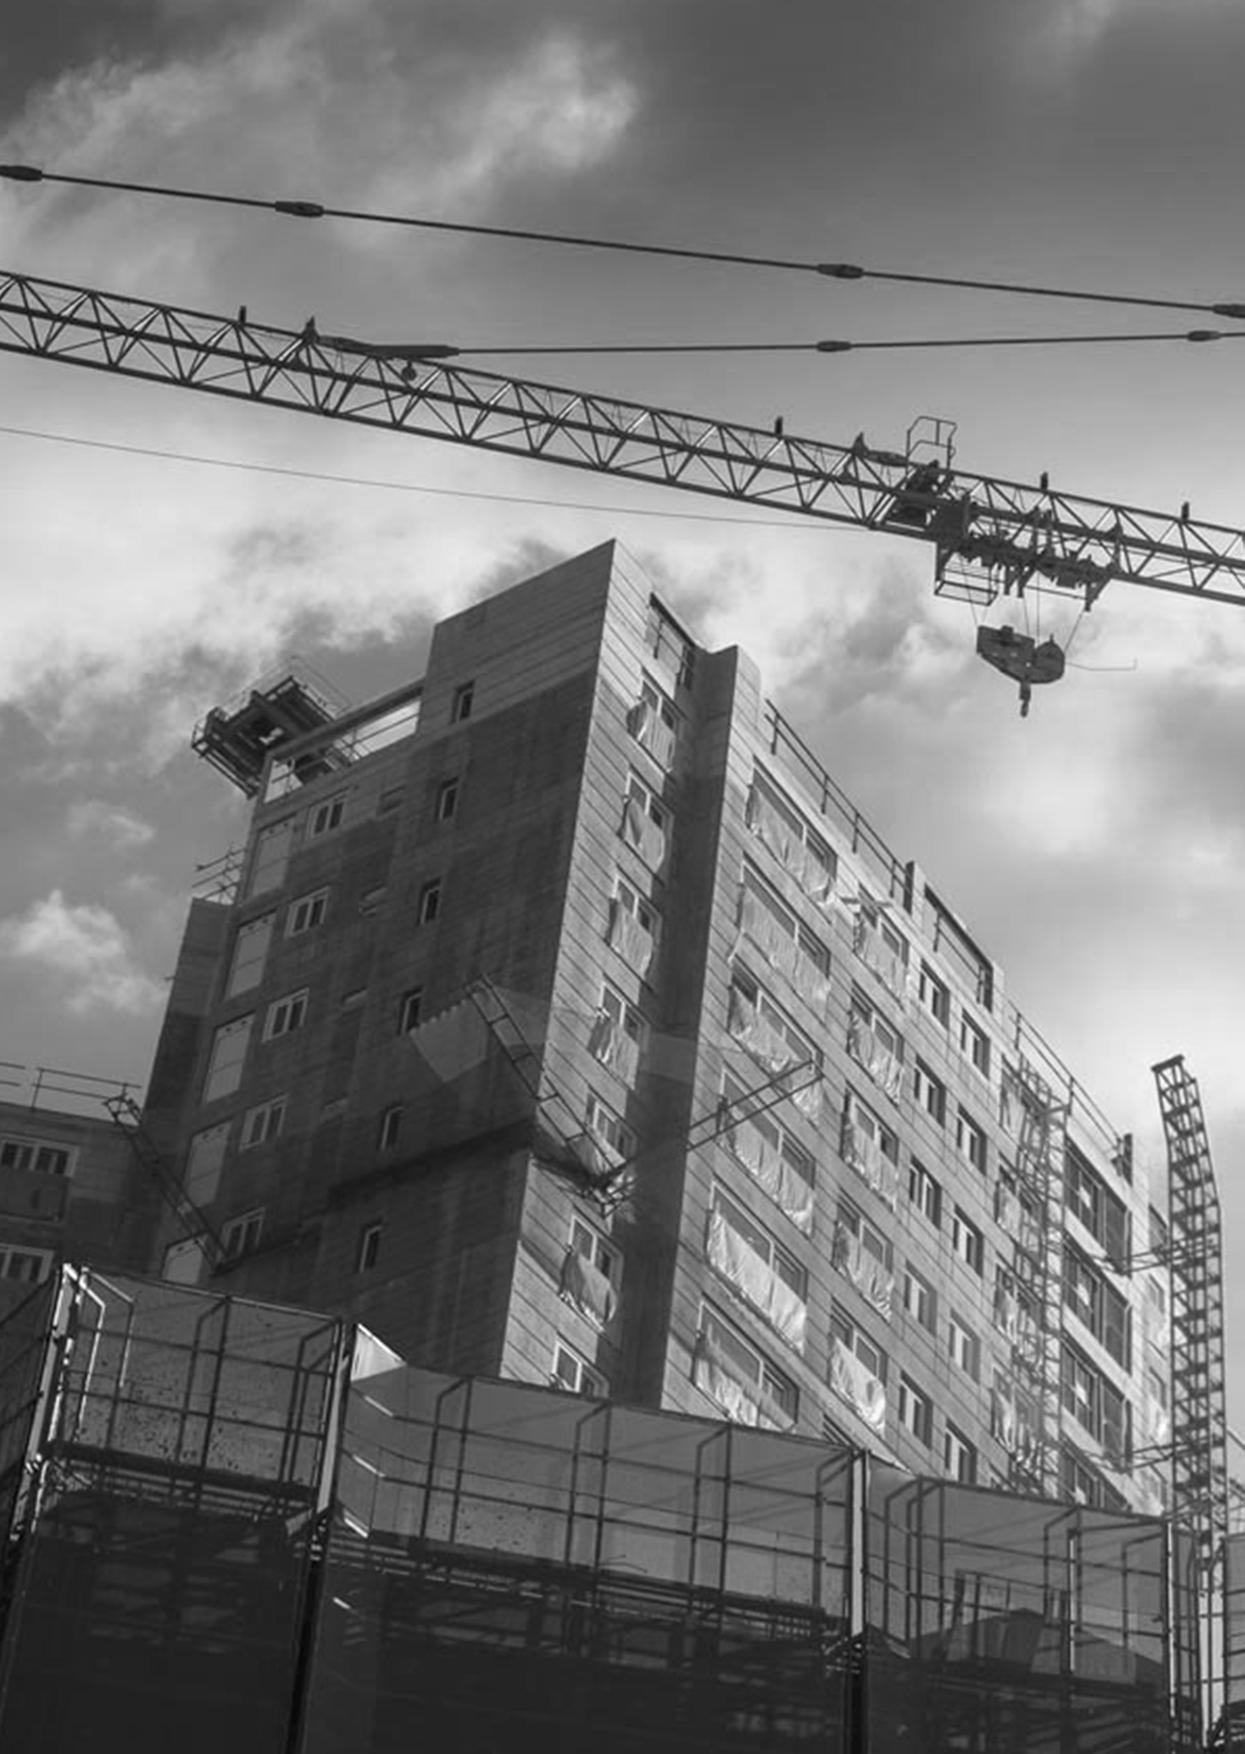
ACTION!
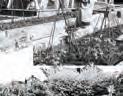
Left - Fig. 99
Collage of the construction of the future.
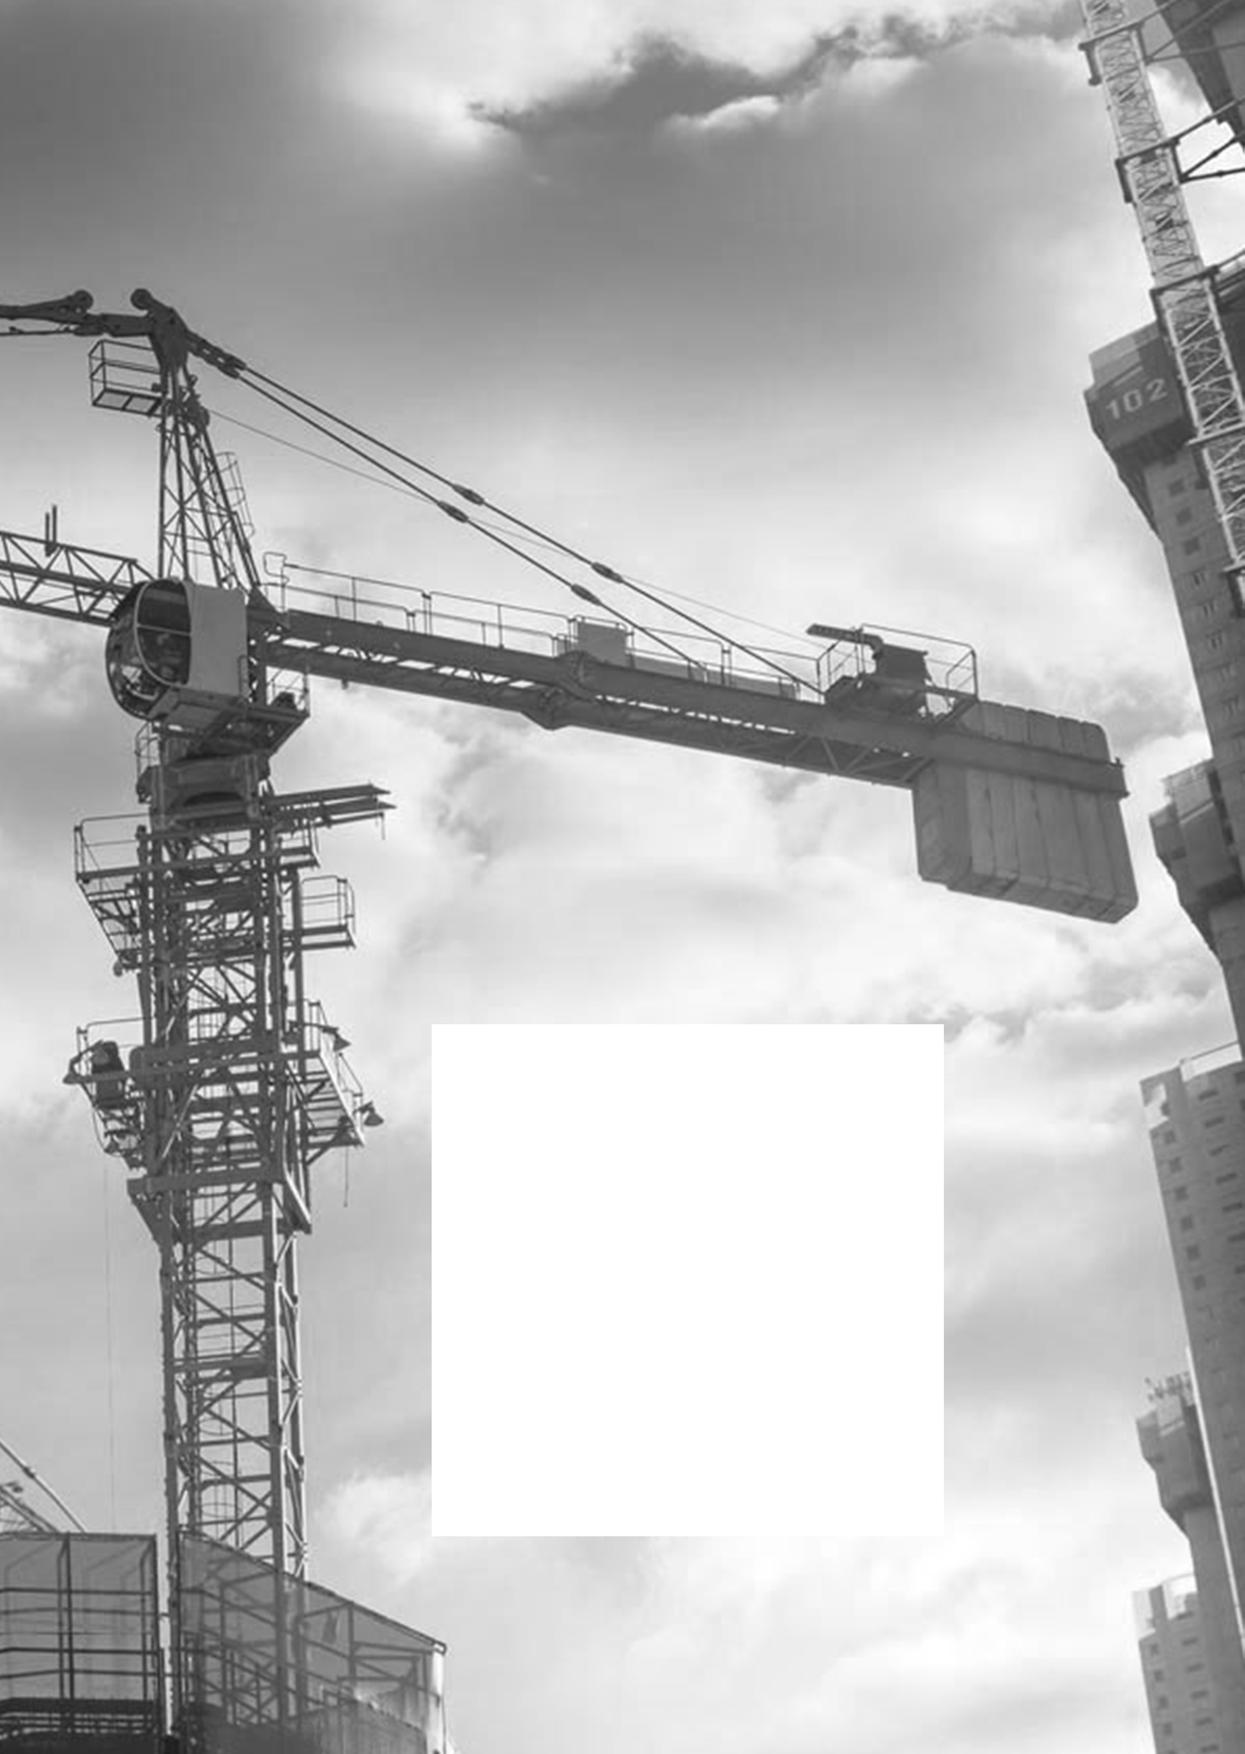
ACTION! CHANGE THROUGH ACTION IS IMPERATIVE
Below - Fig. 100
Location of Farm Shops around Rotterdam Source: Open Street Map, Atlas of the Region.
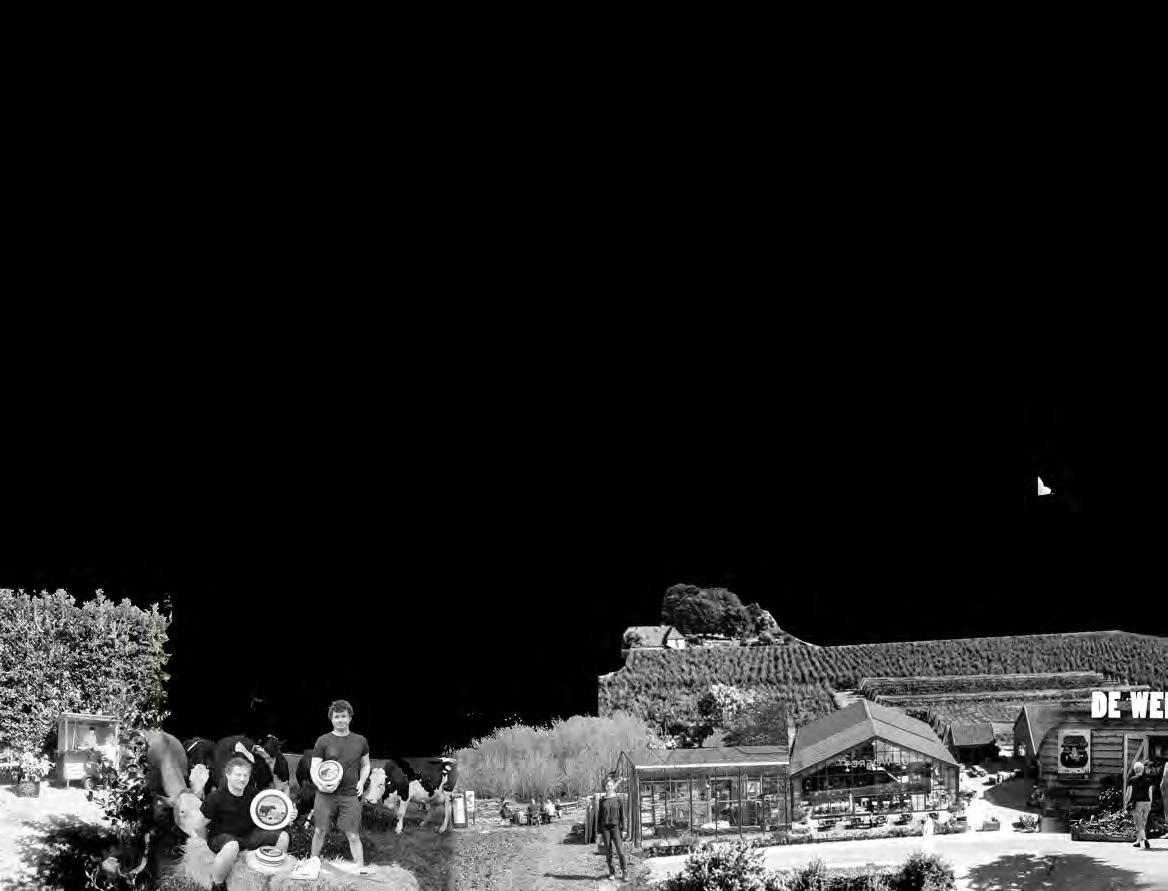
Far Below - Fig. 101
Collage of various farm shop initiatives in / around Rotterdam.
Westland
Port of Rotterdam
Delft
Rotterdam
118 TO CIRCULARITY
Farm Shops
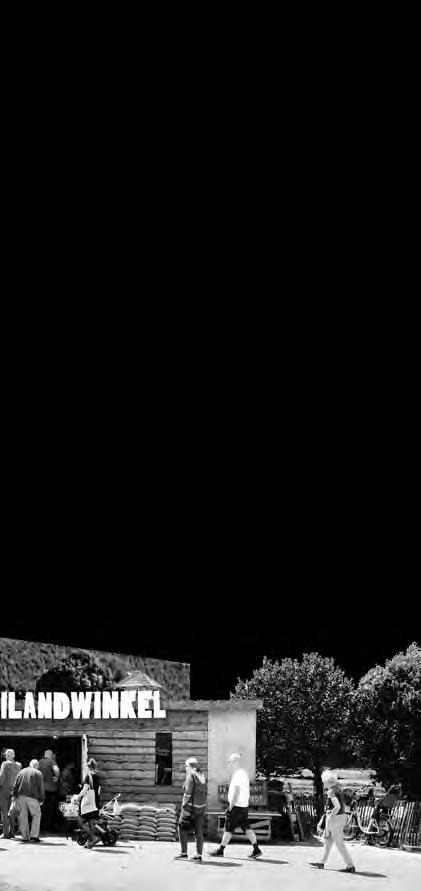
Multiple farms around the city of Rotterdam have set up shops, butcheries, and bakeries to market and sell their own produce.
This category also includes initiatives like Buytenhof and Hoeve Biesland, which are social care farms which manage apple and pear orchards, as well as beef cattle and pigs alongside on-site points of sale.
In some cases, small scale producers gather to set up collectively for sales. To promote these central locations, some websites market these farm shops as recreational spaces. Research shows most current farm shops are found near the Westland (Northeast of Rotterdam), about a fifteen minute drive from the city centre.
119
2.5 km dia. circle FOOD SYSTEM 3.0: SOLUTION #1
Farm Shops Industrial Areas Non-Industrial Areas
Legend:
Dordrecht
Zoetermeer
Below - Fig. 102
Location of Farmers Markets around Rotterdam Source: Open Street Map, Atlas of the Region.
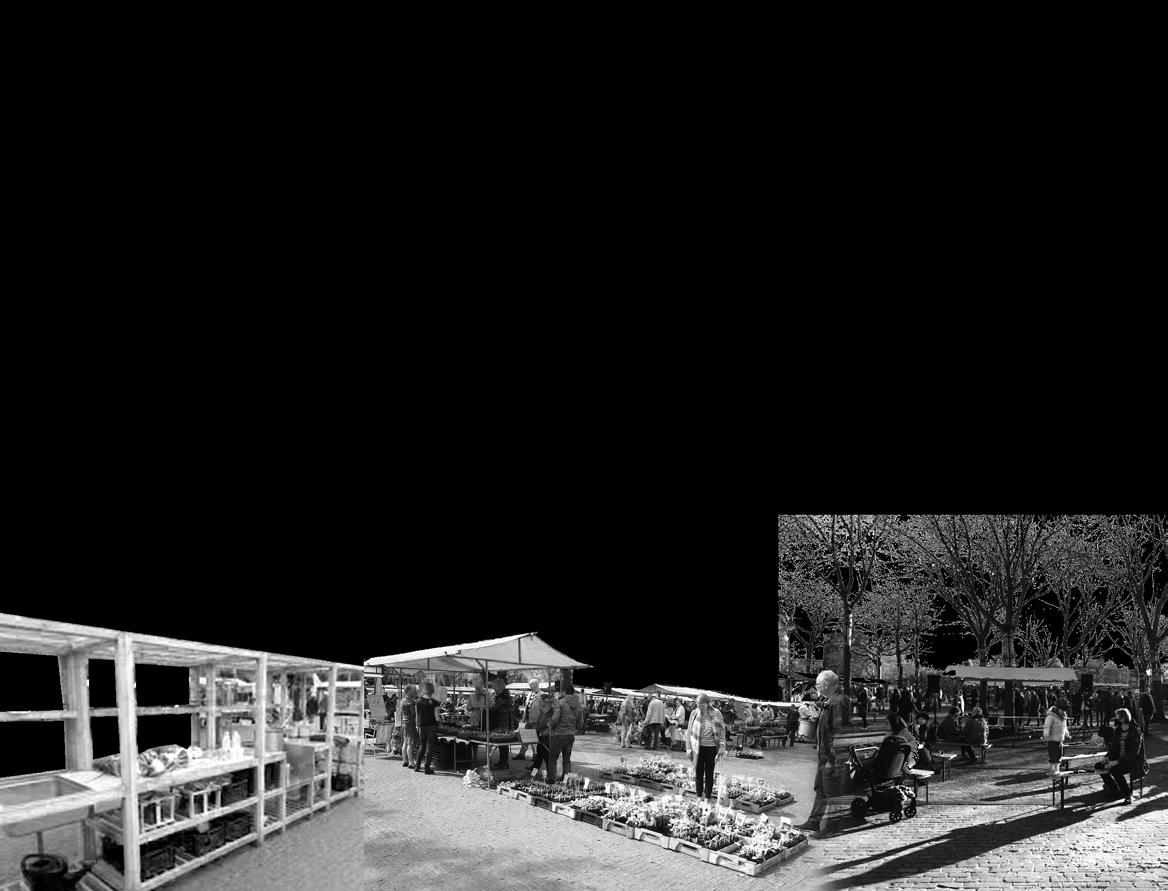
Far Below - Fig. 103
Collage of various farmers markets in / around Rotterdam.
Westland
Port of Rotterdam
Delft
Rotterdam
120 TO CIRCULARITY
Zoetermeer
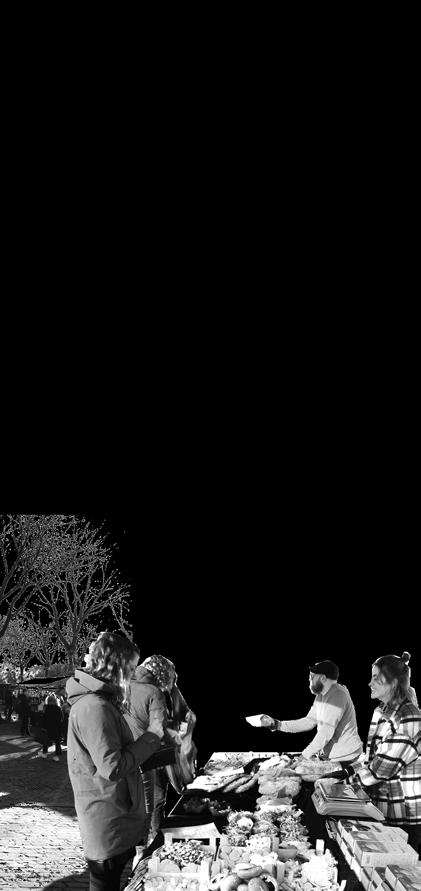
Farmers Markets
With increasing support for openair markets, the number of farmers markets in Rotterdam have been increasing. These farmers market act as a collective location for small scale farmers from nearby, urban, peri urban and rural areas.
Some of these begin as Festivals and cultural events. Rotterdamse Oogstmarkt started as a festival and later developed into a weekly market which involves farmers and traders selling local produce alongside street food locations and artists performances.
121
FOOD SYSTEM 3.0: SOLUTION #2
Farmers Markets Industrial Areas Non-Industrial Areas
Legend: Dordrecht
Below - Fig. 104
Location of joit retail / catering shops around Rotterdam. Source: Open Street Map, Atlas of the Region.
Far Below - Fig. 105
Collage of various retail / catering initiatives in / around Rotterdam.
Westland
Port of Rotterdam
Delft
Rotterdam
122 TO CIRCULARITY
Zoetermeer
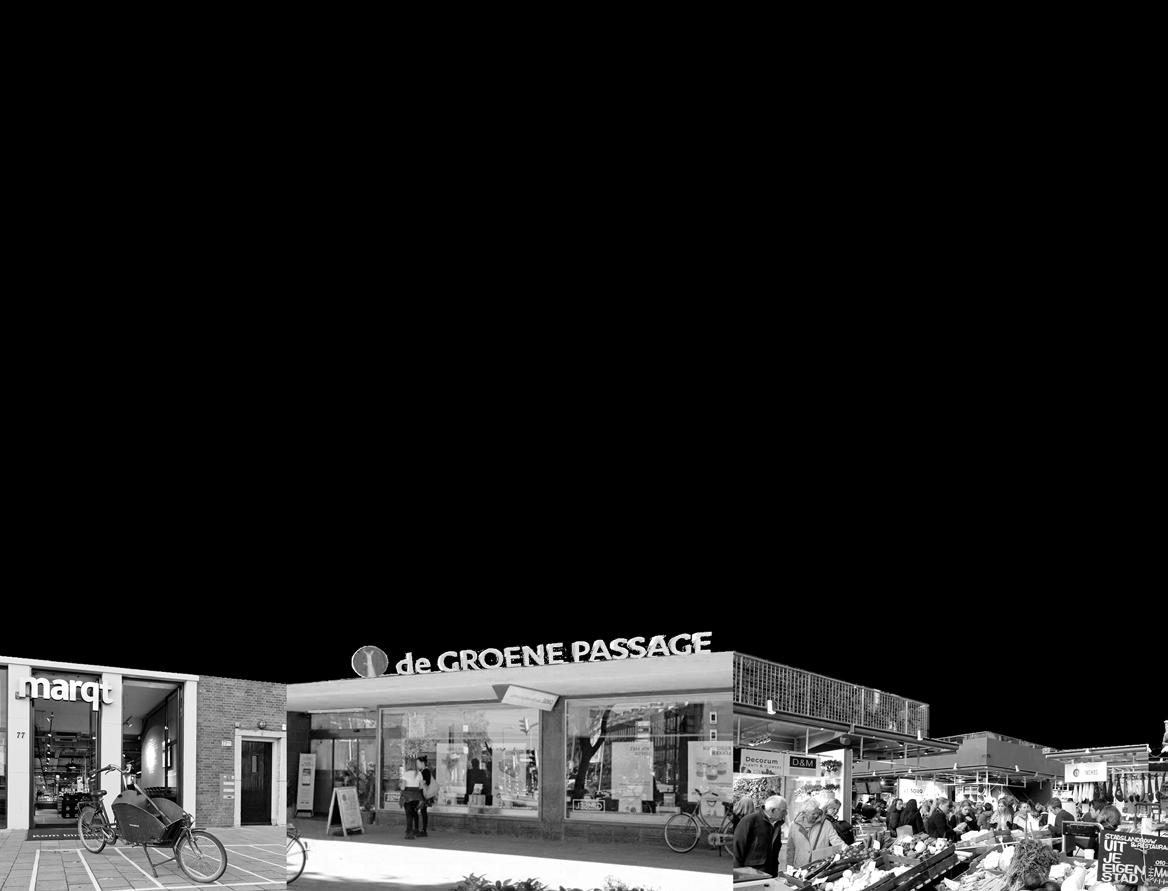
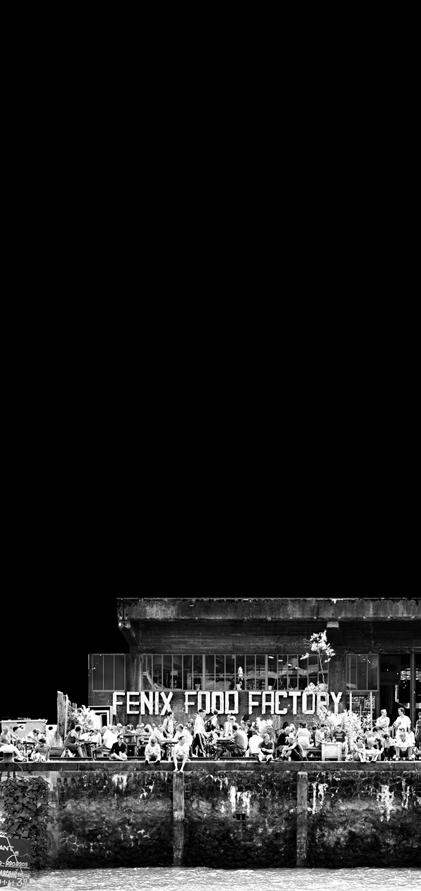
Retail & Catering
With the rise in demand for organic and locally grown food, many retail shops have opened to connect local producers with consumers.
One shop, Willem and Drees, acts as a seller of fresh produce sourced within 40km of Rotterdam. Leveraging e-commerce, they also work with online orders and delivery.
In addition to agri-products, some shops sell leftover animal products or locally brewed coffee. Others focus on wholesaling to caterers like cafes, restaurants, hotels, canteens, and institutions.
There are an increasing number of local cafes transparently advertising their short food supply chain as a distinct way for consumers to know the origins of their food.
A few, like the restaurant Vila Augustus, have their own production facilities on-premises to compliment their dishes.
Larger scale initiatives include Markthal and the Fenix Food Factory. These create a dynamic environment by blending food concepts with localorigin produce.
123
FOOD SYSTEM 3.0: SOLUTION #3 Health Food Stores
Catering
Green Grocers Industrial Areas Non-Industrial Areas
Legend:
Dordrecht
Below - Fig. 106
Location of urban farming initiatives in / around Rotterdam. Source: Open Street Map, Atlas of the Region. Mapping Urban Agriculture Potential in Rotterdam(2013).
Far Below - Fig. 107
Collage of various urban farming initiatives in / around Rotterdam.
Westland
Port of Rotterdam
Delft
Rotterdam
124 TO CIRCULARITY
Zoetermeer
Dordrecht
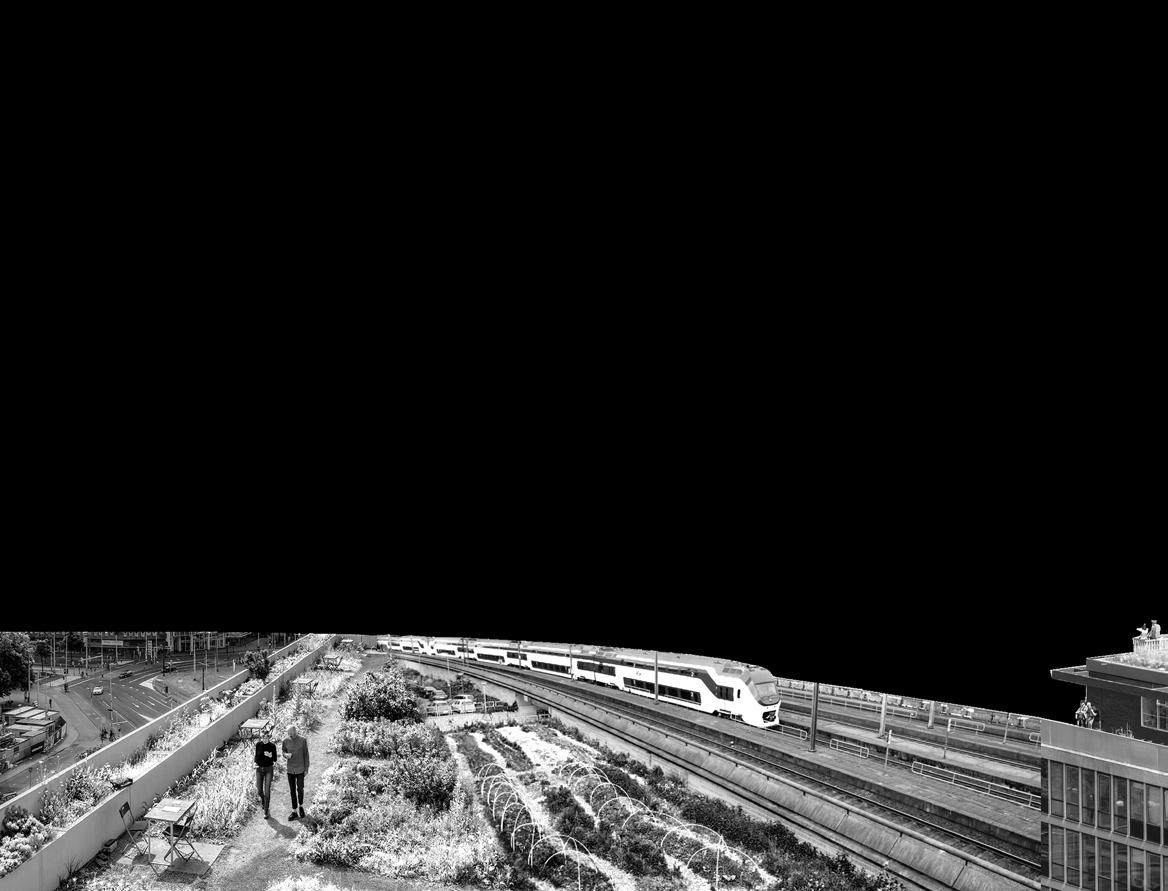
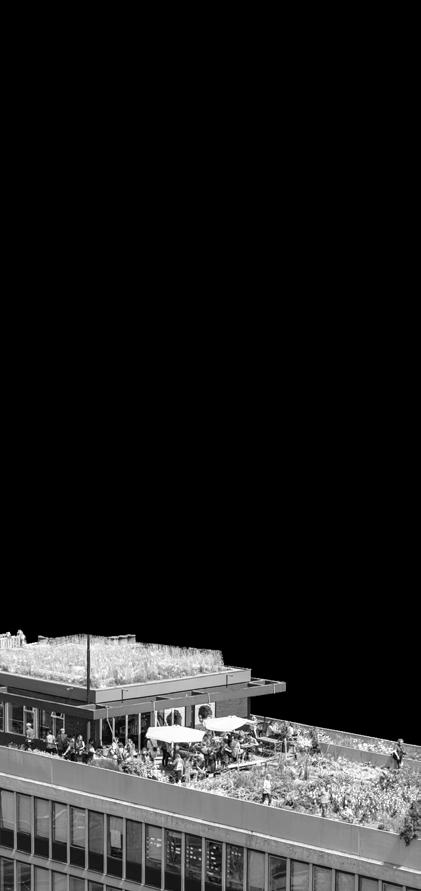
Urban Farming
With an increase in short food chain initiatives, a range of people (selforganised citizens to farmers) across different urban and peri-urban settings have been suggesting new ways for Rotterdam to interact with its food.
There are multiple initiatives for urban farming, from allotment and educational gardens to collective and commercialised farms. Educational gardens in particular combine their location near schools with learning by encouraging students to engage with food production.
In other areas of the city (e.g. Gandhi Tuin, Tui naan de maas, Berweg), self-organised citizen groups farm collectively. These combine a few professionals with expert knoweldge to train volunteers to facilitate urban farms.
The majority of initiatives are located in medium to heavily populated areas of the Rotterdam, making these sites accessible to the public.
Legend:
Educational Gardens
Allotment Gardens
Commercial Urban Farms
Collective Farms
Industrial Areas Non-Industrial Areas
125
FOOD SYSTEM 3.0: SOLUTION #4


126 Circular Food [ Reuse, Reduce, Recycle ] [ Socio-economic ] Production Distribution Points-ofSa le W/noitpmusnoCtsa e [ Shift to a local, plant-based, seasonal diet ] TO CIRCULARITY
of the different systems which contribute to a circular Food System
Above - Fig. 108 Diagram
3.0
Food System 3.0

Two key trends will be defining our future: small-scale and sustainable on the one hand; and ground-breaking technology on the other.”

 Hans Steenbergen, Co-Founder of Food Inspiration


To transition from a linear to circular food system, change is required at every stage of production, processing, consumption, and waste management. While each of these component systems are distinct in Food System 2.0 and align consecutively, to attain circularity each must transform into self-sustaining cycles related to the whole. In this way, circular practices are embedded along each phase of the food system. The assemblage of each of these systems contribute to the modernised whole.
By reducing initial materials, collecting and reincorporating waste, and utilising embedded resources to spur each next step, Food System 3.0 will mark a transition from current industrial processes.
As a petrocentric port, Food System 3.0 offers Rotterdam an opportunity to plan for future industrial transformation and invest in the nascent technologies and logistics which will undergird the cities of tomorrow.
127 [ Energy ]
“
Our food system has to change; we need to take a new course.
FOOD SYSTEM 3.0 IS THE FUTURE
References
Ahn. (2020, March 24). Ahn Viewer. AHN. Retrieved October 3, 2022, from https://www.ahn.nl/ahn-viewer. A history of the port of rotterdam. Twente Express. (2016, September 30). Retrieved October 3, 2022, from http://t wente.co.uk/a-history-of-the-port-of-rotterdam/
Atlas van de verstedelijking in Nederland: 1000 jaar ruimtelijke ontiwikkeling Rutte, R., Abrahamse, J. E., Hamers, D., IJsselstijn, M., Mil, Y. van, Diesfeldt, O. R., Kosian, M., Pané, I., & Waaijer, A. de. (2014).
Atlas van de verstedelijking in Nederland: 1000 jaar ruimtelijke ontwikkeling. Uitgeverij THOTH.
Cargo throughput rotterdam. (n.d.). Retrieved October 3, 2 022, from https://www.portofrotterdam.com/sites/ default/files/2022-06/facts-and-figures-port-ofrotterdam.pdf
Cbs. (2021, February 9). How do we use our land? CBS. Retrieved October 3, 2022, from https://longreads.cbs. nl/the-netherlands-in-numbers-2020/how-do-we-useour-land/
City Region Food Systems. (2014). Ruaf Foundation. https:// ruaf.org/assets/2019/11/Urban-Agriculture-Magazineno.-29-City-Region-Food-Systems.pdf
Contact. (z.d.). Villa Augustus Dordrecht. Geraadpleegd op 3 oktober 2022, van https://www.villa-augustus.nl/contact/ Country Shops. (z.d.). Landwinkel. https://landwinkel.nl/ vestiging-zoeker
Ctfassets.net website traffic, ranking, analytics [August 2022]. Semrush. (n.d.). Retrieved October 3, 2022, from https:// www.semrush.com/website/ctfassets.net/overview/
128
De Buytenhof. (2022, 20 juli). Over de Buytenhof. Geraadpleegd op 3 oktober 2022, van https:// debuytenhof.nl/voor-bezoekers/over-de-buytenhof/ De Nederlandse Agrarische Sector Internationaal 2021. (n.d.). Retrieved October 3, 2022, from https:// download.cbs.nl/overige/de-nederlandseagrarische-sector-internationaal-2021.pdf
der, H. W. van. (2021). Reuzenarbeid de Bouw van het Moderne Nederland in Beeld 1861-1918. nai010 u itgevers.
DNFCS 2012-2016, 1-79 Years. RIVM. (n.d.). Retrieved October 3, 2022, from https://www.rivm.nl/en/ dutch-national-food-consumption-survey/ publications/dnfcs-2012-2016
ExpatINFO Holland. (2021, September 15). Top 10 supermarket chains in Netherlands. ExpatINFO Holland. Retrieved October 3, 2022, from https:// expatinfoholland.nl/help-guides/shoppingfoods/10-largest-supermarket-chains-in-n etherlands/
Energieakkoord Greenport West-Holland. Greenport. (2021, October 7). Retrieved October 3, 2022, from https://greenportwestholland.nl/energieakkoord/
Facts and figures. Port of Rotterdam. (n.d.). Retrieved October 3, 2022, from https://www.portofrotterdam. com/en/experience-online/facts-and-figures
FNLI. (n.d.). Retrieved October 3, 2022, from https://www. fnli.nl/wp-content/uploads/2021/12/2021-I nfographic-Dutch-Food-and-Drink-Industry-1.pdf
129
REFERENCES
Gelder, K. van. (2022, May 9). Netherlands: Number of Food Manufacturing Companies 2022. Statista. Retrieved October 3, 2022, from https://www statista.com/statistics/728824/number-ofcompanies-in-the-food-manufacturing-industry-inthe-netherlands-by-sector/ Glimsel natural food. (z.d.). Degroenepassage. http:// degroenepassage.nl/
Handbook on the external costs of Transport - CE Delft. (n.d.). Retrieved October 3, 2022, from https://cedelft.eu/wpcontent/uploads/sites/2/2021/03/CE_Delft_4K83_ Handbook_on_the_external_costs_of_transport_Final.pdf
History of the Netherlands. The Hague International Centre. (n.d.). Retrieved October 3, 2022, from https://www. thehagueinternationalcentre.nl/why-the-hague-region/ the-netherlands-in-a-nutshell/history-of-the-netherlands
Home. Stadsarchief Rotterdam. (2022, October 3). Retrieved October 3, 2022, from https://stadsarchief.rotterdam.nl/ Home. USDA Foreign Agricultural Service. (2022, September 29). Retrieved October 3, 2022, from https://apps.fas. usda.gov/ Jukema, ing. G. D. (G. (2022, May 23). Dutch export of agricultural products exceeds € 90 billion in 2018. WUR. Retrieved October 3, 2022, from https://www.wur.nl/en/newsarticle/ dutch-export-of-agricultural-products-exceeds-90-billionin-2018.htm
Jennings, S., Cottee, J., Curtis, T., & Miller, S. (2015). (rep.). Food in an urbanised world. The role of city region food systems in resilience and sustainable development.
Kaarten. Atlas van de Regio | PBL Planbureau voor de Leefomgeving. (n.d.). Retrieved October 3, 2022, from https://themasites.pbl.nl/atlas-regio/kaarten/index.php
130
Labour market information: Netherlands. EURES. (n.d.). Retrieved October 3, 2022, from https://ec.europa.eu/ eures/public/living-and-working/labour-marketinformation/labour-market-information-netherlands_en Leenaers, H. (2017). De Bosatlas van de Veiligheid. Noordhoff Uitgevers B.V.
Let HIDC help you set up an efficient supply chain to Europe. NDL. (2022, July 29). Retrieved October 3, 2022, from https://hollandinternationaldistributioncouncil.com/en/
Long live the king!: About NS: NS. Dutch Railways. (n.d.). Retrieved October 3, 2022, from https://www.ns.nl/en/ about-ns/who-are-we/history/long-live-the-king.html
Maastricht Aachen Airport: Active in Rotterdam port |. Rotterdam Transport. (2019, October 14). Retrieved October 3, 2022, from https://rotterdamtransport.com/company/ maastricht-aachen-airport/
Mapping Urban Agriculture Potential in Rotterdam Report. (2013). cms.4bg.nl. https://cms.4bg.nl/uploads/12/ files/2013_Mapping-Urban-Agriculture-Potential-inRotterdam_Report-Dumitrescu.pdf
Maps Port of Rotterdam active in Rotterdam port|. Rotterdam Transport. (2021, June 7). Retrieved October 3, 2022, from https://rotterdamtransport.com/maps-port-ofrotterdam/van der Meer, W. (1970, January 1).
Ministerie van Algemene Zaken. (2022, January 18). Corporate income tax. Taxation and businesses | Government.nl. Retrieved October 3, 2022, from https://www government.nl/topics/taxation-and-businesses/ corporation-tax
131
REFERENCES
Ministerie van Algemene Zaken. (2019, December 18). Additional track for the Betuwe route between Zevenaar and Oberhausen. Freight transport | Government.nl. Retrieved October 3, 2022, from https://www.government. nl/topics/freight-transportation/freight-transport-by-rail/ additional-track-betuwe-line
Ministerie Van Voedsel. Ministry of Food. (n.d.). Retrieved October 3, 2022, from http://ministerievanvoedsel.org/
Ministerie van Algemene Zaken. (2013, July 12). The Netherlands: EU member state. European Union | Government.nl. Retrieved October 3, 2022, from https://www government.nl/topics/european-union/the-netherlandseu-member-statenatuur, L. N. P. en. (2017, February 2). Protected zones and points of entry. NVWA. Retrieved October 3, 2022, from https://english.nvwa.nl/topics/ import-regulations-of-the-netherlands-on-plant-health/ protected-zones-and-points-of-entry
Netherlands - employment in agriculture (% of total employment)2022 data 2023 forecast 1969-2020 historical. Netherlands - Employment In Agriculture (% Of Total Employment) - 2022 Data 2023 Forecast 19692020 Historical. (n.d.). Retrieved October 3, 2022, from https://tradingeconomics.com/netherlandsemploymentin-agriculture-percent-of-total-employment-wb-data. html
Netherlands country profile. (n.d.). Retrieved October 3, 2022, from https://www.foodexport.org/export-insights/ market-and-country-profiles/netherlands-country-profile
Over de Atlas. (z.d.). Atlas van de Regio | PBL Planbureau voor de Leefomgeving. Geraadpleegd op 3 oktober 2022, van https://themasites.pbl.nl/atlas-regio/over-de-atlas/
PDOK viewer. (n.d.). Retrieved October 3, 2022, from https:// app.pdok.nl/viewer/
132
Portvision Rotterdam. (n.d.). Retrieved October 3, 2022, from https://www.portofrotterdam.com/sites/default/ files/2021-06/port%20vision.pdf
Projecten. Greenport. (2022, September 30). Retrieved October 3, 2022, from https://greenportwestholland.nl/projecten/ Recycling & Waste Management in the Netherlands. Rintoul, J. (2022, July 27). Farming for the future: Why the netherlands is the second largest food exporter in the world. DutchReview. Retrieved October 3, 2022, from https://dutchreview.com/culture/innovation/secondlargest-agriculture-exporter/ Rotterdam Food Hub. Port of Rotterdam. (n.d.). Retrieved October 3, 2022, from https://www.portofrotterdam. com/de/niederlassung/niederlassungsmoeglichkeiten/ rotterdam-food-hub
Rotterdamse oogst Market. (z.d.). Rotterdamse oogst. http:// www.rotterdamseoogst.nl/home. Set up your european agro & food supply chain with professional Dutch LSP’s NDL. (2022, August 9). Retrieved October 3, 2022, from https://hollandinternationaldistributioncouncil.com/en/ sectors/agro-food/ Singh, S. (2022, June 14). 8 major ports of the Netherlands. Marine Insight. Retrieved October 3, 2022, from https:// www.marineinsight.com/know-more/ports-of-thenetherlands/ Singh, S. (2022, June 14). 8 major ports of the Netherlands. Marine Insight. Retrieved October 3, 2022, from https:// www.marineinsight.com/know-more/ports-of-thenetherlands/Smart logistics. NFIA. (2021, August 18). Retrieved October 3, 2022, from https://investinholland. com/doing-business-here/business-operations/smartlogistics/
133
REFERENCES
Soetens, A. (n.d.). A history of rotterdam - from fishing village to metropolis. Rotterdam Style - This is how we do it ;-). Retrieved October 3, 2022, from https://rotterdamstyle. com/facts-history/a-history-of-rotterdam-from-fishingvillage-to-metropolis
Statistics Netherlands. (2019, December 16). Quality of Dutch exports in global top 5. Statistics Netherlands. Retrieved October 3, 2022, from https://www.cbs.nl/engb/news/2019/50/quality-of-dutch-exports-in-globaltop-5
Ted Grajeda | Striped Candy LLC. (n.d.). Vector map of world with countries - blue. Vector Map of the World with Countries - Blue | Free Vector Maps. Retrieved October 3, 2022, from https://freevectormaps.com/world-maps/ WRLD-EPS-02-4006?ref=atr
The 5 cosiest food markets in Rotterdam. (z.d.). Geraadpleegd op 3 oktober 2022, van https://www.the500hiddensecrets. com/netherlands/rotterdam/eat/food-markets
The Dutch agricultural sector is the second largest exporter! De Heus Animal Nutrition. (2020, October 22). Retrieved October 3, 2022, from https://www.deheus.com/articles/ news/the-netherlands-are-almost-the-worlds-largestexporter-of-agricultural-products-how-did-that-happen
The history of citrus in the low countries during the Middle Ages and the early modern age. AGRUMED: Archaeology and history of citrus fruit in the Mediterranean - The history of Citrus in the Low Countries during the Middle Ages and the Early Modern Age. Retrieved October 3, 2022, from https://books.openedition.org/pcjb/2197
The Trustees of Princeton University. (n.d.). Rotterdam, Netherlands, 1911 (raster image) - digital maps and Geospatial Data. Princeton University. Retrieved October 3, 2022, from https://maps.princeton.edu/catalog/ harvard-g6004-r7-1911-c4
134
XPAT NL. (2022, June 23). Retrieved October 3, 2022, from https://www.xpat.nl/expat-netherlands/living-inholland/r ecycling-and-waste-management/
Veldhuis, W., & Paeßens, I. (2009). Atlas van de snelwegomgeving: Handreiking Bij de Structuurvisie voor de snelwegomgeving. Must stedebouw.
Vestigingen. (z.d.). Bram Ladage. Geraadpleegd op 3 oktober 2022, van https://bramladage.nl/vestigingen/ Vestigen op Dutch Fresh Port. Dutch Fresh Port. (n.d.). Retrieved October 3, 2022, from https://www dutchfreshport.eu/vestigen-op-dutch-fresh-port/ Welkom bij Marqt — Marqt.nl. (z.d.). Geraadpleegd op 3 oktober 2022, van https://www.marqt.nl/ Wolters-Noordhoff Atlasproducties. (2007). De Bosatlas van N ederland.
Zaken, M. van B. (2017, March 30). Trade and investment in the Netherlands for business people from the Russian Federation. Russian Federation | Netherlandsandyou.nl. Retrieved October 3, 2022, from https://www netherlandsandyou.nl/your-country-and-thenetherlands/russian-federation/doing-business/tradeand-investment-in-the-netherlands.
135
REFERENCES
complex projects Food Distribution in the NL
