DISTRIBUTION
complex projects Food Distribution in the NL

FOOD DISTRIBUTION: The Netherlands
a publication by:
Lisa Blok Jonathan Kaye Chi-Hua Liu Max Mika Harit Naik David Sauer Bo Vissers
THE GLOBAL CONDITION
At the time of publication, there are 7.98 billion people on Earth1. This population lives in disparate conditions across 195 countries depending on their region, demographics, and wealth2
13.7% of the global population are residents of continental Europe, where the average person’s consumption rate requires 4.7 hectares3 (235% beyond global capacity) to support their lifestyle. This consumption is a result of a high development status4, a mature commercial sector, and a history of benefit from colonisation and its subsequent wealth extraction.
1. United Nations. (z.d.). World population prospects 2022: Summary of results | UN DESA publications. United Nations.
2. United Nations. (z.d.). Member states. United Nations.
3. Ecological footprint of European countries. European Environment Agency. (2021, May 11).
The Industrial Revolution, which transformed the global economy and made modern population growth and consumption patterns possible, began in Europe during the 1800s. However, the latter half of the 20th century saw widespread globalisation as corporations and countries shifted production from high consumption, high wage Western countries to low consumption, low wage countries in Eastern Asia and the Global South. As a result of this offshoring and the ensuing cost efficiencies, the modern economy in Europe is now highly advanced, with a significant service economy and focus on value-added industries.5
4. Hdro. (2022, September 20). Home: Human development reports. Home | Human Development Reports.
5. Invest in Holland helps foreign business set up in the Netherlands. NFIA. (2022, March 30).
THE NETHERLANDS PLAYS AN INTEGRAL ROLE
One of the most important participants in this system is The Netherlands. As the originator of the first multinational corporation and a major global trader over the past four hundred years, it is now one of the primary links between global producers and consumers. In the 2020s, its inhabitants comprise only 0.22% of the global population, but are responsible for 1.1% of all global Gross Domestic Product (GDP)6
This difference can be attributed to the Netherland’s high levels of development access to knowledge, and well-established industrial and commercial sectors.
6. GDP growth (annual %) - Netherlands. Data. (z.d.).
The Netherlands’ primary products are no longer raw goods, but knowledge, and it exports this resource through its university system, extensive participation in international organisations, and successful multinational corporations. The Netherland’s has a rich heritage of agricultural production for which it currently allocates 53.2% of total surface area7. From these arable lands and greenhouses, high-value dairy products, meats (particularly beef), flowers, and more are produced. Combined with the value of goods processed from raw materials (like chocolate), a total of 68.3 billion EUR in
7. Cbs. (2021, February 9). How do we use our land? CBS.
agricultural goods were produced domestically in 2020. In Zuid-Holland, the Westland municipality has more than 2,500 hectares of greenhouses producing goods with up to ten times the amount of yield with half the amount of water and fertiliser resources.
While some goods are destined for domestic consumption, a significant proportion are exported. The Netherlands has constructed a world-leading intermodal system effective not only at moving goods, but also at integrating valueadded processing during their time in the country.
“
Food systems of any city around the world, whether small or large, will always be made up of mixture of various actors, local or global food chain, and different ways of distribution and consumption. The food systems can be better understood by dividing it into three (3) basic categories based on different factors with each offering specific opportunities to various actors.”
(Food in an Urbanised World, Jennings S. et al., 2015).
ROTTERDAM IS AN IMPORT / EXPORT HUB
In this way, the Netherlands has mastered a tri-prong agricultural value chain: production, processing, and distribution. With the quality of its air, rail, and sea ports, the Netherlands acts as the Gateway to Europe for many goods and re-distributes up to 70% of imports to neighbouring countries1
8
The Port of Rotterdam has been designed as an important component in this system. With a size of 12,600 hectares, it is the largest port in Europe and imports and exports hundreds of millions of tonnes annually.
It contributes directly or indirectly to more than 565,000 jobs within the Netherlands and acts specifically as an
8. Adapted from De Bosatlas van Nederland (1ste editie). Noordhoff. (2007, 1 oktober)
integral part of the agricultural supply chain.2 While only 3% of its total pass-through is designated as agribulk, this accounts for more than 8.6 million tonnes of product annually3
9 10
Whether involved in the food chain during one or many steps (from production, processing, distributing, to marketing of food), the Port of Rotterdam has a sophisticated, digitised system for managing these complex, often international networks of actors.
From its early origins as a city on a dam to its modern role to a more circular future, the Port of Rotterdam is an integral part of the Dutch food system.
9. Viviano, F. (2021, May 3). How the Netherlands feeds the world. Magazine.
10. Facts and Figures Port of Rotterdam. Port of Rotterdam. (z.d.).
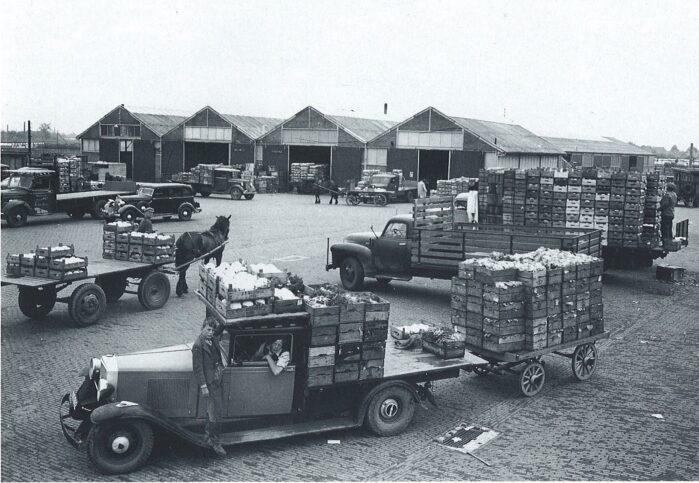
Above - Fig. 3

Collage showing interconnectivity of different elements within Food System 1.0.

world, where there are more rural
Within this system, most consumption is dominated by staples and relatively unprocessed food. Perishable goods travel poorly. Produce distribution is often via a trader or broker, who transports goods to nearby urban centres with intermediate stops at small towns. This pattern initiates a


Food System 2.0 is characterized by a larger dependence on national and international trade. This food system is often more consolidated and centralized, with greater global integration and reduced reliance on local production.
It is predominantly found within industrialised countries and cities. With relatively easy access to food from across the globe, production centralises and consumption of processed food and meat rises.
Large-scale national and international farmers, corporations, supermarkets, and processors are hallmarks of this system. Other major actors include fast-food restaurants, waste collection, and energy companies. In this system, traditional specialist businesses and local markets are pushed aside by (inter)national companies.
In Rotterdam, the network of modal connections and the prevalence of international business contribute to the city as a case study in action.


Food System 3.0 is characterized by a localised, city-level food system which is meant to seek a balance between the local and global food supply. This food system provides new opportunities to local producers in urban, peri-urban, and rural areas.
This system is based on outcomes of multiple food systems in relation to health, economic development, and environmental sustainability. To increase system resilience, many new actors from non-agriculture backgrounds are involved, including:
IT professionals, health organisations, schools, social housing, real estate companies, private landowners, care organisations, and NGOs, creating an interconnected system which links producers directly with consumers. With a rise in new initiatives and greater resident involvement, Rotterdam is gradually moving towards this evolution in its food system.

Above - Fig. 5
Collage showing interconnectivity of different elements within Food System 3.0.


Right - Fig. 6

“Een volk dat leeft bouwt aan zijn toekomst.”
“A people that live, build their own future.”
De Ned ver Kust en Oeverwerken, inaugurationofAfsluitdijk(1932)
Development of the Westland
In recent decades, Westland has evolved into the centre of Dutch greenhouse horticulture. This growth stems from a combination of policy and shrewd timing designed to help Dutch agricultural knowledge produce rapid-innovation in a new sector of economic growth.
This modern example echoes others across the centuries as the Netherlands slowly developed into its modern form and the city of Rotterdam in Zuid-Holland grew from a small fishing village into the second
largest city in the Netherlands.
These developments accelerated the city’s transition from Food System 1.0 to 2.0 and were bolstered by the everincreasing growth of the Port.
In considering the ways agricultural production and trade influenced the development of Westland and Rotterdam, we must account for the region’s history, key moments, and innovations which affected production and distribution of food across the Westland and within Rotterdam.
Below - Fig. 7 Maps tracing the spatial organisation of Westland since the 13th c.
Below - Fig. 8 Map of the Westland and Rotterdam from 1250 CE.
Below Sea Level
During the 13th century, most Dutch cities were engaged in Food System 1.0. Inhabitants mainly depended on locally produced food, which they obtain from the farmers themselves or from small local shops and traders.
A large part of the land north of the Maas, the current Westland and Rotterdam and its surroundings, was already being cultivated and used for agricultural or livestock purposes.
However, the area was very vulnerable as some parts of the land were below sea level and at high risk of flooding. Two of these major floods occurred in the 12th century, causing a signifcant area North of the Maas to be covered in clay. These frequent floods often destroyed whole villages and surrounding farmland as only few active measures were taken to prevent the floods. After each flood, villages were rebuilt and land was recultivated, leading to little progress in the way the food was produced and distributed (IJsselstijn & van Mil, 2016).
Flood Control
The 12th century floods not only affected the villagers, but also the property of the counts of Holland. The counts owned lots of valuable possessions in the area north of the Maas, so they would benefit from reclaiming the flooded land and protecting the area from future floods. Therefore, at the insistence of the counts of Holland, around 1250 an important sea barrier was built north of the Maas, the Maasdijk, which is indicated in orange in the map above. Moreover, the governments of the villages started to cooperate on water management and founded the waterboard of Delfland. These improvements regarding flood control, made the area less vulnerable and provided the opportunity for small establishments to grow into cities. This is
Creation of the Maasdijk
Far Left - Fig. 9 Map of the Maasdijk and Schielands hoge zeedijk.

Above - Fig. 10 Illustration of the Port of Rotterdam (Rotterdam, n.d.).
Left - Fig. 11 Historical Map of Rotterdam from 1270 CE.

Port of Rotterdam
Around 1270, the Schielands hoge zeedijk, an extension of the Maasdijk towards the current Rotterdam, was finished. The final part of this dike was a dam in the river ‘Rotte’. Due to this dam, the Rotte could continue to drain onto the Maas, while the water of the Maas remained outside the dikes (Hoe Rotterdam Ontstond: Tijdlijn – Historisch Genootschap Roterodamum, n.d.).
The dam was built by the people of the then small fishing village. The dam soon turned out to be a convenient place to transfer goods from bigger seaships to smaller riverboats. This is the beginning of the port of Rotterdam (Geschiedenis Van De Haven, n.d.).
Over the next 70 years the port developed into a major site, due to the construction of a canal called the Schie. The canal provided access to the larger cities in the north of the Netherlands. Moreover, the port became a key location for the transshipment of goods between England and Germany. So what once started as a man made fishing village had now grown into a port city with both national and international connections (Delfshaven, n.d.).
Dam in the ‘Rotte’ is built, initiating the port of Rotterdam
Below - Fig. 12 Map of the Westland and Rotterdam from 1650 CE.
Start of Change within the Food System
Until the beginning of the 17th century, the spatial organization and food system of Westland and Rotterdam did not change drastically. Although, the population expanded and food distribution systems matured within the Netherlands, people still got most food locally.
However, this started to change in the 17th century as the population of Holland grew rapidly. Due to this rapid growth, demand in Holland for fruits and vegetables increased. As the demand rose, so did supply. During this period, also known as the Golden Age, the Port of Rotterdam played a major part in the provision of food to the people in Holland due to its import of fruit and vegetables.
The port gained a more central role due to its position within international shipping networks as part of the ‘Verenigde Oostindische Compagnie’ (V.O.C.). The V.O.C. established extensive trade contacts in East Asia and founded (often by force) colonies across southern Africa, Persia, India, South East Asia and Indonesia.
Although the Port of Amsterdam dominated the trade in the Netherlands, Rotterdam also flourished economically during this era.
Goods imported to Rotterdam varied, but notably included a wide range of citrus fruits from East Asia.
Founding of the Dutch East India Company (VOC) in Amsterdam

Transportation via Tow Canals
Due to the increased demand for fruits and vegetables in Holland, the goods which came into Rotterdam needed to be distributed within the country.
Therefore, a network of tow canals was dug to help transport goods and people between the cities of Holland (e.g. Rotterdam, Schiedam, Delft and The Hague), as well as other countries (e.g. Germany).
In these canals, boats were towed by horses or people walking along the canal. This method was much more reliable than traveling per sailing ship as these boats did not depend on the direction of the wind. Moreover, as the tow canals were dug in a straight line, the route was always the shortest route possible.
This invention required a lot of time and money to establish these canals and their associated infrastructure, as well as the process of acquiring land from farmers along the route. The money required for the canal network was gained back by placing toll booths along the canal (Trekvaarten in Zuid-Holland, z.d.).

Orangeries
As prosperity grew in Holland, English gardens began to appear in the rural areas. Courtesy of the tow canals, these areas were now easily accessible by both goods and people.
Most gardens were established by wealthy citizens wanting to escape the city during the summer, particularly the lack of clean water, sewage management, and subsequent breakout of disease (Buitenplaatsen in De Zeventiende En Achttiende Eeuw, n.d.).
In these gardens, vegetables were planted to provide food supply for the residents. Later, orangeries began to appear. These were used to keep tropical plants brought back by the V.O.C. or W.I.C. alive year round.
In the beginning, these orangeries were used to show off wealth, but later these orangeries would also be used for food production. Therefore, these orangeries can be seen as one of the earliest forms of horticulture (Kooi et al., 2019).

Far Left - Fig. 17 Illustration of the interior of an orangerie (Stichting in Arcadië, 2020).
Upper Left - Fig. 18 Vegetable garden from the 17th century.

Right - Fig. 19 Early form of horticulture in the 17th century.

Orangeries and English gardens were crucial for the development of horticulture in Westland. One of best-known gardens was located in the Huis Honselaarsdijk. Its gardens were meant to impress and were said to compete with the court of Versailles. When governor William III inherited the palace, the gardens were also used for cultivation research. Together with his gardeners, he actively sought improvements in horticulture. They immersed themselves in the propagation, breeding and grafting of trees and plants and cultivation in orangeries and other greenhouse systems. They also found that rotational cultivation and fertilization significantly improved the yield on the infertile soils.
In this way, these gardens and orangeries became the first testing grounds in the Westland. The staff later gathered and spread this knowledge. Agricultural production (in both fields and greenhouses) in the Westland expanded (De Tuin Van Holland - Hof Honselaarsdijk: Kiem Van De Westlandse Tuinbouw, 2022).

Far Left - Fig. 20
View of Huis Honselaarsdijk (De Tuin Van Holland - Hof Honselaarsdijk: Kiem Van De Westlandse Tuinbouw, 2022)
Upper Left - Fig. 21
View of the garden of Huis Honselaarsdijk (De Tuin Van Holland - Hof Honselaarsdijk: Kiem Van De Westlandse Tuinbouw, 2022).
Right - Fig. 22
View of the orangerie of Huis Honselaarsdijk (De Tuin Van Holland - Hof Honselaarsdijk: Kiem Van De Westlandse Tuinbouw, 2022)


Below - Fig. 23 Map of the Westland and Rotterdam from 1800 CE.
Agricultural Development
In 1800, cities continued to rely on one another as trading partners (significant cities visible here are Den Haag, Delft, and Rotterdam). National and international trading partners operated across geographies and utilised tow canals to move goods within the Netherlands.
By 1800, as flood management improved, the majority of South Holland was being used for agriculture as the area between cities became further cultivated.
Rise of the Greenhouse
In the 19th century, greenhouses began a rapid evolution. From their origins as orangeries for the wealthy, less expensive versions appeared. First, leaning wooden greenhouses, then greenhouses with only one transparent wall, then, as production advanced, the percentage of glass on the exterior of the greenhouse gradually increased. As the Industrial Revolution intensified, iron greenhouses with glass on both sides became common. As their forms became standardized and their crop production more regular, their proliferation persisted (Quist, 2021).

In Westland, the climate proved perfect for horticulture, leading to its rapid development as a region for greenhouse agriculture. As the industry matured, additional capital was invested to scale up research and production.
Start of industrialization in the Kingdom of Holland
Establishment of the Kingdom of the Netherlands
Far Left - Fig. 24 Evolution of the greenhouse.
Left - Fig. 25 Iron greenhouse (Stichting in Arcadië, 2020).

Lower Left - Fig. 26 Orangerie (Stichting in Arcadië, 2020).
Lower Right - Fig. 27 Orangerie interior with tropical plants (Stichting in Arcadië, 2020).

First public railway constructed between Amsterdam and Haarlem

Below - Fig. 28 Inauguration of the first public railway between Amsterdam and Haarlem (Lent, 2022).

Upper Right - Fig. 29 Impression of a train in the Westland.
Center Right - Fig. 30 Impressions of a railroad station in the Westland.
Lower Left - Fig. 31 Impression of a train in the Westland.
Public
railways are extended to Rotterdam
Lucien Bonaparte builds greenhouse in Leiden for tropical plants
Introduction of the Steam Train
The industrialisation of the late19th and early-20th centuries led to many technical developments, particularly the mass production of iron greenhouses, which massively increased food production.


This period also shifted the primary method of goods transport from tow boat to train. This was a crucial development for the Netherlands as an export hub, as the volume of horticulture and other exports leaving the Port of Rotterdam for Europe increased dramatically. 1870 1880 1890

Inauguration of the Nieuwe Waterweg
Railway built over the Maas, connecting Rotterdam with the South of the Netherlands

Below - Fig. 32 Map of Westland and Rotterdam from 1900 CE.
Nieuwe Waterweg
In the mid-19th century, Rotterdam was already one of the largest port cities in the Netherlands. The city benefited from its location as a transfer point for goods to and from England, France, and the German hinterland. However, the regional position of the port began to deteriorate due to its poor connection to the sea.
Over time, the delta of the Rhine had become shallow and the increasing size of the transport ships made it increasingly difficult to reach the port of Rotterdam.
In 1863, the government decided to construct a waterway suitable for large seagoing vessels. This resulted in the digging of the Nieuwe Waterweg to improve the connection from the port of Rotterdam to the sea and to allow the port to expand further (De Aanleg Van De Nieuwe Waterweg, z.d.).
Excavation of Waalhaven Completed

Rapid Growth of the Port
The almost continuous dredging of the Nieuwe Waterweg (to improve the connection from the port of Rotterdam to the sea) has been accompanied by improvements in other water- and land-based transportation.
The growing population and increasing demand for food has led to the need for more river ports like Rijnhaven, Maashaven and Waalhaven. These downstream requirements have also influenced the recent construction of the Rotterdam Fruit Port.
To handle the scale and frequency of cargo ships coming into Rotterdam, the port has almost continually expanded toward the sea by constructing new docks along the Nieuwe Waterweg.
New technical developments have also allowed the port to manage more and more goods (e.g. cranes for the transshipment of products) (Geschiedenis Van De Haven, n.d.).
Rotterdam Blitz 1/3 of Port facilities destroyed
 Upper Left - Fig. 34 Crane in the port of Rotterdam (Stoomhijskraan, Hijskraan Onder Stoom, z.d.)
Far Left - Fig. 33
Upper Left - Fig. 34 Crane in the port of Rotterdam (Stoomhijskraan, Hijskraan Onder Stoom, z.d.)
Far Left - Fig. 33
Below - Fig. 35 Map of Westland and Rotterdam from 1960 CE.
Post-War Development
In the aftermath of World War II, cities like Rotterdam began a rapid expansion. The Westland was designated for greenhouse development and indoor production increased significantly.
The Port of Rotterdam began what would be multiple decades of Westward expansion.
Maasvlakte Construction Begins