The Mupas Portal Instruction Manual


Your Mupas Portal is a view into the events in your environment and where you go to understand more about the anomalies you are experiencing.

Once your device is set up, you will want to see the data gathered and recorded. You can do this by using the Mupas Portal. In your favorite browser, navigate to the Mupas Portal: Mupas Portal (https://www.mupas-studies.com/portal)
Once there, you will be asked to log into the portal.
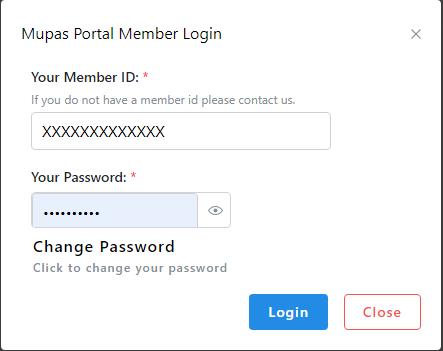
Enter your Member ID and Password provided in your introduction email from experiencer.studies@gmail.com.
Once logged in, your personal Mupas Portal will be displayed.
The Mupas Portal provides a variety of ways to view the data recorded by your Mupas device and other devices you have been authorized to monitor. Your portal comes with an initial configuration. Before you start using it, it is recommended that you set up a few things.
Clicking on the avatar icon in the portal's upper right-hand corner (circled in red) will display a dropdown menu, allowing you to change various aspects of the portal operation.

Selecting Adjust Profile from the dropdown menu allows you to optionally set an alias other members can use to identify you.

Setting up which devices will be displayed on your portal
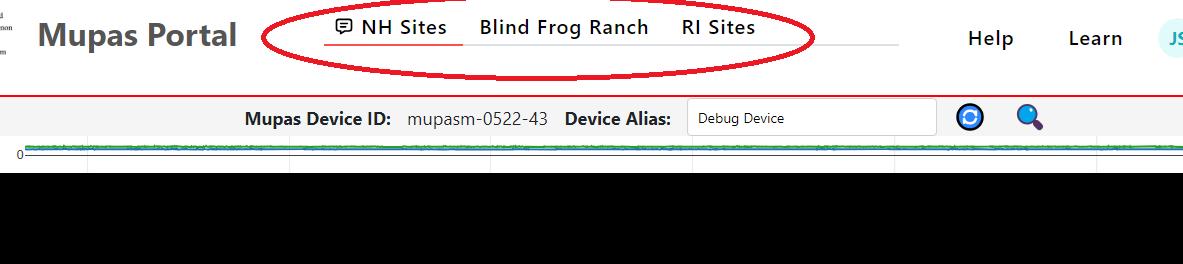
Your Mupas Portal has three separate portal panes where you can simultaneously view the data and events gathered by up to two devices. You can switch between the three panes by clicking the tabs at the top of the screen, as shown below, circled in red.
Selecting Portal Setup from the dropdown menu lets you choose which devices will be displayed on each portal pane and how the data will be presented.

Move between the three portal panes by selecting tabs Portal 1, Portal 2, or Portal 3 corresponding to your three portal panes. You can choose how data is presented to you, historically or in real-time, what the portal pane is called, and which devices will be displayed for each portal pane.
Historical Pane: Displays the device data in a long time series by hour, day, or for the week.
Realtime Pane: Displays the last few minutes of data from the device.
Alias: Displayed as the heading of the pane tab on the main screen.
Device Section: This dropdown provides a list of devices that you have been authorized to view in your portal. You can select up to two devices per portal pane.
There are several ways the MUPAS System can alert you to anomalous events when they occur Events are sometimes generated by the Mupas AI Engine, which continuously scans your data to look for anomalous readings. When found, events can be viewed on your portal, but you can also be alerted by email when a new event is found.
Selecting Setup Notifications from the dropdown menu allows you to set up when the Mupas System sends you a notification of a new event.

An incident is a type of event associated with an experience. For example, when you see an anomalous object or have a vision. The Mupas AI Engine uses these events and your device reading to learn your patterns.
Selecting Incident Reports from the dropdown menu displays the Incident Report Portal, where you can document and view your incidents.

The Incident Report Portal displays all your past incidents and provides a way to document new incidents.
An incident is recorded in the Mupas System by date and time, and a narrative is provided describing what you experienced. You can optionally add specific information about the event, such as location and type, as well as an image or other documents.
You can set the date and time of the incident by clicking on Incident Time to select a date and time.

Optionally, you can specify where the incident occurred by selecting from a list of preset locations or typing a location into the field. Clicking on Incident Location lets you choose from the list of preset locations.
Optionally, you can specify a category for the incident by selecting from a list of preset types or typing a type you choose into the field. Clicking on Incident Types lets you select from the list of preset types.

The most important information that can be gathered about your incident is the narrative describing what you experienced. The Mupas AI Engine uses this information to learn your particular patterns. You can enter a narrative for the incident by typing it directly into the field or by using the popup editor. Clicking Incident
Narrative lets you enter your narrative into a convenient popup editor.

If you have taken photos of a craft or orb during the incident and would like to save them with the incident, you can attach them by clicking Attach Image.
The portal panes are your view into the readings and events captured for your devices. Each pane can be set to display different devices and readings in real-time or historical mode. Setting up your portal panes was discussed in a previous section.

In the example above, the pane labeled Blind Frog Ranch displays historical readings from two devices simultaneously in two different device panels. Typically, you would group devices on one pane that are similar, such as in other parts of your house or a neighbor's house.
Each panel displays the readings from three sensors simultaneously In the above example, the top device displays RF Energy, Temperature, and Gamma Energy while the lower device displays Dose, RF Energy, and Magnetic in Z
When the pane is set to the historical mode, you can select the period for which readings are displayed for each panel. This will be discussed in a later section
Each panel displays data from a single device in real-time or historical mode for the specified period. Three graphs are plotted on the panel for your selected three different sensors.

Specifying which sensor to display
Selecting which sensor is displayed in each of the three graphs is done by clicking on the icon to the left of the graph. This will display the graph readings selection popup menu,


If you would like to see more details on a particular graph, you can click the to the left of the graph. This will display the graph detail window, showing the data on a larger scale.


You can set the graph's time scale to historical mode when the pane is set. Press the icon on the bottom left of the pane to display the time-scale selection menu.


You can optionally give an alias name to the device on each pane. This allows you to quickly refer to the device location when observing and reviewing its data. To add or adjust the alias for a device, enter the alias into the text box and click the update button to the right.

Sometimes, a sensor has more than one reading. This is the case, for example, with the environmental sensor, which has four separate channels: Temperature, Pressure, Humidity, and Voc Gas. The legend on the right of the graph provides a color code for the particular graph.

Clicking on one of the legend entries toggles the visibility of the individual graph.
Hovering over the graph with your mouse brings up a flyout that provides details about the point on the graph the mouse was over

In addition, you can zoom into a section of the graph by dragging your mouse over a region while holding down the left mouse button.
When the pane is set to historical mode, you display a window of the total readings stored for the device. The window size is determined by the time scale you set. You can move the window back in time by clicking the icon at the bottom of the graph. Clicking the icon will move forward in time. And finally, clicking the icon returns you to the present readings.
You can jump to a particular date to display data stored for the device for the current time scale by clicking in the date text box.

The Mupas AI Engine continuously analyzes the data captured by the device and looks for any anomalies. Anomalies are reported to participants who have been set up to receive alerts. Please see the section setting up notifications to register to receive notification of an alert.
In addition, participants can also enter observations of anomalies they find in the data as they view it. One way to add an observation is when viewing the graph detail. See the section on graph details. While viewing the graph details, you can click anywhere on the graph to add an observation. This displays a window to enter your observation, as in the example below.

Once an observation is entered, an observation icon appears on the pane top graph panel, as demonstrated below.

Clicking on the icon displays a popup with information about the observation.

Several event types can be assigned to any point in a device's data.
Alert Events
Symbol: The Mupas AI Engine continuously analyzes the data captured by the device and looks for any anomalies. Anomalies are added to a device's data as alerts.
Observation Events
Symbol: Observations are made by participants that observe anomalous activity in one or more readings.
Incident Events

Symbol: Participants can document an incident that they experienced.
Events then show up on the top panel graph in the panel. Clicking on the events icon symbol brings up an information popup showing the details for the event.

Alternatively, all events for a device can be viewed as demonstrated in the following figure.

An observation is recorded in the Mupas System by date and time, and a narrative describes what you observed. Optionally add specific information about the event, such as the sensor. In addition, an image or other documents can be associated with the observation.
You can set the date and time of the incident by clicking on Date Time to select a date and time.
Optionally, you can specify what sensor the observation was made by either selecting from a list of preset locations or typing a location into the field. Clicking on SensorType lets you choose from the list of preset locations.

The most important information that can be gathered about an observation is the narrative describing what you observed. The Mupas AI Engine uses this information to learn your particular patterns. You can enter a narrative for the incident by typing it directly into the field or using the popup editor Clicking Observation Narrative lets you enter your narrative into a convenient popup editor
If you have taken photos of a craft or orb during the incident and would like to save them with the incident, you can attach them by clicking Attach Image.