International Research Journal of Engineering and Technology (IRJET) e ISSN: 2395 0056

Volume: 09 Issue: 07 | July 2022 www.irjet.net p ISSN: 2395 0072

International Research Journal of Engineering and Technology (IRJET) e ISSN: 2395 0056
Volume: 09 Issue: 07 | July 2022 www.irjet.net p ISSN: 2395 0072
 Fathimathul Sabna1,Dr T V Sajeev
2 , Vimod K K3
1 Post Graduate Student, M.Sc Environmental Science, Department of Geology and Environmental Science,Christ College, Irinjalakuda, Thrissur 2Senior Principal Scientist, Department of Forest Entomology ,Forest Health Division, KFRI, Peechi
3Project assistant,Forest Health Division, Kerala Forest Research Institute,KFRI,Peechi ***
Abstract A landslide means a natural phenomenon in which a large kind of ground movement processes, like rock falls or debris flows. Landslides, also called as landslips, slope failures or slumps are the most common Geo hazards occurring in areas like mountainous regions. Landslide is caused by natural factors or by human activities. Which leads to environmental degradation, damage to buildings, roads, railways, pipelines,agriculture lands and communication networks. Landslide susceptibility means the likelihood of a landslide occurring in a region , or which shows where landslides are chance to occur.The study area, Palakkad district is vulnerable to landslides, and are hit by landslides during the past few years. GIS techniques and Frequency Ratio Model was used in this study to assess the contribution of conditioning factors to landslides, and to create a landslide susceptibility map of the study area. within the present study, the following influencing factors are selected slope, elevation, aspect, soil, lithology, drainage density ,rainfall, land use/land cover, road density, geology and geomorphology. The landslide susceptible map is prepared and that divides study areas into five zones that is very high risk zone, high risk zone, moderate risk zone, low risk zone and very low risk zone. The results of study help to understand landslide risk zones of Palakkad district and also the landslide susceptible zone map is of great benefit for the geoscientists, engineers and experts in planning and development.
Key Words: Landslide, Geo hazard, Geographic information system(GIS), Frequency ratio model,Kerala, Palakkad district, Susceptibility.
Alandslideisanaturalphenomenoninwhichalargekind of ground movement processes, like rock falls or debris flows under the influence of gravity. Landslides became a serious threat within the recent times because of the intervention of people and causes severe damage to life and property. Human activities like deforestation, land fillingmining,unscientificdevelopmentalactivitiesetc are the causative factors to landslides. Landslides cause destruction to property, injury and death to animals and humans. Landslides damages communication lines,
railway lines, dams, water supplies, road networks , bridges, etc.. Landslides also leads to economical degradation and have socioeconomic impacts on people. Kerala is prone to landslides and receive high amount of rain every year.Objectives of this study are to Identify landslide Susceptible regions of Palakkad district, to Preparelandslidesusceptiblemapforthestudyareausing Geographic information system(GIS), to find and analysis thefactorsthatcauseslandslideintheareaandtoanalysis terrain parameters related to landslides.In this study 13 parameters slope ,aspect ,elevation, drainage, stream network, road, Land use, lineament,soil type, rainfall geology,geomorphologyandlithologyareused
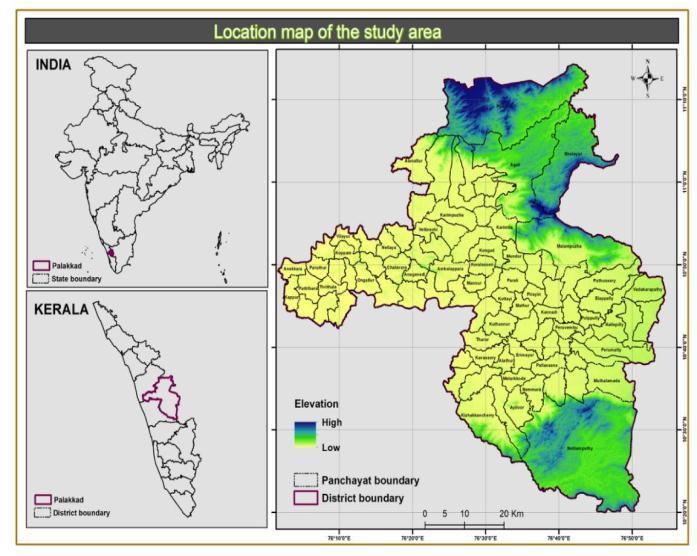
The study was conducted at Palakkad district, Kerala.The latitude of Palakkad district is 10.784703, and also the longitude is 76.653145. The study area is found with the GPS coordinates of 10° 47' 4.9308'' N and 76° 39' 11.3220'' E. The total area of the district is 4,480 km2 .1,360 km2 of land is covered by forests out of total area.
International Research Journal of Engineering and Technology (IRJET) e ISSN: 2395 0056
Volume: 09 Issue: 07 | July 2022 www.irjet.net p ISSN: 2395 0072
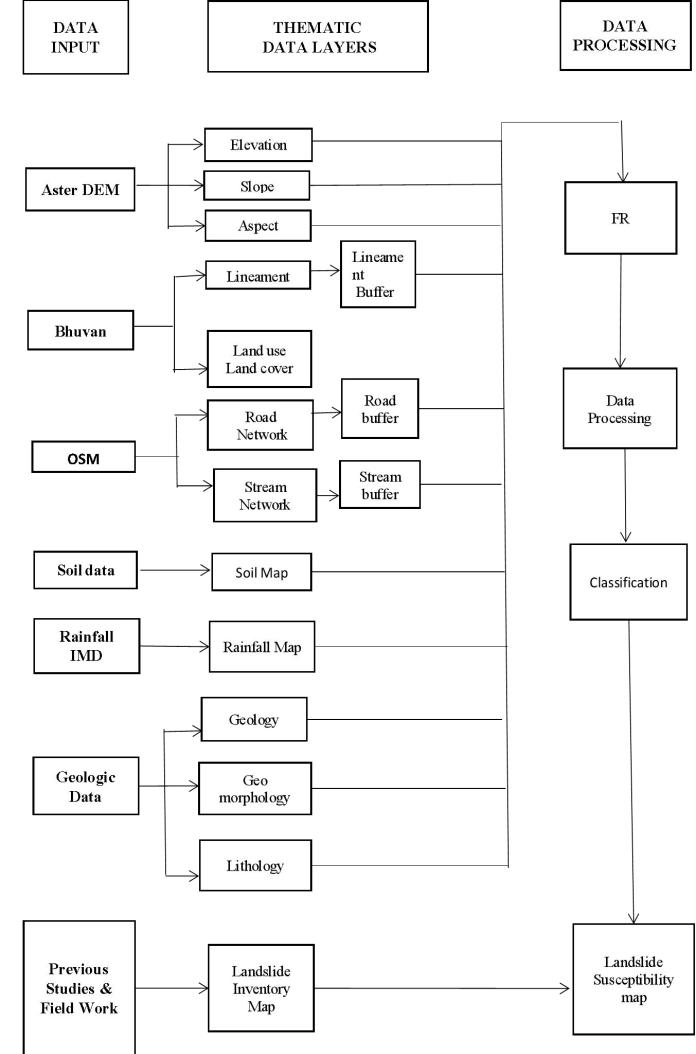
Geological Survey Of India prepared the drainage map which was vectorized from the Topographical map. Road network map and stream network map prepared from Open series Map (OSM). ASTER GDEM downloaded from ‘Global Data Explorer’ of US Geological Survey was processedtoderivatetheslope,aspect,andelevationdata.
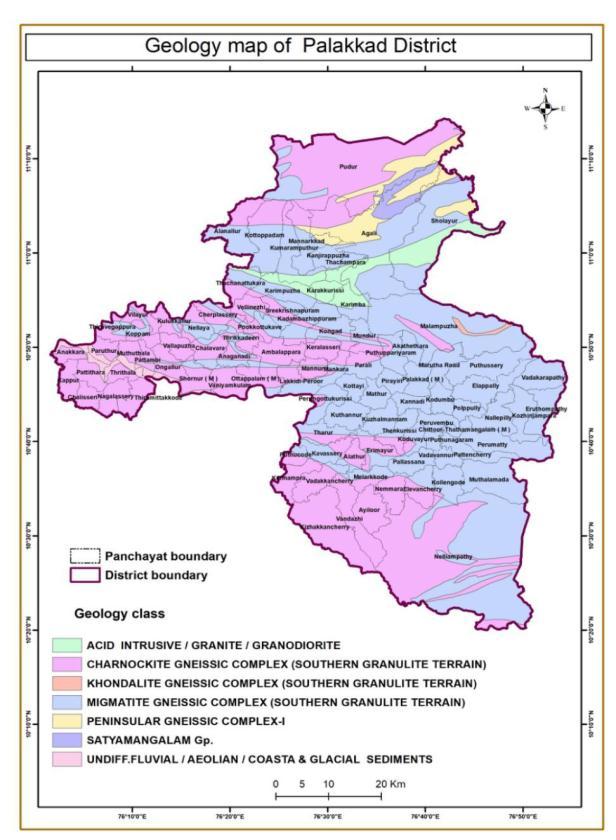
The Geology map was prepared from the Geological Quadranglemap,preparedbyGeologicalSurveyofIndiain 1: 50,000 scale. Geomorphology map and Lithology map prepared using geological data and GIS. Data related to land use land cover and lineaments were obtained from ‘Bhuvan’webmapservice.
Soil map prepared using data from Department of Soil Survey and Soil Conservation, Thiruvananthapuram, is used for creating the soil map of the study area. Rainfall map prepared using the data obtained from Indian MeteorologicalDepartment(IMD).
The Landslide Susceptibility(or vulnerability) Zonation map divided the land surface into zones that have likelihood for landslide occurrence. susceptibility values representthenetprobabilityofoccurrenceoflandslide at that particular point. Frequency Ratio Model is used to preparemaps.Thefrequencyratioistheratiooflandslide occurred to the total area, so that the value of 1 is the average value. If the the value is > 1 or Probability is higher,thenthereisagreatersusceptibilityforlandslides. The lower degree of landslide susceptibility in the region is representedbylowervalue(< 1).
Theformulaisasfollows:
Fr=(Mi/M)/(Ni/N)
Where
Mi=numberofpixelswithlandslidesforeachconditioning factorsubclasses,
M= totalnumberoflandslidesinthestudyarea,
Ni= number of pixels in the subclass area of each factor and
N= thenumberoftotalpixelsinthestudyarea.
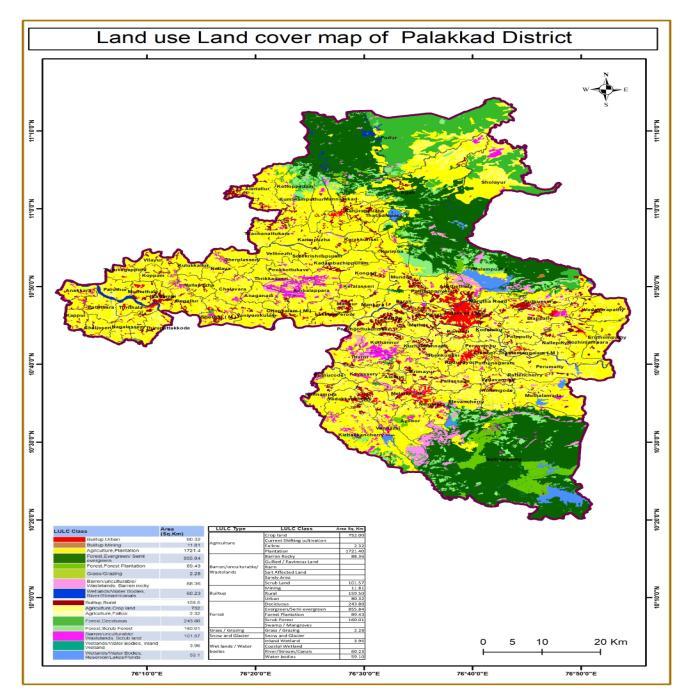
Landcovemapping,amethodthatquantifiespresentland resources into a variety of thematic categories such as forest, grass, agriculture, waste land, wet land water and build ups makes it simple to measure present circumstances. The land cover map is given below. The higher chance of landslide occur in evergreen/semi evergreen Forest. The frequency ratio is 1.93.Landslides also mostly occurs in agriculture plantations, forest plantationsandscrubforest.
International Research Journal of Engineering and Technology (IRJET) e ISSN: 2395 0056
Volume: 09 Issue: 07 | July 2022 www.irjet.net p ISSN: 2395 0072
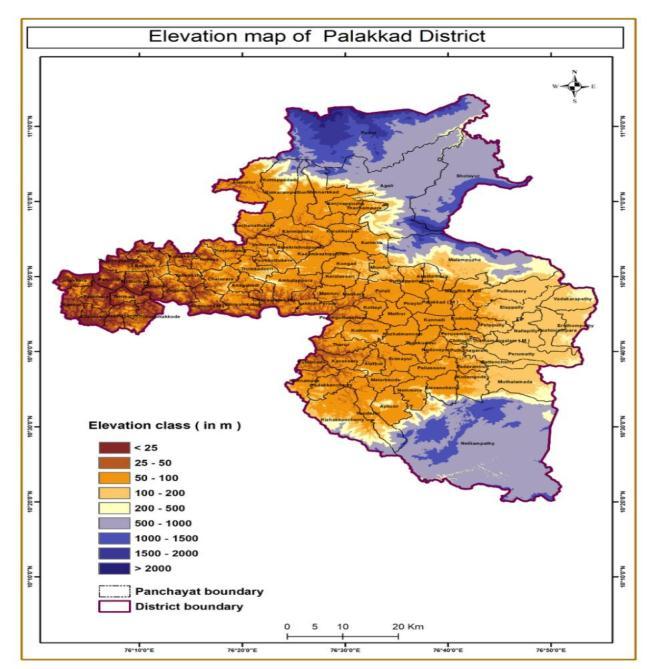
Elevation is another natural factor. In theareasof higher elevation,the possibilityof landslide occurrenceis comparativelymore thanthat of lower elevation. In areas of lower elevation terrainis mostlygentle and a higher water table is required to initiate slope failure. Here the studyareaissplitinto9classesviz.<25,25 50,50 100, 100 200,200 500,500 1000,500 1000,1000 1500,500 1000,> 2000. Highest number of landslide locations is found in 500 1000. The frequency ratio is 2.33.Thechanceofoccurrence oflandslideismoreinthe followingclasses 500 1000,200 500and1000 1500.
Figure -2:Land use land cover map of palakkad
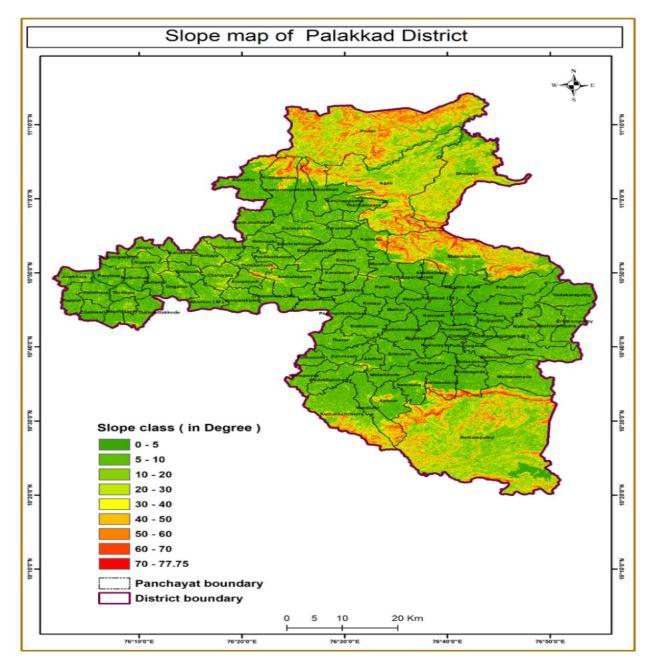
Slope is one of the major factors affecting landslide. It is expressed as percentage or degree. The chances of landslide occurrence also increases with increasing slope value. The slope angle values were divided into nine categories: 0⁰ 5⁰, 5⁰ 10⁰, 10⁰ 20⁰, 0⁰ 20⁰, 30⁰ 40⁰, 40⁰ 50⁰, 50⁰ 60⁰, 60⁰ 70⁰,70⁰ 77.75⁰. The highest number of landslide occurs in 20 30 classes and frequency ratio is 3.23.
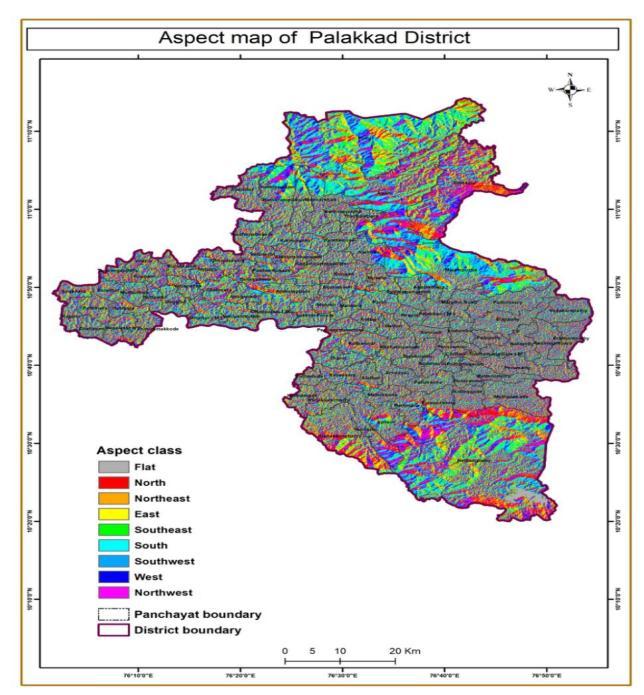
Aspect is the direction of slope.The most landslide areas areinNorth,NorthEast,EastandSouthEast,South,South West, West, and North West.Highest number of landslide locationsisfoundinWest.Thefrequencyratiois1.55.The chance of landslide is more in this areas West,South East,SouthandEast.
Figure 3:Slope map of Palakkad district
International Research Journal of Engineering and Technology (IRJET) e ISSN: 2395 0056
Volume: 09 Issue: 07 | July 2022 www.irjet.net p ISSN: 2395 0072
Drainage density is a factor which shows perviousness of strata, vegetation, rainfall and stream flow. High drainage density indicate impervious strata, high rainfall, less vegetationandactivestreamflow.Therearefiveclassesof which < 100, 100 m 200 m, 200 m 300 m has the highest number of landslide areas. It has frequency showing1.24,1.16,0.64. Higher the density lesser will be thechanceoflandslide.
Figure 5:Aspect map of Palakkad district
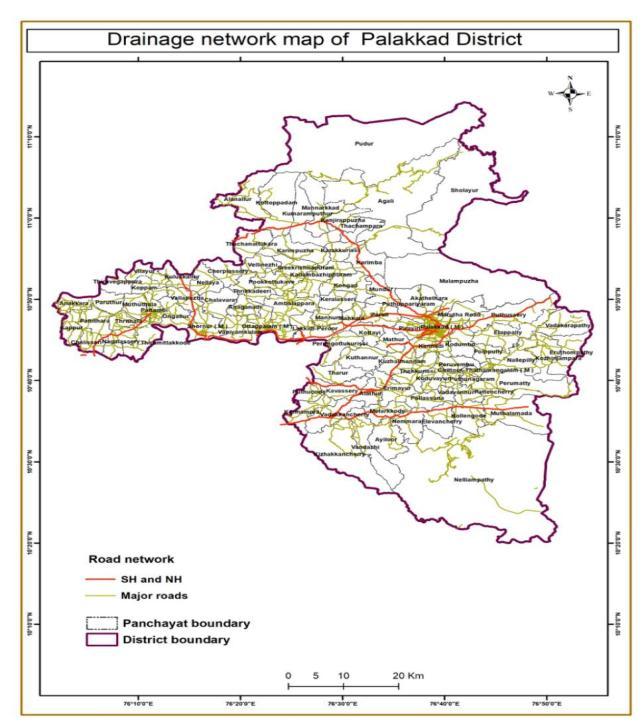
Another factor that effect landslide is distance from road. Herethestudyareaisdividedinto5classes<100,100m 200m,200m 300m,300m 400m,400m 500m.The higher chance of landslide occurs in the road buffer class of<100.Thefrequencyratiois2.88.Thelowestchanceof landslideoccursintheroadbufferclassof200m 300m. Thefrequencyratiois0.14
Figure 7:Drainage map of Palakkad district

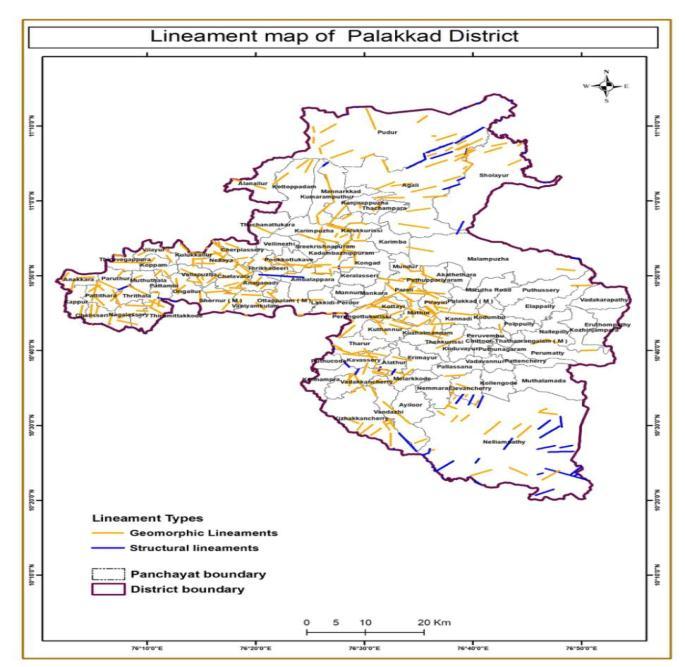
Geological structural features like the discontinuities that maybedetectedaslineamentsusingsatelliteimagery,itis also related to landslide occurrences. Lineament shows the region of weakness where the strength of the slope material is week , it leads to slope failure. There are five classes of which 400 m 500 m,300 m 400 m, 200 m 300 m has the highest number of landslide areas. It has frequency showing 1.54, 1.01 and 0.89. Higher the lineamentbufferhigherwillbethechanceoflandslide.
Figure 6:Road network map of Palakkad district
International Research Journal of Engineering and Technology (IRJET) e ISSN: 2395 0056
Volume: 09 Issue: 07 | July 2022 www.irjet.net p ISSN: 2395 0072
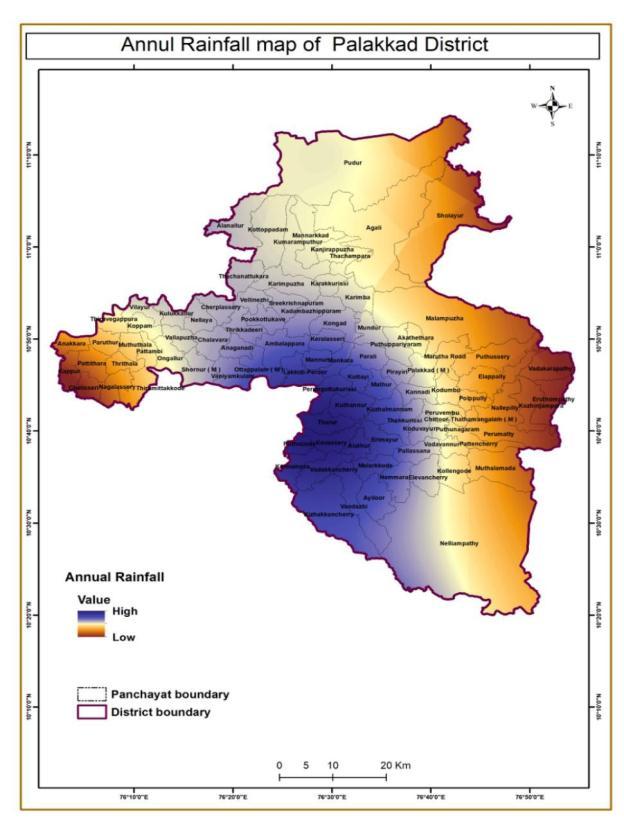
RainfallismostimportantcauseofLandslides.Thereare five classes of which 1500 2000, 2000 2500, 2500 3000 hasthehighestnumberoflandslideareas.Ithasfrequency showing1.18,1.06,0.58.Areawhichreceiveheavyrainfall ismorepronelandslide.
Figure -8:Lineament map of Palakkad district
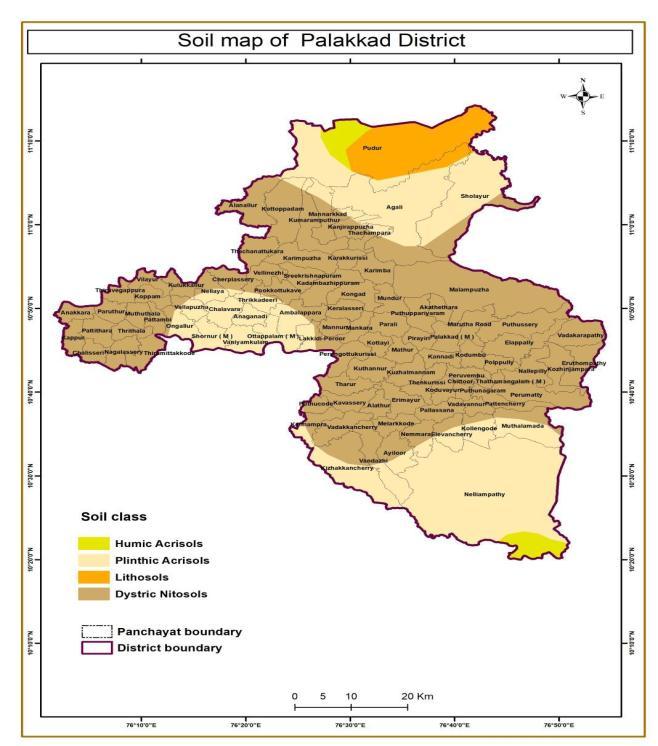
Thepropertiesofthesoilalsoaffectthelandslide occurrence. TherearefourclassesofwhichDystric Nitosols,LithosolsandHumicAcrisolshasthehighest numberoflandslideareas.Ithasfrequencyshowing 1.29,3.72,1.87.
Figure 10:Rainfall map of Palakkad district
Areas which are week, poorly consolidated and incompetent type of rocks are more risk to landslide. Presence of hard, strong and stable rocks shows stability totheslope,andmakeless risktolandslide. Thereare six classes of which MIGMATITE GNEISSIC COMPLEX (SOUTHERN GRANULITE TERRAIN), CHARNOCKITE GNEISSIC COMPLEX (SOUTHERN GRANULITE TERRAIN), PENINSULAR GNEISSIC COMPLEX I has the highest number of landslide areas. It has frequency showing 0.98,0.89,2.31.
Figure 9:Soil map of Palakkad district
International Research Journal of Engineering and Technology (IRJET) e ISSN: 2395 0056
Volume: 09 Issue: 07 | July 2022 www.irjet.net p ISSN: 2395 0072
Figure 11:Geology map of Palakkad district
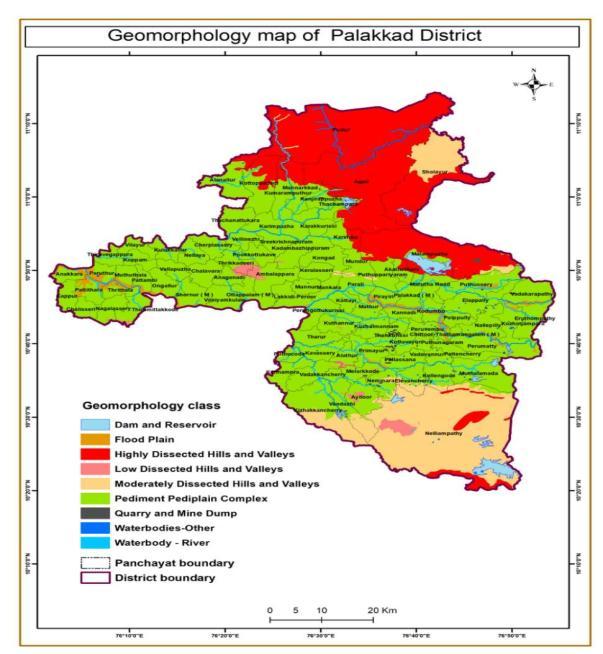
Geomorphology is the study of surface features of earth crust like land forms, origin and development of land forms and mechanism of geomorphological processes which evolve the land forms. There are nine classes of which Highly Dissected Hills and Valleys, Moderately Dissected Hills and Valleys, Pediment Pediplain Complex hasthehighestnumberoflandslideareas.Ithasfrequency showingof 2.82319412,2.125381507,0.116131536.
Figure 12:Geomorphology map of Palakkad district 3.12 LITHOLOGY
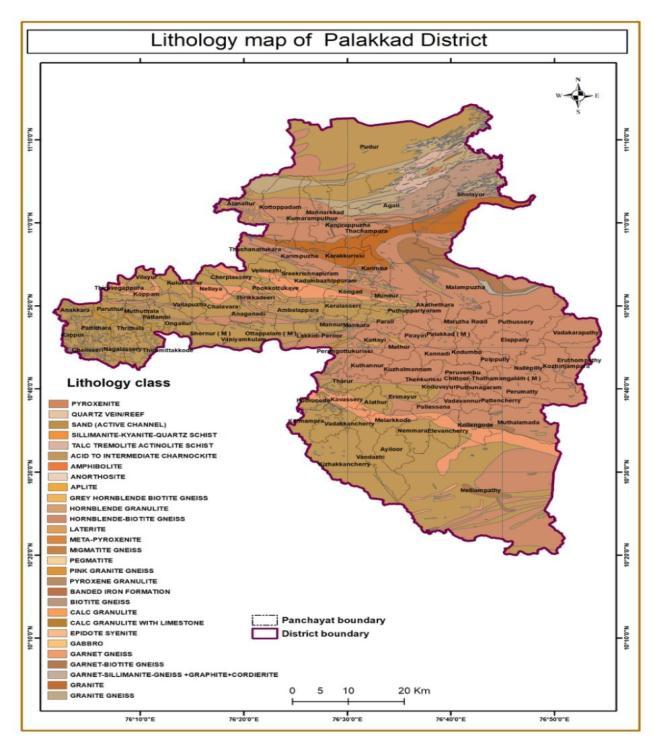
Landslides can occur in different lithologies. There are Twenty nine classes of which acid to intermediate charnockite, Hornblende Biotite, Garnet Gneiss has the highest number of landslide areas. It has frequency showingof0.93,0.46,and2.85.
Figure-13:Lithology map of Palakkad district
2022, IRJET | Impact Factor value: 7.529 | ISO 9001:2008 Certified Journal
International Research Journal of Engineering and Technology (IRJET) e ISSN: 2395 0056
Volume: 09 Issue: 07 | July 2022 www.irjet.net p ISSN: 2395 0072
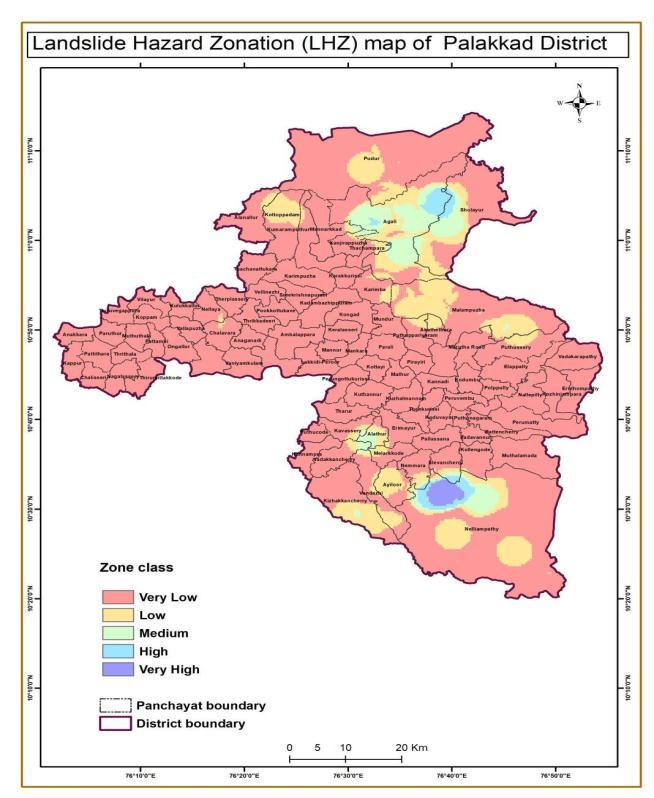
Landslideriskzonemapiscreatedbycombiningtheother mapsusingGIStools.Itisthenclassifiedintofiveclasses: verylow,low,moderate,highandveryhigh. 4,480km2 is thetotal area of Palakkaddistrictoutof which29.49km2 area falls under the very high risk zone. 58.01 km2 area falls under high risk zone, 191.24 km2 area falls under moderate zone and 562.46 km2 falls under low risk zone and3640km2areainverylowzone
reportedaslandslideveryhighriskzone.58.01km22area falls under high risk zone, 191.24 km2 area falls under moderate zone and 562.46 km2 area falls under low risk zoneand3640.8km2areainverylowzone.
Most of the landslides have been due to the human interaction.Deforestation,HeavyRainfallandEarthquakes, Mining, Urbanisation etc causes landslide. So we need a propermanagementforthisnaturalhazard.Therearealso different methods of preventing landslide. These include slopegeometrymodification,forreinforcingslopematerial using chemical materials,use of piles and retaining walls, reroutingsurfaceandunderwaterdrainage anddiverting debris pathways. The study has been successful in showing the landslide risk zone of the Palakkad district. Hazard zonation mapping using GIS and remote sensing techniquesgiveslatestandaccurateinformationregarding thelandslide
1. Ajin R.S., Vinod P.G., Menon A.R.R, “Landslide Hazard Zonation using RS and GIS techniques: A case study of Meenachil and Kanjirappally Taluk, Kottayam district, Kerala, India”, Proceedings of the 26th Kerala Science Congress, Pookode, Wayanad (India), pp. 1797 1804, (2014)
2. Balachandran, V. and Chandra Sekharan, S. (1995) A qualitative geotechnical evaluation on mass movements, Palakkaddistrict,kerala.NationalSeminaronLandslidein Western Ghats (Abstract volume) August 29 30, CESS, pp.6
3.Biju Abraham, P. and Shaji, E. (2013) Landslide Hazard Zonation in and around Thodupuzha Idukki Munnar road, Idukki district, Kerala, A geospatial approach. Jour. Geol.Soc.India,v.82(6),pp.649 656.
Landslidehasbecomeoneofthecommonnaturalhazards in the world. Most of the landslide are caused due to human activities. There are many factors that control the landslides. Aspect, slope, elevation, land cover type, geology,distancefromroadetc.Inordertoknowhowthe landslidecanaffectweneedpropermanagement.
In this study,Palakkad is selected to know the landslide riskzonesofthearea.InordertostudytheareaGIStools have been used. Using GIS, maps of the study area were created by choosing the factors that affect the landslide. All these maps were then superimposed to form the landslide risk zone map of the area. The map is then dividedintofivezones:verylowriskzone,lowriskzone, moderate risk zone , high risk zone and very high risk zone. By this we get about 29.49 km2 area has been
4. Biju Abraham, P., Krishnanath, R. and Sreenath, G. (1996) Slope Stability Along Highways A study around Karimpan, Chelachuvadu and Nagarampara areas in Idukki District, Kerala State, India. Proc. International Conference on Disasters and Mitigation, Anna University, Madras,A4 29 34.
4.Ganapathy, G.P., Mahendran, “Need and Urgency of LandslideRiskPlanningforNilgiriDistrict,TNstateIndia”, Internationaljournalofgeomaticsandgeosciencesvolume 1,pp.29 40,(2010).
5.6. Raveendran, Dr. Mani, Aneesh, “Landslide Hazard Zonation and Vulnerability Assessment of Western Ghats A case study in Devikulam Taluk of Idukki District”, International journal of research and applied sciences, volume5,pp.185 189,(2015).