
Solarphotovoltaiccellstransformsolarenergyintoelectricalenergy.Solarenergycanminimisethecarbondioxide(CO2) emissions associated with the generation of electricity from fossil fuels since the only CO2 emissions associated with the generationoffossilfuelsarethoseintheirproduction [2].SolarPVelectricityismoreenvironmentallyfriendlysinceitis carbon freeatthepointofgenerationcomparedtofossilfuelgeneration[3].TheefficiencyofthePVsystemincreaseswith solar irradiance at a constant temperature because the greater number of photons generated by higher solar irradiance createsmoreelectron holepairsleadingtomorecurrent[4] Performanceratio(PR)isameasureofthequalityofasolar PVsystemindependentoflocationorsolarirradiance.Itisoftenreferredtoasaqualityfactor.PRcomparestheactualand theoretical energy outputs of a PV system [5]. The nearer a PR approaches 100%, the more efficiently the respective PV system will be utilising the available solar energy resource. Because of unavoidable optical losses, PV array losses, DC to ACconversionlosses,cablinglosses,dust,shade,windspeed,ambienttemperature,ormoduletemperature [6],actualPR values are about 80% for well operating PV systems [7] Transient increases in PV cell ambient temperature led to
Theproblemofenergyscarcityhashitaglobalscalebecauseofthedependencyofmostoftheenergygenerationonnon renewablesources(e.g.,fossilfuels)[1].Asinsupplyanddemandlaw,thelowertheamountofenergyprovided,themore expensive it becomes, causing a major problem for the industry in general, which is dependent on it [1]. These non renewable energy sources contribute to environmental degradation effects and depletion of the ozone layer from the atmosphere. To minimisethiseffect,theuseof renewableenergysourceswhichisenvironmentallyfriendlyhasbeenon thegrowingindexacrosstheglobe.
Inthispaper,we examine thevarioussiteandsystem parameters thatinfluencetheperformance ofthe49.92kWp roof top grid connected PV system installed at Harlequins, Belfast, Northern Ireland using a five year dataset (from 2017 2021).Thesiteparametersexaminedareambienttemperature,relativehumidity,irradiation,windspeedandairpressure whilethesystemparametersexaminedareinverterefficiency,systemperformanceratio,systemefficiency,fillfactor,DC arrayandACfinalyields,DCarraycaptureloss,ACsystemlossandnormalisedoutputpowerefficiency.Theresultofour analysis shows that an increase in ambient temperature, solar cell temperature, relative humidity and solar irradiation decreases the PV system performance output while an increase in wind speed reduces both ambient and solar cell temperaturesbutincreasesdustaccumulationonthe surfaceofthesolarpanel. Anincreaseinairpressureincreasesthe solarirradiationandACpoweroutputgenerations.
© 2022, IRJET | Impact Factor value: 7.529 | ISO 9001:2008
1Dublin Energy Lab, Technological University Dublin, School of Electrical, Electronic Engineering, Grangegorman, Dublin 7, Ireland.
INFLUENCE OF SITE AND SYSTEM PARAMETERS ON THE PERFORMANCE OF ROOF-TOP GRID-CONNECTED PV SYSTEMS INSTALLED HARLEQUINS, BELFAST, NORTHERN IRELAND.
Certified Journal | Page507
ABSTRACT: The problem of energy scarcity has hit a global scale because of the dependency of most of the energy generation on non renewable sources (e.g., fossil fuels). As in supply and demand laws, the lower the amount of energy provided, themore expensiveit becomes,causing a major problemfor the industry in general,which isdependent onit. These non renewable energy sources contribute to environmental degradation effects and depletion of the ozone layer from the atmosphere. To reduce this effect, the use of renewable energy sources which is environmentally friendly has beenonthegrowingindexacrosstheglobe.
2School of Multidisciplinary Technologies, Bolton Street, Dublin 1, Ireland. 3Electric Supply Board (ESB) Networks, Dublin, Ireland. ***
IN
Chibuisi C. Okorieimoh1,2, Brian Norton1, Michael Conlon1, Desmond Lalor3, Ciaran McNamara3
Solar photovoltaic cells transform solar energy into electrical energy through the photovoltaic effect. Solar energy can minimisethecarbon dioxide(CO2)emissionsassociatedwiththegeneration of electricityfromfossil fuelssincetheonly CO2 emissions associated with the generation of fossil fuels are those in their production. Solar PV electricity is more environmentallyfriendlysinceitiscarbon freeatthepointofgenerationcomparedtofossilfuelgeneration.
International Research Journal of Engineering and Technology (IRJET) e ISSN: 2395 0056 Volume: 09 Issue: 02 | Feb 2022 www.irjet.net p-ISSN: 2395-0072
KEYWORDS: Ambient temperature, Solar cell temperature, System performance, Normalised output power efficiency, Solarirradiation,Fillfactor,Relativehumidity,Windspeed,Airpressure,Efficiency 1. INTRODUCTION

2.
SITE AND SYSTEM MONITORING ASSESSMENT
Volume: 09 Issue: 02 | Feb 2022 www.irjet.net p-ISSN: 2395-0072
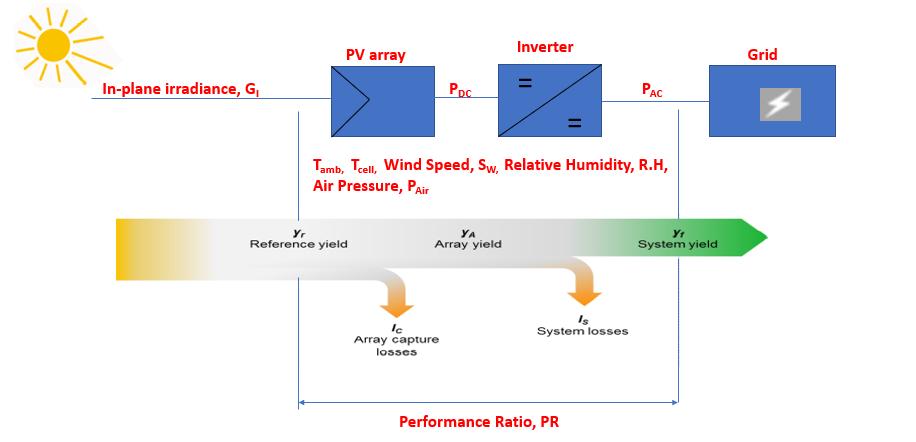
Figure 1. Energy Conversion Process in a Grid Connected Photovoltaic System
International Research Journal of Engineering and Technology (IRJET) e ISSN: 2395 0056
© 2022, IRJET | Impact Factor value: 7.529 | ISO 9001:2008
reductionsinefficiencies[3] Theeffectofsoilingcompositionisnotlimitedtoonlytheaccumulationofdustparticlesbut also combustion products, deposits of salts from non distilled water, soot, ash, bird droppings, and growth of organic species [8] Dust particles are defined as any particulate matter that is less than 500 µm in diameter which is approximately 10 times the diameter of human air [9]. The most common composition is organic minerals from geomorphic fallout such as sand, clay, or eroded limestone. Bird droppings have been seen as one of the significant problemsthataffecttheperformanceofthePVmodulesbecausetheyaremoreopaquethandirt [8]andrainfalldoesnot invariablywashthemoffthePVmodulesurface[10],[11].SolarPVpowerplantsaremainlysitedinsemi aridanddesert regions because ofthepeak solarirradianceand leastinterruption byclouds.Theseregions arealsoknownforfrequent dust storms, which result in the formation of a dust layer on the surface of the solar PV collectors [12]. The build up of these dust particles usually known as ‘soiling’ serves as a major hindrance to the PV modules in absorbing the solar irradiance and converting it to electrical energy [12]. Studies have proved that within an hour, a desert sandstorm can leave solar PV panels with a thick layer of residue, which is responsible for declining their efficiency by upwards of 70 80% [12]. Because of this effect, these panels therefore would need regular cleaning, even a daily cleaning routine, else theycanbeconsidereduseless [12].SincetheenergyoutputofPVpowerplantsislargelydecreasedbythesoilingeffect, thereisaneedtodeviseacleaningtechnologythatwillhelpminimisethiseffect [13].Heavyrainfallisthemosteffective way to clean dust particles from the surface of a PV module. High relative humidity and low rainfall contribute to the adherenceofthedustparticlesonthesurfaceofthePVmoduletrappingandconvertingfinedustparticlestolumpsofclay that become very difficult to remove with rainfall. This leads to permanent soiling. The accumulation of dust or dirt particles on the surface of the PV module is known as front surface soiling. The accumulated dirt may, at the same time, partiallyshadeaPVcellinthemodulecausingittogeneratelesscurrentelectricitythantheotherstringinthePVcells.If there is inadequate electrical protection, the partial shading of the cell can lead to irreversible hot spot damage with eventual modulefailure [14].Frontsurfacesoilingcan be noticedbyvisual inspectionofthePV module [15]. Thesoiling effectcausesopticallossesbothwhensoilingishomogeneouslydistributed,ornotuniformlydistributed[16]
Thesystemmonitoringassessmentfocusesontheconversionprocesses whilethesitemonitoringfocusesontheeffectof the environmental parameters on PV performance output. Figure 1 illustrates the energy conversion process in a grid connectedphotovoltaicsystem.Thein planeirradiance,GI (W/m2)fallsincidentallyonthesurfaceofthePVarraywhich generates the PV array output power, PDC (kW) and this output power, PDC passes through the cable to the inverter to generatePVsystemoutputpower,PAC andthustransmittotheutilitygridforpublicconsumption.Duringtheconversion process,siteparameterssuchasin planeirradiance,GI,ambienttemperature,Tamb,windspeed,SW,relativehumidity,R.H, airpressure,PAir andsystemparameterssuchassolarcelltemperature,Tcell,PDC,PAC,normalisedoutputpowerefficiency, andfillfactorareconsidered.TheTamb istheairtemperatureofthesitewherethePVarrayandtheinverterareinstalled, theTcell isthetemperaturegeneratedbythePVarray,theSw isanatmosphericquantitythatisdeterminedbyairmoving from high to low pressure, R.H measures the amount of moisture that can be retained by the atmosphere of the environmentofthe installedPVsystemsata givenambienttemperatureandair pressurewithoutcondensing andPAir is the pressure within the atmosphere of the PV installed locations. An increase in Tamb, Tcell or Sw may cause losses in the system. Other system parameters to be considered during the energy conversion process are reference yield, yr, array yield,yA,systemyield,yf,arraycapturelosses,Lc,systemlosses,Lsandsystemperformanceratio,PRSyst.
Certified Journal | Page508
PRA = × 100% Equation 4 PRSyst. = Equation 5 PRWhere: A isthearrayperformanceratio(DCperformanceratio).
a. Array PR ThearrayPR(PRA)istheratiooftheDCarrayyield(YA)toreferenceyield(YR)asexpressedinequation(4).Itis alsoknownastheDCperformanceratio(PRDC)becauseitevaluatestheperformanceoftheDC ratedpowerofthe PV array. DC array capture loss (LC) is the common loss associated with PRDC. The DC array capture losses are associatedwithPVconversion,ageing,modulequality,mismatch,andwiringanditisexpressedinequation(6).
LC = YR YA Equation 6
Volume: 09 Issue: 02 | Feb 2022 www.irjet.net p-ISSN: 2395-0072 © 2022, IRJET | Impact Factor value: 7.529 | ISO 9001:2008
YA isthearrayyield. YR isthereferenceyield. PRSyst isthesystemperformanceratio(ACperformanceratio);and YF isthefinalyield.
3. ANALYSIS OF SYSTEM PARAMETERS 3.1 System and Array Performance Yields
Certified Journal | Page509
Systemperformanceyieldsconsistofthethreeparameters:DCarrayyield(yA),ACfinalyield(yf)andreferenceyield(yr). During the conversion processes, the losses detected from the yr to yA is called the array capture losses (LC) while the lossesdetectedfromyA toyf iscalledthesystemlosses.Alltheseparameterswhichdeterminetheperformanceratesofthe PVsystemisdefinedbelow:
b. System PR ThesystemPR(PRSyst.)istheratiooftheACfinalyield(YF)toreferenceyield(YR)asseeninequation(5).Thisis alsocalledtheACperformanceratio(PRAC)becauseitmeasurestheoutputperformanceofthePVsystem.PRAC is
i. Array Yield (YA). The array yield is the ratio of daily, monthly, or yearly direct current (DC) energy output fromaPVarraytotheratedPVarraypowerandiscomputedusingequation(1)[17]: whereEDC isthetotalDCenergyoutputfromthePVarrays(kWh)andPPV,rated istheratedoutputpowerofthe PVsystem(kWp). YA = Equation 1 ii. Referenceyield(YR)istheratiooftotaldailyin planesolarirradiation(G)(kWh/m2)overitsreferencesolar irradiance(GSTC). Thisiscomputedusingequation(2) [18]: YR = Equation 2 iii. Final Yield (YF). The final yield is the total AC energy during a given period divided by the rated PV array powerandisgivenby[19]: where EAC is the total AC energy output from the inverter generated by the PV power system for a specific period(kWh).
International Research Journal of Engineering and Technology (IRJET) e ISSN: 2395 0056
YF = Equation 3 ArrayandsystemPRvaluesarecalculatedfrom[20]:
© 2022, IRJET | Impact Factor value: 7.529 | ISO 9001:2008 510
Volume: 09 Issue: 02 | Feb 2022 www.irjet.net p-ISSN: 2395-0072
affectedbyanACsystemloss(LS).Itisassociatedwithsystemlossesduetoinverterconversionefficiencyingrid connectedandgivenbyequation(7).
Figure2(a)showstheACfinalyield,yf versusreferenceyield,yr.Thesystemfinalyield,yf versusreferenceyield,yr forms the general set of performance parameters for a grid connected PV system. This figure shows that system yield, yf is proportional to the reference yield, yr. The average system and array performance ratio of the Harlequins site is 92.53% which is found by the slope of the graph and the coefficient of determination, the R2 value is approximated to 1 which shows that the data from the Harlequins site installation is in proper operation. This means that there is no form of shading observed on the site. Therefore, the relationship between system final yield, yf and reference yield, yr stands for theoverallconversionefficiencyoftheHarlequinssiteinstallation.
Figures2(b)illustratestheDCarrayyield,yAversusreferenceyield,yr.ThisFigureshowsthatwhenthemeasurementof DCarrayyield,yA isplottedoverreferenceyield,yr,itsrelationshipcanbeapproximatedto1asseenbyitscoefficientof determination, the R2 value. This is because the DC array yield, yA is proportional to the reference yield, yr. The average arrayperformanceratiooftheHarlequinssiteis94.35%andisfoundbytheslopeofthegraphwhichshowsthatthedata fromtheHarlequinssiteinstallationisinproperoperationsincetheirR2 valueisapproximateto1.Thismeansthatthere isnoformofshadingobservedinthesites. (a) (b)
3.2 Relationship between AC final yield (yf), DC array yield (yA) and Reference yield (yr)
Certified Journal | Page
Figure 2. (a) System final yield (yf) versus reference yield (yr) (b) Array yield (yA) versus reference yield (yr) for hourly data from Harlequins site from 2017 2021 3.3 Effect of Cell/Module Temperature on PV System and Array Performance
Figure 3 (a) shows the plot of system performance ratio (PRSyst) as a function of solar cell temperature. Harlequins site showsinverterperformancewithaninterceptvalueofapproximate95.43%respectively.TheslopeofFigure3(a)shows the temperature coefficient of power whose value in the datasheet is given as 0.4%/oC or 0.004/oC. The temperature coefficient, α, influences the system performance. For instance, an increase in temperature coefficient, α, reduces the system performance and efficiency. Figures 3 (b) illustrates the plot of array performance ratio (PRArray) as a function of solar cell temperature. Just like the system performance, Harlequins site shows a normal operation of the PV array at approximate97.79%andthePVarraybegantoreduceitsarrayperformanceratioasthesolarcelltemperatureincreases. The increase in temperature coefficient of power also influences the array performance and efficiency. The temperature coefficient of power is determined using the slope of Figure 3 (b). Therefore, the relationship between the array performanceratioandsolarcelltemperatureshowsthethermalbehaviourofthePVarray. yf = 0.9253yr + 0.2054 R² = 0.9959302520151050 0 10 20 30 yYield,FinalAC f (h/d) Reference Yield, yr (h/d) yA = 0.9435yr + 0.2496 R² = 0.9961302520151050 0 10 20 30 yYield,ArrayDC A (h/d) Reference Yield, yr (h/d)
LS = YA YF Equation 7
International Research Journal of Engineering and Technology (IRJET) e ISSN: 2395 0056
Figure4showsthemonthly ACsystemlosses(Ls)andDCarraycapturelosses(Lc)intheHarlequins site.The LsandLc are the systems and capture losses due to PAC and PDC as shown in Figure 1. The system losses, Ls cause the physical dissipation of power in the inverter while capture losses cause the physical dissipation of power in the PV array. The HarlequinssiteshowsthevariationofLsfromaminimumof0.02h/dinNovember2017,0.06h/dinSeptember2018,0.1 h/dinDecember2019,0.12h/dinFebruary2020and0.21inDecember2021toamaximumof0.58h/dinOctober2017, 0.43 h/d in August 2018, 0.43 h/d in June 2019, 0.43 h/d in July 2020 and 0.43 h/d in May and October 2021 while theLcof Harlequins site varies from a minimum of 0.04 h/d in December 2017, 0.01 h/d in March 2018, 0.05 h/d in January 2019, 0.05 h/d in March 2020 and 0.05 h/d in March 2021 to a maximum of 1.28 h/d in June 2017, 1.71 h/d in July2018,1.57h/dinSeptember2019,1.51h/dinMay2020and1.36h/dinMay2021.TheincreaseinLsandLcaredue toahigh [21]
solarcelltemperatureeffect
Volume: 09 Issue: 02 | Feb 2022 www.irjet.net p-ISSN: 2395-0072 2022, IRJET Impact Factor value: 7.529
Figure 3. (a) System Performance Ratio (PRSyst) versus Solar cell Temperature (Tcell) (b) Array Performance Ratio (PRArray) versus Solar cell Temperature (TCell) for hourly data from Harlequins site from 2017 2021
Figure 4. DC capture and AC system energy losses over the monitored periods (2017 2021) PRSyst = 0.0411Tcell + 95.429100959085807570 0 20 40 60 80 PRRatio,PerformanceSystem Syst (%) Solar cell Temperature, Tcell (oC) PRArray = 0.0444Tcell + 97.785100959085807570 0 20 40 60 80 PRRatio,PerformanceArray Array (%) Solar cell Temperature, Tcell (oC) 0.70.60.50.40.30.20.102.51.50.5012 1 3 5 7 9 11 13 15 17 19 21 23 25 27 29 31 33 35 37 39 41 43 45 47 49 51 53 55 57 59 (h/d)LsLoss,SystemAC(h/d)LcLoss,CaptureDC MonthDC Capture Loss, Lc AC System Loss, Ls
|
International Research Journal of Engineering and Technology (IRJET) e ISSN: 2395 0056
(a) (b)
©
| ISO 9001:2008 Certified Journal | Page511
3.4 AC System Loss (LS) and DC Array Capture Loss (LC)
Figure 6 shows the variation of inverter efficiency with the inverter output power. There is an increase in the inverter efficiency when the inverter output power increase. For instance, the maximum inverter efficiency observed in the Harlequinssiteis9821%ataninverteroutputpowerof48416W.
3.6.1.1
and
3.6
Figure5indicatesacollinearrelationshipbetweentheDCoutput(inverterinputpower)fromthePVmodulesandtheAC outputfromtheinverterasshowninFigure1.InFigure5,theslopeis1whichshowsthenormaloperationoftheinverter while the intercept is 880 W. This shows that the inverter started to generate the AC output at the DC output power (inverterinputpower)of880Wwhichsuggestsanenergyconsumptionof880Wattheiroperatingmode.This,therefore, agreeswiththefindingsofKamonpanetal[32]
International Research Journal of Engineering and Technology (IRJET) e ISSN: 2395 0056 Volume: 09 Issue: 02 | Feb 2022 www.irjet.net p-ISSN: 2395-0072 © 2022, IRJET | Impact Factor value: 7.529 | ISO 9001:2008 Certified Journal | Page512 3.5 INVERTER3.5.1PERFORMANCEInverterinput and output
Figure 5. Relationship between input power and output power of the inverter Inverter efficiency, inverter output power and inverter percentage conversion loss Inverter efficiency inverter output power
Figure 6. Inverter Efficiency versus Inverter Output Power PAC = 1PDC 880 R² = 16000050000400003000020000100000 0 10000 20000 30000 40000 50000 60000 PPower,OutputInverter AC (W) Inverter Input Power, PDC (W) 10098969492908886848280 0 10000 20000 30000 40000 (%)EfficiencyInverter Inverter Output Power (W)
| ISO
No inverter can achieve 100% efficiency. This is because when the inverter converts the DC energy from the solar PV systemtoACenergy(asshowninFigure1),someenergyislost,whichcouldbeduetothecable,PVmodule,inverteror increaseinambienttemperature.ThismeansthattheoutputorACenergy(EAC)isnotthesameastheinputorDCenergy (EDC).Thisisknownasinverterpercentageconversionlossesorinverterfailures [33]andthiscauseslargefluctuationsin thePVsystemsperformanceratios.Figure 7showsthattheinverter percentageconversionloss decreases exponentially toinverteroutputpower.
4.1 Inverter Efficiency, Ambient Temperature, and Inverter Output Power
109876543210 0 5000 10000 15000 20000 25000 30000 35000 40000 45000 (%)LossConversionPercentageInverter Inverter
International Research Journal of Engineering and Technology (IRJET) e ISSN: 2395 0056
Volume: 09 Issue: 02 | Feb 2022 www.irjet.net p-ISSN: 2395-0072 2022, IRJET Impact Factor value: 7.529 9001:2008
|
3.6.1.2 Inverter percentage conversion losses
Figure 7. Inverter Percentage Conversion Loss versus Inverter Output Power
©
Certified Journal | Page513
(W) 1009896949290888684 0 10 20 30 40 (%)EfficiencyInverter Ambient Temperature (oC)
Figure
4. ANALYSIS OF SITE PARAMETERS WITH SYSTEM PARAMETERS
Figure8indicatesthatthemaximumefficiencyoftheinverterstronglydependsontheambienttemperature.Forinstance, the Harlequins site shows the maximum inverter efficiency of 98.21% when the ambient temperature is 25.26oC (see Figure8).Itshowsadropof0.36%whentheambienttemperatureincreasesfrom25.26oCto32.00oC.Therefore,theloss encounteredduringtheconversionprocessesisduetotheincreaseinambienttemperatures. 8. Relationship between inverter efficiency and ambient temperature Power Output
706050403020100 2 3 4 5 6 7 8 (TemperaturecellSolar o C) Wind Speed (m/s) 706050403020100 2 3 4 5 6 7 8 (TemperatureAmbient o C) Wind Speed (m/s) 10009008007006005004003002001000 29.2 29.7 30.2 (kWh/mIrradiationSolar 2 ) Air Pressure (inHg) 600005000040000300002000010000029.2 29.4 29.6 29.8 30 30.2 (W)OutputPowerAC Air Pressure (inHg)
4.2 Effect of Solar cell and Ambient temperatures, Wind speed, Air pressure, Solar irradiation, and Relative humidity on the PV System Output Performance
International Research Journal of Engineering and Technology (IRJET) e ISSN: 2395 0056 Volume: 09 Issue: 02 | Feb 2022 www.irjet.net p-ISSN: 2395-0072 © 2022, IRJET | Impact Factor value: 7.529 | ISO 9001:2008 Certified Journal | Page514
Theinfluenceofwindspeed affectstheperformanceof solarcellspositivelyasitimprovestheefficiencyofthe solarcell [22].ThishelpstoreducetheinfluenceofsolarcellsandambienttemperaturesonthesolarPVmodulebythegeneration ofaironthesurfaceofthesolarPVmodulewhichbooststheperformanceofthesolarpanel.Therefore,asthewindspeed increases, the solar cell and ambient temperatures decrease, that is, solar cell and ambient temperatures are inversely proportional to windspeed. Thismeansthatincreasein windspeedpromoteshigh solarPVsystemoutput performance [23]asshowninFigures9(a b). (a) (b) Figure 9. Influence of wind speed, solar cell temperature and ambient temperature in Harlequins PV systems output performances from 2017 2021 4.3 Influence of Air Pressure and Solar Irradiation on the PV System Output Performance
4.2.1 Solar cell Temperature, Ambient Temperature and Wind Speed on PV System Performance
Figure
Influence
Air pressure is the pressure exerted by the weight of air present in the atmosphere of the earth. Air pressure increases with a decrease in altitude from the earth surface and the weight of the air is the force acting downward and which increasestowardsthesurfaceoftheearth[24].Withanincreaseinlightintensity,theperformanceofsolarcellsimproves [24]. b. 10. of air pressure and solar irradiation in Harlequins PV systems output performances from 2017 2021
a.
5.1 Effect of irradiance and solar cell temperature on Normalised output power efficiency
Figure12showstheeffectofirradianceandsolarcell temperatureonPVmoduleperformanceoutputinthehourlydata collectedfrom the Harlequins site. Figure12 (a)shows thatthereistypicallya highervalue of normalisedoutputpower efficiency, (computedusingequation8)[26]achievedwhentheirradianceisbelow1000W/m2 andFigures12(b) shows that there is a decrease in normalised output power efficiency when the solar cell temperature increase. This is becauseastheirradianceincreasesthesolarcell temperatureincrease whichthereforedecreasesthenormalisedoutput powerefficienciesasillustratedinFigure12(c). = 0.6265
Certified Journal | Page515
= × Equation 8 R²
6000050000400003000020000100000 60 70 80 90 100 (W)OutputPowerAC Relative Humidity (%) R² = 0.599810009008007006005004003002001000 60 70 80 90 100 (kWh/mIrradiationSolar 2 ) Relative Humidity (%)
4.4 Influence of Relative Humidity and Air Pressure on the PV System Output Performance
Volume: 09 Issue: 02 | Feb 2022 www.irjet.net p-ISSN: 2395-0072
Thehumidityistheamountofwatervapourmeasuredintheair.Thehumidityaffectstheperformanceofsolarcellsintwo ways: (1) due to the deposition of water droplets on the surface of the solar cells it reflects the sunlight and affects the totaloutputofthesolarcelland(2)duetotheeffectofhumidity,themetallicpartsofthesolarpanelstarttorustand that decreases the life of solar panel [25] Figures 11 (a b) shows that the relationship between the relative humidity, solar irradiation and AC power output is inversely proportional, that is, when relative humidity increases the value of solar irradiation and AC power output decreases. Therefore, this shows a very strong negative correlation between relative humidity,ACpoweroutputandsolar b.
© 2022, IRJET | Impact Factor value: 7.529 | ISO 9001:2008
a.irradiation.
International Research Journal of Engineering and Technology (IRJET) e ISSN: 2395 0056
Figure10(a)andFigure6(b)showstherelationshipbetweensolarirradiation,airpressureandACpoweroutputinthe Harlequinssite.ItcanbeseenfromFigure10(a)thatanincreaseinairpressureresultsinanincreaseinsolarirradiation, that is, solar irradiation is directly proportional to air pressure and Figure 10 (b) shows that an increase in air pressure resultsinincreasesinACpoweroutputofthePVsystem.Thismeansthattheforceactingdownwardcausesthefallingof photons of solar irradiation to increase with an increase in air pressure [24] which suddenly increases the AC power output. Therefore, air pressure measurements are very important in PV performance study because it helps to adjustair massestimates which may cause fluctuations in air pressure related to systematic changes to thesolar spectrumon the ground.
Figure 11. Influence of relative humidity and solar irradiation in Harlequins PV systems output performances from 2017 2021
5. EFFECT OF IRRADIANCE AND SOLAR CELL TEMPERATURE ON CONVERSION EFFICIENCY, FILL FACTOR AND MAXIMUM POWER OUTPUT
(a) (b) (c)
Figure 12. Effect of irradiance and module temperature on normalised output efficiencies for the monitored period of five years (2017 2021) hourly data in Harlequins site
) 0.980.960.940.920.880.91 0 20 40 60 EfficiencyPowerOutputNormalised Solar
International Research Journal of Engineering and Technology (IRJET) e ISSN: 2395 0056 Volume: 09 Issue: 02 | Feb 2022 www.irjet.net p-ISSN: 2395-0072 © 2022, IRJET | Impact Factor value: 7.529 | ISO 9001:2008 Certified Journal | Page516
Temperature (oC) R² = 0.7527706050403020100 0 200 400 600 800 1000 (TemperaturecellSolar o C) Irradiance (W/m2)
5.2 Effect of solar cell temperature and irradiance on system conversion efficiency, fill factor and maximum power output
0.980.960.940.920.880.91 0 200 400 600 800 1000 EfficiencyPowerOutputNormalised Irradiance (W/m
Figure13(a)showsthe effectof solarcell temperature andirradianceontheconversion efficiencyandfill factor(FF)in theHarlequinssite.FromFigure13(a),theconversionefficiencyofthesolarcellsdecreaseswithanincreaseinsolarcell temperature and a decrease in solar cell temperature results in more efficiency. This is caused by the reduction of FF as solarcelltemperatureandirradianceincrease.FFincreasesatirradiancelessthan500W/m2 anddecreasesatirradiance greater than 500 W/m2 [27]. Efficiency increases logarithmically for irradiance less than 400 W/m2 and it neither decreases nor increases for irradiance higher than 400 W/m2 [27]. FF is an indicator in finding the quality of PV panels. The typical FF values range is between 60% and 70% [28]. For instance, the graphs of fill factors (FF) in Figure 13 (a) showsthatthe PVpanelsperformedingood qualityfirstlyinthe rangeabove70% (ata lowsolarcell temperature)and laterbelow70%(atahighsolarcelltemperature)infiveyears.TheleastrecordedFFvaluein theHarlequinssiteacross thefiveyearsis61.3%. 2 cell
1917151311975 0 20 40 60 80 (%)EfficiencySystem Solar cell Temperature (oC) 1009080706050403020 0 20 40 60 80 (%)FactorFill Solar cell Temperature (oC) 1009080706050403020 0 200 400 600 800 1000 (%)FactorFill Irradiance (W/m2) 260255250245240235230225220 200 400 600 800 1000 (W)OutputPowerMaximum Irradiance (W/m2) 260255250245240235230225220 0 20 40 60 80 (W)OutputPowerMaximum Solar cell Temperature (oC)
From Figures 13 (b c), it can be observed that the maximum power output from the module decreases as the solar cell temperatureandirradianceincreaseandthislowerstheconversionefficiencyasseeninFigure13(a).Thismeansthatthe irradianceduringthepeaksunperioddoesnotnecessarilyleadtothePVpaneloperatingefficiently.Althoughtheincrease in irradiance increases the maximum power output, this effect was counterbalanced by the effect of the solar cell temperature which reduced the conversion efficiency. Hence, solar cell temperature can be considered a critical issue whenforecasting energygeneration.Therefore,tooptimiseand maximisesolarPV panel conversion efficiency, fill factor (FF),open circuit voltage(VOC)and short circuitcurrent (ISC)must be increased.Therefore, this behaviourofconversion efficiencywithsolarcelltemperatureagreeswiththeresultsoftheexperimentdonebyFesharakietal [29],Ameliaetal [30],Tobnaghietal[31]
Figure 13. (a c) Effect of solar cell temperature, irradiance, conversion efficiency, fill factor and maximum power output on PV system performance output
International Research Journal of Engineering and Technology (IRJET) e ISSN: 2395 0056 Volume: 09 Issue: 02 | Feb 2022 www.irjet.net p-ISSN: 2395-0072 © 2022, IRJET | Impact Factor value: 7.529 | ISO 9001:2008 Certified Journal | Page517
(a) (b) (c)
[11] R. Appels, B. Muthirayan, A. Beerten, R. Paesen, J. Driesen and J. Poortmans , "The effect of dust deposition on photovoltaicmodules,"in38thIEEEPhotovoltaicSpecialistsConference(PVSC),Austin,TX,USA,2012.
[12] R.Annie,E.RyanandK.Malay ,"WaterFreeCleaning Solution:Environmental DurabilityofElectrodynamicScreen (EDS) Films in Water Free Cleaning of Solar Collectors," in IEEE 46th Photovoltaic Specialists Conference (PVSC),
International Research Journal of Engineering and Technology (IRJET) e ISSN: 2395 0056
[5] D. Okello, F. Vorster and van Dyk E.E, "Analysis of measured and simulated performance data of a 3.2 kWp grid connectedPVsysteminPortElizabeth,SouthAfrica.,"EnergyConversionandManagement,vol.100,pp.10 15,2015.
6. CONCLUSION
References [1] C.Okorieimoh,"EnergyEfficiency,"GlobalScientific,vol.7,no.4,pp.763 775,2019.
[10] S.Gibson,"Don’tHireaCleaningCrewtoWashYourSolarPanels.Payingtohavephotovoltaicpanelscleanedwillcost morethantheextraenergyisworth,"GreenBuildingAdvisor,01August2013.
© 2022, IRJET | Impact Factor value: 7.529 | ISO 9001:2008
[9] T. Sarver , A. Al Quaraghuli and L. Kazmerski , "A comprehensive review of the impact of dust on the use of solar energy: History, investigations, results, literature, and mitigation approaches," Renewable and Sustainable Energy Reviews,vol.22,pp.698 733,2013.
Certified Journal | Page518
[3] C. Okorieimoh , B. Norton and M. Conlon, "Long Term Durability of Solar Photovoltaic Modules," in Sustainable EcologicalEngineeringDesign.Springer,Cham.,Ipswich,England,2020.
[2] B.Norton,"RenewableElectricitywhatisthetruecost?,"PowerEngineering,vol.13,pp.6 12,1999.
[6] C.Okorieimoh,B.NortonandM.Conlon,"Effectoftransientperformancechangesonphotovoltaicmodulesoutput.," 10thAnnualGRSSymposium,Dublin(Poster),2019.
[8] A. Akram, "A New Method to Reduce Soiling Effect on Performance of a Solar PV Module.," International Journal of AdvancedResearchandInnovation,vol.3,pp.601 606,2015.
The influence of site and system parameters on the performance of roof top grid connected PV systems installed in Harlequins,Belfast,NorthernIrelandhasbeeninvestigated.Thestudysawtheinfluenceofsiteandsystemparameterson thesystemperformanceoutput.Forinstance,siteparameterssuchasambienttemperature,relativehumidity,windspeed, air pressure and solar irradiation influence the PV system output performance. When the solar irradiation in the Harlequinssiteincreases,theambienttemperatureofthelocationincreases.This reducestheefficiencyofthePVoutput installed in the location. Wind speed in Harlequins site influences the PV output performance positively and negatively. For instance, an increase in wind speed reduces the ambient temperature thus promoting the PV output performance whilesuchanincreasecanincreasetherateofdustdepositiononthesurfaceofthePVpanel.Therefore,theeffectofwind speed on the PV system performance may be considered secondary because it is not often measured on the site of a PV installation [34]. When the air pressure in a site location increases, the solar irradiation in the site location tends to increase, thus increasing the PV output performance. This means that the force acting downward causes the falling of photons of solar irradiation to increase with an increase in air pressure [24] which suddenly increases the AC power output. Therefore, air pressure measurements are very important in PV performance study because it helps to adjustair massestimates which may cause fluctuations in air pressure related to systematic changes to thesolar spectrumon the ground. The presence of relative humidity in Harlequins site affects the PV output performance due to the deposition of waterdropletsonthesurfaceofthesolarcellswhichreflectsthesunlightandaffectsthetotaloutputofthesolarcell. Also, the effectofhumidity causesthe metallicpartsof the solarpanel tostart rusting,thusreducing the lifespan ofthe solar panel [35]. Therefore, an increase in relative humidity decreases the solar irradiation and power output thereby influencingthePVoutputperformance.
[7] M. Nallapaneni, M. Rohit, P. Ruth and M. Mathew, "Performance analysis of 100 kWp grid connected Si poly photovoltaicsystemusingPVsystsimulationtool.,"EnergyProcedia,vol.117,pp.180 189,2017.
[4] D.BagnallandM.Boreland,"Photovoltaictechnologies,"EnergyPolicy,vol.36,pp.4390 4396,2008.
Volume: 09 Issue: 02 | Feb 2022 www.irjet.net p-ISSN: 2395-0072
[29] V.Fesharaki,M.DehghaniandJ.Fesharaki,"TheEffectofTemperatureonPhotovoltaicCellEfficiency,"inProceedings ofthe1stInternationalConferenceonEmergingTrendsinEnergyConservation,Tehran,2011.
[26] T. a. R. C. A. S. T. E. P. (STEP), "The Effect of Irradiance and Temperature on the Performance of Photovoltaic Modules,"SustainableTechnologies,Toronto,Canada,2017.
[28] A.Amelia,Y.Irwan, W.Leow,M.Irwanto,I.Safwati andM.Zhafarina,"InvestigationoftheEffectofTemperatureon Photovoltaic (PV) Panel Output Performance," International Journal on Advanced Science Engineering Information Technology,vol.6,pp.682 688,2016.
[21] A. Ghoname and N. Hidekazu , "Techno Economic Performance Analysis of a 40.1 kWp Grid Connected Photovoltaic (GCPV)SystemafterEightYearsofEnergyGeneration:ACaseStudyforTochigi,Japan.," JournalofSustainability,vol. 13,p.7680,2021.
[25] S.Mekhilef,R.SaidurandM.Kamalisarvestani,"Effectofdust,humidityandairvelocityonefficiencyofphotovoltaic cells,"RenewableandSustainableEnergyReviews,vol.16,no.5,pp.2920 2925,2012.
[22] M. Ranjan Das, "Effect of Different Environmental Factors on Performance Solar Panel," International Journal of InnovativeTechnologyandExploringEngineering(IJITEE),vol.8,no.11,pp.15 17,2019.
[24] M. Ranjan Das, "Effect of Different Environmental Factors on Performance Solar Panel," International Journal of InnovativeTechnologyandExploringEngineering(IJITEE),vol.8,no.11,pp.15 17,2019.
[18] E. Kymakis , S. Kalykakis and T. Papazoglou , "Performance analysis of a grid connected photovoltaic park on the islandofCrete,"Energyconversionandmanagement,vol.50,pp.433 438,2009.
[14] J.Mazer,SolarCells:AnIntroductiontoCrystallinePhotovoltaicTechnology,KluwerAcademicPublishers,1996.
[19] C. Sidi, M. Ndiaye , M. Bah , A. Mbodji , A. Ndiaye and P. Ndiaye , "Performance analysis of the first large scale (15 MWp)grid connectedphotovoltaicplantinMauritania," EnergyConversionandManagement, vol.119,pp.411 421, 2016. [20] I. 61724, "Photovoltaic system performance monitoring guidelines for measurement, data exchange and analysis.," 1998.
[23] D.GoossensandK.Van,"Aeoliandustdepositiononphotovoltaicsolarcells:theeffectsofwindvelocityandairborne dustconcentrationoncellperformance,"SolarEnergy,vol.66,no.4,pp.277 289,1999.
[27] M. Cheggar, A. Hamzaoui, A. Namoda, P. Petit, M. Aillerie and A. Herguth , "Effect of Illumination Intensity on Solar CellsParameters,"EnergyProcedia,vol.36,pp.722 729,2013.
[15] L.EdsonandE.Eugene,"AssessingtheReliabilityandDegradationofPhotovoltaicModulePerformanceParameters," IEEETransactionsonReliability,vol.53,pp.83 92,2004.
[17] L. Ayompe, A. Duffy, S. McCormack and M. Conlon, "Measured performance of a 1.72 kW rooftop grid connected photovoltaicsysteminIreland,"EnergyConversionandManagement,vol.52,pp.816 825,2011.
[16] J. Lopez Garcia , A. Pozza and T. Sample , "Long term soiling silicon PV modules in a moderate subtropical climate," SolarEnergy,vol.130,pp.174 183,2016.
[13] M.Aidara,M.Ndiyae,A.Mbaye,M.SyllaandP.Ndiaye,"StudyofthePerformanceofasystemfordrycleaningdust deposited on the surface of solar photovoltaic panels," International Journal of Physical Sciences, vol. 13, pp. 16 23, 2018.
International Research Journal of Engineering and Technology (IRJET) e ISSN: 2395 0056 Volume: 09 Issue: 02 | Feb 2022 www.irjet.net p-ISSN: 2395-0072 © 2022, IRJET | Impact Factor value: 7.529 | ISO 9001:2008 Certified Journal | Page519 Chicago,IL,USA,2019.
Page
[34] W. Achim, R. Mauricio , M. David and H. Nils , "Analytical Monitoring of Grid Connected Photovoltaic Systems: Good PracticesforMonitoringandPerformanceAnalysis,"InternationalEnergyAgencyTechnicalReport,Brussels,2014.
[35] S.Mekhilef,R.SaidurandM.Kamalisarvestani,"Effectofdust,humidityandairvelocityonefficiencyofphotovoltaic cells,"RenewableandSustainableEnergyReviews,vol.16,no.5,pp.2920 2925,2012.
International Research Journal of Engineering and Technology (IRJET) e ISSN: 2395 0056 Volume: 09 Issue: 02 | Feb 2022 www.irjet.net p-ISSN: 2395-0072 © 2022, IRJET | Impact Factor value: 7.529 | ISO 9001:2008 Certified Journal | 520
[30] A.Amelia,Y.Irwan, W.Leow,M.Irwanto,I.SafwatiandM.Zhafarina,"InvestigationoftheEffectofTemperatureon Photovoltaic (PV) Panel Output Performance," International Journal on Advanced Science Engineering Information Technology,vol.6,pp.682 688,2016. [31] D. Tobnaghi , R. Madatov and D. Naderi , "The effect of temperature on electrical parameters of solar cells," International Journal of Advanced Research in Electrical, Electronics and Instrumentation Engineering, vol. 2, pp. 6404 07,2013. [32] C. Kamonpan, S. Vichit, U. Nuttakarn, K. Songkiate, S. Sasiwimon, C. Perawut, L. Amornrat, S. Jaran and S. Kobsak , "Effect of Ambient Temperature on Performance of Grid Connected Inverter Installed in Thailand," International JournalofPhotoenergy,vol.2014,pp.1 7,2014.
[33] P.Hacke,S.Lokanath,P.Williams,A.Vasan,P.Sochor,G.Tamizhamni,H.ShinoharaandS.Kurtz,"Astatusreviewof photovoltaic power conversion equipment reliability, safety, and quality assurance protocols," Renew. Sustain. EnergyRev.,vol.82,pp.1097 1112,2018.
