1 minute read
LC = YR YA Equation

from INFLUENCE OF SITE AND SYSTEM PARAMETERS ON THE PERFORMANCE OF ROOF-TOP GRID-CONNECTED PV SYSTEMS INS

International Research Journal of Engineering and Technology (IRJET) e-ISSN: 2395-0056 Volume: 09 Issue: 02 | Feb 2022 www.irjet.net p-ISSN: 2395-0072
3.5 INVERTER PERFORMANCE
Advertisement
3.5.1 Inverter input and output
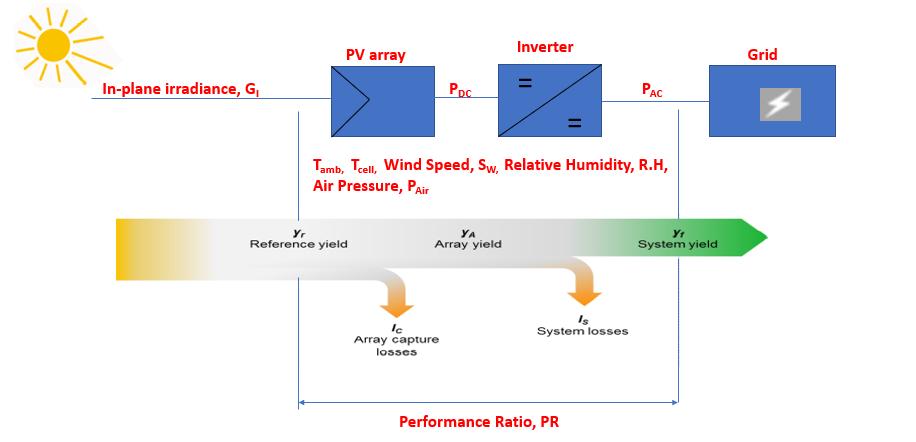
Figure 5indicates a collinear relationship between the DC output (inverter input power) from the PV modules and the AC output from the inverter as shown in Figure 1. In Figure 5, the slope is 1 which shows the normal operation of the inverter while the intercept is -880 W. This shows that the inverter started to generate the AC output at the DC output power (inverter input power) of 880W which suggests an energy consumption of 880W at their operating mode. This, therefore, agrees with the findings of Kamonpan etal [32].
60000
(W)
AC Inverter Output Power, P
50000
40000
30000
20000
10000
0
0 PAC = 1PDC
- 880 R² = 1
10000 20000 30000 40000 50000 60000 Inverter Input Power, PDC (W)
Figure 5. Relationship between input power and output power of the inverter
3.6 Inverter efficiency, inverter output power and inverter percentage conversion loss
3.6.1.1 Inverter efficiency and inverter output power
Figure 6 shows the variation of inverter efficiency with the inverter output power. There is an increase in the inverter efficiency when the inverter output power increase. For instance, the maximum inverter efficiency observed in the Harlequinssite is 98.21% at an inverter output power of 48416W.
Inverter Efficiency (%)
100 98 96 94 92 90 88 86 84 82 80
0 10000 20000 30000 40000 Inverter Output Power (W)
Figure 6. Inverter Efficiency versus Inverter Output Power