1 minute read
Equation

from INFLUENCE OF SITE AND SYSTEM PARAMETERS ON THE PERFORMANCE OF ROOF-TOP GRID-CONNECTED PV SYSTEMS INS

International Research Journal of Engineering and Technology (IRJET) e-ISSN: 2395-0056 Volume: 09 Issue: 02 | Feb 2022 www.irjet.net p-ISSN: 2395-0072
100
Advertisement
Syst System Performance Ratio, PR 95
90
85
80
75
70 PRSyst = -0.0411Tcell + 95.429
0 20 40 60 80 Solar cell Temperature, Tcell (oC)
Array Array Performance Ratio, PR 100
95
90
85
80
75
70 PRArray = -0.0444Tcell + 97.785
0 20 40 60 80 Solar cell Temperature, Tcell (oC)
(a) (b)
Figure 3. (a) System Performance Ratio (PRSyst) versus Solar cell Temperature (Tcell) (b) Array Performance Ratio (PRArray) versus Solar cell Temperature (TCell) for hourly data from Harlequins site from 2017-2021
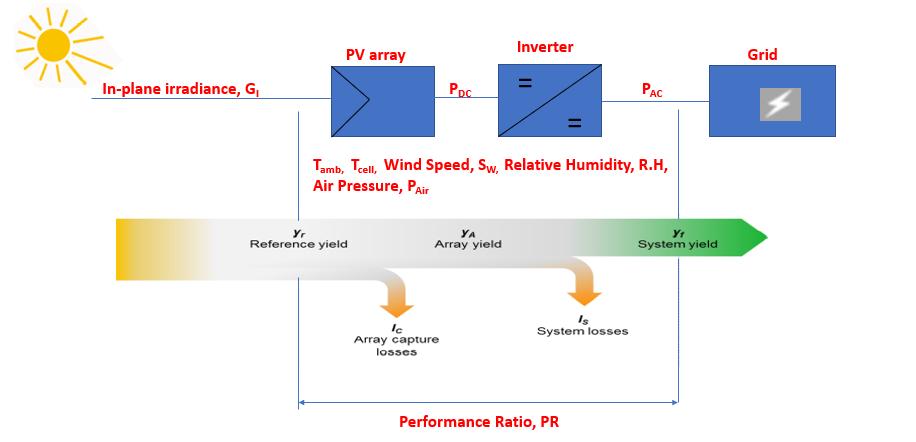
3.4 AC System Loss (LS) and DC Array Capture Loss (LC)
Figure 4 shows the monthly AC system losses (Ls) and DC array capture losses (Lc) inthe Harlequins site. The Ls and Lc are the systems and capture losses due to PAC and PDC as shown in Figure 1. The system losses, Ls cause the physical dissipation of power in the inverter while capture losses cause the physical dissipation of power in the PV array. The Harlequinssite shows the variation of Lsfrom a minimum of 0.02h/d in November2017, 0.06h/d in September2018, 0.1 h/d in December2019, 0.12h/d in February2020 and 0.21in December2021 to a maximum of 0.58h/d in October2017, 0.43 h/d in August 2018, 0.43 h/d in June 2019, 0.43 h/d in July 2020 and 0.43 h/d in May and October 2021 while theLcof Harlequins site varies from a minimum of 0.04 h/d in December 2017, 0.01 h/d in March 2018, 0.05 h/d in January 2019, 0.05 h/d in March 2020 and 0.05 h/d in March 2021 to a maximum of 1.28 h/d in June 2017, 1.71 h/d in July 2018, 1.57h/d in September2019, 1.51h/d in May2020 and 1.36h/d in May2021. The increase in Ls and Lc are due to a high solar cell temperature effect [21].
2.5 0.7
2
DC Capture Loss, Lc (h/d) 1.5
1
0.5 0.6
0.5
0.4
0.3
0.2 AC System Loss, Ls (h/d)
0.1
0
1 3 5 7 9 11 13 15 17 19 21 23 25 27 29 31 33 35 37 39 41 43 45 47 49 51 53 55 57 59
DC Capture Loss, Lc Month AC System Loss, Ls 0
Figure 4. DC capture and AC system energy losses over the monitored periods (2017-2021)